

Abstract
Breast cancer is the most common female‐specific malignancy in Taiwan and developed countries worldwide, and its incidence continues to grow. 14‐3‐3ε (YWHAE), which belong to 14‐3‐3 family, it has been reported up‐regulated in breast cancer tissues. However, the clinical implication and function of YWHAE in breast cancer remains unclear. In this study, we investigated the prognostic value of the YWHAE in human breast cancer. Immunohistochemistry was used to analyze YWHAE expression in breast cancer tissues. Cell model was applied to examine the functions of YWHAE. The chemotherapeutic agents were used to evaluate the effect of YWHAE in breast cancer cell lines. YWHAE expression was associated with tumor size, lymph node metastasis, and poor patient survival in patients with breast cancer. YWHAE overexpression significantly increased the proliferation, migration, and invasion abilities of breast cancer cells. Knockdown of YWHAE expression reduced the expression of Snail and Twist in breast cancer cells. We also found that YWHAE was responsible for the resistance of breast cancer cells to chemotherapeutic agents, and knockdown of YWHAE enhanced sensitivity to multiple chemotherapeutic agents in breast cancer cells. Taken together, our findings indicated that YWHAE promoted cancer progression and chemoresistance in breast cancer cells and can be a potential therapeutic target for breast cancer.
Keywords: 14‐3‐3ε, breast cancer, chemoresistance, YWHAE
1. INTRODUCTION
Breast cancer is a malignant tumor that severely impairs women's health.1 According to the statistics of the Ministry of Health and Welfare, since 1995, breast cancer has been the most common female‐specific malignancy in Taiwan.2 Identified risk factors for breast cancer includes old age, geographic location, a family history of breast cancer, genetic mutations, exposure to ionizing radiations, a history of a benign breast disease, high mammographic density, early menarche and late menopause, nulliparity or old age at first childbirth, exogenous hormone use, lifestyle (alcohol, diet, obesity, and physical activity), and high prolactin levels.3, 4 All the aforementioned risk factors have been associated with breast cancer; however, the operative mechanisms underlying the disease remain unclear and must be further investigated to effectively improve the prevention, treatment, and prognosis of breast cancer.5
The 14‐3‐3 proteins are highly conserved acidic proteins expressed in eukaryotic organisms.6 In mammals, the 14‐3‐3 proteins have nine isoforms, including two phosphorylated forms (α and δ) that are encoded by seven genes (β, γ, ε, ζ, η, σ, and τ6, 7;. The 14‐3‐3 proteins modulate signal transduction through the phosphorylation of serine/threonine motifs of target proteins. After binding, the 14‐3‐3 proteins regulate target proteins through several mechanisms, such as by changing the protein conformation, affecting protein activity (or stability), facilitating protein complex formation, and altering protein subcellular localization.8
The 14‐3‐3τ protein binds to p21Waf1/Cip1 (a cyclin‐dependent kinase inhibitor) and induces ubiquitin‐independent proteasomal degradation of p21, which leads to upregulated cell growth in breast cancer.9 Moreover, the overexpression of 14‐3‐3ζ enhanced cell growth and inhibited apoptosis, whereas the downregulation of 14‐3‐3ζ reduced cell growth in vitro and in vivo in breast cancer.10 Compared with normal ductal epithelial cells, 14‐3‐3ζ expression was increased in metastatic breast cancer cells.11, 12 Accumulating evidence indicates that the 14‐3‐3 proteins play a major role in breast cancer. The RNA levels of 14‐3‐3ε (YWHAE) were upregulated in breast cancer tissues and associated with poor overall and disease‐free survival in patients with breast cancer.13 YWHAE belongs to the 14‐3‐3 protein family and functions as a mitochondrial import stimulation factor L subunit.6, 14 However, the role of YWHAE in breast cancer has not been adequately evaluated.
In this study, we investigated YWHAE expression in breast cancer tissues and then conducted a clinical correlation study. Furthermore, we elucidated mechanisms underlying the involvement of YWHAE in breast cancer by performing in vitro studies.
2. MATERIALS AND METHODS
2.1. Tissue sample collection
After receiving approval from the Institutional Review Board (IRB) of Kaohsiung Medical University Hospital (KMUH) in Taiwan (IRB no: KMUHIRB‐E(II)‐20170247), we collected specimens from patients with breast cancer at KMUH from 2001 to 2011 after the signing of informed consent. The histological type and grade of the primary tumor were determined according to the World Health Organization Classification of Breast Tumors.15 Surgically treated female breast cancer patients (n = 100) with confirmed pathology of invasive ductal carcinoma were included, and their clinicopathological characteristics are summarized in Table 1. Types of surgery included partial mastectomy (39%), mastectomy (10%), and modified radical mastectomy (51%). All the patients received primary treatment by surgery followed by adjuvant radiotherapy (52%), chemotherapy (90%), or hormone therapy (60%). Chemotherapy protocols include (1) fluorouracil, epirubicin, and cyclophosphamide for six cycles or (2) docetaxel, epirubicin, and cyclophosphamide for six cycles.
Table 1.
Correlation of YWHAE expression and clinicopathological characteristics of patients with breast cancer
| YWHAE | ||||||
|---|---|---|---|---|---|---|
| Low (<60) | High (≥60) | |||||
| Variables | Item | n | % | n | % | P valuea |
| Age (y) | ≦50 | 14 | 46.7 | 37 | 52.9 | 0.570 |
| >50 | 16 | 53.3 | 33 | 47.1 | ||
| Grade | I/II | 22 | 73.3 | 56 | 80.0 | 0.461 |
| III | 8 | 26.7 | 14 | 20.0 | ||
| T status | T1 | 20 | 66.7 | 31 | 44.3 | 0.040a |
| T2/T3 | 10 | 33.3 | 39 | 55.7 | ||
| N status | N0 | 21 | 70.0 | 30 | 42.9 | 0.013a |
| N1‐N3 | 9 | 30.0 | 40 | 57.1 | ||
| M status | M0 | 30 | 100.0 | 61 | 87.1 | 0.054 |
| M1 | 0 | 0.0 | 9 | 12.9 | ||
| BMI (kg/m2) | <24 | 17 | 56.7 | 37 | 52.9 | 0.726 |
| ≧24 | 13 | 43.3 | 33 | 47.1 | ||
| ER | Negative | 14 | 46.7 | 26 | 37.1 | 0.373 |
| Positive | 16 | 53.3 | 44 | 62.9 | ||
| PR | Negative | 16 | 53.3 | 36 | 51.4 | 0.861 |
| Positive | 14 | 46.7 | 34 | 48.6 | ||
| Her2/Neu | Negative | 14 | 46.7 | 46 | 65.7 | 0.075 |
| Positive | 16 | 53.3 | 24 | 34.3 | ||
| Chemotherapy | Without | 3 | 10.0 | 7 | 10.0 | 1.000 |
| With | 27 | 90.0 | 63 | 90.0 | ||
| Radiotherapy | Without | 15 | 50.0 | 33 | 47.1 | 0.831 |
| With | 15 | 50.0 | 37 | 52.9 | ||
P values were calculated using the chi‐square test.
2.2. Immunohistochemistry
Immunohistochemistry (IHC) staining was performed using the Leica Bond‐Max automated IHC System (Leica Microsystems, Wetzlar, Germany) according to manufacturer's instructions. The primary antibody of YWHAE (GTX109090, 1:200) was purchased from Genetex (Irvine, California).
2.3. Evaluation of IHC staining
YWHAE expression was classified according to the H‐score, which is calculated as the percentage of positively stained cells multiplied by the staining intensity.16 To calculate the H‐score, the staining intensity in the cancer cell was scored as 0, 1+, 2+, or 3+ and the percentage of cells at each staining intensity level was calculated. The H‐score was assigned using the following rule: (percentage of cells stained at intensity 1+ × 1) + (percentage of cells stained at intensity 2+ × 2) + (percentage of cells stained at intensity 3+ × 3), giving a range of 0 to 300. For further statistical analysis, categories “low” and “high” expression were determined based on the receiver operating characteristic curve analysis. Patients with breast cancer were classified into two groups by using the defined scoring categories: YWHAE‐low (≤60) and YWHAE‐high (≥61). Two independent experts determined the score of each tumor specimen simultaneously and under the same conditions. For ER and PR status, scores were determined by the percentage of breast cancer cells with positive nuclear staining and were considered positive if the positive‐staining cells ≥10%, according to the American Society of Clinical Oncology/College of American Pathologists (ASCO/CAP) guidelines.17 As for Her2, the staining was scored by the criteria that assessed the intensity of membrane staining. In this study, scores 0 and 1+ were considered negative, and 2+ and 3+ were considered positive according to the HercepTest procedure (DAKO K5204).18 Our studies abided by the Reporting Recommendations for Tumor Marker Prognostic (REMARK) guideline.19
2.4. Cell lines and reagents
The breast cancer cell lines MCF‐7 and MDA‐MB‐231 were cultured in Dulbecco's modified Eagle's medium (containing 10% fetal bovine serum and 1% penicillin G/streptomycin/amphotericin B). Doxorubicin (PHR1789), 5‐fluorouracil (F6627), and paclitaxel (T7402) were purchased from Sigma (St. Louis, Missouri).
2.5. Lentiviral infection
The vector control lentiviral construct (LPP‐NEG‐Lv‐105‐025) and the YWHAE lentiviral expression construct (LPP‐I0402‐Lv105‐200‐S) were purchased from GeneCopoeia. pLKO‐0.1‐shLuc967 and shYWHAE (TRC62233 and TRC62234) lentiviral shRNAs (supernatants) were purchased from National RNAi Core Facility (Taipei, Taiwan).
2.6. Western blot analysis
Total cellular proteins were extracted using the RIPA buffer, and protein concentrations were determined using a BCA protein assay (Bio‐Rad Hercules, California). Equal amounts of protein lysates were loaded on a 10% SDS‐PAGE gel. After electrophoresis, proteins were transferred on to a PVDF membrane and blocked with 5% nonfat milk in TBST. To perform the Western blot analysis, antibodies against YWHAE (1:1000; GTX109090; Genetex), Snail (1:1000; GTX82509; Genetex), and α‐tubulin (1:10 000; GTX112141; Genetex) were used.
2.7. Growth curve assay
Cells (6000 cells/well for MDA‐MB‐231/shluc, MDA‐MB‐231/shYWHAE‐1, MDA‐MB‐231/shYWHAE‐2, MCF‐7/Vector, and MCF‐7/YWHAE) were plated in 96‐well plates and incubated at 37°C with 5% CO2 for 24 to 72 hours. To analyze the effect of YWHAE expression on chemoresistance, the growth curve of cells was determined using the 3‐(4,5‐dimethylthiazol‐2‐yl)‐2,5‐diphenyltetrazolium bromide (MTT) assay after treatment with a chemotherapeutic agent.
2.8. Cell migration and invasion assays
Cell migration and invasion abilities were determined using a transwell assay (8‐μm pores, Corning, New York). Breast cancer cells were suspended in a serum‐free medium and loaded into the transwell (upper chamber). A culture medium containing 10% FBS was added to the lower chamber of 24 wells. After 18 to 24 hours, the cells that migrated to and invaded the lower chamber were stained using crystal violet and measured under a light microscope (whole well). All experiments were performed in quadruplicate.
2.9. Statistical analysis
The chi‐square test was used to determine differences in clinicopathological characteristics between the YWHAE‐high and YWHAE‐low groups. The log‐rank test was used to evaluate the significance of differences in survival curves (generated using the Kaplan‐Meier method) between the two groups. The median follow‐up time for the patients was 49 (range 7‐111) months. Univariate and multivariate analyses were performed using the Cox regression model to investigate associations between clinicopathological characteristics and patient survival. Data are presented as the mean ± SD of three independent experiments. Differences between the two groups were determined using Student's t test. P < 0.05 was considered significant. Statistical analyses were performed using SPSS, Version 20 (Statistical Package for the Social Sciences).
3. RESULTS
3.1. High YWHAE expression in tumor tissues was associated with poor clinical outcomes in patients with breast cancer
To evaluate the role of the YWHAE protein in breast cancer, we examined 100 breast tumor samples by using the IHC assay and correlated the YWHAE expression level with the clinicopathological characteristics of patients. As depicted in Figure 1A, the YWHAE protein expression level in breast cancer tissues was classified into two groups. Tissues with scores of ≤60 were categorized as having low YWHAE expression, and tissues with scores of ≥61 were categorized as having high YWHAE expression. The results indicated a high YWHAE expression level in breast cancer tissues was significantly correlated with tumor size (T status; P = 0.04) and positive lymph node metastasis (N status; P = 0.013; Table 1). In addition, a higher YWHAE expression level was significantly correlated with lower overall survival (OS; P = 0.023) and disease‐free survival (DFS; P = 0.013) rates compared with a lower YWHAE expression level (Figure 1B).
Figure 1.

YWHAE was overexpressed in breast cancer tissues and correlated with poor patient survival. A, YWHAE expression in breast cancer tissues and normal tissues. B, Kaplan‐Meier survival curves for OS and DFS in patients with breast cancer according to YWHAE expression as determined using IHC assays
Next, we evaluated risk factors associated with patients with breast cancer. Hazard ratios were calculated using univariate and multivariate Cox regression (Tables 2 and 3). By performing univariate and multivariate analyses of DFS and OS, we determined that YWHAE expression was a significant predictor of outcomes in patients with breast cancer (Tables 2 and 3).
Table 2.
Univariate and multivariate analyses of disease‐free survival of patients with breast cancer
| Variables | Item | Univariate | Multivariable | ||||
|---|---|---|---|---|---|---|---|
| Hazard rate ratio | 95% confidence interval | P‐value | Hazard rate ratio | 95% confidence interval | P‐value | ||
| Age (y) | >50 | 1.20 | (0.53,2.72) | 0.666 | ‐ | ‐ | ‐ |
| ≦50 | 1.00 | ‐ | |||||
| Grade | III | 0.67 | (0.23,1.98) | 0.473 | ‐ | ‐ | ‐ |
| I/II | 1.00 | ‐ | |||||
| T status | T2/T3 | 1.26 | (0.56,2.86) | 0.580 | ‐ | ‐ | ‐ |
| T1 | 1.00 | ‐ | |||||
| N status | N1‐N3 | 1.05 | (0.46,2.40) | 0.900 | ‐ | ‐ | ‐ |
| N0 | 1.00 | ‐ | |||||
| M status | M1 | 2.83 | (1.05,7.64) | 0.040a | 1.44 | (0.50,4.15) | 0.495 |
| M0 | 1.00 | 1.00 | |||||
| BMI (kg/m2) | ≧24 | 0.55 | (0.23,1.30) | 0.172 | ‐ | ‐ | ‐ |
| <24 | 1.00 | ‐ | |||||
| ER | Positive | 0.97 | (0.79,1.204) | 0.797 | ‐ | ‐ | ‐ |
| Negative | 1.00 | ‐ | |||||
| PR | Positive | 0.89 | (0.72,1.09) | 0.264 | ‐ | ‐ | ‐ |
| Negative | 1.00 | ‐ | |||||
| Her2/Neu | Positive | 0.68 | (0.28,1.66) | 0.398 | ‐ | ‐ | ‐ |
| Negative | 1.00 | ‐ | |||||
| Radiotherapy | Yes | 0.86 | (0.38,1.96) | 0.727 | ‐ | ‐ | ‐ |
| No | 1.00 | ‐ | |||||
| Chemotherapy | Yes | 0.23 | (0.09,0.56) | 0.002a | 0.22 | (0.08,0.58) | 0.002 |
| No | 1.00 | 1.00 | |||||
| YWHAE | High | 4.14 | (1.22,13.99) | 0.022a | 4.16 | (1.19,14.57) | 0.026 |
| Low | 1.00 | 1.00 | |||||
Note. ‐, not applicable; CI, confidence interval; HR, hazard ratio.
Variables with P < 0.05 were included in multivariable analysis.
Table 3.
Univariate and multivariate analyses of overall survival of patients with breast cancer
| Variables | Item | Univariate | Multivariable | ||||
|---|---|---|---|---|---|---|---|
| Hazard rate ratio | 95% confidence interval | P‐value | Hazard rate ratio | 95% confidence interval | P‐value | ||
| Age (y) | >50 | 0.94 | (0.40,2.22) | 0.894 | ‐ | ‐ | ‐ |
| ≤50 | 1.00 | ‐ | |||||
| Grade | III | 0.77 | (0.26,2.30) | 0.641 | ‐ | ‐ | ‐ |
| I/II | 1.00 | ‐ | |||||
| T status | T2/T3 | 1.01 | (0.43,2.39) | 0.981 | ‐ | ‐ | ‐ |
| T1 | 1.00 | ‐ | |||||
| N status | N1‐N3 | 1.07 | (0.45,2.52) | 0.885 | ‐ | ‐ | ‐ |
| N0 | 1.00 | ‐ | |||||
| M status | M1 | 3.32 | (1.21,9.07) | 0.019a | 2.27 | (0.80,6.44) | 0.125 |
| M0 | 1.00 | 1.00 | |||||
| BMI (kg/m2) | ≧24 | 0.37 | (0.15,0.97) | 0.042a | 0.32 | (0.12,0.84) | 0.021 |
| <24 | 1.00 | 1.00 | |||||
| ER | Positive | 0.92 | (0.74,1.14) | 0.458 | ‐ | ‐ | ‐ |
| Negative | 1.00 | ‐ | |||||
| PR | Positive | 0.88 | (0.71,1.10) | 0.250 | ‐ | ‐ | ‐ |
| Negative | 1.00 | ‐ | |||||
| Her2/Neu | Positive | 0.60 | (0.23,1.54) | 0.285 | ‐ | ‐ | ‐ |
| Negative | 1.00 | ‐ | |||||
| Radiotherapy | Yes | 0.88 | (0.37,2.07) | 0.762 | ‐ | ‐ | ‐ |
| No | 1.00 | ‐ | |||||
| Chemotherapy | Yes | 0.29 | (0.11,0.78) | 0.015a | 0.31 | (0.11,0.85) | 0.023 |
| No | 1.00 | 1.00 | |||||
| YWHAE | High | 3.75 | (1.10,12.79) | 0.035a | 3.96 | (1.11,14.11) | 0.034 |
| Low | 1.00 | 1.00 | |||||
Note. ‐, not applicable; CI, confidence interval; HR, hazard ratio.
Variables with P < 0.05 were included in multivariable analysis.
3.2. Upregulation of YWHAE expression enhanced proliferation of breast cancer cells
According to our analysis of clinical data, we found that YWHAE expression was positively correlated with tumor size (Table 1). Therefore, we evaluated the effect of YWHAE on the proliferation of breast cancer cells. YWHAE expression was knocked down in MDA‐MB‐231 breast cancer cells. The knockdown of YWHAE significantly reduced the proliferative ability of MDA‐MB‐231 cells compared with shluc control cells (Figure 2A). By contrast, YWHAE overexpression in MCF‐7 cells significantly enhanced their proliferative ability compared with control cells (Figure 2B).
Figure 2.
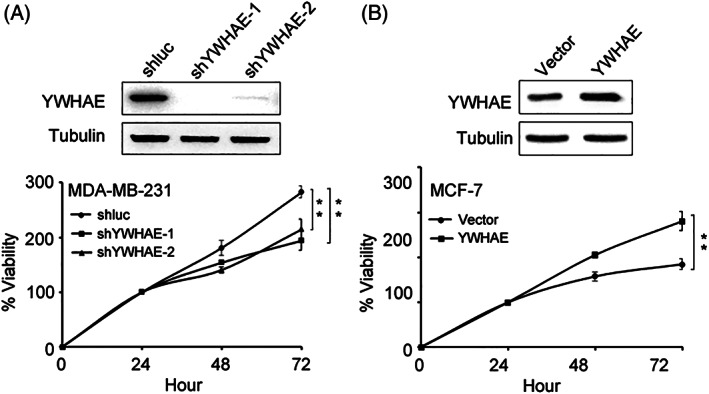
Effect of YWHAE expression on proliferation of breast cancer cells. A, effect of YWHAE knockdown on proliferation of MDA‐MB‐231 breast cancer cells. Top, Western blot analysis of YWHAE expression after infection with shRNA. Bottom, viability of MDA‐MB‐231 cells after infection with shluc or shYWHAE. B, effect of YWHAE overexpression on proliferation of MCF‐7 breast cancer cells. Top, Western blot analysis of YWHAE expression in MCF‐7 cells overexpressing YWHAE. Bottom, viability of MCF‐7 cells overexpressing YWHAE. Statistical significance was determined using Student's t test. **, P < 0.01
3.3. YWHAE knockdown reduced invasion and migration of breast cancer cells
According to the analysis of clinical data, we determined that YWHAE expression was positively associated with lymph node metastasis in patients with breast cancer (Table 1). The knockdown of YWHAE expression in MDA‐MB‐231 and Hs578T breast cancer cells significantly reduced the migration and invasion abilities of these cells compared with shluc control cells (Figure 3A). By contrast, YWHAE overexpression in MCF‐7 cells significantly enhanced their migration and invasion abilities compared with control cells (Figure 3B). Furthermore, YWHAE expression is associated with the epithelial‐mesenchymal transition (EMT).20 Our results demonstrated that the expression of Snail and Twist was significantly downregulated in YWHAE‐knocked‐down breast cancer cells (Figure 3C).
Figure 3.
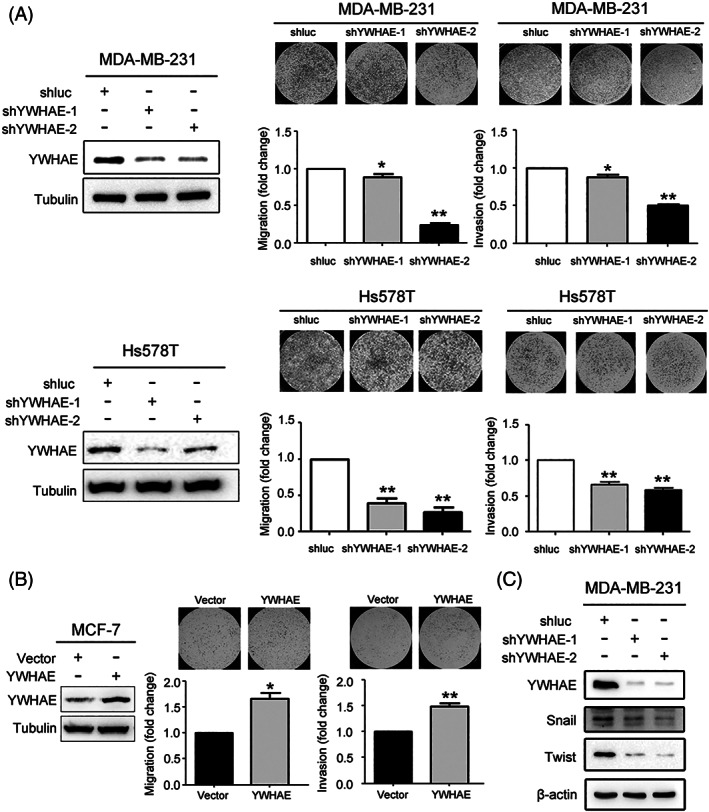
YWHAE downregulation reduced migration and invasion abilities of breast cancer cells. A, Effect of YWHAE knockdown on migration and invasion of MDA‐MB‐231 cells (Top) and Hs578T (Bottom) breast cancer cells. Right, Western blot analysis of YWHAE expression in YWHAE‐knocked‐down cells and shluc control cells. Left, migration and invasion abilities of breast cancer cells after YWHAE knockdown. All data are presented as the mean ± SD, and statistical significance was determined using Student's t test. *, P < 0.05; **, P < 0.01. B, effect of YWHAE overexpression on migration and invasion potential of MCF‐7 breast cancer cells. Right, Western blot analysis of YWHAE expression after YWHAE overexpression. Bottom, migration and invasion abilities of MCF‐7 cells after YWHAE overexpression. All data are presented as the mean ± SD, and statistical significance was determined using Student's t test. *, P < 0.05; **, P < 0.01. C, Expression of YWHAE and snail and twist expression in MDA‐MB‐231 cells following YWHAE knockdown and compared with the shluc control
3.4. Knockdown of YWHAE increased chemosensitivity in breast cancer cells
To investigate whether YWHAE expression correlated with chemotherapeutic drug resistance in human breast cancer cells, we knocked down YWHAE expression in MDA‐MB‐231 and Hs578T breast cancer cells. The MTT assay results indicated decreased cell viability after treatment with doxorubicin, 5‐fluorouracil, and paclitaxel in YWHAE‐knocked‐down cells compared with shluc control cells (Figure 4A). By contrast, YWHAE overexpression in MCF‐7 cells significantly increased their viability compared with control cells (Figure 4B). In addition, we investigated the association of YWHAE expression in breast cancer tissues with patients' response to chemotherapy. As presented in Figure 4C, the findings of the survival analysis revealed that compared with low YWHAE expression, high YWHAE expression in breast cancer tissues was associated with shorter DFS in patients treated with chemotherapy (P = 0.007). Also, TCGA and METABRIC datasets showed that expression of YWHAE was not correlated with poor survival in breast cancer patients without chemotherapy treatment (Figure S1).
Figure 4.
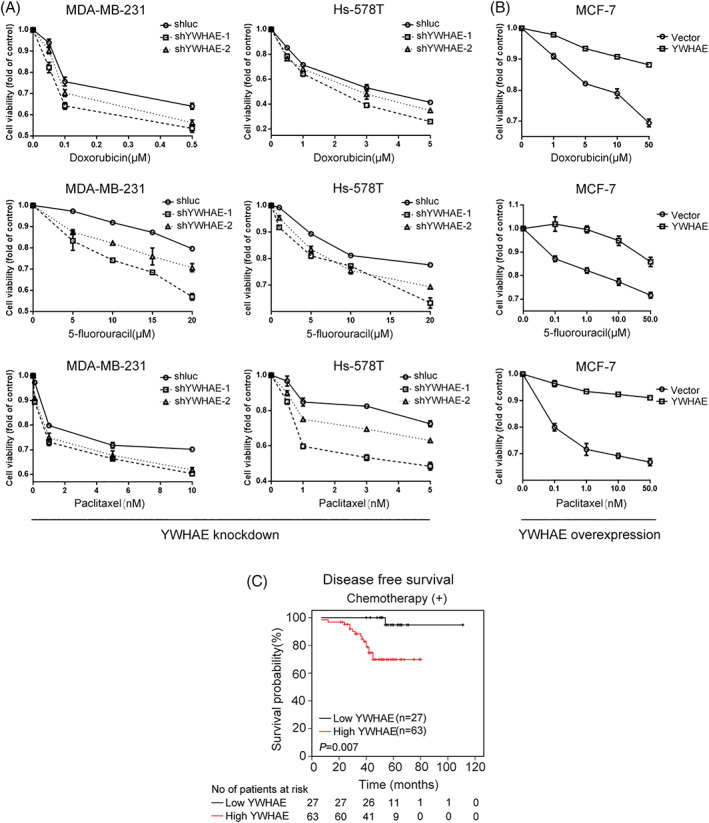
YWHAE knockdown increased the sensitivity of breast cancer cells to chemotherapeutic agents. A, enhanced sensitivity of MDA‐MB‐231 (left) and HS‐578T (right) cells to doxorubicin (top), 5‐fluorouracil (middle), and paclitaxel (bottom) after YWHAE knockdown. B, Overexpression of YWHAE caused resistance to doxorubicin (top), 5‐fluorouracil (middle), and paclitaxel (bottom) in MCF‐7 cells. C, DFS of low YWHAE group vs high YWHAE group with chemotherapy (n = 90)
4. DISCUSSION
High YWHAE expression has been reported in various types of cancer, including lung, vulvar, thyroid, and liver cancers.21, 22, 23, 24 Although the RNA and protein levels of YWHAE have been reported to be upregulated in breast cancer tissues and highly metastatic breast cancer cell lines, respectively,13, 25 the role of the YWHAE protein in breast cancer has been inadequately evaluated. In this study, we evaluated YWHAE protein expression in breast cancer tissues and determined that high YWHAE expression was a risk factor for poor prognosis. High YWHAE expression was associated with poor OS and DFS in patients with breast cancer, which suggests that YWHAE plays a major role in the progression of breast cancer. Furthermore, this is the first study to demonstrate that YWHAE affected treatment response to chemotherapeutic agents; thus, YWHAE should be considered a potential target for enhancing chemosensitivity in breast cancer treatment.
Various 14‐3‐3 protein isoforms play major roles in cancer progression; for example, 14‐3‐3τ overexpression enhanced cancer cell growth, and 14‐3‐3β promoted tumor transformation in nude mice.26, 27 Our data demonstrated that YWHAE knockdown inhibited cell growth and increased chemosensitivity in MDA‐MB‐231 breast cancer cells, which had relatively higher YWHAE expression compared with MCF‐7 cells (Figures 2A and 4A). By contrast, YWHAE overexpression increased cell growth and caused chemoresistance in MCF‐7 breast cancer cells (Figures 2B and 4B). Furthermore, high YWHAE expression was associated with shorter DFS in patients with breast cancer after chemotherapy (Figure 4C). These findings suggest that the YWHAE protein can be developed as a novel drug target for breast cancer treatment.
The results of this study revealed that YWHAE knockdown inhibited invasion and migration activity in vitro, whereas YWHAE overexpression enhanced invasion and migration activity in breast cancer cells (Figure 3A,B). The knockdown of YWHAE significantly reduced the expression of Snail and Twist in MDA‐MB‐231 cells (Figure 3C). Consistent with our results, Tzu‐An et al. reported that the overexpression of YWHAE enhanced the migration activity in hepatocellular carcinoma cells through upregulating the EMT markers Snail and Twist, whereas the knockdown of Snail inhibited the migration activity in these cells with an overexpression of YWHAE.20 High YWHAE expression was correlated with poor survival in hepatocellular carcinoma.22 YWHAE is upregulated in several types of cancers but is downregulated in lung, larynx, and gastric cancers.28, 29, 30 In gastric cancer, YWHAE acted as a tumor suppressor—its silencing induced cell proliferation, migration, and invasion through the upregulation of CDC25B and MYC.31 Depending on the histological type of cancer, YWHAE may play versatile roles in cancer progression.
One study determined that treatment with a nonsteroidal anti‐inflammatory drug caused apoptosis in colorectal cancer cells through the suppression of YWHAE expression.32 YWHAE activated NF‐κB in hepatocellular carcinoma, causing upregulation of the focal adhesion kinase.33 In this study, we observed that YWHAE overexpression in MCF‐7 cells increased their proliferation activity. By contrast, the knockdown of YWHAE reduced cell proliferation activity in MDA‐MB‐231 cells. However, the effect of YWHAE expression on cell proliferation was not associated with cell cycle progression in MDA‐MB‐231 breast cancer cells (data not shown).
The 14‐3‐3 protein isoforms can form homodimers, heterodimers, or phosphorylated forms and thereby become functional characteristics of 14‐3‐3 proteins.34 Deregulation of 14‐3‐3 protein dimerization or expression activates targeted pathways that contribute to cancer development.12, 34, 35 One study reported that genetic fusion between YWHAE and FAM22A/A in endometrial stromal sarcoma was associated with histologically high‐grade cancer and clinically aggressive behavior.36 Although our results showed that upregulated YWHAE expression significantly increased both the cell growth and migration and invasion abilities of breast cancer cells, we cannot dismiss the possibility that gene fusion of YWHAE and other genes plays a role in breast cancer.
In conclusion, this is the first study to investigate how the YWHAE protein promotes the cell growth, migration, and invasion abilities of, as well as chemoresistance in, breast cancer cells in vitro, in vivo, and in a clinical setting. Future studies are necessary to substantiate the potential for applying YWHAE as a therapeutic target of and prognostic factor for breast cancer.
CONFLICT OF INTEREST
All authors declare no conflict of interest.
Supporting information
Supplementary Figure 1 (related to Figure 4). Kaplan‐Meier analysis effect of YWHAE expression on overall survival using TCGA (A) and METABRIC (B) datasets in breast cancer patients without chemotherapy treatment
ACKNOWLEDGMENT
The authors thank Center for Resources and Development of K.M.U for their support in TissueFAXS and the Ministry of Education for Center For Intelligent Drug Systems and Smart Bio‐devices (IDS2B) from The Featured Areas Research Center Program within the framework of the Higher Education Sprout Project.
Yang Y‐F, Lee Y‐C, Wang Y‐Y, Wang C‐H, Hou M‐F, Yuan S‐SF. YWHAE promotes proliferation, metastasis, and chemoresistance in breast cancer cells. Kaohsiung J Med Sci. 2019;35:408–416. 10.1002/kjm2.12075
Funding information Kaohsiung Medical University Hospital, Grant/Award Numbers: KMUH106‐6R41, KMUH106‐6R83; Kaohsiung Medical University, Grant/Award Number: KMU‐Q107010; Ministry of Science and Technology, Taiwan, Grant/Award Number: 106‐2314‐B‐037‐043
REFERENCES
- 1. DeSantis C, Ma J, Bryan L, Jemal A. Breast cancer statistics, 2013. CA Cancer J Clin. 2014;64(1):52–62. [DOI] [PubMed] [Google Scholar]
- 2. Ho ML, Hsiao YH, Su SY, Chou MC, Liaw YP. Mortality of breast cancer in Taiwan, 1971‐2010: Temporal changes and an age‐period‐cohort analysis. J Obstet Gynaecol. 2015;35(1):60–63. [DOI] [PMC free article] [PubMed] [Google Scholar]
- 3. Collaborative Group on Hormonal Factors in Breast C . Familial breast cancer: Collaborative reanalysis of individual data from 52 epidemiological studies including 58,209 women with breast cancer and 101,986 women without the disease. Lancet. 2001;358(9291):1389–1399. [DOI] [PubMed] [Google Scholar]
- 4. Dumitrescu RG, Cotarla I. Understanding breast cancer risk—where do we stand in 2005? J Cell Mol Med. 2005;9(1):208–221. [DOI] [PMC free article] [PubMed] [Google Scholar]
- 5. van Verschuer VM, Maijers MC, van Deurzen CH, Koppert LB. Oncological safety of prophylactic breast surgery: Skin‐sparing and nipple‐sparing versus total mastectomy. Gland Surg. 2015;4(6):467–475. [DOI] [PMC free article] [PubMed] [Google Scholar]
- 6. Aitken A. 14‐3‐3 proteins: A historic overview. Semin Cancer Biol. 2006;16(3):162–172. [DOI] [PubMed] [Google Scholar]
- 7. Fu H, Subramanian RR, Masters SC. 14‐3‐3 proteins: Structure, function, and regulation. Annu Rev Pharmacol Toxicol. 2000;40:617–647. [DOI] [PubMed] [Google Scholar]
- 8. Chaudhri M, Scarabel M, Aitken A. Mammalian and yeast 14‐3‐3 isoforms form distinct patterns of dimers in vivo. Biochem Biophys Res Commun. 2003;300(3):679–685. [DOI] [PubMed] [Google Scholar]
- 9. Wang B, Liu K, Lin HY, Bellam N, Ling S, Lin WC. 14‐3‐3Tau regulates ubiquitin‐independent proteasomal degradation of p21, a novel mechanism of p21 downregulation in breast cancer. Mol Cell Biol. 2010;30(6):1508–1527. [DOI] [PMC free article] [PubMed] [Google Scholar]
- 10. Neal CL, Yao J, Yang W, Zhou X, Nguyen NT, Lu J, et al. 14‐3‐3zeta overexpression defines high risk for breast cancer recurrence and promotes cancer cell survival. Cancer Res. 2009;69(8):3425–3432. [DOI] [PMC free article] [PubMed] [Google Scholar]
- 11. Zang L, Palmer Toy D, Hancock WS, Sgroi DC, Karger BL. Proteomic analysis of ductal carcinoma of the breast using laser capture microdissection, LC‐MS, and 16O/18O isotopic labeling. J Proteome Res. 2004;3(3):604–612. [DOI] [PubMed] [Google Scholar]
- 12. Neal CL, Yu D. 14‐3‐3zeta as a prognostic marker and therapeutic target for cancer. Expert Opin Ther Targets. 2010;14(12):1343–1354. [DOI] [PMC free article] [PubMed] [Google Scholar]
- 13. Cimino D, Fuso L, Sfiligoi C, Biglia N, Ponzone R, Maggiorotto F, et al. Identification of new genes associated with breast cancer progression by gene expression analysis of predefined sets of neoplastic tissues. Int J Cancer. 2008;123(6):1327–1338. [DOI] [PubMed] [Google Scholar]
- 14. Wang W, Shakes DC. Molecular evolution of the 14‐3‐3 protein family. J Mol Evol. 1996;43(4):384–398. [DOI] [PubMed] [Google Scholar]
- 15. The World Health Organization . Histological typing of breast tumors. Neoplasma. 1983;30(1):113–123. [PubMed] [Google Scholar]
- 16. Hirsch FR, Varella‐Garcia M, Bunn PA Jr, Di Maria MV, Veve R, Bremmes RM, et al. Epidermal growth factor receptor in non‐small‐cell lung carcinomas: Correlation between gene copy number and protein expression and impact on prognosis. J Clin Oncol. 2003;21(20):3798–3807. [DOI] [PubMed] [Google Scholar]
- 17. Hammond ME, Hayes DF, Dowsett M, Allred DC, Hagerty KL, Badve S, et al. American Society of Clinical Oncology/college of American pathologists guideline recommendations for immunohistochemical testing of estrogen and progesterone receptors in breast cancer. J Clin Oncol. 2010;28(16):2784–2795. [DOI] [PMC free article] [PubMed] [Google Scholar]
- 18. Wolff AC, Hammond ME, Hicks DG, Dowsett M, McShane LM, Allison KH, et al. Recommendations for human epidermal growth factor receptor 2 testing in breast cancer: American Society of Clinical Oncology/College of American Pathologists clinical practice guideline update. Arch Pathol Lab Med. 2014;138(2):241–256. [DOI] [PMC free article] [PubMed] [Google Scholar]
- 19. Sauerbrei W, Taube SE, McShane LM, Cavenagh MM, Altman DG. Reporting recommendations for tumor marker prognostic studies (REMARK): An abridged explanation and elaboration. J Natl Cancer Inst. 2018;110(8):803–811. [DOI] [PMC free article] [PubMed] [Google Scholar]
- 20. Liu TA, Jan YJ, Ko BS, Liang SM, Chen SC, Wang J, et al. 14‐3‐3epsilon overexpression contributes to epithelial‐mesenchymal transition of hepatocellular carcinoma. PLoS One. 2013;8(3):e57968. [DOI] [PMC free article] [PubMed] [Google Scholar]
- 21. Qi W, Liu X, Qiao D, Martinez JD. Isoform‐specific expression of 14‐3‐3 proteins in human lung cancer tissues. Int J Cancer. 2005;113(3):359–363. [DOI] [PubMed] [Google Scholar]
- 22. Ko BS, Chang TC, Hsu C, Chen YC, Shen TL, Chen SC, et al. Overexpression of 14‐3‐3epsilon predicts tumour metastasis and poor survival in hepatocellular carcinoma. Histopathology. 2011;58(5):705–711. [DOI] [PubMed] [Google Scholar]
- 23. Wang Z, Nesland JM, Suo Z, Trope CG, Holm R. The prognostic value of 14‐3‐3 isoforms in vulvar squamous cell carcinoma cases: 14‐3‐3beta and epsilon are independent prognostic factors for these tumors. PLoS One. 2011;6(9):e24843. [DOI] [PMC free article] [PubMed] [Google Scholar]
- 24. Sofiadis A, Becker S, Hellman U, Hultin‐Rosenberg L, Dinets A, Hulchiy M, et al. Proteomic profiling of follicular and papillary thyroid tumors. Eur J Endocrinol. 2012;166(4):657–667. [DOI] [PMC free article] [PubMed] [Google Scholar]
- 25. Li DQ, Wang L, Fei F, Hou YF, Luo JM, Wei C, et al. Identification of breast cancer metastasis‐associated proteins in an isogenic tumor metastasis model using two‐dimensional gel electrophoresis and liquid chromatography‐ion trap‐mass spectrometry. Proteomics. 2006;6(11):3352–3368. [DOI] [PubMed] [Google Scholar]
- 26. Takihara Y, Matsuda Y, Hara J. Role of the beta isoform of 14‐3‐3 proteins in cellular proliferation and oncogenic transformation. Carcinogenesis. 2000;21(11):2073–2077. [DOI] [PubMed] [Google Scholar]
- 27. Martin D, Brown‐Luedi M, Chiquet‐Ehrismann R. Tenascin‐C signaling through induction of 14‐3‐3 tau. J Cell Biol. 2003;160(2):171–175. [DOI] [PMC free article] [PubMed] [Google Scholar]
- 28. Konishi H, Nakagawa T, Harano T, Mizuno K, Saito H, Masuda A, et al. Identification of frequent G(2) checkpoint impairment and a homozygous deletion of 14‐3‐3epsilon at 17p13.3 in small cell lung cancers. Cancer Res. 2002;62(1):271–276. [PubMed] [Google Scholar]
- 29. Che XH, Chen H, Xu ZM, Shang C, Sun KL, Fu WN. 14‐3‐3epsilon contributes to tumour suppression in laryngeal carcinoma by affecting apoptosis and invasion. BMC Cancer. 2010;10:306. [DOI] [PMC free article] [PubMed] [Google Scholar]
- 30. Leal MF, Calcagno DQ, Demachki S, Assumpcao PP, Chammas R, Burbano RR, et al. Clinical implication of 14‐3‐3 epsilon expression in gastric cancer. World J Gastroenterol. 2012;18(13):1531–1537. [DOI] [PMC free article] [PubMed] [Google Scholar]
- 31. Leal MF, Ribeiro HF, Rey JA, Pinto GR, Smith MC, Moreira‐Nunes CA, et al. YWHAE silencing induces cell proliferation, invasion and migration through the up‐regulation of CDC25B and MYC in gastric cancer cells: New insights about YWHAE role in the tumor development and metastasis process. Oncotarget. 2016;7(51):85393–85410. [DOI] [PMC free article] [PubMed] [Google Scholar]
- 32. Liou JY, Ghelani D, Yeh S, Wu KK. Nonsteroidal anti‐inflammatory drugs induce colorectal cancer cell apoptosis by suppressing 14‐3‐3epsilon. Cancer Res. 2007;67(7):3185–3191. [DOI] [PubMed] [Google Scholar]
- 33. Ko BS, Jan YJ, Chang TC, Liang SM, Chen SC, Liu TA, et al. Upregulation of focal adhesion kinase by 14‐3‐3epsilon via NFkappaB activation in hepatocellular carcinoma. Anticancer Agents Med Chem. 2013;13(4):555–562. [DOI] [PubMed] [Google Scholar]
- 34. Aitken A. Functional specificity in 14‐3‐3 isoform interactions through dimer formation and phosphorylation. Chromosome location of mammalian isoforms and variants. Plant Mol Biol. 2002;50(6):993–1010. [DOI] [PubMed] [Google Scholar]
- 35. Shen YH, Godlewski J, Bronisz A, Zhu J, Comb MJ, Avruch J, et al. Significance of 14‐3‐3 self‐dimerization for phosphorylation‐dependent target binding. Mol Biol Cell. 2003;14(11):4721–4733. [DOI] [PMC free article] [PubMed] [Google Scholar]
- 36. Lee CH, Marino‐Enriquez A, Ou W, Zhu M, Ali RH, Chiang S, et al. The clinicopathologic features of YWHAE‐FAM22 endometrial stromal sarcomas: A histologically high‐grade and clinically aggressive tumor. Am J Surg Pathol. 2012;36(5):641–653. [DOI] [PubMed] [Google Scholar]
Associated Data
This section collects any data citations, data availability statements, or supplementary materials included in this article.
Supplementary Materials
Supplementary Figure 1 (related to Figure 4). Kaplan‐Meier analysis effect of YWHAE expression on overall survival using TCGA (A) and METABRIC (B) datasets in breast cancer patients without chemotherapy treatment