Abstract
Estrogens, which have been strongly implicated in the development of breast cancer, enhance proliferation of mammary epithelial cells and, importantly, estrogen receptor (ER)-positive breast cancer cells. In the absence of serum growth factors, the ER-positive MCF-7 breast cancer cell line undergoes apoptosis. Estrogens, most commonly 17-β-estradiol (E2), can suppress apoptosis in MCF-7 cells deprived of serum. While E2 stimulated a short-term transient increase in Myc expression, E2 stimulated a sustained increase in Myc expression that was detectable at 48 h and pronounced at 5 days, the point where increased proliferation of MCF-7 cells in the absence of serum could be detected. The delayed increase in Myc expression was not dependent upon transcription of the Myc gene. Suppression of Myc expression reversed the survival effects of E2. The Myc-dependent survival signal generated by E2 was dependent upon basal levels of mTOR (mammalian target of rapamycin) and two upstream regulators of mTOR, phosphatidylinositol 3-kinase and phospholipase D (PLD). Stable elevated expression of PLD2 also increased Myc expression and provided a Myc-dependent survival signal in the absence of E2. These data provide evidence that E2 promotes survival signals in breast cancer cells through an mTOR-dependent increase in Myc expression. The data also suggest that elevated PLD expression, which is common in breast cancer, confers E2 independence.
A role for estrogens in the development of breast cancer has been indicated for over a century. It was demonstrated in 1896 that breast cancer remission could be induced by removal of the ovaries in a subset of breast cancer patients (3). Although not originally understood, the observed effects were the result of eliminating the primary source of estrogen in premenopausal woman. The effectiveness of antiestrogen therapies such as tamoxifen and aromatase inhibitors in the prevention of breast cancer (22, 23) also supports a critical role for estrogens in the promotion of breast cancer. The very low incidence of breast cancer in men is also consistent with a role for estrogens.
The role that estrogens, predominantly 17-β-estradiol (E2), play in the development of breast cancer is largely that of a tumor promoter, i.e., a substance that does not directly lead to the mutations that convert a normal cell to a cancerous one. Tumor promoters typically stimulate the proliferation of cells that have acquired an activating mutation that facilitates the amplification of these “initiated” cells (18). One component of tumor promotion is the suppression of default apoptotic programs that are activated in cells with inappropriate growth signals or damaged genomes (17). In this regard, it is of significance that E2 has been shown to suppress apoptosis in the estrogen receptor (ER)-positive breast cancer cell line MCF-7 (1, 12, 20, 35).
Breast epithelial cells typically express the ER in 15 to 25% of the cells of normal resting breast epithelia, whereas most (70%) breast cancers are ER positive (2). These data indicate that in the development of breast cancer there is a selection for breast epithelial cells that express the ER. The apparent selection of ER-positive breast epithelial cells in breast cancer further implicates estrogen in the development of breast cancer. Interestingly, most breast cancer cell lines are ER negative, indicating that the selection of breast cancer cell lines in culture involves the loss of estrogen responsiveness, a hallmark of poor prognosis in breast cancer (34). Thus, while breast cancers are still dependent upon estrogen, the tumors remain less aggressive. Gaining estrogen independence apparently provides a means for a tumor to become more aggressive.
The ability to gain independence from estrogen likely involves the activation of signals that lead to the suppression of apoptosis that was provided by estrogen. A candidate for replacing the estrogen-dependent suppression of apoptosis is phospholipase D (PLD), which is commonly elevated in breast cancer tissues (28, 36) and in breast cancer cell lines (6, 40). PLD was also shown to provide a survival signal in the ER-negative breast cancer cell line MDA-MB-231 (7, 40). PLD cooperates with tyrosine kinases to transform rat fibroblasts (19, 24, 27), suppresses apoptosis induced by high-intensity Raf signaling (25), and prevents upregulation of the tumor suppressor p53 (21). Thus, PLD is a good candidate oncogene in cancers where elevated tyrosine kinase signaling is common, such as breast cancer. Elevated expression of tyrosine kinases such as the epidermal growth factor (EGF) receptor, Her2/Neu, and c-Src are commonly observed in breast cancer (4). These studies suggest that elevated PLD activity in breast cancer could provide survival signals that could allow an emerging breast cancer to progress to estrogen independence. Consistent with the hypothesis that PLD could generate survival signals, phosphatidic acid, the metabolite of PLD activity, has been shown to target mTOR (6, 10, 11), which has long been implicated as a signal that suppresses apoptosis and promotes survival (14, 32, 37).
In this study, we have investigated the ability of E2 to suppress apoptosis in the ER-positive MCF-7 human breast cancer cell line. We provide evidence that an mTOR- and PLD-dependent activation of Myc is necessary for the suppression of apoptosis by E2 and that elevated PLD activity in these cells provides an estrogen-independent survival signal.
MATERIALS AND METHODS
Cells, cell culture conditions, and transfection.
MCF-7 cells were obtained from the American Type Culture Collection and were maintained in Dulbecco's modified Eagle's medium (DMEM) with 10% bovine calf serum. Transfections were performed using a small interfering RNA (siRNA) kit (Cell Signaling) according to the vendor's instructions. Transfection efficiencies (routinely in excess of 75%) were determined by transfection of the control nontargeted fluorescein-conjugated siRNA (Cell Signaling). Transient transfections were performed using Lipofectamine 2000 (Invitrogen) according to the vendor's instructions. Transfection efficiency was determined by transfection of pEGFP-C1 (Clontech), which expresses green fluorescent protein. The percentage of green cells was determined microscopically and was routinely in excess of 75%.
Materials.
Rapamycin was obtained from Sigma-Aldrich, and wortmannin was obtained from Calbiochem. Polyclonal antibodies to poly(ADP-ribose) polymerase (PARP) (human specific), Akt, phosphorylated Akt (Ser 473), ribosomal subunit S6-kinase 1 (S6-kinase), and phosphorylated S6-kinase (Thr 389), were obtained from Cell Signaling Technology. Antibodies to Myc and actin were obtained from Santa Cruz Biotechnology. [3H]myristic acid was obtained from New England Nuclear.
Plasmids.
The pcDNA3.1 control plasmid was obtained from Invitrogen. The plasmid expression vector for PLD2 (pCGN-PLD2) (8) was a generous gift of Michael Frohman (SUNY, Stony Brook). pcDNA3.1-PLD2, containing a neomycin resistance gene, was constructed by excising the PLD2 sequence from pCGN-PLD2 with XbaI and SmaI and then inserting it into the XbaI and EcoRV sites in pcDNA3.1. Cells were then selected with G418 sulfate over a period of 15 days. Pools of clones were then collected and used for experiments. pcDNA3.1-mTOR expression plasmids encoding wild-type and kinase-dead (Asp2338Ala) rat mTOR (5) were kindly provided by Robert Abraham (Burnham Institute, San Diego, Calif.).
Phospholipase D assays.
MCF-7 cells were plated in 60-mm culture dishes at 2 × 10⁴ cells per dish. Cells were treated as described in the figure legends and then prelabeled for 4 h with [3H]myristate (3 μCi; 40 Ci/mmol) in 3 ml of medium. PLD catalyzed transphosphatidylation in the presence of 0.8% 1-butanol, and the extraction and characterization of lipids by thin-layer chromatography were performed as described previously (6).
Cell viability and apoptosis assays.
Cell viability was determined by trypan blue exclusion. After various treatments, cells were harvested, washed, and treated with trypan blue at a concentration of 0.4%, wt/vol. After 10 min, trypan blue uptake (dead cells) was determined by counting on a hemocytometer. Apoptosis was ascertained by cleavage of the executioner caspase substrate PARP as described previously (7, 40).
Western blot analysis.
Extraction of proteins from cultured cells was performed as previously described (7, 27). Equal amounts of protein were subjected to sodium dodecyl sulfate-polyacrylamide gel electrophoresis using a 10% acrylamide separating gel and transferred to nitrocellulose membranes (Osmosis), and membrane filters were then blocked for 1 hour at room temperature with 5% nonfat dry milk in isotonic phosphate-buffered saline (136 mM NaCl, 2.6 mM KCl, 1.4 mM KH2PO4, 4.2 mM Na2HPO4) with 0.05% Tween 20 and then incubated with the appropriate antibodies diluted in 5% nonfat dry milk as described in Results. Depending upon the origin of the primary antibodies, either anti-mouse or anti-rabbit immunoglobulin G was used for detection with the ECL system (Amersham).
RNA analyses.
Total RNA was isolated using the RNAqueous commercial kit (Ambion) according to the manufacturer's protocol. Three to five micrograms of total RNA/sample was run on a 0.8% agarose gel and transferred to nylon membrane for Northern blot analyses. A 2.1-kbp NotI-SalI genomic fragment of the human c-myc gene (American Type Culture Collection) coding region was used as a probe for the mRNA product of the transgene. To normalize for variations in sample loading, blots were stripped and reprobed with a probe to 18S rRNA (Ambion). All probes were labeled with α-32P-labeled nucleotides by using the random-primer method (Invitrogen).
RESULTS
E2 enhances proliferation and survival of MCF-7 cells in the absence of serum.
We previously reported that MCF-7 cells, which are ER positive (26), undergo apoptosis when deprived of serum, whereas MDA-MB-231 breast cancer cells, which are ER negative (26), survived under these conditions (7). After 1 day in the absence of serum, approximately 25% of MCF-7 cells lose viability, and if maintained in the absence of serum, the percentage of nonviable cells goes to 68% at 5 days (Fig. 1A). As shown in Fig. 1B, there are corresponding increases in the cleavage of the executioner caspase substrate PARP, indicating that the loss of cell viability was due to apoptotic cell death.
FIG.1.
E2 enhances proliferation and survival of MCF-7 cells in the absence of serum. (A) MCF-7 cells were plated at 2 × 10⁴ cells/60-mm culture dish in DMEM with 10% bovine calf serum. After 24 h, the medium was changed to phenol red-free DMEM with either 0% or 10% charcoal dextran-treated serum as indicated. Both adherent and nonadherent cells were harvested at either 1 or 5 days of treatment, at which time the percentage of nonviable cells was determined by trypan blue exclusion. (B) MCF-7 cells were treated as in panel A, and lysates were prepared and analyzed for the level of PARP protein by Western blot analysis. Blots were stripped and reprobed with an antibody to actin as a loading control. The upper band represents uncleaved PARP, and the lower band represents cleaved PARP. (C) MCF-7 cells were plated as in panel A, and after 24 h (day 0) the medium was changed to phenol red-free DMEM depleted of serum. Ethanol (0.1%) as the control or E2 (2 nM) was then added, cells were harvested at the indicated time points, and cell number was determined. Medium with and without E2 was replenished every 48 h. (D) MCF-7 cells were plated and treated as in panel C. Cells were harvested and analyzed as in panel A. (E) Lysates from MCF-7 cells treated as in panel D were analyzed for PARP cleavage as in panel B. Error bars in panels A and D represent the standard deviations for three independent experiments. Experiments in panels B, C, and E are representative of three independent experiments.
Estrogens have been widely implicated in the proliferation of breast epithelial and human breast cancer cells (15, 16). Moreover, E2 has been reported to suppress apoptosis (1, 12, 20, 30, 35). We therefore examined the effect of E2 on the proliferation and survival of MCF-7 cells deprived of serum. As shown in Fig. 1C, there was a significant increase in the number of cells maintained in the presence of E2 relative to the untreated control cells. Significant differences in cell number between the E2 treated and untreated cells could be detected at the 5-day point, where apoptosis was observed in Fig. 1A and B. We next examined the effect of E2 on cell viability and PARP cleavage in MCF-7 cells deprived of serum for 1 or 5 days. E2 increased cell viability (Fig. 1D) and suppressed PARP cleavage (Fig. 1E). The effect of E2 was observed at 5 days, where the percentage of nonviable cells dropped from 68% to less than 25% in the presence of E2. These data indicate that E2 generates signals that allow MCF-7 cells to survive in the absence of serum.
E2 stimulates a delayed sustained elevation in Myc expression.
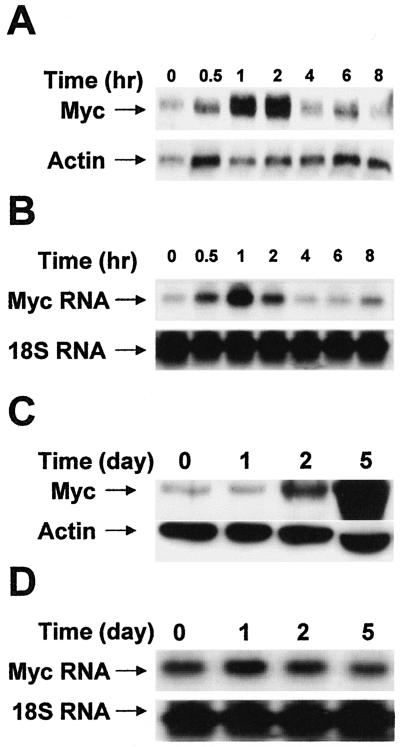
Myc expression has been strongly correlated with survival signals (29). A transient induction of Myc by E2 has been reported to occur within 30 min after E2 treatment (9), and a second phase has been reported to occur at 24 h (31). However, as indicated in Fig. 1, the effects of E2 on the survival of MCF-7 cells are not apparent until 5 days after treatment. We therefore examined the expression of Myc in response to E2 over the 5-day time course where the survival effects of E2 on MCF-7 cells were observed. As shown in Fig. 2A, there was a short-term transient increase in Myc expression in response to E2, as reported previously (9). There was also a corresponding increase in Myc RNA (Fig. 2B). However, as shown in Fig. 2C, there was a large, stable increase in Myc expression that could be detected at 2 days and was increased at 5 days, where the survival effects of E2 become apparent. Interestingly, there was no increase in Myc RNA during this time (Fig. 2D), indicating that the increased Myc expression was not regulated at the level of transcription.
FIG. 2.
E2 stimulates elevated expression of Myc. MCF-7 cells were plated as for Fig. 1 and placed in phenol red-free DMEM with 0% serum for 24 h. E2 (2 nM) was then added, and the cells were collected at the indicated times. Lysates were prepared and analyzed for the levels of Myc protein by Western blot analysis (A and C). Blots were reprobed with an antibody to actin to control for loading. (B and D) Northern blot analysis of the indicated samples using a c-myc probe. An 18S rRNA probe was used as a loading control. The experiment shown is representative of at least two independent experiments.
Suppression of Myc expression blocks the survival effects of E2.
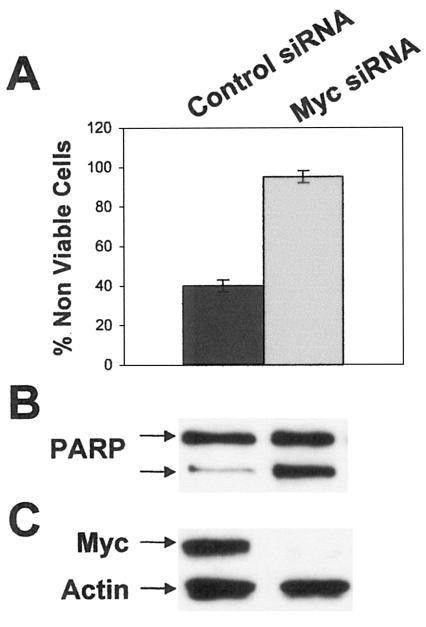
To determine if elevated Myc expression was required for the survival effects of E2, we treated the MCF-7 cells with Myc siRNA. MCF-7 cells were subjected to serum withdrawal in the presence of E2 for 3 days, at which time Myc siRNA and control siRNA were introduced by transient transfection. Cell viability and PARP cleavage were examined 48 h later, which was at the 5-day time point of E2 treatment where the increased Myc expression was maximal and the survival effect was most apparent. As shown in Fig. 3, Myc siRNA blocked E2-mediated cell survival (Fig. 3A) and reversed the suppression of PARP cleavage (Fig. 3B). The level of Myc protein was also examined, and as shown in Fig. 3C, Myc expression was very efficiently blocked by the Myc siRNA. These data indicate that Myc expression is required for the survival signals generated by E2.
FIG. 3.
Suppression of Myc expression blocks the survival effects of estrogen. (A) MCF-7 cells were plated as in Fig. 1, and 24 h later, the medium was changed to phenol red-free DMEM without serum containing E2 (2 nM). Seventy-two hours later, the cells were transiently transfected with Myc siRNA vector and the control siRNA vector. Forty-eight hours later, the cells were harvested, at which time the percentage of nonviable cells was determined by trypan blue exclusion. Error bars represent the standard deviations for three independent experiments. Transfection efficiency was determined by the percentage of green cells in the control siRNA culture, which expressed the green fluorescent protein, and was routinely in excess of 70%. MCF-7 cells from panel (A) were also analyzed for PARP cleavage (B) and Myc expression (C) as in Fig. 1. Blots were reprobed with an actin antibody to control for loading. Experiments shown are representative of three independent experiments.
E2-induced increases in Myc expression are dependent on basal levels of mTOR activity in MCF-7 cells.
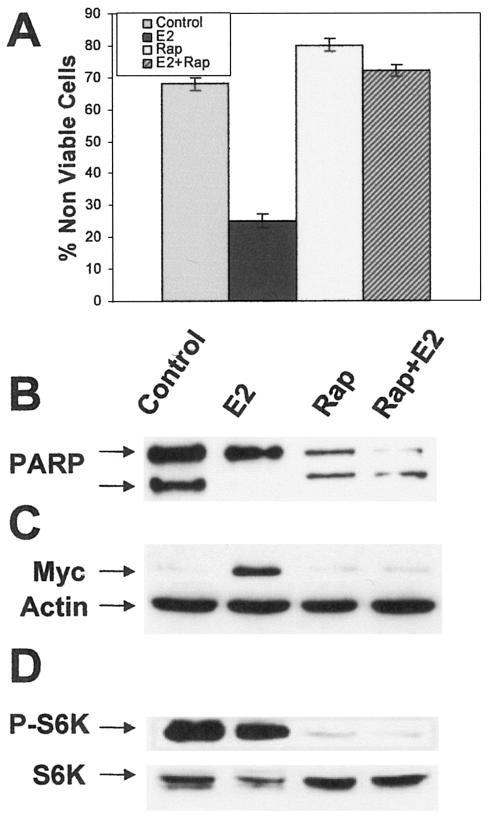
E2 has been reported to elevate Myc expression at the transcriptional level (9); however, Myc expression has also been reported to be dependent upon mTOR (the mammalian target of rapamycin), which regulates translation of Myc RNA into Myc protein (38). We therefore examined the effect of rapamycin on E2-induced cell survival and Myc expression. As shown in Fig. 4, rapamycin reversed the E2-induced increase in cell survival (Fig. 4A) and suppression of PARP cleavage (Fig. 4B). Rapamycin also inhibited the E2-induced increase of Myc expression seen at 5 days (Fig. 4C). We also examined the effect of E2 and rapamycin on the phosphorylation of the mTOR substrate S6-kinase. As expected, rapamycin suppressed phosphorylation of S6-kinase (Fig. 4D). Somewhat surprisingly, E2 did not elevate S6-kinase phosphorylation, indicating that the E2-induced increase in Myc expression was not due to increased mTOR activity. These data indicate that Myc expression induced by E2 is dependent upon basal mTOR activity and further implicate Myc expression in E2-induced survival signals.
FIG. 4.
Survival signals generated by E2 are sensitive to rapamycin. (A) MCF-7 cells were plated as described for Fig. 1 and placed in phenol red-free DMEM without serum after 24 h, along with either E2 (2 nM) or ethanol (0.1%) as the control. Ninety-six hours later (day 4) rapamycin (Rap) (20 nM) was added where indicated, cells were harvested 24 h later, and cell viability (A), PARP cleavage (B), and Myc levels (C) were determined as for Fig. 3. Blots were reprobed with an actin antibody to control for loading. (D) Lysates were also analyzed for phosphorylated S6-kinase (P-S6K) and total S6-kinase (S6K) as a control for loading. Error bars in panel A represent the standard deviations for three independent experiments. Data in panels B, C, and D are representative of three independent experiments.
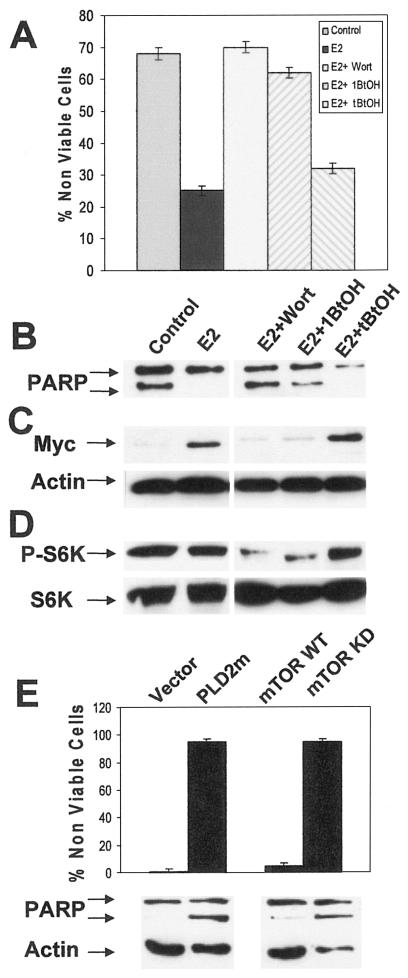
mTOR is activated in response to signals generated by phosphatidylinositol 3-kinase (PI3K) (32) and PLD (7). We therefore examined the requirement for PI3K and PLD in the E2-stimulated increase in cell survival, suppression of PARP cleavage, and increased Myc expression. We used wortmannin to inhibit PI3K and primary alcohol (1-butanol) to block the production of phosphatidic acid by PLD. As a control for the primary alcohol, we used a tertiary alcohol (t-butanol), which does not interfere with PLD activity (33). The inhibitors were added either on day 4 (wortmannin) or on day 5 (alcohol) after the cells had been subjected to serum withdrawal. Cell viability, PARP cleavage, and Myc expression were examined 24 h after the addition of wortmannin or 6 h after addition of the alcohols. As shown in Fig. 5, the effects of E2 on cell viability (Fig. 5A), PARP cleavage (Fig. 5B), and Myc expression (Fig. 5C) were reversed by both wortmannin and 1-butanol. t-Butanol did not interfere with the effects of E2. We also examined the effects of 1-butanol and wortmannin on the phosphorylation state of S6-kinase, and as shown in Fig. 5D, both 1-butanol and wortmannin suppressed the phosphorylation of S6-kinase in the E2-treated MCF-7 cells. To further establish that E2-induced cell survival and Myc expression were dependent upon PLD and mTOR, we employed catalytically inactive dominant negative mutants of PLD and mTOR. As shown in Fig. 5E, the dominant negative PLD2 and mTOR reduced cell viability and increased PARP cleavage in E2-treated MCF-7 cells. These data further indicate a dependence on PLD and mTOR for E2-induced survival signals.
FIG. 5.
Survival signals generated by E2 are dependent on PI3K and PLD. MCF-7 cells were prepared as for Fig. 4 and placed in serum-free, phenol red-free DMEM with or without E2 (2 nM) as indicated. Ninety-six hours later (day 4), wortmannin (Wort) (100 nM) was added as indicated. Twenty-four hours later the cells were treated with either the primary alcohol 1-butanol (1BtOH) or the tertiary alcohol t-butanol (3BtOH, tBtOH) (0.8%) as indicated for an additional 6 h. At this point, the cells were harvested and cell viability (A),PARP cleavage (B), Myc levels (C), and phosphorylated S6 kinase(P-S6K) (D) were determined as for Fig. 4. (E) MCF-7 cells were placed in serum-free, phenol red-free DMEM containing 2 nM E2. Three days later the cells were transiently transfected with either control empty vector or vector that expresses a catalytically inactive PLD2 (PLD2m), wild-type mTOR (mTOR WT), or a kinase-dead mTOR mutant (mTOR KD). Cell viability and PARP cleavage were determined 2 days later as for panel A. Error bars in panels A and E represent the standard deviations for three and two independent experiments, respectively. Experiments in panels B, C, and D are representative of three independent experiments.
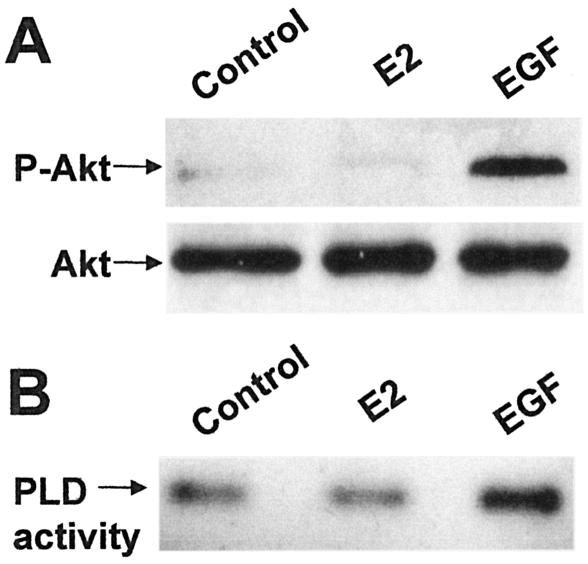
The data in Fig. 4 and 5 showed that while E2-induced survival was dependent upon mTOR signals, E2 apparently did not increase mTOR activity. To further establish this, we examined the effect of E2 on the mTOR-activating signals of PI3K and PLD. To examine PI3K activity, we looked at the phosphorylation state of Akt, which becomes phosphorylated when PI3K is activated (37). As shown in Fig. 6A, E2 did not increase phosphorylation of Akt at 5 days. PLD activity was measured directly using the transphosphatidylation reaction (33), and as shown in Fig. 6B, E2 had no effect upon PLD activity. In contrast, EGF was able to increase both Akt phosphorylation and PLD activity in the MCF-7 cells (Fig. 6A and B). These data, like the data in Fig. 5D, indicate that E2 does not elevate the activity of either mTOR or its upstream regulators PI3K and PLD. The implication is that basal levels of mTOR activity are required for elevated Myc expression and survival signals generated by E2.
FIG. 6.
Effect of E2 on Akt phosphorylation and PLD activity. MCF-7 cells were prepared as for Fig. 4 and placed in serum-free, phenol red-free DMEM with or without E2 (2 nM) as indicated. As a positive control, cells were also treated with EGF (100 ng/ml) where indicated. The cells were harvested 5 days later, and lysates were analyzed for the level of phosphorylated Akt and Akt protein by Western blot analysis (A). To determine the PLD activity, 0.8% 1-butanol was added at the 5-day time point, and the transphosphatidylation product phosphatidylbutanol was characterized 4 h later (B). Data shown are representative of three independent experiments. Error bars represent the standard deviations for three independent experiments.
Elevated expression of PLD2 in MCF-7 cells increases Myc expression and confers an estrogen-independent survival signal.
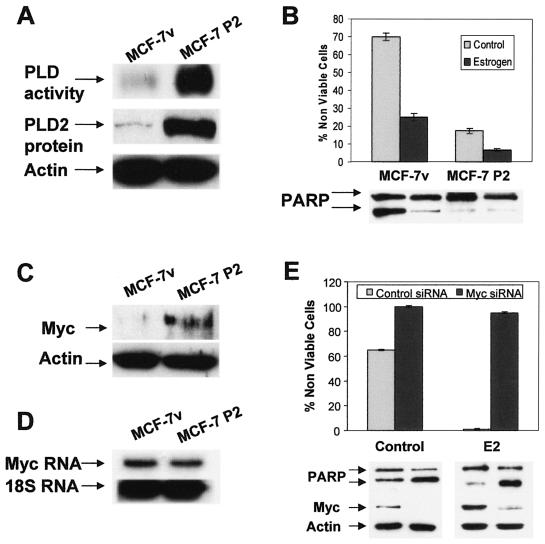
Increasing PLD activity can lead to increased mTOR activity (6, 11), and elevated levels of PLD activity have been reported in several human cancers, including breast cancer (reviewed in reference 13). Interestingly, elevated PLD activity was observed only in ER-negative breast cancer cell lines (our unpublished observations). Moreover, we found that highly elevated PLD activity in the ER-negative human breast cancer cell line MDM-MB-231 provides an mTOR-dependent survival signal (7). Thus, it is possible that elevated PLD activity could overcome the need for E2 and the ER. We therefore stably introduced the PLD2 gene, which is tolerated by cells much better than PLD1 (24), into the MCF-7 cells (MCF-7 P2 cells) in order to determine whether elevating the level PLD activity in the MCF-7 cells could provide estrogen-independent survival in these cells when deprived of serum. The levels of PLD activity and protein in the MCF-7 empty vector control and the MCF-7 P2 cells were evaluated, and as shown in Fig. 7A, the MCF-7 P2 cells had more than 25-fold more PLD activity than the parental vector-transfected MCF-7 cells. We then examined the ability of these cells to survive in the absence of serum. As shown in Fig. 7B, the MCF-7 P2 cells were more resistant than the MCF-7 cells to the apoptosis induced by serum withdrawal. However, E2 was still able to enhance survival of these cells, indicating that elevated PLD activity alone may not provide the same degree of protection from apoptosis as provided by E2. In Fig. 7C, it is shown that the MCF-7 P2 cells have elevated Myc expression relative to the vector control MCF-7 cells. The elevated PLD activity did not have any effect on the level of Myc RNA (Fig. 7D), indicating that elevated Myc expression was not due to increased transcription. The Myc dependence for the survival of the MCF-7 P2 cells was investigated using Myc siRNA to suppress Myc expression. As shown in Fig. 7E, the Myc siRNA suppressed Myc expression and reversed the survival effects of PLD2 on the MCF-7 cells. This experiment was problematic in that the introduction of control siRNA into cells that were already under the stress of serum withdrawal increased the basal apoptosis to around 60%. However, in the cells that received the Myc siRNA, 100% of the cells underwent apoptosis (Fig. 7E). If E2 was provided during the transfection, the results with the MCF-7 P2 cells were quite dramatic, in that virtually all of the cells receiving the control siRNA survived, whereas close to 100% of those that received the Myc siRNA underwent apoptosis (Fig. 7E). These data indicate that elevated PLD activity provides a Myc-dependent survival signal in MCF-7 cells that, at least partially, overcomes E2 dependence.
FIG. 7.
Elevated expression of PLD2 in MCF-7 cells increases Myc expression and confers an estrogen-independent survival signal. (A) MCF-7 P2 and control MCF-7v cells were generated as described in Materials and Methods. Cells were plated in DMEM with 10% serum and switched to DMEM with 0.5% serum after 24 h. PLD activity and protein levels were then determined by transphosphatidylation and Western blotting, respectively. (B) MCF-7v cells and MCF-7 P2 cells were prepared as for Fig. 4 and placed in serum-free, phenol red-free DMEM with or without E2 (2 nM) as indicated. Cells were harvested after 5 days of treatment, at which time the percentage of nonviable cells and PARP cleavage were determined as for Fig. 4. Myc protein (C) and RNA (D) levels in the MCF-7v cells and MCF-7 P2 cells were determined as for Fig. 2. (E) The effects of Myc siRNA on cell viability, PARP cleavage, and Myc expression in the MCF-7 P2 cells were determined in the presence and absence of E2 as described for Fig. 3. All experiments shown are representative of three independent experiments.
DISCUSSION
In this paper, we have provided evidence that E2 provides a survival signal in the ER-positive MCF-7 breast cancer cell line that is dependent upon a delayed increase in Myc expression. The E2 survival signal was also dependent upon basal levels of mTOR and its upstream regulators PI3K and PLD. Stable expression of PLD2 in MCF-7 cells provided an E2-independent survival signal that was also dependent upon elevated Myc expression. The key contributor to the survival of MCF-7 cells deprived of serum is apparently Myc expression. In this regard, it is of interest that E2 induced two phases of Myc expression, a short transient induction involving transcriptional activation, as reported previously (9, 31), and more importantly, a large sustained induction that begins 2 to 3 days after treatment when the survival effects of E2 became apparent. This delayed increase in Myc expression did not involve increased transcription. Suppression of Myc expression reversed both E2- and PLD-dependent survival signals.
Activation of Myc has been reported to be dependent upon mTOR-dependent translation (38). We demonstrated here that the E2-induced increase in Myc expression is dependent upon mTOR and two upstream activators of mTOR, PI3K and PLD. However, E2 did not increase mTOR, PI3K, or PLD activity, indicating that only basal levels of mTOR activity were required for the E2 effects on Myc expression and cell survival. These data indicate that the delayed E2-induced increase in Myc expression is not dependent on increased translation of Myc. Since the increased Myc expression is apparently not dependent on either increased transcription or increased translation, it is most likely dependent upon increased stabilization of Myc protein. Stabilization of Myc protein is regulated through the ubiquitin-proteasome pathway (39). The stabilization of Myc protein involves complex phosphorylation and dephosphorylation steps involving Erk, Gsk3β, and protein phosphatase 2A (39). At this point it is not clear how E2 affects this pathway.
The introduction of PLD2 into MCF-7 cells led to increased PLD activity and increased Myc expression. The mechanism for elevated PLD activity was also independent of transcription; however, elevated PLD activity does increase S6-kinase phosphorylation (7, 21) and therefore could be enhancing mTOR-mediated translation of Myc. Whether PLD enhances Myc stabilization is not clear, but elevated PLD activity suppresses protein phosphatase 2A, which enhances Myc degradation (our unpublished results). Thus, PLD could conceivably enhance both Myc translation and stability. The survival signal generated by elevated PLD activity was dependent upon Myc. However, while the MCF-7 cells with elevated PLD activity could survive in the absence of serum, the combination of elevated PLD activity and E2 provided a stronger survival signal, indicating that elevated PLD activity does not provide all of what E2 provides. Of interest in this regard is that elevated PLD activity has been observed in a majority of breast cancer tissues that have been examined (28, 36). Thus, elevated PLD activity could be selected for in a developing breast tumor before vascularization provides the E2 that enhances both survival and proliferation. Elevated PLD activity could prevent apoptosis of the breast cancer cells in a growing tumor mass and contribute to progression.
Loss of ER expression is correlated with progression to a more malignant phenotype in breast cancer, with a resulting poor prognosis (34). Elevated PLD activity in MCF-7 cells provides at least partial independence from E2 for survival. Thus, elevated PLD activity in breast cancer conceivably provides the means with which a tumor can progress to an ER-negative stage. While most breast cancers are ER positive, most breast cancer cell lines are ER negative (26), suggesting that the ability to survive in culture relies on survival signals other than those provided by estrogens. We have examined the level of PLD activity in several breast cancer cell lines and find that PLD activity is similarly elevated in many of these cell lines (6, 7, 40; our unpublished data). Interestingly, there is a strong, although not complete, correlation between elevated PLD activity and a loss of the estrogen receptor. However, all breast cancer cell lines with highly elevated PLD activity examined were ER negative. We have found ER-negative breast cancer cell lines without elevated PLD activity (MDA-MB-435S), and these cells have another survival pathway activated, the PI3K pathway (7).
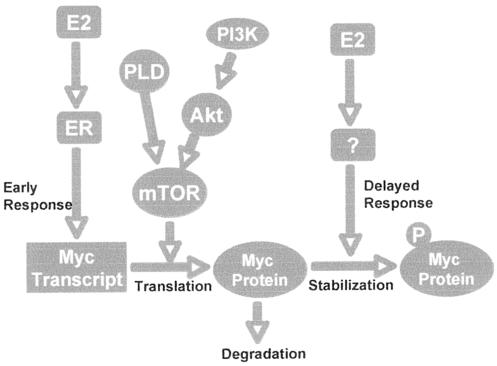
A model for survival signals generated by E2 and PLD in MCF-7 cells is shown in Fig. 8. In this model, E2 provides survival early in breast cancer progression. Elevated PLD or PI3K activity would enhance survival during the formation of a tumor mass prior to vascularization. In this simplified model, E2 increases Myc expression through enhanced stabilization of Myc protein. The translation of Myc transcripts into Myc protein is dependent upon basal levels of mTOR, and elevated PLD activity in an emerging tumor would increase translation of basal levels of Myc transcript to Myc protein by activating mTOR. Progression to an ER-negative phenotype likely involves additional genetic alterations that provide a metastatic potential that makes these tumors more aggressive and malignant.
FIG. 8.
Model for E2- and PLD-driven Myc-dependent survival signals in MCF-7 cells. It is proposed that E2 induces an early transient increase in Myc expression at the level of transcription. Beginning on day 2 and peaking at day 5, there is a delayed increase in Myc expression that is likely due to stabilization of Myc protein through phosphorylation (P). Although there is no increase in mTOR activity induced by E2, the delayed increase in Myc expression is dependent upon basal levels of mTOR activity and the activity of the upstream regulators PLD and PI3K. In the absence of E2, it is proposed that elevated PLD activity can increase mTOR activity to translate basal levels of Myc transcript to increase Myc expression. It is not clear whether PLD would lead to increased Myc stabilization. Elevated PLD activity provides an E2-independent survival signal that could be critical for progression to an ER-negative status in breast cancer progression.
Acknowledgments
We express gratitude to Michael Frohman, Robert Abraham, and Robert Eisenman for PLD2, mTOR, and Myc expression vectors used in this study.
This work was supported by grants from the National Cancer Institute (CA46677) and a SCORE grant from the National Institutes of Health (GM60654). A Research Centers in Minority Institutions award (RR-03037) from the National Center for Research Resources of the National Institutes of Health, which supports infrastructure and instrumentation in the Biological Sciences Department at Hunter College, is also acknowledged.
REFERENCES
- 1.Ahamed, S., J. S. Foster, A. Bukovsky, and J. Wimalasena. 2001. Signal transduction through the ras/Erk pathway is essential for the mycoestrogen zearalenone-induced cell-cycle progression in MCF-7 cells. Mol. Carcinog. 30:88-98. [DOI] [PubMed] [Google Scholar]
- 2.Ali, S., and C. Coombs. 2002. Endocrine-responsive breast cancer and strategies for combating resistance. Nat. Rev. Cancer 21:101-112. [DOI] [PubMed] [Google Scholar]
- 3.Beatson, G. 1896. On the treatment of inoperable cases of the mamma: suggestions for a new method of treatment with illustrative cases. Lancet ii:104-107, 162-165. [PMC free article] [PubMed] [Google Scholar]
- 4.Biscardi, J. S., D. A. Tice, and S. J. Parsons. 1999. c-Src, receptor tyrosine kinases, and human cancer. Adv. Cancer Res. 76:61-119. [DOI] [PubMed] [Google Scholar]
- 5.Brunn, G. J., C. C. Hudson, A. Sekulic, J. M. Williams, H. Hosoi, P. J. Houghton, J. C. Lawrence, Jr., and R. T. Abraham. 1997. Phosphorylation of the translational repressor PHAS-I by the mammalian target of rapamycin. Science 277:99-101. [DOI] [PubMed] [Google Scholar]
- 6.Chen, Y., Y. Zheng, and D. A. Foster. 2003. Phospholipase D confers rapamycin resistance in human breast cancer cells. Oncogene 22:3937-3942. [DOI] [PubMed] [Google Scholar]
- 7.Chen, Y., V. Rodrik, and D. A. Foster. 2005. Alternative phospholipase D/mTOR survival signal in human breast cancer cells. Oncogene 24:672-679. [DOI] [PubMed] [Google Scholar]
- 8.Colley, W. C., T. C. Sung, R. Roll, J. Jenco, S. M. Hammond, Y. Altshuller, D. Bar-Sagi, A. J. Morris, and M. A. Frohman. 1997. Phospholipase D2, a distinct phospholipase D isoform with novel regulatory properties that provokes cytoskeletal reorganization. Curr. Biol. 7:191-201. [DOI] [PubMed] [Google Scholar]
- 9.Dubik, D., and, and R. P. Shiu. 1992. Mechanism of estrogen activation of c-myc oncogene expression. Oncogene 7:1587-1594. [PubMed] [Google Scholar]
- 10.Fang, Y., M. Vilella-Bach, R. Bachmann, A. Flanigan, and J. Chen. 2001. Phosphatidic acid-mediated mitogenic activation of mTOR signaling. Science 294:1942-1945. [DOI] [PubMed] [Google Scholar]
- 11.Fang, Y., I. H. Park, A. L. Wu, G. Du, P. Huang, M. A. Frohman, S. J. Walker, H. A. Brown, and J. Chen. 2003. PLD1 regulates mTOR signaling and mediates Cdc42 activation of S6K1. Curr. Biol. 13:037-2044. [DOI] [PubMed] [Google Scholar]
- 12.Fernando, R. I., and J. Wimalasena. 2004. Estradiol abrogates apoptosis in breast cancer cells through inactivation of BAD: Ras-dependent nongenomic pathways requiring signaling through ERK and Akt. Mol. Biol. Cell 15:3266-3284. [DOI] [PMC free article] [PubMed] [Google Scholar]
- 13.Foster, D. A., and L. Xu. 2003. Phospholipase D in cell proliferation and cancer. Mol. Cancer Res. 1:789-800. [PubMed] [Google Scholar]
- 14.Foster, D. A. 2004. Targeting mTOR-mediated survival signals in anticancer therapeutic strategies. Exp. Rev. Anticancer Ther. 4:691-701. [DOI] [PubMed] [Google Scholar]
- 15.Foster, J. S., D. C. Henley, S. Ahmed, and J. Wimalasena. 2001. Estrogens and cell cycle regulation in breast cancer. Trends Endocrinol. Metab. 12:320-327. [DOI] [PubMed] [Google Scholar]
- 16.Foster, J. S., R. I. Fernando, N. Ishida, K. I. Nakayama, and J. Wimalasena. 2003. Estrogens down-regulate p27Kip1 in breast cancer cells through Skp2 and through nuclear export mediated by the ERK pathway. J. Biol. Chem. 278:41355-41366. [DOI] [PubMed] [Google Scholar]
- 17.Hanahan, D., and R. A. Weinberg. 2000. The hallmarks of cancer. Cell 100:57-70. [DOI] [PubMed] [Google Scholar]
- 18.Hennings, H., A. B. Glick, D. A. Greenhalgh, D. L. Morgan, J. E. Strickland, T. Tennenbaum, and S. H. Yuspa. 1993. Critical aspects of initiation, promotion, and progression in multistage epidermal carcinogenesis. Proc. Soc. Exp. Biol. Med. 202:1-8. [DOI] [PubMed] [Google Scholar]
- 19.Hornia, A., Z. Lu, T. Sukezane, M. Zhong, and D. A. Foster. 1999. Antagonistic effects of protein kinase C α and δ on both transformation and phospholipase D activity mediated by the EGF receptor. Mol. Cell. Biol. 19:7672-7680. [DOI] [PMC free article] [PubMed] [Google Scholar]
- 20.Huang, Y. 1997. Estrogen increases intracellular p26Bcl-2 to p21Bax ratios and inhibits taxol-induced apoptosis of human breast cancer MCF-7 cells. Breast Cancer Res. Treat. 42:73-81. [DOI] [PubMed] [Google Scholar]
- 21.Hui, L., T. Abbas, R. Pielak, T. Joseph, J. Bargonetti, and D. A. Foster. 2004. Phospholipase D elevates the level of MDM2 and suppresses DNA damage-induced increases in p53. Mol. Cell. Biol. 24:5677-5688. [DOI] [PMC free article] [PubMed] [Google Scholar]
- 22.Johnston, S. R., and M. Dowsett. 2003. Aromatase inhibitors for breast cancer: lessons from the laboratory. Nat. Rev. Cancer 3:821-831. [DOI] [PubMed] [Google Scholar]
- 23.Jordan, V. C. 2004. Selective estrogen receptor modulation: concept and consequences in cancer. Cancer Cell 5:207-213. [DOI] [PubMed] [Google Scholar]
- 24.Joseph, T., R. Wooden, A. Bryant, M. Zhong, Z. Lu, and D. A. Foster. 2001. Transformation of cells overexpressing a tyrosine kinase by phospholipase D1 and D2. Biochem. Biophys. Res. Commun. 289:1019-1024. [DOI] [PubMed] [Google Scholar]
- 25.Joseph, T., A. Bryant, R. Wooden, E. Kerkhoff, U. R. Rapp, and D. A. Foster. 2002. Phospholipase D overcomes cell cycle arrest induced by high-intensity Raf signaling. Oncogene 21:3651-3658. [DOI] [PubMed] [Google Scholar]
- 26.Lacroix, M., and G. Leclercq. 2004. Relevance of breast cancer cell lines as models for breast tumours: an update. Breast Cancer Res. Treat. 83:249-289. [DOI] [PubMed] [Google Scholar]
- 27.Lu, Z., A. Hornia, T. Joseph, T. Sukezane, P. Frankel, M. Zhong, S. Bychenok, L. Xu, L. A. Feig, and D. A. Foster. 2000. Phospholipase D and RalA cooperate with the EGF receptor to transform 3Y1 rat fibroblasts. Mol. Cell. Biol. 20:462-467. [DOI] [PMC free article] [PubMed] [Google Scholar]
- 28.Noh, D. Y., S. J. Ahn, R. A. Lee, I. A. Park, J. H. Kim, P. G. Suh, S. H. Ryu, K. H. Lee, and J. S. Han. 2000. Overexpression of phospholipase D1 in human breast cancer tissues. Cancer Lett. 161:207-214. [DOI] [PubMed] [Google Scholar]
- 29.Pelengaris, S., M. Khan, and G. Evan. 2002. c-MYC: more than just a matter of life and death. Nat. Rev. Cancer 2:764-776. [DOI] [PubMed] [Google Scholar]
- 30.Perillo, B., A. Sasso, C. Abbondanza, and G. Palumbo. 2000. 17β-Estradiol inhibits apoptosis in MCF-7 cells, inducing bcl-2 expression via two estrogen-responsive elements present in the coding sequence. Mol. Cell. Biol. 20:2890-2901. [DOI] [PMC free article] [PubMed] [Google Scholar]
- 31.Santos, G. F., G. K. Scott, W. M. Lee, E. Liu, and C. Benz. 1988. Estrogen-induced post-transcriptional modulation of c-myc proto-oncogene expression in human breast cancer cells. J. Biol. Chem. 263:9565-9568. [PubMed] [Google Scholar]
- 32.Schmelzie, T., and M. N. Hall. 2000. TOR, a central controller of cell growth. Cell 103:253-262. [DOI] [PubMed] [Google Scholar]
- 33.Shen, Y., L. Xu, and D. A. Foster. 2001. Role for phospholipase D in receptor-mediated endocytosis. Mol. Cell. Biol. 21:595-602. [DOI] [PMC free article] [PubMed] [Google Scholar]
- 34.Sommer, S., and S. A. Fuqua. 2001. Estrogen receptor and breast cancer. Semin. Cancer Biol. 11:339-352. [DOI] [PubMed] [Google Scholar]
- 35.Teixeira, C., J. C. Reed, and M. A. Pratt. 1995. Estrogen promotes chemotherapeutic drug resistance by a mechanism involving Bcl-2 proto-oncogene expression in human breast cancer cells. Cancer Res. 55:3902-3907. [PubMed] [Google Scholar]
- 36.Uchida, N., S. Okamura, and Y. Nagamachi. 1997. Increased phospholipase D activity in human breast cancer. J. Cancer Res. Clin. Oncol. 123:280-285. [DOI] [PubMed] [Google Scholar]
- 37.Vivanco, I., and C. L. Sawyers. 2002. The phosphatidylinositol 3-kinase AKT pathway in human cancer. Nat. Rev. Cancer 2:489-501. [DOI] [PubMed] [Google Scholar]
- 38.West, M. J., M. Stoneley, and A. E. Willis. 1998. Translational induction of the c-myc oncogene via activation of the FRAP/TOR signaling pathway. Oncogene 17:769-780. [DOI] [PubMed] [Google Scholar]
- 39.Yeh, E., M. Cunningham, H. Arnold, D. Chasse, T. Monteith, G. Ivaldi, W. C. Hahn, P. T. Stukenberg, S. Shenolikar, T. Uchida, C. M. Counter, J. R. Nevins, A. R. Means, and R. Sears. 2004. A signalling pathway controlling c-Myc degradation that impacts oncogenic transformation of human cells. Nat. Cell Biol. 6:308-318. [DOI] [PubMed] [Google Scholar]
- 40.Zhong, M., Y. Shen, Y. Zheng, T. Joseph, D. Jackson, S. Beychenok, and D. A. Foster. 2003. Phospholipase D prevents apoptosis in v-Src-transformed rat fibroblasts and MDA-MB-231 breast cancer cells. Biochem. Biophys. Res. Commun. 302:615-619. [DOI] [PubMed] [Google Scholar]


