

Abstract
Introduction
Physical frailty is a common medical syndrome characterized by low muscle strength, low endurance, and reduced physiological function that leads to significantly negative health outcomes in older adults. This study investigated the risk variables among rural older adults in Hunan Province, China, and developed a physical frailty prediction model to inform policymaking to enhance their health and well-being.
Methods
This study was conducted from July 22 to September 3, 2022. A total of 291 participants were recruited using stratified cluster random sampling from five large villages in Hunan Province. Frailty screening was performed based on the Fatigue, Resistance, Ambulation, Illnesses, and Loss of Weight (FRAIL) scale, Geriatric Depression Scale 15-item version (GDS-15), Falls Efficacy Scale-International (FES-I), and Mini Nutrition Assessment-Short Form (MNA-SF). A logistic regression analysis was performed to identify the predictive factors for physical frailty and develop a physical frailty prediction model based on the area under the receiver operating characteristic (ROC) curve (AUC), sensitivity, specificity, and Youden index.
Results
The physical frailty prevalence among rural older adults in Hunan Province was 21.31% (n = 62). Household income and expenditure [odds ratio (OR): 1.826, 95% confidence interval (CI): 1.142–2.918], physical exercise frequency (OR: 1.669, 95% CI: 1.137–2.451), depressive symptoms (OR: 9.069, 95% CI: 3.497–23.516), and fear of falling (OR: 3.135, 95% CI: 1.689–5.818) were identified as significant predictors of physical frailty in rural older individuals. The AUC for the frailty predictive model was 0.860 (95% CI: 0.805, 0.914). The sensitivity and specificity at the optimal cutoff value were 80.6 and 76.0%, respectively, with a Youden index of 0.566.
Conclusion
The prediction model constructed in this study demonstrated promise as a potential tool for evaluating physical frailty risk in older adults, which can contribute to healthcare providers’ screenings for high-risk populations. Further multidimensional and experimental intervention studies should be conducted to prevent the occurrence and delay the progression of physical frailty in older adults.
Keywords: physical frailty, rural, older adults, FRAIL scale, predictive model
1. Introduction
Population aging has become a global challenge. Every country is experiencing the growing proportion of older adults in the population and China is no exception (1). An older adult is defined by the United Nations as a person who is over 60 years of age (2). Based on a China Bureau of Statistics report, people aged over 60 years has reached 296 million, accounting for 21.2% of the total population (3). Older people become frail due to physiological or psychological factors such as aging and illness (4). There are a number of older people in the Chinese rural regions, in rural areas the older population accounted for 17.72% of the total population, whereas in urban areas it accounted for 11.11%. Older population in rural area is a critical attention to achieve an objective of health care equity and healthy aging (5).
Frailty phenotype was initially defined by Fried et al. (6) and refers to an age-related medical syndrome increasing individual’s excessive vulnerability for developing increased dependency and/or death. Physical frail older people are mainly manifested in the aspects of lower muscle strength, lower endurance, and decreased physiological function (7). A meta-analysis found that frailty prevalence in rural older residents was 18%, greater than the global estimate of 10.7% (8). Previous studies have compared the frailty prevalence between rural and urban regions (9–14), with a 1.5 times higher frailty prevalence (10). Physiological function frail leads to inadequate basic daily activities ability and is susceptible to chronic diseases or comorbidity (15). These health conditions induce a higher risk of negative health outcomes such as hospitalization or nursing home admission, premature death (16), and Medicare demand with increased costs for individuals and health systems (annual cost $3,781 healthy vs. $10,755 frail) (17). Many countries consider addressing physical frailty as a priority to reduce the medical burden (18, 19).
Early screening of high-risk populations is important for early intervention to delay the onset and progression of physical frailty (20). The risk levels of physical frailty older people were affected by a range of factors and conditions such as age (21, 22), educational level (23), depression, fear of falling, nutritional status (24), and loneliness (25). Previous studies have attempted to develop frailty prediction models for developing countries, particularly for use in rural areas. However, their use is context dependent. During the urbanization process in China, population migration has produced sociodemographic profiles for the rural older population that are influenced by various factors such as economic development (26), distribution of health resources, and individual lifestyles. Little attention has been paid to rural residents and risk identification models of physical frailty have not been applied in China. A predictive model enables the accurate calculation of risk and identification of high-risk rural residents. This study aims to identify risk variables and create a predictive model of physical frailty for rural older residents.
2. Materials and methods
2.1. Study design and participants
This cross-sectional observational study was conducted to develop a risk predictive model of physical frailty among rural populations in Hunan Province, central China. We report the results of this study in accordance with the Strengthening the Reporting of Observational Studies in Epidemiology (STROBE) checklist guidelines (Supplementary Appendix 1).
Stratified cluster random sampling was employed to recruit the participants. Specially, five large villages were randomly selected in this study from Yueyang City, Yongzhou City, Zhuzhou City, Chenzhou, City and Huaihua City. Participant inclusion criteria were: ① resided in the village at least 6 months; ② Age 60 years or older; ③ capable of communication; and ④ voluntarily agreed to participate in the study. Older adults with severe diseases, mental disorders, or serious audio-visual impairments were excluded so as to the accuracy of the study findings.
According to Kendall’s sample size calculation method (27), the sample size should be 5–10 times the number of independent variables. Using three scales and 17 items, and assuming a 20% sample loss, the required sample size for this study was 120–240. Ultimately, 291 valid questionnaires were obtained to meet the sample size requirements.
2.2. Survey tools
The questionnaire employed in this study consisted of five parts: a general information questionnaire, the Fatigue, Resistance, Ambulation, Illnesses, & Loss of Weight (FRAIL) scale, Geriatric Depression Scale 15-item version (GDS-15), Falls Efficacy Scale-International (FES-I), and Mini Nutrition Assessment-Short Form (MNA-SF).
2.2.1. General information questionnaire
This section included 11 demographic items (age, sex, ethnicity, occupation, body mass index, education level, marital status, smoking status, alcohol consumption, family income, and living conditions) and 6 related factors (social activities, physical exercise, intellectual activities, falls in the past year, chronic diseases, and types of drugs administered).
2.2.2. FRAIL scale
The FRAIL scale was developed by the International Academy of Nutrition, Health, and Aging (28). It consists of five items: fatigue, resistance, ambulation, illnesses, and loss of weight. Each item is scored as 0 or 1, with the total score ranging from 0 to 5. According to the total scores are categorized as not-frailty (≤2 points), and frailty (≥ 3 points). In this study, the Cronbach’s α coefficient of this scale was 0.605.
2.2.3. GDS-15
The GDS-15 was developed by Sheik and Yesavage (29) in the 1980s, and translated into Chinese by Tang et al. (30). The GDS-15 has 15 items, including 10 affirmative (“yes” is 1 point and “no” is “no”) and 5 negative items (“yes” is 0 points and “no” is 1 point). The total GDS-15 score is 0–15 points, the cutoff point of ≥8 indicates the presence of depressive symptoms, and a higher score indicates more severe depressive symptoms. In this study, the Cronbach’s α coefficient of this scale was 0.753.
2.2.4. FES-I
The FES-I was revised by Yardley et al. (31, 32) and translated into Chinese by the researcher Guo et al. (33). It consists two dimensions: indoor physical activities (10 items) and outdoor physical activities (6 items). Items are scored using a Likert 4-point scale, ranging from “not at all worried” to “very worried,” with scores from 1 to 4. The total score ranges from 16–64; higher scores indicate a higher degree of fear of falling. Specifically, scores of 16–31 indicate low, 32–47 indicate moderate, and 48–64 indicate high fear of falling. In this study, the Cronbach’s α coefficient of this scale was 0.870.
2.2.5. MNA-SF
The MNA-SF was developed by Kaiser et al. (34) and then translated into the Chinese version by He et al. (35). The MNA-SF comprises six indicators: body mass index, decline in food, intake, stress, mobility, weight loss in the prior 3 months, and neuropsychiatric symptoms; a total score ranges from 0–14 points and scores are categorized as normal nutritional status (12–14 points), risk of malnutrition (8–11 points), and malnutrition (<8 points). The MNA-SF is an effective nutritional screening tool suitable for older adults because it demonstrates good sensitivity and specificity in identifying malnutrition among this population (36, 37). In this study, the Cronbach’s α coefficient of this scale was 0.619.
2.3. Data collection
The questionnaires were collected face-to-face from July 22 to September 3, 2022. Before data collection, we recruited 12 sophomore nursing students as investigators who were divided into six groups (2 investigators in each group). The primary researcher taught them the nursing research curriculum and provided instructions for the questionnaire survey guidelines, quantitative research design, and data collection methods. The primary researcher printed written questionnaires and brought all groups of investigators to the five villages separately.
When collecting data, investigators used unified guidelines to ask participants about all items and filled in the questionnaires with their answers. If the older adults did not understand the meaning of the items or express their opinions accurately during the survey, their families or caregivers assisted in explaining them until they understood the meaning. After completing the questionnaire, each participant received a small gift (one toothbrush, one tube of toothpaste, and one bag of washing powder) to express gratitude. In this study, 306 questionnaires were collected; 15 invalid questionnaires that showed incomplete or incorrect information were excluded. Thus, 291 valid questionnaires were obtained with an effective rate of 95.10%.
2.4. Ethical considerations
This study was approved by the Institutional Review Board of the Medical Ethics Committee of Xiangnan University (registration number: 2022010). Before collecting data, all participants were informed about the purpose, process, and potential risks of the study and then were asked to provide written informed consent. They were allowed to withdraw from the study at any time without explanation. Their information was kept confidential and used only for research purposes. This study conformed to the guidelines of the 1995 Declaration of Helsinki (and its revised editions since 2000).
2.5. Data analysis
SPSS version 25.0 (IBM Corp., Armonk, NY, USA) was used to analyze data for all statistical analyses. A p-value <0.05 determined significance. The continuous data were statistically described by means and standard deviations, while the categorical data by frequency and percentage. For the univariate analysis, the χ2 test was employed. A binary multivariable logistic regression model was performed to estimate physical frailty risk and considered predictive factors as the significant factors obtained in the bivariate analysis. The discriminatory power of the risk model was evaluated based on the area under the receiver operating characteristic (ROC) curve (AUC), sensitivity, specificity, and Youden index. The Hosmer–Lemeshow test was used to analyze the model fit.
3. Results
3.1. Demographic characteristics and clinical characteristics
A total of 291 older people were investigated in this study. Figure 1 illustrates the recruitment process of participating rural older adults. Among them, there were 123 males (42.27%) and 168 females (57.73%); the age ranged from 60 to 94 years, with an average of (70.42 ± 7.09) years. 102 older adults (35.05%) had never attended school, 142 (48.80%) with primary school, and 47 (16.15%) with junior high school or above. In terms of family income, 143 older adults (49.14%) had income exceeding expenses, 96 (32.99%) with a balanced income and expenses, and 52 (17.87%) with expenses exceeding income. The prevalence of depressive symptoms was 12.37% (n = 36), and that of older adults at risk of malnutrition was 224 (76.97%). The fear of falling score was (29.69 ± 11.11), with an average score of (1.86 ± 0.69). The participant characteristics are listed in Table 1.
Figure 1.

Flow diagram of recruitment procedure.
Table 1.
Socio-demographic characteristics and physical frailty prevalence among the rural older population in Hunan Province.
| Variables | Frailty (%) (n = 62) |
Non-frailty (%) (n = 229) |
χ 2 | p-value | |
|---|---|---|---|---|---|
| Age in years | 60–69 | 24 (16.67) | 120 (83.33) | 21.485 | < 0.001* |
| 70–79 | 19 (17.43) | 90 (82.57) | |||
| ≥80 | 19 (50.00) | 19 (50.00) | |||
| Sex | Male | 27 (21.95) | 96 (78.05) | 0.053 | 0.818 |
| Female | 35 (20.83) | 133 (79.17) | |||
| Ethnicity | Han | 59 (20.92) | 223 (79.08) | 0.720 | 0.396 |
| Minority | 3 (33.33) | 6 (66.67) | |||
| Occupation | Farmer | 55 (20.92) | 192 (79.08) | 0.900 | 0.343 |
| Non-farmer | 7 (15.91) | 37 (84.09) | |||
| BMI (kg/m2) | Low weight | 11 (27.50) | 29 (66.67) | 1.938 | 0.379 |
| Normal | 36 (18.95) | 154 (79.08) | |||
| Overweight | 15 (24.59) | 46 (84.09) | |||
| Educational level | No school | 22 (21.57) | 80 (78.43) | 0.194 | 0.908 |
| Elementary school | 29 (20.42) | 113 (79.58) | |||
| Junior school or above | 11 (23.40) | 36 (76.60) | |||
| Marital status | Married/Reconciled | 35 (17.33) | 167 (82.67) | 6.237 | 0.013 |
| Unmarried/Divorced/Widowed /Separated |
27 (30.34) | 62 (69.66) | |||
| Smoking status | Never | 41 (18.98) | 175 (81.02) | 6.677 | 0.035 |
| Current | 15 (23.44) | 49 (76.56) | |||
| Quit | 6 (54.55) | 5 (45.45) | |||
| Alcohol consumption | Never | 45 (22.06) | 159 (77.94) | 6.532 | 0.038 |
| Current | 10 (14.08) | 61 (85.92) | |||
| Quit | 7 (43.75) | 9 (56.25) | |||
| Family income | Income more than expenditure | 17 (11.89) | 126 (88.11) | 33.232 | < 0.001 |
| Balance | 19 (19.79) | 77 (80.21) | |||
| Expenditure more than income | 26 (50.00) | 26 (50.00) | |||
| Living conditions | Living with spouse | 15 (14.85) | 86 (85.15) | 8.725 | 0.033 |
| Living with children | 25 (32.05) | 53 (67.95) | |||
| Living with spouse and children | 16 (17.78) | 74 (82.22) | |||
| Living alone | 6 (27.27) | 16 (72.73) | |||
| Frequency of participating in social activities | ≥ 1 time/week | 17 (63.73) | 59 (36.27) | 0.069 | 0.792 |
| <1 time/week | 45 (69.32) | 170 (30.68) | |||
| Frequency of participating in physical exercise | Everyday almost | 1 (1.32) | 75 (98.68) | 37.015 | < 0.001* |
| 3–5 times/week | 11 (18.03) | 50 (81.97) | |||
| 1–8 times/week | 15 (22.06) | 53 (77.94) | |||
| <1 time/month | 35 (40.70) | 51 (59.30) | |||
| Participation in intellectual activities | Yes | 20 (15.04) | 113 (84.96) | 5.740 | 0.017 |
| No | 42 (26.58) | 116 (73.42) | |||
| Falling occurred within 1 year | Yes | 13 (34.21) | 25 (65.79) | 4.341 | 0.037 |
| No | 49 (19.37) | 204 (80.63) | 1.099 | 0.295 | |
| Numbers of comorbidity of chronic disease | No | 8 (8.42) | 87 (91.58) | 20.296 | < 0.001* |
| 1 | 29 (22.31) | 101 (77.69) | |||
| ≥ 2 | 25 (37.88) | 41 (62.12) | |||
| Numbers and types of drugs administered | None | 21 (12.96) | 141 (87.04) | 16.645 | < 0.001* |
| 1 | 26 (35.62) | 47 (64.38) | |||
| ≥ 2 | 15 (26.79) | 41 (73.21) | |||
| Depression | Yes | 26 (72.22) | 10 (27.78) | 63.523 | < 0.001* |
| No | 36 (14.12) | 219 (85.88) | |||
| Nutritional status | Normal | 6 (13.95) | 37 (86.05) | 10.196 | 0.006 |
| At risk of malnutrition | 45 (20.09) | 179 (79.91) | |||
| Malnutrition | 11 (45.83) | 13 (54.17) | |||
| FOF level | Low | 11 (7.38) | 138 (92.62) | 61.619 | < 0.001* |
| Middle | 33 (27.97) | 85 (72.03) | |||
| High | 18 (75.00) | 6 (25.00) | |||
BMI, body mass index; FOF, fear of falling.
*p < 0.001.
3.2. Prevalence of physical frailty and risk factors
The prevalence of physical frailty was 21.31% (n = 62) among the 291 rural older adults in Hunan Province. There were significant differences in the frailty of rural older people with age, marital status, smoking status, alcohol consumption, family income and expenditure, living conditions, frequency of participating in physical exercise, participating in intellectual activities, falling frequency within one year, number of comorbidities for chronic diseases, number of types of drugs administered, depressive symptoms, nutritional status, and fear of falling (all p < 0.001).
3.3. Predictive factors associated with physical frailty
Before the stepwise binary logistic regression, all independent variables were assigned points, as presented in Table 2. The results showed that family income, physical activity, depressive symptoms and the fear of falling were the main predictive factors affecting of older people (p < 0.001) (Table 3).
Table 2.
Assigned points of variables in the logistic regression analysis model.
| Variables | Assigned points |
|---|---|
| Age (years) | 60–69 = 1; 70–79 = 2; ≥ 80 = 3 |
| Marital status | Married/reconciled = 1; Unmarried/divorced/widowed/separated = 2 |
| Smoking status | Never = 1; Current = 2; Quit = 3 |
| Alcohol consumption | Never = 1; Current = 2; Quit = 3 |
| Family income | Income more than expenditure = 1; balance = 2; expenditure more than income = 3 |
| Living conditions | Living alone = 1; Living with spouse = 2; Living with children = 3; Living with spouse and children = 4 |
| Frequency of participating in physical activities | Almost every day = 1; 3–5 times/week = 2; 5–8 times/month = 3; <1 time/month = 4 |
| Participation in intellectual activities | No = 1; Yes = 2 |
| Fall occurred within prior year | No = 1; Yes = 2 |
| Number of chronic diseases | No = 1; 1 Type = 2; ≥ 2 Type = 3 |
| Types of drugs administered | No = 1; 1 Type = 2; ≥ 2 Type = 3 |
| Depression symptoms | No = 1; Yes = 2 |
| Nutritional status | Normal = 1; Risk of malnutrition = 2; Malnutrition = 3 |
| Fear of falling | Low = 1; Middle = 2; High = 3 |
Table 3.
Predictive risk factors associated with physical frailty for the rural older adults by the stepwise binary logistic regression.
| Variables | β value | SE | Wald χ2 | OR (95% CI) | p-value |
|---|---|---|---|---|---|
| Constant | −8.477 | 1.000 | 71.829 | - | < 0.001 |
| Family income | 0.602 | 0.239 | 6.332 | 1.826(1.142–2.918) | 0.012 |
| Frequency of participating in physical activities | 0.512 | 0.196 | 6.833 | 1.669(1.137–2.451) | 0.009 |
| Depression symptoms | 2.205 | 0.486 | 20.568 | 9.069(3.497–23.516) | < 0.001 |
| Fear of falling level | 1.143 | 0.316 | 13.113 | 3.135(1.689–5.818) | < 0.001 |
CI, confidence interval; OR, odds ratio; SE, standard error.
3.4. Effectiveness of risk prediction model of physical frailty
Based on the significant variables and assigned values, the final risk predictive model of physical frailty was Y = −9.076 + 0.623 family income +0.315 physical exercise +2.181 depression and + 1.165 fear of falling. The ROC curve was used to evaluate the effectiveness of the risk prediction model in the rural older population with physical frailty (Figure 2). The area under the ROC curve was 0.860 (95% CI: 0.805–0.914), which was greater than the theoretical acceptability of 0.700 (38), indicating satisfactory discriminatory performance for the risk model in identifying frail older adults in a rural setting. The optimal cutoff value of 0.201 was determined using the maximum Youden index value (0.566). The sensitivity and specificity of the optimal cutoff values were 80.6 and 76.0%, respectively. The Hosmer-Lemeshow test was used to assess goodness of fit of the predictive model; χ2 = 7.5668, p = 0.363 (>0.05) showed the model fitting degree is deal.
Figure 2.
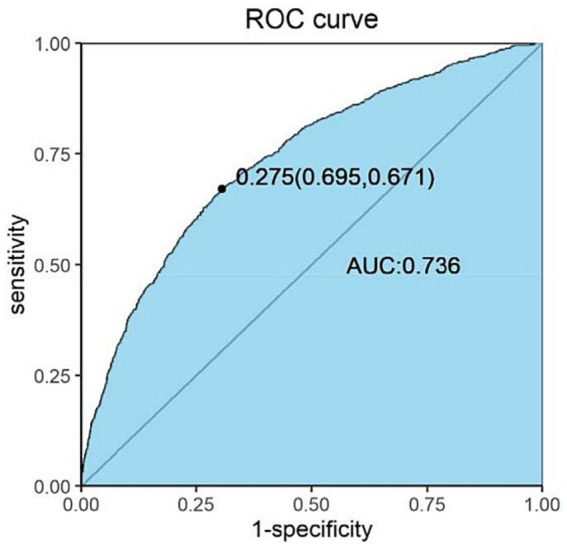
ROC curve for the physical frailty risk prediction model among older rural residents. The horizontal coordinate is 1-specificity, and the vertical coordinate is sensitivity. AUC, area under the curve; ROC, receiver operating characteristic.
4. Discussion
This study established a risk prediction model for physical frailty among rural older residents, which is an essential tool in this era of an aging society. As the profile of rural older residents’ changes, it is of utmost importance to provide a scientific model to identify residents in the early frailty stage.
The results indicated that frailty prevalence among the rural older people aged 60 years and older was 21.31%. The prevalence of rural frailty varies among countries. The prevalence rate in our study is similar to those in Vietnam (39) and Japan (40), higher than that of Malaysia (41) and Tanzania (42), and lower than those of Brazil (43) and the Republic of Korea (44). In addition, among the Chinese older people, physical frailty prevalence was much higher for those dwelling in rural areas of Hunan Province than those in Beijing (45) and Shanghai (10). The high prevalence of physical frailty in rural areas is prone to a wide range of adverse outcomes. Paying attention to frail older people was one of important measures to minimize adverse events (46). This finding calls for action to identify populations at high risk in order to prevent physical frailty at an early stage.
Several factors are associated with the prevalence and progression of physical frailty. Predictive factors are context dependent and vary. This study identified low income, physical activity, depression, and fear of falling as predictive factors for physical frailty among rural older residents.
Low income in rural regions, characterized by lower socioeconomic status and education levels. This is consistent with the findings of Ahmad et al. (41) and Huang et al. (14). The results of this study revealed that majority of rural older people had received a lower level of education, with 83.85% having no formal schooling or only completed elementary school. This percentage was higher than educational level of nationwide older people, as reported in the 2021 Chinese General Social Survey (CGSS) (47, 48). Older adults with lower education exhibited higher rates of physical frailty compared to those with higher educational levels (49). Wongtrakulruang et al. (50) found that a lower education level, specifically primary school education or less, was associated with an increased risk of physical frailty. Low educational level in rural area may lead to lower family income for older people. Family income is the basic guarantee for better living. Older people with a high family income not only enjoy superior and comfortable living conditions but also have high quality nutritional intake, and high utilization rate of health services, which enables timely and effective treatment of diseases; 89% of rural older people suffer from one type of chronic disease or more (51). Worldwide, the prevalence rates appear to be higher in less developed environments and lower in more developed countries (52).
The findings of this study showed that depressive symptoms were another predictive factor of physical frailty in rural older individuals, which is consistent with the results of a study by Soysal et al. (53). Depression is a common cognitive factor. When depressive symptoms persist at high levels, they subsequently lead to cognitive decline as well as to the development or worsening of the physical frailty syndrome in older adults (54). The depression and physical frailty, in conjunction with environmental factors (e.g., low education, unhealthy dietary patterns, low physical activity) may negative influence on cognitive frailty (55), even brain aging. Ruan et al. (56) proposed that physical frailty contributed to cognitive impairment of cognitive frailty. Their interaction primarily rises from the fact that physical frailty and cognitive impairment share similar pathophysiological mechanism, which produces chronic inflammatory, oxidative stress, and mitochondrial dysfunction (53–56). Inflammatory cytokines play a crucial role in mediating cognitive frailty, meanwhile, high concentrations of inflammatory penetrate the blood–brain barrier and impact skeletal muscles, causing a reduction in muscle mass and strength, along with impaired functionality (57). This sequence of events ultimately gives rise to the onset of physical frailty. Additionally, individuals with depressive symptoms usually engage in less physical activity, have poor dietary intake (58), and are reluctant to participate socially, which increase the probability of physical frailty. In this study, 85% of older rural adults were at risk of or had malnutrition and social participation (74%) less than 1 time per week. Gaspar et al. (59) highlighted on the dimension of laser activities and free time as protective factors against cognitive impairment. It’s necessary for the rural health government to provide a social platform to promote social and cultural activities for rural residents, which enriches their spiritual life to improve depressive symptoms.
Physical activity was correlated with physical frailty progression; the prevalence of physical frailty was lower in the moderate-intensity exercise group than in the sedentary or low-intensity exercise group, which is supported by the longitudinal cohort study of Rogers et al. (60). Regarding interventions based on physical activity, different kinds of exercises has been found to improve physical function and muscle strength, such as resistance exercise, Chinese traditional mind body exercise, exergaming-based exercise and Otago exercise program (61–63). It is possible that older rural people maintain their livelihoods through some form of labor, indirectly strengthening their physical health to reduce the occurrence of physical frailty. Accordingly, physical activity, the most effective non-pharmacological intervention, enhances cognition, physical function, and mental health in older persons with frailty, providing evidence to promote future exercise programs to prevent the onset and progression of physical frailty in older adults (18). It is suggested to encourage older people to actively participate in labor or physical activity when possible.
With their fear of falling, the likelihood of developing physical frailty in rural older adults increases (64, 65). This fear of falling may have an inhibitory effect on self-efficacy (66), making older people who were previously active less energetic. Increased risk of falling may lead to reduced physical activity, but also to reduced engagement in social activities and increased social isolation, which could lead to further cognitive and functional impairment (49). Therefore, it is important to psychologically counsel older people with frailty about their fear of falling and implement interventions to prevent falls and improve their health status.
The risk-predictive model in the present study indicated good discrimination and could identify high-risk physical frailty for rural older people. This identification provides scientific evidence for appropriate interventions of rural older adults with high frailty risk to avoid adverse outcomes.
The strength of this study lies in its focus on predictive factors for frail older individuals and good efficiency of the physical frailty predictive model in rural areas to expand our understanding of frailty in different specific rural regions given the uneven distribution of the population. However, several limitations should be acknowledged. Firstly, despite the methodologically and scientifically justified the sample size, the fact of participants chosen from each village by cluster sampling within five municipalities of Hunan Province may limit the generalizability of the results to a broader rural population. Future studies should aim to expand the sample size and geographically diversify the participants to enhance external validity of the findings. Ideally, such studies could adopt a longitudinal research design to provide more robust evidence. Secondly, this study used a cross-sectional design, making it difficult to infer causality. Longitudinal studies are needed to track participants over time and provide more empirical evidence to support targeted interventions aimed at preventing or delaying the onset of physical frailty in rural older people. Thirdly, while this study has identified several important predictive factors for frailty, a wider range of potential factors should be incorporated to identify frailty to obtain more representative results in the future research. This would provide valuable evidence for physical frailty prevention programs in rural areas. Finally, the slightly insufficient Cronbach’s alpha values were obtained for the Chinese-adapted MNA-SF instrument and the FRAIL scale (0.605), indicating potential room for improvement in the reliability of these measurement tools when applied to the Chinese population. Further research could be considered to explore methods for enhancing the reliability of these instruments in Chinese-contexts.
5. Conclusion
The study established a risk-predictive model that integrates factors such as low income, depressive symptoms, lack of physical activity, and fear of falling to identify physical frail older individuals in rural areas. Frailty is a multifaceted issue involving various factors. Collaboration among public health professionals, policymakers, and stakeholders is crucial for preventing frailty. Our model could provide a potential tool to identify rural older residents at risk of physical frailty and inform prevention programs.
Acknowledgments
We express our deepest gratitude for the great support of the student investigators and thank all the participants for their contributions to this study.
Funding Statement
The author(s) declare that financial support was received for the research, authorship, and/or publication of this article. This study was supported by the Youth Fund Project of Ministry of Education Humanities (grant no. 23YJ840015), the Youth Fund Project of Hunan Provincial Natural Science Foundation (grant no. 2024JJ6415), and Jiangxi Provincial Health Commission Project, China (202311162).
Data availability statement
The raw data supporting the conclusions of this article will be made available by the authors, without undue reservation.
Author contributions
XG: Conceptualization, Data curation, Formal analysis, Investigation, Methodology, Software, Visualization, Writing – original draft, Writing – review & editing. CS: Conceptualization, Funding acquisition, Investigation, Project administration, Resources, Supervision, Validation, Writing – original draft, Writing – review & editing.
Conflict of interest
The authors declare that the research was conducted in the absence of any commercial or financial relationships that could be construed as a potential conflict of interest.
Generative AI statement
The authors declare that no Generative AI was used in the creation of this manuscript.
Publisher’s note
All claims expressed in this article are solely those of the authors and do not necessarily represent those of their affiliated organizations, or those of the publisher, the editors and the reviewers. Any product that may be evaluated in this article, or claim that may be made by its manufacturer, is not guaranteed or endorsed by the publisher.
Supplementary material
The Supplementary material for this article can be found online at: https://www.frontiersin.org/articles/10.3389/fpubh.2025.1525580/full#supplementary-material
References
- 1.Rudnicka E, Napierała P, Podfigurna A, Męczekalski B, Smolarczyk R, Grymowicz M. The World Health Organization (WHO) approach to healthy ageing. Maturitas. (2020) 139:6–11. doi: 10.1016/j.maturitas.2020.05.018, PMID: [DOI] [PMC free article] [PubMed] [Google Scholar]
- 2.The United Nation Refugee Agency . Older persons (2024). Available online at: https://emergency.unhcr.org/protection/persons-risk/older-persons (Accessed June 13, 2024)
- 3.Wang H, Chen H. Aging in China: challenges and opportunities. China CDC Wkly. (2022) 4:601–2. doi: 10.46234/ccdcw2022.130, PMID: [DOI] [PMC free article] [PubMed] [Google Scholar]
- 4.Sciacchitano S, Carola V, Nicolais G, Sciacchitano S, Napoli C, Mancini R, et al. To be frail or not to be frail: this is the question—a critical narrative review of frailty. J Clin Med. (2024) 13:721. doi: 10.3390/jcm13030721, PMID: [DOI] [PMC free article] [PubMed] [Google Scholar]
- 5.Chen C, Li J, Huang J. Spatial–temporal patterns of population aging in rural China. Int J Environ Res Public Health. (2022) 19:15631. doi: 10.3390/ijerph192315631, PMID: [DOI] [PMC free article] [PubMed] [Google Scholar]
- 6.Fried LP, Tangen CM, Walston J, Newman AB, Hirsch C, Gottdiener J, et al. Frailty in older adults: evidence for a phenotype. J Gerontol A Biol Sci Med Sci. (2001) 56:M146–57. doi: 10.1093/gerona/56.3.M146, PMID: [DOI] [PubMed] [Google Scholar]
- 7.Sobhani A, Fadayevatan R, Sharifi F, Kamrani AA, Ejtahed HS, Hosseini RS, et al. The conceptual and practical definitions of frailty in older adults: a systematic review. J Diabetes Metab Disord. (2021) 20:1975–2013. doi: 10.1007/s40200-021-00897-x, PMID: [DOI] [PMC free article] [PubMed] [Google Scholar]
- 8.Xu R, Li Q, Guo F, Zhao M, Zhang L. Prevalence and risk factors of frailty among people in rural areas: a systematic review and meta-analysis. BMJ Open. (2021) 11:e043494. doi: 10.1136/bmjopen-2020-043494, PMID: [DOI] [PMC free article] [PubMed] [Google Scholar]
- 9.Zhu Y, Liu Z, Wang Y, Wang Z, Shi J, Xie X, et al. C-reactive protein, frailty and overnight hospital admission in elderly individuals: a population-based study. Arch Gerontol Geriatr. (2016) 64:1–5. doi: 10.1016/j.archger.2015.08.009, PMID: [DOI] [PubMed] [Google Scholar]
- 10.Wu C, Smit E, Xue QL, Odden MC. Prevalence and correlates of frailty among community-dwelling Chinese older adults: the China health and retirement longitudinal study. J Gerontol A Biol Sci Med Sci. (2017) 73:102–8. doi: 10.1093/gerona/glx098, PMID: [DOI] [PMC free article] [PubMed] [Google Scholar]
- 11.Li J, Zhao D, Dong B, Yu D, Ren Q, Chen J, et al. Frailty index and its associations with self-neglect, social support and sociodemographic characteristics among older adults in rural China. Geriatr Gerontol Int. (2018) 18:987–96. doi: 10.1111/ggi.13280, PMID: [DOI] [PubMed] [Google Scholar]
- 12.Ma L, Tang Z, Zhang L, Sun F, Li Y, Chan P. Prevalence of frailty and associated factors in the community-dwelling population of China. J Am Geriatr Soc. (2018) 66:559–64. doi: 10.1111/jgs.15214, PMID: [DOI] [PubMed] [Google Scholar]
- 13.Gu J, Chen H, Gu X, Sun X, Pan Z, Zhu S, et al. Frailty and associated risk factors in elderly people with health examination in rural areas of China. Iran J Public Health. (2019) 48:1663–70. doi: 10.18502/ijph.v48i9.3026, PMID: [DOI] [PMC free article] [PubMed] [Google Scholar]
- 14.Huang CY, Lee WJ, Lin HP, Chen RC, Lin CH, Peng LN, et al. Epidemiology of frailty and associated factors among older adults living in rural communities in Taiwan. Arch Gerontol Geriatr. (2020) 87:103986. doi: 10.1016/j.archger.2019.103986, PMID: [DOI] [PubMed] [Google Scholar]
- 15.Solfrizzi V, Scafato E, Lozupone M, Seripa D, Schilardi A, Custodero C, et al. Biopsychosocial frailty and the risk of incident dementia: the Italian longitudinal study on aging. Alzheimers Dement. (2019) 15:1019–28. doi: 10.1016/j.jalz.2019.04.013, PMID: [DOI] [PubMed] [Google Scholar]
- 16.Morley JE, Vellas B, van Kan GA, Anker SD, Bauer JM, Bernabei R, et al. Frailty consensus: a call to action. J Am Med Dir Assoc. (2013) 14:392–7. doi: 10.1016/j.jamda.2013.03.022, PMID: [DOI] [PMC free article] [PubMed] [Google Scholar]
- 17.Ensrud KE, Kats AM, Schousboe JT, Taylor BC, Cawthon PM, Hillier TA, et al. Frailty phenotype and healthcare costs and utilization in older women. J Am Geriatr Soc. (2018) 66:1276–83. doi: 10.1111/jgs.15381, PMID: [DOI] [PMC free article] [PubMed] [Google Scholar]
- 18.Hoogendijk EO, Afilalo J, Ensrud KE, Kowal P, Onder G, Fried LP. Frailty: implications for clinical practice and public health. Lancet. (2019) 394:1365–75. doi: 10.1016/S0140-6736(19)31786-6 [DOI] [PubMed] [Google Scholar]
- 19.Lee T, Chung J, Song K, Ji Y. Prevalence and associated factors of cognitive frailty in community-dwelling older adults: results from the Korean longitudinal study of aging. Int J Older People Nursing. (2023) 18:e12576. doi: 10.1111/opn.12576, PMID: [DOI] [PubMed] [Google Scholar]
- 20.Angulo J, El Assar M, Álvarez-Bustos A, Rodríguez-Mañas L. Physical activity and exercise: strategies to manage frailty. Redox Biol. (2020) 35:101513. doi: 10.1016/j.redox.2020.101513, PMID: [DOI] [PMC free article] [PubMed] [Google Scholar]
- 21.Zhang XM, Cao S, Gao M, Xiao S, Xie X, Wu X. The prevalence of social frailty among older adults: a systematic review and meta-analysis. J Am Med Dir Assoc. (2023) 24:29–37.e9. doi: 10.1016/j.jamda.2022.10.007, PMID: [DOI] [PubMed] [Google Scholar]
- 22.Lorber M, Kmetec S, Davey A, Mlinar Reljić N, Fekonja Z, Kegl B. Associations between sleep quality, frailty, and quality of life among older adults in community and nursing home settings. Int J Environ Res Public Health. (2023) 20:4937. doi: 10.3390/ijerph20064937, PMID: [DOI] [PMC free article] [PubMed] [Google Scholar]
- 23.Ge F, Liu M, Tang S, Lu Y, Szanton SL. Assessing frailty in Chinese nursing home older adults: a comparison between the frail-NH scale and frailty index. J Nutr Health Aging. (2019) 23:291–8. doi: 10.1007/s12603-019-1156-3, PMID: [DOI] [PubMed] [Google Scholar]
- 24.Zeng X-z, Meng L-b, Li Y-y, Jia N, Shi J, Zhang C, et al. Prevalence and factors associated with frailty and pre-frailty in the older adults in China: a national cross-sectional study. Front Public Health. (2023) 11:1110648. doi: 10.3389/fpubh.2023.1110648, PMID: [DOI] [PMC free article] [PubMed] [Google Scholar]
- 25.Zhao M, Gao J, Li M, Wang K. Relationship between loneliness and frailty among older adults in nursing homes: the mediating role of activity engagement. J Am Med Dir Assoc. (2019) 20:759–64. doi: 10.1016/j.jamda.2018.11.007, PMID: [DOI] [PubMed] [Google Scholar]
- 26.Chen J, Wang Y, Wen J, Fang F, Song M. The influences of aging population and economic growth on Chinese rural poverty. J Rual Studies. (2016) 47:665–76. doi: 10.1016/j.jrurstud.2015.11.002, PMID: 39963269 [DOI] [Google Scholar]
- 27.Kendall M. Multivariate Analysis. London: Charles Griffin & Company Ltd. (1975). [Google Scholar]
- 28.Thompson MQ, Theou O, Tucker GR, Adams RJ, Visvanathan R. FRAIL scale: predictive validity and diagnostic test accuracy. Australas J Ageing. (2020) 39:e529–36. doi: 10.1111/ajag.12829, PMID: [DOI] [PubMed] [Google Scholar]
- 29.Sheikh JI, Yesavage JA. Geriatric depression scale (GDS): recent evidence and development of a shorter version. Clin Gerontol. (1986) 5:165–73. doi: 10.1300/J018v05n01_09, PMID: 25098710 [DOI] [Google Scholar]
- 30.Tang D. Application of short form geriatric depression scale (GDS-15) in Chinese elderly. Chinese J Clinical Psycho. (2013) 21:402–5. doi: 10.16128/j.cnki.1005-3611.2013.03.036 [DOI] [Google Scholar]
- 31.Kwan MM, Tsang WW, Close JC, Lord SR. Development and validation of a Chinese version of the falls efficacy scale international. Arch Gerontol Geriatr. (2013) 56:169–74. doi: 10.1016/j.archger.2012.10.007, PMID: [DOI] [PubMed] [Google Scholar]
- 32.Yardley L, Beyer N, Hauer K, Kempen G, Piot-Ziegler C, Todd C. Development and initial validation of the falls efficacy scale-international (FES-I). Age Ageing. (2005) 34:614–9. doi: 10.1093/ageing/afi196, PMID: [DOI] [PubMed] [Google Scholar]
- 33.Guo QY, Guo MJ, Zhang L, Li D, Guo LN, Gao H, et al. Evaluation of the reliability and validity of Chinese version of falls efficacy scale. Chinese General Practice. (2015) 18:4273–6. doi: 10.3969/j.issn.1007-9572.2015.35.001 [DOI] [Google Scholar]
- 34.Kaiser MJ, Bauer JM, Ramsch C, Uter W, Guigoz Y, Cederholm T, et al. Validation of the Mini nutritional assessment short-form (MNA-SF): a practical tool for identification of nutritional status. J Nutr Health Aging. (2009) 13:782–8. doi: 10.1007/s12603-009-0214-7, PMID: [DOI] [PubMed] [Google Scholar]
- 35.He Yangli, Jian Zaijin. The application and evaluation of the elderly malnutrition assessment methods. Chinese J Geriatrics (2000)12: 278–281. id: wpr-540990 [Google Scholar]
- 36.Krishnamoorthy Y, Vijayageetha M, Saya GK. Validation and reliability assessment of the Mini-nutritional assessment-short form questionnaire among older adults in South India. Indian J Community Med. (2021) 46:70–4. doi: 10.4103/ijcm.IJCM_208_20, PMID: [DOI] [PMC free article] [PubMed] [Google Scholar]
- 37.Montejano Lozoya R, Martínez-Alzamora N, Clemente Marín G, Guirao-Goris SJA, Ferrer-Diego RM. Predictive ability of the Mini nutritional assessment short form (MNA-SF) in a free-living elderly population: a cross-sectional study. PeerJ. (2017) 5:e3345. doi: 10.7717/peerj.3345, PMID: [DOI] [PMC free article] [PubMed] [Google Scholar]
- 38.White N, Parsons R, Collins G, Barnett A. Evidence of questionable research practices in clinical prediction models. BMC Med. (2023) 21:339. doi: 10.1186/s12916-023-03048-6, PMID: [DOI] [PMC free article] [PubMed] [Google Scholar]
- 39.Nguyen AT, Nguyen LH, Nguyen TX, Nguyen HTT, Nguyen TN, Pham HQ, et al. Frailty prevalence and association with health-related quality of life impairment among rural community-dwelling older adults in Vietnam. Int J Environ Res Public Health. (2019) 16:3869. doi: 10.3390/ijerph16203869, PMID: [DOI] [PMC free article] [PubMed] [Google Scholar]
- 40.Abe T, Kitamura A, Seino S, Yokoyama Y, Amano H, Taniguchi Y, et al. Differences in the prevalence of and factors associated with frailty in five Japanese residential areas. Int J Environ Res Public Health. (2019) 16:3974. doi: 10.3390/ijerph16203974, PMID: [DOI] [PMC free article] [PubMed] [Google Scholar]
- 41.Ahmad NS, Hairi NN, Said MA, Kamaruzzaman SB, Choo WY, Hairi F, et al. Prevalence, transitions and factors predicting transition between frailty states among rural community-dwelling older adults in Malaysia. PLoS One. (2018) 13:e0206445. doi: 10.1371/journal.pone.0206445, PMID: [DOI] [PMC free article] [PubMed] [Google Scholar]
- 42.Lewis EG, Coles S, Howorth K, Kissima J, Gray W, Urasa S, et al. The prevalence and characteristics of frailty by frailty phenotype in rural Tanzania. BMC Geriatr. (2018) 18:283. doi: 10.1186/s12877-018-0967-0, PMID: [DOI] [PMC free article] [PubMed] [Google Scholar]
- 43.Llano PMP, Lange C, Sequeira CADC, Jardim VMDR, Castro DSP, Santos F. Factors associated with frailty syndrome in the rural elderly. Rev Bras Enferm. (2019) 72:14–21. doi: 10.1590/0034-7167-2017-0079, PMID: [DOI] [PubMed] [Google Scholar]
- 44.Kim MJ, Seo SH, Seo AR, Kim BK, Lee GY, Choi YS, et al. The association of perceived neighborhood walkability and environmental pollution with frailty among community-dwelling older adults in Korean rural areas: a cross-sectional study. J Prev Med Public Health. (2019) 52:405–15. doi: 10.3961/jpmph.19.166, PMID: [DOI] [PMC free article] [PubMed] [Google Scholar]
- 45.Yu P, Song X, Shi J, Mitnitski A, Tang Z, Fang X, et al. Frailty and survival of older Chinese adults in urban and rural areas: results from the Beijing longitudinal study of aging. Arch Gerontol Geriatr. (2012) 54:3–8. doi: 10.1016/j.archger.2011.04.020, PMID: [DOI] [PubMed] [Google Scholar]
- 46.Shi C, Xu Y, Chen Y, Pu H, Yu Q, Wu X, et al. Perceptions and experiences of risk management by managers of residential aged care facilities: a qualitative study from Hunan Province, China. Inter J Qualitative Studies Health Well-Being. (2021) 16:1978724. doi: 10.1080/17482631.2021.197872 [DOI] [PMC free article] [PubMed] [Google Scholar]
- 47.Zhang Y. An empirical study on the factors influencing autonomous participation in learning activities among elderly groups in the context of lifelong learning. Chinese J Aging Research. (2023) 10:726–34. doi: 10.12677/AR.2023.103094 [DOI] [Google Scholar]
- 48.EY YJ, Niu L, Lu C. The impact of internet use on health status among older adults in China: the mediating role of social support. Front Public Health. (2023) 11:1108096. doi: 10.3389/fpubh.2023.1108096, PMID: [DOI] [PMC free article] [PubMed] [Google Scholar]
- 49.Facal D, Burgo C, Spuch C, Gaspar P, Campos-Magdaleno M. Cognitive frailty: an update. Front Psychol. (2021) 12:813398. doi: 10.3389/fpsyg.2021.813398, PMID: [DOI] [PMC free article] [PubMed] [Google Scholar]
- 50.Wongtrakulruang P, Muangpaisan W, Panpradup B, Tawatwattananun A, Siribamrungwong M, Tomongkon S. The prevalence of cognitive frailty and pre-frailty among older people in Bangkok metropolitan area: a multicenter study of hospital-based outpatient clinics. J Frail Sarcopenia Falls. (2020) 5:62–71. doi: 10.22540/JFSF-05-062, PMID: [DOI] [PMC free article] [PubMed] [Google Scholar]
- 51.Zhang Y, Liang YP, Sun MW, Huang LF, Lian TY, Huang JX, et al. Analysis on influencing factors of the frailty of the elderly. Chinese J Disease Control Prevention. (2019) 12:140–5. doi: 10.16462/j.cnki.zhjbkz.2019.02.004 [DOI] [Google Scholar]
- 52.Thinuan P, Siviroj P, Lerttrakarnnon P, Lorga T. Prevalence and potential predictors of frailty among community-dwelling older persons in northern Thailand: a cross-sectional study. Int J Environ Res Public Health. (2020) 17:4077. doi: 10.3390/ijerph17114077, PMID: [DOI] [PMC free article] [PubMed] [Google Scholar]
- 53.Soysal P, Veronese N, Thompson T, Kahl KG, Fernandes BS, Prina AM, et al. Relationship between depression and frailty in older adults: a systematic review and meta-analysis. Ageing Res Rev. (2017) 36:78–87. doi: 10.1016/j.arr.2017.03.005, PMID: [DOI] [PubMed] [Google Scholar]
- 54.Lu J, Guo QQ, Wang Y, Zuo ZX, Li YY. The evolutionary stage of cognitive frailty and its changing characteristics in old adults. J Nutr Health Aging. (2021) 25:467–78. doi: 10.1007/s12603-020-1560-8, PMID: [DOI] [PubMed] [Google Scholar]
- 55.Kelaiditi E, Cesari M, Canevelli M, Abellan van Kan G, Ousset PJ, Gillette-Guyonnet S, et al. Cognitive frailty: rational and definition from an (IANA/IAGG) international consensus group. J Nutr Health Aging. (2013) 17:726–34. doi: 10.1007/s12603-013-0367-2, PMID: [DOI] [PubMed] [Google Scholar]
- 56.Ruan Q, Yu Z, Chen M, Bao Z, Li J, He W. Cognitive frailty, a novel target for the prevention of elderly dependency. Ageing Res Rev. (2015) 20:1–10. doi: 10.1016/j.arr.2014.12.004, PMID: [DOI] [PubMed] [Google Scholar]
- 57.Jiang R, Noble S, Rosenblatt M, Dai W, Ye J, Liu S, et al. The brain structure, inflammatory, and genetic mechanisms mediate the association between physical frailty and depression. Nat Commun. (2024) 15:4411. doi: 10.1038/s41467-024-48827-8, PMID: [DOI] [PMC free article] [PubMed] [Google Scholar]
- 58.Wei K, Lin S, Yang J, Li C. Dietary habits and depression in community-dwelling Chinese older adults: cross-sectional analysis of the moderating role of physical exercise. Nutrients. (2024) 16:740. doi: 10.3390/nu16050740, PMID: [DOI] [PMC free article] [PubMed] [Google Scholar]
- 59.Gaspar PM, Campos-Magdaleno M, Pereiro AX, Facal D, Juncos-Rabadán O. Cognitive reserve and mental health in cognitive frailty phenotypes: insights from a study with a Portuguese sample. Front Psychol. (2022) 13:968343. doi: 10.3389/fpsyg.2022.968343, PMID: [DOI] [PMC free article] [PubMed] [Google Scholar]
- 60.Rogers NT, Marshall A, Roberts CH, Demakakos P, Steptoe A, Scholes S. Physical activity and trajectories of frailty among older adults: evidence from the English longitudinal study of ageing. PLoS One. (2017) 12:e0170878. doi: 10.1371/journal.pone.0170878, PMID: [DOI] [PMC free article] [PubMed] [Google Scholar]
- 61.Chen X, Zhao L, Liu Y, Zhou Z, Zhang H, Wei D, et al. Otago exercise programme for physical function and mental health among older adults with cognitive frailty during COVID-19: a randomised controlled trial. J Clin Nurs. (2021) 6:1–14. doi: 10.1111/jocn.15964, PMID: [DOI] [PMC free article] [PubMed] [Google Scholar]
- 62.Dobarro D, Costas-Vila A, Melendo-Viu M, Cordeiro-Rodríguez M, Íñiguez-Romo A, Rodríguez-Pascual C. Home exercise intervention with the Vivifrail program in frail older patients with heart failure with reduced ejection fraction. The ExFRAIL-HF randomized trial. Rev Esp Cardiol. (2023) 76:939–943. doi: 10.1016/j.rec.2023.06.001 [DOI] [PubMed] [Google Scholar]
- 63.Liu T, Wang C, Sun J, Chen W, Meng L, Li J, et al. The effects of an integrated exercise intervention on the attenuation of frailty in elderly nursing homes: a cluster randomized controlled trial. J Nutr Health Aging. (2022) 26:222–9. doi: 10.1007/s12603-022-1745-4, PMID: [DOI] [PubMed] [Google Scholar]
- 64.Esbrí-Víctor M, Huedo-Rodenas I, López-Utiel M, Navarro-López JL, Martínez-Reig M, Serra-Rexach JA, et al. Frailty and fear of falling: the FISTAC study. J Frailty Aging. (2017) 6:136–40. doi: 10.14283/jfa.2017.19, PMID: [DOI] [PubMed] [Google Scholar]
- 65.Makino K, Lee S, Bae S, Chiba I, Harada K, Katayama O, et al. Prospective associations of physical frailty with future falls and fear of falling: a 48-month cohort study. Phys Ther. (2021) 101:pzab059. doi: 10.1093/ptj/pzab059, PMID: [DOI] [PubMed] [Google Scholar]
- 66.Qin Y, Li J, McPhillips M, Lukkahatai N, Yu F, Li K. Association of fear of falling with frailty in community-dwelling older adults: a cross-sectional study. Nurs Health Sci. (2021) 23:516–24. doi: 10.1111/nhs.12840, PMID: [DOI] [PMC free article] [PubMed] [Google Scholar]
Associated Data
This section collects any data citations, data availability statements, or supplementary materials included in this article.
Supplementary Materials
Data Availability Statement
The raw data supporting the conclusions of this article will be made available by the authors, without undue reservation.