

Abstract
High body mass index (BMI) is generally assumed to represent overall amounts of body adipose tissue (fat). Increased adipose tissue amounts in persons with increased BMI has been cited as a barrier to assessment of body tissues such as muscle. Significant increases in the amount of adipose tissue between the dermal layer and the skull may result in high electrical impedance and/or increased light diffusion causing a lower signal to noise ratio during use of neuroimaging tools such as electroencepholography (EEG), transcranial direct current stimulation (tDCS), and functional near infrared spectroscopy (fNIRS). Investigating how subcutaneous adipose tissue in the head region increases with respect to total body fat percentage and BMI is an important step in developing mathematical corrections in neuroimaging measurements as BMI increases, as recommended in other measurement modalities such as electromyography (EMG). We hypothesized that percentage of subcutaneous adipose tissue in the head region would increase with respect to both total body fat percentage and BMI. A statistically significant increase in subcutaneous head fat percentage occurred with increased BMI and total body fat percentage. The data investigated in this study indicate that participant age, sex, and BMI are important features to consider in model corrections during data signal processing and analyses for subcutaneous head fat in neuroimaging approaches. The data in this project serve to provide physiological justification for this practice along with regression analyses to be considered for physiologically-based signal to noise correction algorithms.
Keywords: Aging, Head fat, Body fat, Sex differences, EEG, fNIRS, tDCS
1. Introduction
The terms overweight and obesity are defined as abnormal or excessive adipose tissue (fat) accumulation that may impair health; specifically, with Body Mass Index (BMI) ≥ 25 kg/m2 and 30 kg/m2, respectively (Obesity and overweight, 2022). The World Health Organization (WHO) estimates that >1.9 billion adults (39% of the population) are overweight worldwide; with 650 million obese adults in 2016 (Obesity and overweight, 2022). The worldwide prevalence of obesity nearly tripled between 1975 and 2016 (Obesity and overweight, 2022). BMI has been widely used as the primary classification method for identifying different weight groups; however, BMI only takes body mass and height into consideration. Commonly, high BMI is assumed to represent increased body fat amount; however, BMI does not have a direct one-to-one relationship with the total percentage of body fat. BMI has exhibited a curvilinear relationship with body fat percentage that is impacted by age (Meeuwsen, Horgan, & Elia, 2010), resulting in a moderate curvilinear correlation between BMI and body fat that may be influenced by other physiological factors beyond aging (CDC, 2021). Epidemiologically, BMI is strongly correlated with poor metabolic health and poor health outcomes (Flegal & Graubard, 2009; Sun et al., 2010; Willett, Jiang, Lenart, Spiegelman, & Willett, 2006).
Recently, interest in the influence of increased body fat on human sensorimotor function has emerged in the evidence base. Increased adipose tissue and BMI has been cited as a barrier to assessment of motor function and muscle tissue via electromyography (EMG) (Lanza, Balshaw, Massey, & Folland, 2018; Mendez-Rebolledo et al., 2019; Ptaszkowski, Wlodarczyk, & Paprocka-Borowicz, 2019). Similarly, increased adipose tissue has been hypothesized to be a barrier for assessment of tissue via near infrared spectroscopy (NIRS) (Mustafa, Jones, & McEwan, 2017; Yang, Soyemi, Landry, & Soller, 2005). Lack of consideration of these confounds may result in phenotypic biases and exclusion of imaging data due to poor signal to noise ratios in collected from individuals with increased adiposity (Webb, Etter, & Kwasa, 2022). Little to no data is available regarding the influence of subcutaneous head fat on signal to noise ratios in most neuroimaging modalities; with the exception of consideration of fat in magnetic resonance imaging (MRI) (Bachrata, Trattnig, & Robinson, 2022; von Deuster et al., 2021). This is a significant concern given the increased interest in prediction of poor long-term health outcomes pertaining to neurological and muscular health using non-invasive techniques (e.g., detecting early signs of dementia via sensorimotor monitoring (Boutajangout, Li, Quartermain, & Sigurdsson, 2012)). Reinforcement of phenotypic biases due to lack of consideration of adipose impacts on non-MRI signal to noise characteristics may further widen gaps in assessment and treatment of significant long-term health conditions (e.g., dementia) in persons with increased adipose tissue.
In light of these biases, adiposity should be considered as a potential confounder of cortical activity measurement with respect to neuroimaging methods that measure physiological activity through the derma, such as electroencepholography (EEG), functional near infrared spectroscopy (fNIRS), and transcranial direct current stimulation (tDCS). Specifically, significant increases in the amount of subcutaneous adipose tissue—located between the dermal layer and the skull—may result in high electrical impedance (for EEG and tDCS) and increased light diffusion (for NIRS and fNIRS) causing a low signal to noise ratios during use of neuroimaging methods that measure physiological activity through the derma. In consideration of this, investigating how subcutaneous adipose tissue in the head region increases with respect to percentage of total body fat and BMI is an important step in determining whether mathematical corrections in neuroimaging measurements such as EEG, tDCS, fNIRS, and other neuroimaging methods that measure physiological activity through the derma need to be implemented as BMI increases, consisted with recommendations in EMG assessment (Lanza et al., 2018; Mendez-Rebolledo et al., 2019; Ptaszkowski et al., 2019).
Accordingly, the purpose of the current study was to assess the relationship between common adiposity metrics such as BMI and percentage of subcutaneous adipose tissue in the head region across the lifespan in adults. We expected percentage of subcutaneous adipose tissue in the head region to increase with respect to both percentage of total body fat percentage and BMI. This information may be used by researchers in biomechanics and motor control in accounting for worsened signal to noise ratios caused by subcutaneous adipose tissue in the head region.
2. Methods
2.1. Study participants
Data from the National Health and Nutrition Examination Survey (NHANES) 2005–2006 were utilized, which included body composition scanning data for a sample of adults living in the United States aged 20–69 years. Data from NHANES 2005–2006 age groups of 18–19 were excluded from this analysis due to NHANES purposeful oversampling of individuals aged ≤19 years in that particular data set. The data set used for this study included individuals with a wide variety of BMI values ranging from 14.65 kg/m2 to 130.21 kg/m2. Given that the NHANES data set did not include individuals considered to be in late older age (aged 74+ years), the NHANES data set was augmented by our own collected data from 30 healthy older adults (aged 61–89 years) with BMIs ranging from 18 to 30 kg/m2 (Meng & Gorniak, 2020, 2022). Data from 3976 participants was sorted for analysis (1871 males and 2105 females). Of the 3976 participants, 63 only reported age and sex (either no anthropometry or DXA values reported); 3913 participants with anthropometric data were assessed in the presented models. Participant demographics for the entire initial sample (n = 3976) can be found in Table 1. Characteristics of individuals in commonly considered BMI groups (normal weight (NW), BMI ≤ 24.9 kg/m2; overweight (OW), BMI: 25.0–29.9 kg/m2; and the obese groups (OB), BMI ≥ 30.0 kg/m2) based on anthropometry (n = 3913) can be found in Table 2. The protocol for the data collected in our lab for this study was reviewed and approved by the Committees for the Protection of Human Subjects/Institutional Review Board (CPHS/IRB) at the University of Houston. All participants provided written informed consent. The work described here has been carried out in accordance with The Code of Ethics of the World Medical Association (Declaration of Helsinki) for experiments involving humans.
Table 1.
Age, anthropometry, BMI, total body fat %, and head fat % across the initial sample. Range of data [minimum – maximum] are also included for reference.
| Entire Sample | ||
|---|---|---|
|
| ||
| # Subjects | 3976 | |
| Males: Females | 1871: 2105 | |
|
| ||
| Mean ± SD | [min – max] | |
|
| ||
| Age (years) | 42 ± 14 | [20–89] |
| Height (m) | 1.68 ± 0.10 | [1.40–2.04] |
| Mass (kg) | 82.27 ± 21.67 | [36.70–371.00] |
| BMI (kg/m2) | 29.00 ± 6.87 | [14.65–130.21] |
| Total Body Fat Percent (%) | 33.69 ± 8.90 | [10.60–56.50] |
| Head Fat Percent (%) | 23.86 ± 0.78 | [20.50–28.30] |
Table 2.
Age, anthropometry, BMI, total body fat %, and subcutaneous head fat % for each commonly referenced BMI range within the assessed data set (n = 3913). Range of data [minimum – maximum] are also included for reference.
| Normal Weight (NW) | Overweight (OW) | Obese (OB) | ||||
|---|---|---|---|---|---|---|
|
| ||||||
| # Subjects | 1159 | 1317 | 1437 | |||
| Males: Females | 486: 673 | 743: 574 | 606: 831 | |||
|
| ||||||
| Mean ± SD | [min – max] | Mean ± SD | [min – max] | Mean ± SD | [min – max] | |
|
| ||||||
| Age (years) | 39 ± 15 | [20–83] | 42 ± 14 | [20–89] | 44 ± 14 | [20–82] |
| Height (m) | 1.68 ± 0.10 | [1.45–2.01] | 1.69 ± 0.10 | [1.40–2.04] | 1.67 ± 0.10 | [1.40–1.99] |
| Mass (kg) | 62.85 ± 9.54 | [36.70–98.20] | 78.79 ± 10.46 | [51.20–124.20] | 100.91 ± 20.58 | [59.40–371.0] |
| BMI (kg/m2) | 22.26 ± 2.03 | [14.65–24.99] | 27.39 ± 1.43 | [25.01–29.99] | 35.91 ± 6.08 | [30.01–130.21] |
| Total Body Fat Percent (%) | 28.06 ± 7.65 | [10.60–52.60] | 32.21 ± 7.37 | [15.40–50.40] | 39.59 ± 7.51 | [21.80–56.50] |
| Head Fat Percent (%) | 23.32 ± 0.48 | [20.50–25.60] | 23.75 ± 0.53 | [21.80–26.30] | 24.38 ± 0.81 | [22.20–28.30] |
2.2. Procedure
Each participant’s body mass (kg) and height (m) were measured. BMI was calculated as kg/m2. Body composition of each participant was measured via Hologic DXA (NHANES: Hologic QDR-4500A, Hologic, Inc., Bedford, MA, USA; University of Houston: Discovery W, Hologic, Inc., Bedford, MA, USA). DXA-based outcome measures included percentage of total body fat and head region composition (including head fat percentage).
2.3. Statistical analyses
Data were evaluated via multiple regression analyses via SPSS 25 (IBM Corporation, Armonk, NY, USA) with follow-up individual correlation analyses via Minitab 17 (Minitab LLC, State College, PA, USA). Linear, quadratic, and logarithmic best fit regression models were evaluated. Age, BMI, total body fat %, and head fat % were considered continuous variables. Sex (two levels: coded as male = 0 and female = 1) was considered as a categorical variable. Follow-up regressions were performed to assess strength of relationships among individual variables. DXA data from NHANES 2005–2006 was considered in imputation batches as per recommendations by the US Centers for Disease Prevention and Control (CDC) (CDC, 2022). Data from the five imputation batches converged to the models presented in the results section The model produced by imputation #1 is presented in this manuscript. A total of 3 outliers were removed from the imputation #1 data set after diagnosis using Cook’s D. Multi-collinearity was assessed using variance inflation factors (VIF). All regression models had VF values ranging from 1.003 to 2.007.
3. Results
The means, standard deviations, and range values of age, body mass, height, BMI, total body fat percentage, and head fat percentage are listed Tables 1–2. Regression analyses confirmed significant relationships among adiposity measures of interest (total body fat percentage, head fat percentage, and BMI). Regression data results and equation details can be found in Table 3. Age and sex were found to significantly impact all adiposity relationships, see Table 3 for details. The relationship between BMI and total body fat percentage was found to be logarithmic. Linear regressions between head fat percentage and measures of full body adiposity (BMI and total body fat percentage) were found.
Table 3.
Regression analyses output.
| Factor | Coefficient | t-value | p-value |
|---|---|---|---|
| BMI & Total Body Fat Regression Model (r = 0.9047, adjusted r2 = 81.85%) | |||
| Age (years) | 0.06948 | 15.58 | < 0.001 |
| log10(BMI) (log10(kg/m2)) | 53.4050 | 79.25 | < 0.001 |
| Sex | 11.7440 | 92.84 | < 0.001 |
| Regression constant | −52.5810 | −54.16 | < 0.001 |
| Total Body Fat & Head Fat Regression Model (r = 0.62, adjusted r2 = 38.4%) | |||
| Age (years) | 0.0033 | 4.50 | < 0.001 |
| Total body fat (%) | 0.0692 | 43.07 | < 0.001 |
| Sex | −1.0619 | −37.93 | < 0.001 |
| Regression constant | 20.9004 | 25.98 | < 0.001 |
| BMI & Head Fat Regression Model (r = 0.668, adjusted r2 = 44.6%) | |||
| Age (years) | 0.0072 | 10.71 | < 0.001 |
| BMI (kg/m2) | 0.0718 | 49.50 | < 0.001 |
| Sex | −0.2791 | −14.55 | < 0.001 |
| Regression constant | 21.5959 | 437.34 | < 0.001 |
A very strong positive correlation between log10(BMI) and total body fat percentage was found (r = 0.9047), along with strong positive linear correlations between head fat percentage and markers of whole-body adiposity (r = 0.668 for head fat percentage vs. BMI; and r = 0.62 for head fat percentage vs. total body fat percentage). Scatterplots of relationships among total body fat percentage, head fat percentage, and BMI can be found in Fig. 1A–E. While total body fat percentage strongly increased with BMI (a maximum total body fat of 56.5% was observed), an increase of only 7.8% in head fat percentage with BMI was observed across the entire sample. The change in adiposity measures across BMI categories (NW, OW, and OB) is shown in Fig. 2; average data for the NW, OW, and OB groups are shown for clarity.
Fig. 1.

Scatterplots of BMI, total body fat percentage, and head fat percentage data. Black dots represent actual data points; the red line and corresponding red equation are regression fits from Table 3. The regression fit in Panel A includes the sex indicator variable (1 = female) in the equation. Panels A-C share axes values to show magnitude changes across the same (full) scale whereas panels D-E illustrate data variability according to adjusted (magnified) scale. A: Total body fat percentage vs. BMI. B: Head fat percentage versus BMI (full scale). C: Head fat percentage versus total body fat percentage (full scale). D: Head fat percentage versus BMI (magnified scale). E: Head fat percentage versus total body fat percentage (magnified scale). (For interpretation of the references to colour in this figure legend, the reader is referred to the web version of this article.)
Fig. 2.
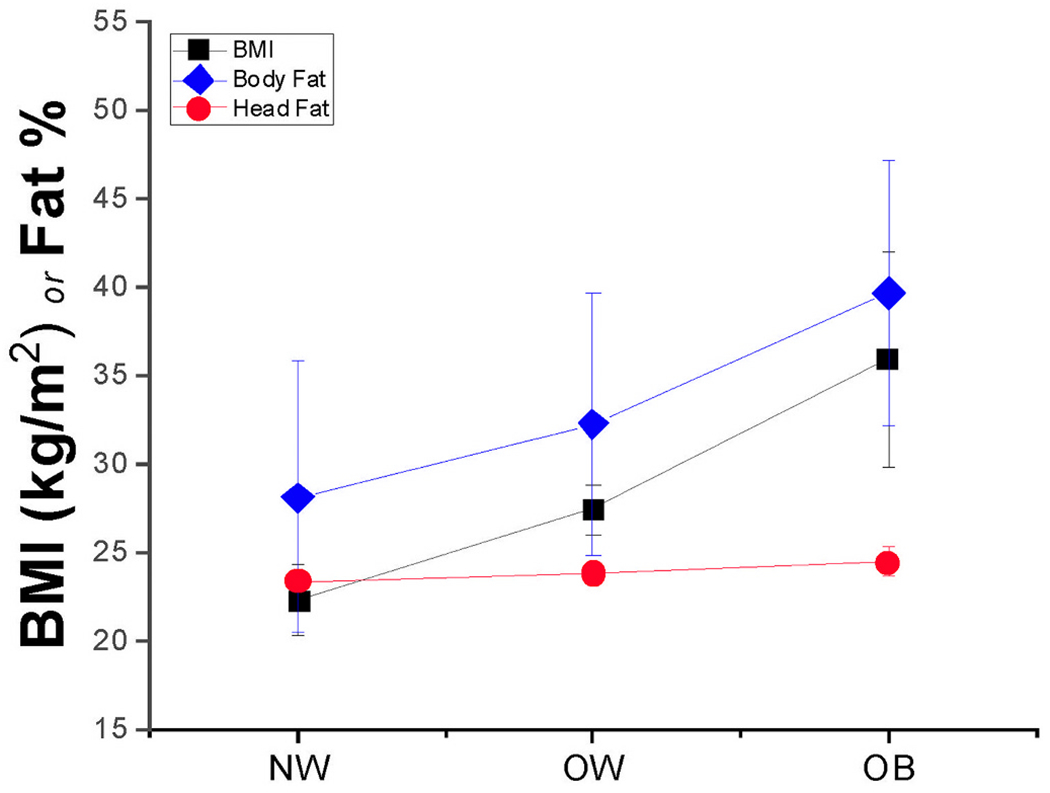
BMI (in black squares), total body fat percentage (in blue diamonds), and head fat percentage (in red circles) mean ± SD values across the three commonly considered BMI groups: Normal Weight (NW), Overweight (OW), and Obese (OB). (For interpretation of the references to colour in this figure legend, the reader is referred to the web version of this article.)
The equation describing the relationship between BMI and total body fat percentage is:
| (1) |
where total body fat is in %, age is in years, BMI is in kg/m2, and sex is coded as male = 0 and female = 1.
The equation describing the relationship between total body fat percentage and subcutaneous head fat percentage is:
| (2) |
where subcutaneous head fat is in %, age is in years, total body fat is in %, and sex is coded as male = 0 and female = 1.
The equation describing the relationship between BMI and subcutaneous head fat percentage is:
| (3) |
where subcutaneous head fat is in %, age is in years, BMI is in kg/m2, and sex is coded as male = 0 and female = 1.
4. Discussion
The overall goal of this manuscript was to assess potential increased percentage of subcutaneous adipose tissue in the head region in adults based on common adiposity metrics such as BMI. We hypothesized that percentage of subcutaneous adipose tissue in the head region to increase with respect to both percentage of total body fat percentage and BMI. A statistically significant increase in subcutaneous head fat percentage occurred with increases in both BMI (r = 0.668) and total body fat percentage (r = 0.62). The relationships among adiposity measures of interest were also influenced by participant age and sex. While head fat percentage did not increase as much as total percentage body fat with BMI, increased subcutaneous adiposity within the head region is likely to interfere with neuroimaging tools that measure through the derma. The data investigated in this study indicate that participant age, sex, and BMI should be considered in model corrections for subcutaneous head fat in neuroimaging approaches that measure physiological activity through the derma.
The rationale of this project was to evaluate the potential for impacts of fat distribution on common neuroimaging tools used in biomechanics and motor control. Amount of subcutaneous fat distribution in the head may have a significant impact on neuroimaging tools that encounter the dermal and subdermal tissues as a source of electrical impedance (e.g., EEG, tDCS) or light diffusion (e.g., fNIRS). A computational model previously indicated that differences in head fat thickness may contribute up to an extra 10% variability in tDCS peak cortical current density beyond that exhibited by normal weight individuals (Truong, Magerowski, Blackburn, Bikson, & Alonso-Alonso, 2013). Therefore, understanding the relationship between BMI and subcutaneous head fat percent could help researchers accurately account for the impacts of body fat amount and distribution on neuroimaging tools using evidence-based mathematical corrections from gold-standard physiological measurements of body fat, as suggested by Taberna, Samogin, Marino, & Mantini, 2021.
Specifically, use of BMI in model corrections in consideration of head fat percentage as a source of noise in neuroimaging is recommended based on the r2 values found in this study (as compared to total body fat percentage). Additionally, use of BMI in model corrections will be easier to implement for most investigators, as it only requires basic anthropometric data such as height and mass, whereas accurate assessment of total body fat using gold-standard techniques requires access and use of DXA technology. Consideration of subcutaneous adipose tissue of the head may alleviate phenotypic biases and exclusion of cortical imaging data due to poor signal to noise ratios caused by increased adipose tissue, thereby providing a more inclusive approach to neuroimaging (Webb et al., 2022).
Signal to noise corrections to account for subcutaneous head fat should be explored for each measurement modality and manufacturer, as signal characteristic changes with subcutaneous head fat, BMI, sex, age, and equipment are outside of the scope of this project. The data in this project serve to provide physiological justification for the practice along with regression analyses to be considered for physiologically-based signal to noise correction algorithms. These suggestions are in line with a previous study which indicated that older adults have worse connectivity and accuracy of EEG signals due to the reduction of water content in body tissues with advanced age (Wendel, Väisänen, Seemann, Hyttinen, & Malmivuo, 2010) as well as the observations of Truong and colleagues with respect to tDCS (Truong et al., 2013).
Acknowledgements
This project acknowledges recruitment assistance from the Weekly Family YMCA Houston. The authors would like to thank: Dr. Jasmine Kwasa and Dr. Kate Webb for their work and advocacy in addressing phenotypic biases in human neuroscience methods, and Dr. Christopher Arellano for his comments on regression assumptions in large data sets.
Funding
Funding support for this project was received from: (1) the Summer Research Support Program to HM in the Department of Health and Human Performance at the University of Houston to support dissertation data collection for this project, and (2) by the American Heart Association via #16BGIA27250047 to SLG.
Abbreviations:
- EEG
electroencepholography
- fNIRS
functional near infrared spectroscopy
- tDCS
transcranial direct current stimulation
Footnotes
CRediT authorship contribution statement
Stacey L. Gorniak: Conceptualization, Methodology, Formal analysis, Investigation, Data curation, Visualization, Project administration, Funding acquisition, Writing – original draft. Hao Meng: Formal analysis, Investigation, Funding acquisition, Writing – review & editing. Luca Pollonini: Conceptualization, Methodology, Writing – review & editing.
Declaration of Competing Interest
None.
References
- Bachrata B, Trattnig S, & Robinson SD (2022). Quantitative susceptibility mapping of the head-and-neck using SMURF fat-water imaging with chemical shift and relaxation rate corrections. Magnetic Resonance in Medicine, 87(3), 1461–1479. 10.1002/mrm.29069 [DOI] [PMC free article] [PubMed] [Google Scholar]
- Boutajangout A, Li YS, Quartermain D, & Sigurdsson EM (2012). Cognitive and sensorimotor tasks for assessing functional impairments in mouse models of Alzheimer’s disease and related disorders. Methods in Molecular Biology (Clifton, N.J.), 849. https://doi.org/10.1007/978-1-61779-551-0_35. 10.1007/978-1-61779-551-0_35 [DOI] [PMC free article] [PubMed] [Google Scholar]
- CDC. (2021). All about adult BMI. Centers for Disease Control and Prevention. August 27 https://www.cdc.gov/healthyweight/assessing/bmi/adult_bmi/index.html. [Google Scholar]
- CDC. (2022). NHANES 1999–2006 DXA Multiple Imputation Data Files. August 17 https://wwwn.cdc.gov/nchs/nhanes/dxa/dxa.aspx.
- von Deuster C, Sommer S, Germann C, Hinterholzer N, Heidemann RM, Sutter R, & Nanz D (2021). Controlling through-slice chemical-shift artifacts for improved non-fat-suppressed musculoskeletal turbo-spin-echo magnetic resonance imaging at 7 T. Investigative Radiology, 56(9), 545–552. 10.1097/RLI.0000000000000778 [DOI] [PubMed] [Google Scholar]
- Flegal KM, & Graubard BI (2009). Estimates of excess deaths associated with body mass index and other anthropometric variables. The American Journal of Clinical Nutrition, 89(4), 1213–1219. 10.3945/ajcn.2008.26698 [DOI] [PMC free article] [PubMed] [Google Scholar]
- Lanza MB, Balshaw TG, Massey GJ, & Folland JP (2018). Does normalization of voluntary EMG amplitude to MMAX account for the influence of electrode location and adiposity? Scandinavian Journal of Medicine & Science in Sports, 28(12), 2558–2566. 10.1111/sms.13270 [DOI] [PubMed] [Google Scholar]
- Meeuwsen S, Horgan GW, & Elia M (2010). The relationship between BMI and percent body fat, measured by bioelectrical impedance, in a large adult sample is curvilinear and influenced by age and sex. Clinical Nutrition (Edinburgh, Scotland), 29(5), 560–566. 10.1016/j.clnu.2009.12.011 [DOI] [PubMed] [Google Scholar]
- Mendez-Rebolledo G, Guzman-Muñoz E, Ramírez-Campillo R, Valdés-Badilla P, Cruz-Montecinos C, Morales-Verdugo J, & Berral de la Rosa FJ (2019). Influence of adiposity and fatigue on the scapular muscle recruitment order. PeerJ, 7, Article e7175. 10.7717/peerj.7175 [DOI] [PMC free article] [PubMed] [Google Scholar]
- Meng H, & Gorniak SL (2020). Effects of adiposity on postural control and cognition in older adults. Gait & Posture, 82, 147–152. 10.1016/j.gaitpost.2020.09.004 [DOI] [PubMed] [Google Scholar]
- Meng H, & Gorniak SL (2022). Obesity is associated with gait alterations and gait asymmetry in older adults. Motor Control, 1–14. 10.1123/mc.2021-0125 [DOI] [PubMed] [Google Scholar]
- Mustafa FH, Jones PW, & McEwan AL (2017). Near infrared spectroscopy for body fat sensing in neonates: Quantitative analysis by GAMOS simulations. Biomedical Engineering Online, 16(1), 14. 10.1186/s12938-016-0310-y [DOI] [PMC free article] [PubMed] [Google Scholar]
- Obesity and overweight (n.d.). Retrieved January 14, 2022, from https://www.who.int/news-room/fact-sheets/detail/obesity-and-overweight, (2022).
- Ptaszkowski K, Wlodarczyk P, & Paprocka-Borowicz M (2019). The relationship between the electromyographic activity of rectus and oblique abdominal muscles and bioimpedance body composition analysis—A pilot observational study. Diabetes, Metabolic Syndrome and Obesity: Targets and Therapy, 12, 2033–2040. 10.2147/DMSO.S215982 [DOI] [PMC free article] [PubMed] [Google Scholar]
- Sun Q, van Dam RM, Spiegelman D, Heymsfield SB, Willett WC, & Hu FB (2010). Comparison of dual-energy x-ray absorptiometric and anthropometric measures of adiposity in relation to adiposity-related biologic factors. American Journal of Epidemiology, 172(12), 1442–1454. 10.1093/aje/kwq306 [DOI] [PMC free article] [PubMed] [Google Scholar]
- Taberna GA, Samogin J, Marino M, & Mantini D (2021). Detection of resting-state functional connectivity from high-density electroencephalography data: Impact of head modeling strategies. Brain Sciences, 11(6), 741. 10.3390/brainsci11060741 [DOI] [PMC free article] [PubMed] [Google Scholar]
- Truong DQ, Magerowski G, Blackburn GL, Bikson M, & Alonso-Alonso M (2013). Computational modeling of transcranial direct current stimulation (tDCS) in obesity: Impact of head fat and dose guidelines. NeuroImage. Clinical, 2, 759–766. 10.1016/j.nicl.2013.05.011 [DOI] [PMC free article] [PubMed] [Google Scholar]
- Webb EK, Etter JA, & Kwasa JA (2022). Addressing racial and phenotypic bias in human neuroscience methods. Nature Neuroscience, 25(4), 410–414. 10.1038/s41593-022-01046-0 [DOI] [PMC free article] [PubMed] [Google Scholar]
- Wendel K, Väisänen J, Seemann G, Hyttinen J, & Malmivuo J (2010). The influence of age and skull conductivity on surface and subdermal bipolar EEG leads. Computational Intelligence and Neuroscience, 2010, Article e397272. 10.1155/2010/397272 [DOI] [PMC free article] [PubMed] [Google Scholar]
- Willett K, Jiang R, Lenart E, Spiegelman D, & Willett W (2006). Comparison of bioelectrical impedance and BMI in predicting obesity-related medical conditions. Obesity (Silver Spring, Md.), 14(3), 480–490. 10.1038/oby.2006.63 [DOI] [PubMed] [Google Scholar]
- Yang Y, Soyemi OO, Landry MR, & Soller BR (2005). Influence of a fat layer on the near infrared spectra of human muscle: Quantitative analysis based on two-layered Monte Carlo simulations and phantom experiments. Optics Express, 13(5), 1570–1579. 10.1364/OPEX.13.001570 [DOI] [PubMed] [Google Scholar]