

Abstract
The problems in the current medical equipment measurement work have made many medical institutions begin to consider establishing a convenient, long-term stable and low-cost measurement service model by establishing internal measurement standards, but they have not made further in-depth exploration and the construction of a perfect measurement standard to establish a feasibility evaluation system. This study aims to construct a feasibility evaluation system for establishing measurement standards based on the Group Decision Making-Analytical Hierarchy Processes and provide a reference basis for decision-making in the establishment of measurement standards for medical equipment. A feasibility evaluation system for the establishment of measurement standards based on Group Decision Making-Analytical Hierarchy Processes is constructed, which includes 5 main criteria-level evaluation indicators and 14 sub-criteria-level evaluation indicators. The relative weights of the criteria-level evaluation indicators are calculated by constructing a judgment matrix through pairwise comparisons of the evaluation indicators using the Saaty scale method. Additionally, sensitivity analysis of the constructed model is conducted using the perturbation method. Then, we applied the constructed evaluation system to the feasibility evaluation of establishing measurement standards for eight different types of medical equipment in seven medical institutions. Differences in medical institutions and categories of medical equipment both have an impact on the values of the feasibility indicators for the establishment of measurement standards for medical equipment. The results of this study show that, the feasibility evaluation system for establishing measurement standards based on Group Decision Making-Analytical Hierarchy Processes can transform the problem of exploring the feasibility of establishing measurement standards in medical institutions into a multi-indicator quantitative evaluation problem, making the difficult-to-quantify decision-making process more scientific and objective.
Supplementary Information
The online version contains supplementary material available at 10.1038/s41598-025-94546-5.
Keywords: Evaluation system, Feasibility, Group decision Making-Analytical hierarchy processes, Measurement standards
Subject terms: Biomedical engineering, Sustainability
Introduction
Metrology is closely related to people’s livelihood, and metrology science is widely used in food safety, national defense construction, trade settlement, medical and health care and other fields. Compared with the western developed countries, China’s modern measurement system related theoretical research started late, the Metrology Law was officially implemented from 1985. Before the domestic measurement calibration and testing market was opened, China’s metrological administrative departments at all levels of government and their technical institutions, that is, statutory metrological verification institutions, undertook other non-mandatory verification work while carrying out national compulsory verification work, and provided metrological calibration services to the public in order to guarantee the unity of quantity values in the country. With the progress of The Times and the development of modern science and technology, under the new situation of the initial establishment of the socialist market economic system, the measurement system at that time has shown many drawbacks, and the lagging development pace makes the original purpose and practicability of measurement calibration work cannot be guaranteed, and cannot fully meet the requirements of current economic and social development1. From the “Several Opinions of The State Council on Accelerating the Development of Science and Technology Service Industry” issued by The State Council in 2014, it is proposed to “accelerate the development of third-party inspection, testing and certification services, and encourage different ownership inspection, testing and certification institutions to participate in market competition on an equal basis.” Support qualified inspection, testing and certification bodies and administrative departments to decoupage, transform into enterprises, accelerate cross-department, cross-industry, cross-level integration and mergers and acquisitions, and cultivate many inspections, testing and certification groups with strong technical capabilities, high service level and good scale efficiency. Efforts should be made to improve the planning and layout of inspection, testing and certification bodies, and strengthen the construction of national quality inspection centers and testing laboratories. Build an industrial measurement and testing service system, strengthen the construction of a national industrial measurement and testing center, and establish a metrological science and technology innovation alliance. By 2015, the CNCA also clearly proposed in the “13th Five-Year Plan” that “by 2020, the testing and certification market should further develop in the direction of industrialization, scale and specialization, guide practitioners to improve the mechanism and moderate concentration, and encourage government departments at all levels in the process of performing management functions and providing public services.” Purchase testing and certification services in a market-oriented manner “. In 2018, after the fifth revision of the Metrology Law of the People’s Republic of China, it has more clearly defined the marketization of measurement, testing and calibration business, and encouraged more qualified testing institutions to participate in market competition. At the same time, the concept of industrial metrology is proposed for the first time, which puts forward higher requirements for the organization, research and development ability and professional quality of legal metrology verification institutions. In the 2020 Proposal of the Central Committee of the Communist Party of China on Formulating the 14th Five-Year Plan for National Economic and Social Development and the Vision Goals of 2035, it is proposed to “improve the national quality infrastructure, strengthen the standards, metrology, patent and other systems and capacity building, and carry out in-depth quality improvement actions”, which further supplements the strategy of achieving “quality power”. No matter from the policy aspect, or from the technical ability, personnel allocation, comprehensive services, etc., the measurement management system is gradually moving towards market-oriented reform to cope with the growing measurement demand and fierce market competition2.
In the field of healthcare, the metrology of medical equipment, as an essential component and safeguard of quality control for medical devices, is increasingly valued by medical institutions at all levels3–7. Currently, China’s metrology management system includes provincial, municipal, and county-level legal metrology technical institutions, which together form the main implementing bodies of metrology legal management. National, provincial, and most prefecture-level legal metrology technical institutions, along with some specialized and industry-specific institutions, such as certain metrology institutes within the military, are the primary bearers of metrology technical management. Legal metrology technical institutions capable of providing business services and inspection and testing institutions in the market jointly offer technical services for metrology economic management. At present, medical institutions in China generally entrust legal metrology verification institutions or qualified non-legal metrology verification institutions to carry out metrology work for medical equipment. In the process of conducting metrology work for medical equipment, different medical institutions face different issues. For example, large tertiary general hospitals have high demands for equipment metrology, large annual metrology expenditures, and high time costs. Non-provincial capital large hospitals have limited choices for entrusted verification institutions. Secondary or primary medical institutions often have untimely responses to metrology needs, and so on. These existing issues have led many medical institutions to consider establishing internal metrology standards to create a convenient, long-term stable, and low-cost metrology service model. However, further in-depth exploration and the construction of a comprehensive feasibility evaluation system for the establishment of metrology standards have not been carried out. Therefore, establishing metrology standards is an innovative task for medical institutions, and they can refer to the feasibility evaluation systems established in the domestic and international medical and health fields. Madan, J, et al., constructed a Structured economic assessment system for health system interventions in 20208. Odhiambo-Otieno, GW evaluated the feasibility and sustainability of DHMIS in the management of regional health systems (DHS) in Kenya through design evaluation criteria in 20059. In 2023, Lin, F.Q et al. built a health status classification evaluation system for hydraulic systems with variable operating conditions based on parameter identification10. Tian, B.Q et al., based on the combination of qualitative and quantitative methods, established a set of reasonable and simple performance evaluation index system to evaluate the function and performance of community health services in 201311. This paper aims to construct a feasibility evaluation system for establishing metrological standards, providing scientific and fair reference criteria for whether different types of medical institutions need to establish metrological standards, which requires full consideration of the opinions of relevant personnel, including the heads of medical institutions, medical equipment users, and those responsible for the assessment of measurement standards. Moreover, it is necessary to consider a variety of factors such as economic conditions, the characteristics of medical institutions, and technical capabilities. This is a multi-objective decision-making problem. Common methods for addressing such issues include the Analytic Hierarchy Process (AHP), decision tree algorithms, swarm intelligence optimization algorithms, and the Network Analytic Hierarchy Process (NAHP), among others. Yu, C.S introduced the application of GP-AHP method to the ptwo comparison problem of triangular, concave, and convex mixed fuzzy estimation in group decision making environment in article A GP-AHP method for solving group decision-making fuzzy AHP problem12. Zhang, L.X’ s article, Rockfall hazard assessment of the slope of Mogao Grottoes, China based on AHP, F-AHP and AHP-TOPSIS, introduced the application of AHP, F-AHP and AHP-TOPSIS in the rock fall risk assessment of Mogao Grotto slope13. Guo, D introduced the application of decision tree algorithm in lumber hierarchies in article Application of Decision Tree Algorithm in Lumber Hierarchies14. Qiao, J.W. et al. introduced the application of hybrid particle swarm optimization algorithm for solving engineering problem in the paper A hybrid particle swarm optimization algorithm for solving engineering problem15. Tang, G et al. introduced the application of particle swarm optimization algorithm in the paper Control system research in wave compensation based on particle swarm optimization16.
Materials and methods
The Analytic Hierarchy Process refers to a systematic approach that treats a complex multi-objective decision-making problem as a system. It involves breaking down the overall goal into multiple sub-goals or criteria, which are further decomposed into several levels of indicators17–22. Through a method of qualitative indicator fuzzification and quantification, it calculates the priority rankings at each level and the overall ranking, serving as a systematic method for optimizing decisions involving multiple indicators and alternatives23,24. The Group Decision Making-Analytic Hierarchy Process (GDM-AHP) is an enhanced method based on improvements to the AHP and modern decision theories. It integrates the principles of system clustering analysis and combines qualitative and quantitative methods. This comprehensive analytical approach not only fully reflects the decision-makers’ intentions but also maximizes the elimination of various subjective factors25–32. The decision-making problem regarding the establishment of measurement standards in medical institutions in this study is precisely the type of group decision-making problem that GDM-AHP can address. Therefore, this paper applies GDM-AHP to construct a feasibility evaluation system for the establishment of measurement standards, thereby providing a scientific and fair reference basis for different types of medical institutions to determine whether they need to establish measurement standards. The technical roadmap for constructing a model based on GDM-AHP is shown in Fig. 1.
Fig. 1.

The technical roadmap for constructing a model based on GDM-AHP.
Establishment of the GDM-AHP model
Compare the information related to medical equipment with the criteria-level indicators used for evaluation to obtain the corresponding score values, thereby establishing a GDM-AHP model. The specific steps are as follows33–35:
Determine the main criteria-level and sub-criteria-level indicators for the establishment of measurement standards for medical equipment.
Calculate the relative weights of each indicator determined in step 1.
Define descriptive levels for each indicator in the sub-criteria layer and calculate the relative intensity of different levels.
Set up and calculate the target layer.
Conduct sensitivity analysis on the constructed GDM-AHP model.
Determination of criteria layer indicators
The assessment content for establishing new measurement standards includes six aspects: metrological standards and supporting equipment, main metrological characteristics of the standards, environmental conditions and facilities, personnel, document sets, and measurement capabilities of the standards. And all equipment used must be calibrated in accordance with ISO/IEC 17,025 standards. For enterprises and institutions, establishing measurement standards should be based on actual needs, scientific decision-making, and efficiency to reduce the arbitrariness of the standards. The primary task of medical institutions is to provide medical services to society. Establishing measurement standards is intended to ensure the quality control of medical equipment, rather than to make a profit by providing measurement services to the public. At present, China has not established a system for evaluating the feasibility of the establishment of measurement standards. This paper uses relevant research results and practical experience at home and abroad to determine the evaluation indicators that should be considered in the decision of the establishment of medical equipment measurement standards36–42.
Calculation of the relative weight of each index in the criterion layer
Five experts were selected who were familiar with the field of medical equipment measurement standards establishment, of which 2 were experts with more than 10a measurement standards evaluation work, 2 were experts from provincial metrology research institutes with more than 15a new measurement standards related work experience, and 1 was an expert with more than 10a medical equipment measurement management work. A questionnaire was sent to these 5 experts, and each expert conducted pairwise comparison of the evaluation indicators of the criterion layer. Saaty scale method (1 means not important, 9 means very important) was used to construct the judgment matrix  (k = 1, 2, …, 5)of the criterion layer43. The judgment matrices have the following properties:
  , and
, and  . The comprehensive judgment matrix
  is obtained by clustering the five judgment matrices using the weighted geometric mean method:
 |
1 |
where  represents the weight coefficient for each expert, and in this study, all five experts have equal weight coefficients
The eigenvector w corresponding to the largest eigenroot  of the judgment matrix
  is solved, and the relative weights of each index in the criterion layer can be obtained after normalization.
Usually, the expert assessment of each evaluation index is different, therefore, if all the expert’s estimate is consistent, then the data obtained in the assessment can be used to study. In this paper, Kendall consistency coefficient is used to evaluate and determine the consistency of expert opinions, and W is used to represent the value of the consistency coefficient. The closer the value is to 1, the higher the consistency is. When there are k experts to score n evaluation indicators, the scoring results can be grouped into matrix  (i = 1, 2, …, k, j = 1, 2, …, n), and
  represents the score of the i-th expert on the j-th evaluation index. Let
  , the consistency coefficient W can be calculated as follows:
 |
2 |
In the formula (2), the calculation formula of S is as follows:
 |
3 |
When the number of evaluation indicators n ≥ 5, the significance of the concordance.
coefficient could be determined, using χ2 criteria, and the calculation formula χ2 is as follows:
 |
4 |
The random value is distributed according to the distribution χ2 with the degree of freedom ν = n − 1. According to the chosen significance level α (which is usually equal to 0.05 or 0.01), we can find the critical value  from the table of χ2 distribution with the degree of freedom ν = n − 1. If the value of χ2 obtained by formula (4) is larger than
  , the estimates of the experts are consistent.
Classification of description grades and calculation of their relative strength
In this paper, the classification of each evaluation index level was discussed by the expert members. In order to avoid subjectivity, the two levels were compared, and then the normalization method was adopted to classify each evaluation index level, to determine the relative strength between levels. Take  as the relative weight of each evaluation index grade, then its relative intensity
  can be calculated as follows:
 |
5 |
Calculation of feasibility indicator for Establishing metrological standards
To apply the criteria-level indicators to the decision-making process for establishing measurement standards for medical equipment, it is necessary to determine a priority score for the establishment of measurement standards for the medical equipment in the model. This score quantitatively measures the feasibility of establishing measurement standards for this category of medical equipment. Define R as the indicator for measuring the feasibility of establishing measurement standards, where the magnitude of R is directly proportional to the feasibility of establishing measurement standards. Let  represent the relative weight of the main criteria-level evaluation indicators (where i = 1, 2, …, n, and n represents the number of main criteria-level evaluation indicators in the model), and
 represent the relative weight of the sub-criteria-level evaluation indicators (where j = 1, 2, …, m, and m represents the number of sub-criteria-level evaluation indicators corresponding to the i-th main criteria-level evaluation indicator in the model). Additionally, each sub-criteria-level in the model corresponds to a unique descriptive level, and its relative intensity is denoted as
  (where k = 1, 2, …, q, and q represents the number of descriptive levels corresponding to the j-th sub-criteria-level evaluation indicator of the i-th main criteria-level evaluation indicator in the model). The formula for calculating the feasibility indicator R for the establishment of measurement standards for medical equipment is as follows:
 |
6 |
Considering the relative weights of all evaluation indicators, the feasibility indicator R for the establishment of measurement standards for medical equipment is divided into intervals as follows: when R ≥ 0.5, the equipment has a high priority for establishing measurement standards; when 0.4 ≤ R < 0.5, the equipment has a medium priority for establishing measurement standards; when R < 0.4, the equipment has a low priority for establishing measurement standards.
Sensitivity analysis of GDM-AHP model
In the constructed GDM-AHP model, different evaluation indicators have varying degrees of influence on the results due to their weights. Therefore, it is necessary to conduct a sensitivity analysis of the weights of each evaluation indicator in the model. This analysis determines the impact of changes in the weights of the evaluation indicators on the feasibility indicator R for the establishment of measurement standards for medical equipment. By analyzing the sensitivity of the evaluation indicators, initial weights can be adjusted to enhance the stability and reliability of the constructed model44–46.
In this paper, the Perturbation Method is employed to conduct sensitivity analysis on the main criteria-level and sub-criteria-level evaluation indicators in the constructed GDM-AHP model47–49. The initial weights of the evaluation indicators are obtained from the relative weights acquired through the steps mentioned above. The sensitivity analysis of the main criteria-level evaluation indicators is conducted under the condition that the internal initial weights of the sub-criteria-level evaluation indicators remain unchanged, considering the impact of changes in the weights of the main criteria-level evaluation indicators on the feasibility indicator R for the establishment of measurement standards for medical equipment. The sensitivity analysis of the sub-criteria-level evaluation indicators is conducted while keeping the initial weights of the main criteria-level evaluation indicators constant, considering the impact on the feasibility indicator R when the internal weight distribution of the sub-criteria-level evaluation indicators varies. Based on the results of the sensitivity analysis of the evaluation indicators, the initial relative weights of each evaluation indicator are adjusted to obtain reasonable weight values for each evaluation indicator in the GDM-AHP model.
Results
Determination of criteria layer indicators in the constructed GDM-AHP model
Medical institution perspective
The nature and scale of medical institutions directly determine the talent and technical strength of hospitals, the conditions of medical hardware equipment, and the total number of devices requiring metrological calibration. These are important indicators for evaluating the feasibility of establishing metrological standards, and should specifically include the following aspects.
Scale of medical institutions: According to the medical service capabilities and facility conditions, medical institutions in China are categorized into three levels: primary, secondary, and tertiary. The higher the level of the medical institution, the greater the requirements for medical equipment management and the workload for metrological calibration50,51.
Allocation of relevant technical personnel: According to the “Metrological Standards Assessment Measures,” engineers need relevant qualifications to conduct metrological service work. The allocation of engineers in medical institutions is also an indicator to consider in establishing metrological standards40.
Standard instrument configuration: The configuration of standard instruments is an essential condition for establishing metrological standards. Medical equipment that already has standard instruments has an advantage in establishing metrological standards.
Willingness to establish metrological standards: The willingness of the medical equipment management department leaders and senior hospital leaders to establish metrological standards will directly determine the feasibility of the entire work.
Medical equipment perspective
According to different classification standards, medical equipment can be categorized into mandatory calibration equipment and non-mandatory calibration equipment, as well as high-risk, medium-risk, and low-risk equipment52,53. Different equipment attributes affect the feasibility of establishing metrological standards.
Mandatory calibration equipment: In medical institutions, medical equipment includes both mandatory calibration and non-mandatory calibration equipment. According to the “Metrology Law,” for mandatory calibration instruments, the using units must apply for calibration to designated metrological verification institutions as required; for non-mandatory calibration instruments, using units may choose to calibrate regularly according to actual needs or send them to other metrological verification institutions. Therefore, it is necessary for medical institutions to establish metrological standards for non-mandatory calibration equipment.
Metrological demand: Depending on the use and risk level of medical equipment, the management and calibration requirements vary. Devices such as life support equipment and those with higher risk levels have greater metrological demands, making the establishment of metrological standards more necessary.
Cost of individual calibration: High economic expenditures on metrological work are a common issue in current metrological verification work. The cost of equipment calibration is directly proportional to the necessity of establishing metrological standards.
Current metrological technical regulations: For equipment covered by existing metrological technical regulations, the difficulty of establishing metrological standards for such equipment is lower.
Technical conditions perspective
In the assessment of establishing new metrological standards, the implementation environment of metrological standards and the confirmation of metrological measurement capabilities are key evaluation criteria. Therefore, the technical conditions perspective in this system includes two indicators: metrological calibration operation techniques and conditions for metrological standard preservation and maintenance54:
(1). Metrological operation techniques: Proficiency in metrological calibration operation techniques is fundamental to conducting metrological calibration work.
(2). Conditions for metrological standard preservation and maintenance: This includes environmental conditions for storing standard instruments and supporting facilities, as well as the traceability management of metrological standards.
Economic perspective
Economic cost is one of the main indicators of the feasibility of establishing metrological standards. This paper uses the payback period method to assess the economic benefits of establishing metrological standards for a certain type of medical equipment: Payback Period = Total Investment / Annual Expenditure on Metrological Calibration for such equipment55,56. Total investment refers to the cost of establishing metrological standards, including the cost of metrological standard devices, supporting equipment, costs for training technical personnel, etc. Annual expenditure on metrological calibration for such equipment refers to the current annual expenditure on metrological work for these types of equipment. A shorter payback period indicates lower risk and better economic benefits.
Outsourced verification agency perspective
When evaluating the feasibility of establishing metrological standards, the current situation of outsourced verification agencies is also an important consideration. The choice of outsourced verification agency for most medical institutions depends on factors such as institutional preferences, economic costs, etc. However, for smaller-scale institutions or those located in remote areas, there may be limitations or even exclusivity in choosing a verification agency. Additionally, there may be issues such as slow response to metrological demands and low efficiency in carrying out verification work.
Attributes of outsourced verification agencies: Currently, verification agencies include statutory and non-statutory verification agencies. Institutions with limited choices of verification agencies tend to have a stronger inclination towards establishing metrological standards.
Response to metrological demand: The urgency of establishing metrological standards is inversely proportional to the speed at which verification agencies respond to metrological demands.
Efficiency in carrying out metrological work: The urgency of establishing metrological standards is inversely proportional to the efficiency with which verification agencies carry out metrological work.
The initial weights of evaluation indexes in the constructed GDM-AHP model
According to the determination of the above evaluation indicators, in the formula (3), n = 5, and the values of i correspond to m as shown in Table 1.
Table 1.
Correspondence between values of i and m.
| i value | m value |
|---|---|
| 1 | 5 |
| 2 | 4 |
| 3 | 2 |
| 4 | 1 |
| 5 | 3 |
The judgment matrices A1、A2、 A3、 A4、 A5 made by the five experts on the main criterion layer in the construction of GDM-AHP model are as follows:
 |
 |
 |
 |
 |
The feature vector  (k = 1, 2, …, 5)corresponding to the largest feature root of
  (k = 1, 2, …, 5) is calculated respectively, and the elements in
  represent the score of the k-th expert on the evaluation index. The score
  of each expert is converted into rank order respectively, and then a 5*5 matrix E is formed.
 |
The concordance coefficient W = 0.8909, and χ2 = 17.818 were calculated by the formulas (2)-(4), while the critical value  , taken from the distribution table with the degree of freedom ν = 5 − 1 = 4 and the significance level α = 0.05, was equal to 9.488. The obtained χ2 value is considerably larger than the critical value, therefore, the estimates of experts are considered to be consistent.
According to formula (1), the comprehensive judgment matrix is obtained as follows:
 |
The maximum eigenvalue of the comprehensive judgment matrix  is
is  , and the consistency of the judgment matrix is verified through the Random Consistency Ratio (CR)57–60, which is calculated using the following formula:
 |
7 |
In the formula, the Consistency Index (CI) is calculated as  , and when the order of the matrix n = 5, the Random Consistency Index (RI) is found to be 1.12 by consulting the relevant tables.
According to formula (7), CR = 0.03487 < 0.1 is obtained, so the judgment matrix has satisfactory consistency, and the eigenvector corresponding to  is the relative weight coefficient of each index in the main criterion layer after normalization. Similarly, the relevant weights of each index and the relative weights of each description level in the sub-criteria layer can be calculated, and then the relative strength of each description level can be calculated through formula (5), as shown in Table 2.
Table 2.
Relative weight of criterion level index and relative strength of description level relative.
| Main Criteria Layer | Sub-criteria Layer | Description level | |||
|---|---|---|---|---|---|
| Content | Relative Weight | Content | Relative Weight | Content | Relative Strength |
| Medical Institution Level | 0.1405 | Hospital Scale Level | 0.0752 | Three-level medical institution | 1 |
| Secondary medical institution | 0.4055 | ||||
| Primary medical institution | 0.1644 | ||||
| Technical Personnel Configuration | 0.5083 | More than 3 persons | 1 | ||
| 1–3 persons | 0.3057 | ||||
| No personnel | 0.0935 | ||||
| Standard Device Configuration | 0.1512 | Already configured | 1 | ||
| Planned configuration | 0.2578 | ||||
| No planned configuration | 0.1108 | ||||
| Willingness to Establish Measurement Standards | 0.2653 | Willing | 1 | ||
| Neutral | 0.3057 | ||||
| Disagree | 0.0935 | ||||
| Medical Equipment Level | 0.2996 | Mandatory Calibration Equipment | 0.5646 | No | 1 |
| Yes | 0.1111 | ||||
| Metrological Demand | 0.2413 | Yes, a large quantity | 1 | ||
| Yes, a small quantity | 0.3057 | ||||
| No demand | 0.0935 | ||||
| Single Calibration Cost (CNY) | 0.1333 | > 2000 | 1 | ||
| 1000 ~ 2000 | 0.4055 | ||||
| < 1000 | 0.1644 | ||||
| Measurement Technical Regulations | 0.0608 | No relevant regulations | 1 | ||
| Relevant calibration procedures | 0.3333 | ||||
| Specific measurement standards | 0.3333 | ||||
| Technical Conditions Level | 0.0539 | Measurement Operation Skills | 0.7500 | Proficient | 1 |
| Can operate, but not proficient | 0.4055 | ||||
| Cannot operate at all | 0.1644 | ||||
| Presence of Measurement Standard Storage and Maintenance Conditions | 0.2500 | Yes | 1 | ||
| No, can be coordinated | 0.4055 | ||||
| Cannot be coordinated | 0.1644 | ||||
| Economic Level | 0.4274 | Investment Payback Period (Years) | 1 | < 1 | 1 |
| 1 ~ 3 | 0.4055 | ||||
| > 3 | 0.1644 | ||||
| Current Entrusted Calibration Organization Level | 0.0786 | Calibration Organization Type | 0.0856 | Non-statutory calibration organization | 1 |
| Statutory calibration organization | 0.6667 | ||||
| Both statutory and non-statutory calibration organizations are available | 0.6667 | ||||
| Response to Calibration Demand | 0.2969 | Slow response | 1 | ||
| Average response | 0.2578 | ||||
| Fast response | 0.1108 | ||||
| Calibration Work Efficiency | 0.6175 | Low efficiency | 1 | ||
| Average efficiency | 0.2578 | ||||
| High efficiency | 0.1108 | ||||
Sensitivity analysis results of GDM-AHP model
With the situation of 8 types of common medical equipment in a Grade 3 A general hospital as the original data, the measurement standards of 8 types of equipment were calculated by using the constructed GDM-AHP model to establish the feasibility measurement index R value and the ratio of R value in different value intervals, and the sensitivity analysis was carried out on the weight of each index from two aspects of the evaluation index of the sub-criterion layer and the evaluation index of the main criterion layer. The initial weights of each evaluation index are shown in Table 2.
Results of sensitivity analysis of sub-criterion level evaluation index
The model constructed in this paper includes 5 main criteria-level evaluation indicators, thus requiring a sensitivity analysis for the 14 sub-criteria-level evaluation indicators under each of the 5 main criteria levels. The following text takes the sensitivity analysis of the weights of 4 sub-criteria-level evaluation indicators at the medical institution level as an example.
When perturbing the weights of related technical personnel configuration, standard instrument configuration, willingness to establish measurement standards, and the scale level of medical institutions, the weights of the 5 main criteria-level indicators and the remaining 10 sub-criteria-level evaluation indicators are as shown in Table 2. The weight of the evaluation indicator with the smallest initial weight, the scale level of medical institutions, is fixed and unchanged. The weights of related technical personnel configuration and standard instrument configuration are perturbed by 5% of their initial weights, with a perturbation range from − 20 to 20% of the initial weights. The weight of the willingness to establish measurement standards is calculated based on the total weight value of the 4 evaluation indicators being 1. The distribution of the feasibility indicator R for the establishment of measurement standards for medical equipment, calculated from 81 different perturbation amounts, is shown in Fig. 2. When the weights of related technical personnel configuration, standard instrument configuration, and willingness to establish measurement standards change, the proportion of the R ≥ 0.5 interval remains unchanged. When the perturbation amplitude of the weight of related technical personnel configuration exceeds − 15% of the initial weight, regardless of how the weights of standard instrument configuration and willingness to establish measurement standards change, the proportion of R in each interval changes little. When the perturbation amplitude of the weight of related technical personnel configuration is at -20% of the initial weight, and the perturbation amplitude of the weight of standard instrument configuration is at -5% of the initial weight (number 4), the proportions of the intervals 0.4 ≤ R < 0.5 and R < 0.4 change significantly, decreasing by 12.5% and increasing by 12.5%, respectively. It can be seen that the weight of related technical personnel configuration should be between 80% and 85% of the initial weight, and the weight of standard instrument configuration should be between 90% and 95% of the initial weight; otherwise, their impact will not be reflected.
Fig. 2.

Change in the proportion of the feasibility evaluation index R value range for the establishment of medical equipment metrological standards when the weight of relevant technical personnel configuration indicator increases.
The sensitivity analysis of the weights of the 4 sub-criteria-level evaluation indicators at the medical equipment level, the 2 sub-criteria-level evaluation indicators at the technical condition level, and the 3 sub-criteria-level evaluation indicators at the entrusted verification institution level all follow the process of the sensitivity analysis of the weights of the 4 sub-criteria-level evaluation indicators at the medical institution level mentioned above. The distribution of the feasibility indicator R for the establishment of measurement standards for medical equipment, calculated from different perturbation amounts, is shown in Figs. 3, 4 and 5, respectively. The analysis concludes that the weight of whether it is a mandatory verification device should be between 80% and 85% of the initial weight, and the weight of whether there is a measurement demand should be between 90% and 100% of the initial weight; the weight of measurement operation technology should be between 115% and 120% of the initial weight; the weights of the 3 sub-criteria-level evaluation indicators at the entrusted verification institution level should remain unchanged.
Fig. 3.
Change in the proportion of the feasibility evaluation index R value range for the establishment of medical equipment metrological standards when the weight of mandatory calibration equipment indicator increases.
Fig. 4.

Change in the proportion of the feasibility evaluation index R value range for the establishment of medical equipment metrological standards when the weight of measurement operation skills indicator increases.
Fig. 5.

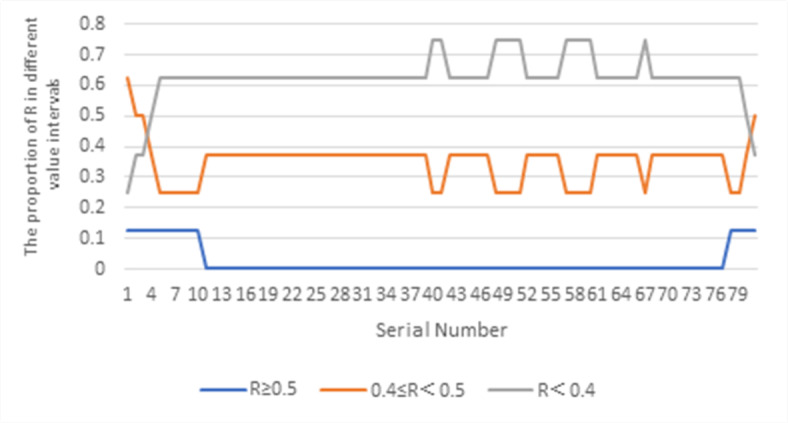
Change in the proportion of the feasibility evaluation index R value range for the establishment of medical equipment metrological standards when the weight of calibration work efficiency indicator increases.
Results of sensitivity analysis of main criterion level evaluation index
When perturbing the weights at the economic level, medical equipment level, medical institution level, entrusted verification institution level, and technical condition level, the internal weights of the sub-criteria-level evaluation indicators remain unchanged and are set to their initial weights, as shown in Table 2. The weight of the evaluation indicator with the smallest initial weight, the technical condition level, is fixed and unchanged. The weights of the three evaluation indicators at the economic level, medical equipment level, and medical institution level are perturbed by 5% of their initial weights, with a perturbation range from − 20 to 20% of the initial weights. The weight of the entrusted verification institution level is calculated based on the total weight value of the 5 evaluation indicators being 1. The distribution of the feasibility indicator R for the establishment of measurement standards for medical equipment, calculated from 729 different perturbation amounts, is shown in Fig. 6. The analysis concludes that the weight at the economic level should be between 80% and 85% of the initial weight, the weight at the medical equipment level should be 85% of the initial weight, and the weight at the medical institution level should be 95% of the initial weight.
Fig. 6.

Change in the proportion of the feasibility evaluation index R value range for the establishment of medical equipment metrological standards when the weight of economic level indicator increases.
Determination of evaluation index weights in GDM-AHP model
The reasonable value range of each evaluation index is obtained by perturbation method, and the initial weight is modified. The weight of each evaluation index after modification is shown in Table 3.
Table 3.
The weight of each evaluation index after modification.
| Main Criteria Layer | Sub-criteria Layer | ||
|---|---|---|---|
| Content | Weight | Content | Weight |
| Medical Institution Level | 0.13 | Hospital Scale Level | 0.08 |
| Technical Personnel Configuration | 0.42 | ||
| Standard Device Configuration | 0.14 | ||
| Willingness to Establish Measurement Standards | 0.36 | ||
| Medical Equipment Level | 0.25 | Mandatory Calibration Equipment | 0.47 |
| Metrological Demand | 0.24 | ||
| Single Calibration Cost (CNY) | 0.23 | ||
| Measurement Technical Regulations | 0.06 | ||
| Technical Conditions Level | 0.06 | Measurement Operation Skills | 0.88 |
|
Presence of Measurement Standard Storage and Maintenance Conditions |
0.12 | ||
| Economic Level | 0.35 | Investment Payback Period (Years) | 1 |
| Current Entrusted Calibration Organization Level | 0.21 | Calibration Organization Type | 0.08 |
| Response to Calibration Demand | 0.3 | ||
| Calibration Work Efficiency | 0.62 | ||
Application of GDM-AHP model
The model with adjusted indicator weights was applied to the feasibility evaluation of measurement standard establishment for 8 different types of medical equipment in 7 medical institutions. Variance analysis was conducted on the differences in the R values among the 7 medical institutions using the data analysis software IBM SPSS Statistics 27, and the results are shown in Table 4. The F value is the ratio of the between-group variance to the within-group variance of the R values of the 7 medical institutions, used to measure the relative magnitude of the differences between groups and within groups. A larger F value indicates that the between-group differences are relatively larger compared to the within-group differences. If the P value is less than 0.05, it is considered that the between-group differences are statistically significant61–63.
Table 4.
Feasibility assessment weight values (R) for Establishing metrological standards for different types of medical equipment in various medical institutions.
| Equipment Category | Feasibility Assessment Weight Value (R) | F | P | ||||||
|---|---|---|---|---|---|---|---|---|---|
| A1 | A2 | A3 | A4 | B1 | B2 | C1 | |||
| Infusion Pump | 0.5756 | 0.6125 | 0.3617 | 0.3850 | 0.4171 | 0.3187 | 0.2508 | 21.526 | < 0.001 |
|
Multi-parameter Monitor |
0.4410 | 0.4970 | 0.4188 | 0.4189 | 0.4054 | 0.3577 | 0.1591 | ||
| Ventilator | 0.4737 | 0.5938 | 0.5467 | 0.3700 | 0.3315 | 0.3199 | 0.2646 | ||
| Defibrillator | 0.4691 | 0.5537 | 0.3756 | 0.3687 | 0.3627 | 0.3060 | 0.2635 | ||
|
High-frequency Electrosurgical Unit |
0.4088 | 0.5133 | 0.3756 | 0.3700 | 0.3315 | 0.3071 | 0.2646 | ||
| Biological Safety Cabinet | 0.3949 | 0.5476 | 0.4098 | 0.4042 | 0.3657 | 0.3071 | 0.2646 | ||
| Centrifuge | 0.3277 | 0.4995 | 0.3344 | 0.6378 | 0.3049 | 0.3071 | 0.2646 | ||
| PCR Instrument | 0.4107 | 0.5073 | 0.4037 | 0.4037 | 0.3255 | 0.3071 | 0.2646 | ||
Notes: A1: Provincial level tertiary comprehensive hospital. A2: Non-provincial capital tertiary comprehensive hospital. A3: Tertiary specialized hospital in pulmonology. A4: Tertiary specialized hospital in obstetrics and gynecology. B1: Provincial capital secondary comprehensive hospital. B2: Non-provincial capital secondary comprehensive hospital. C1: Primary hospital (community hospital).
Discussion
Comparative analysis of overall situations
From the data in Table 4, it can be seen that there are significant differences in the feasibility indicator R values for the establishment of measurement standards for medical equipment among the 7 different medical institutions (P < 0.05). Moreover, the R values for equipment in tertiary medical institutions are generally higher than those in secondary and primary medical institutions, indicating that the type of medical institution affects the feasibility indicator R values for the establishment of measurement standards for medical equipment. In addition, although the number of multi-parameter monitors is the largest among the eight devices, the R value of all the multi-parameter monitors in the seven medical institutions is less than 0.5, mainly because the multi-parameter monitors are compulsory verification work measuring instruments, which need to apply to the legal measurement verification institutions for verification, and the measurement service is free. Therefore, medical institutions do not need to establish measurement standards for multi-parameter monitors.
Comparative analysis of different medical institution
Comparison between A1 and A2: Both A1 and A2 are tertiary comprehensive hospitals, and there is no significant difference in the feasibility assessment weight values (R) for establishing metrological standards of medical equipment (P = 0.105 > 0.05). This similarity arises from the comparable scale, nature, types and quantities of medical equipment, availability of standards, personnel and technical conditions, and metrological demands in both institutions. However, across all equipment types, A2 consistently shows higher R values than A1. This difference is attributed to that A2 is located in a non-provincial capital area, so it has certain limitations in the selection of entrusted verification institutions compared with A1 and the response of metrology verification institutions to metrology needs is not as fast as A1, so the demand for establishing metrology standards is higher. Within the budget range of medical institutions, A1 considers the establishment of infusion pumps with measurement standards, A2 considers the establishment of measurement standards in order of priority from high to low, respectively, infusion pumps, ventilators, defibrillators, biosafety cabinets, high-frequency electrosurgical unit, PCR.
Comparison between A3 and A4: Both A3 and A4 are tertiary specialized hospitals, yet they differ in the types of equipment considered for establishing metrological standards, reflecting their respective specialization. The pulmonary specialized tertiary hospital (A3) considers ventilators for establishing metrological standards, whereas the maternal and child specialized tertiary hospital (A4) considers infant incubators.
Comparison between B1 and B2: Both B1 and B2 are secondary comprehensive hospitals, and for most type of equipment, the feasibility assessment weight values (R) for establishing metrological standards are below 0.5, indicating minimal necessity for establishing metrological standards. At the same time, there was no significant difference in the R value of the feasibility measurement index of the establishment of medical equipment measurement standards between the two medical institutions (P = 0.468 > 0.05), because the scale and nature of the two medical institutions, the type and quantity of medical equipment, standards, personnel and technical conditions, and measurement needs were similar.
Analysis of C1: C1 is a primary healthcare institution where the feasibility assessment and weight values (R) for establishing metrological standards for each type of equipment are below 0.5, indicating the priority of establishing measurement standards is low. This result is influenced by factors such as the institution’s scale, metrological demands, and technical and personnel conditions, among others.
The limitation analysis of the constructed model
The applicable object of the model constructed in this study is the medical equipment in public medical institutions, so the applicability of this study is limited for the medical equipment in private medical institutions or enterprises. Secondly, at present, there are no research results related to the establishment of a feasibility evaluation system for measuring standards of medical equipment in China. As a preliminary exploratory study, only 5 experts were selected in this study, which is the minimum number of experts to be selected in a preliminary exploratory study. In addition, the data collection method of this study is questionnaire survey, which may be subjective and biased to some extent. May be influenced by the respondents’ answer bias. Therefore, if further confirmatory studies need to be done or studies requiring a high degree of reliability, more experts may be needed to reduce the influence of subjectivity and bias on the study results.
In addition, sensitivity analysis is a very important step in this study. The perturbation method used in this study has the advantages of high computational efficiency and easy implementation, but its limitations also lead to the limitations of the results of this study. The perturbation method is based on the perturbation weight of a certain size within a given size range, so the accuracy of the calculation is relatively limited. When the model contains a large number of parameters, the analysis results of perturbation method may be difficult to interpret, which may make it difficult for decision makers to make effective decisions based on the analysis results. In order to avoid this situation, the evaluation index with the lowest initial weight is fixed during perturbation, which may also cause errors in the results. The perturbation method is based on the premise that each evaluation index is independent. Therefore, when re-determining the evaluation index of the criterion layer, if there is correlation between the indicators of the criterion layer, the perturbation method cannot be used for sensitivity analysis.
Conclusions
For medical institutions, the establishment of measurement standards is a long-term work, in addition to the assessment and use of new measurement standards, but also need to consider the follow-up preservation and maintenance of measurement standards, which also applies to the establishment of measurement standards of the unit’s technical conditions, staffing and so on put forward higher requirements. At present, domestic medical institutions in addition to military hospitals, other local medical institutions rarely establish medical equipment measurement standards, therefore, the establishment of measurement standards for medical institutions is an innovative work, facing greater challenges. Based on GDM-AHP, this paper constructs a measurement standard to establish a feasibility evaluation system from the evaluation indicators of 5 main criterion layers, such as medical institutions, medical equipment, and technical conditions, and 14 sub-criterion layers, such as the scale level of medical institutions, the allocation of related technical personnel and the allocation of standards, and sets sub-criterion layer indicators for each main criterion layer. The relative weight of each indicator is calculated through pound-to-pair comparison, and the sensitivity analysis of each indicator weight is carried out by using perturbation method. The GDM-AHP model after adjusting the indicator weight is applied to the establishment and decision-making of measurement standards for different equipment in different medical institutions, and the feasibility discussion on the establishment of measurement standards in medical institutions is transformed into a quantitative evaluation problem of multiple indicators, which makes the difficult to quantify decision problem more scientific and objective64,65.
In the future work, there are the following aspects of work need to be further studied. First of all, the evaluation object of this evaluation system is only a certain type of equipment of an institution. With the change of the measurement demand and other conditions of this type of equipment, the value of the evaluation index of the feasibility of establishing measurement standards will also change accordingly, that is, the R value changes dynamically. Therefore, it is worth thinking about how to optimize the threshold setting of this R indicator to improve the rationality of the decision of establishing measurement standards. Secondly, in view of the limitations of perturbation method in this study in the discussion section, how to combine perturbation method with other sensitivity analysis methods (such as finite difference method, direct differential method, etc.) to improve the accuracy and reliability of results needs to be further explored. Finally, for medical equipment in private medical institutions or enterprises, the applicability of this study has limitations. How to update the criterion layer evaluation indicators to increase the applicability of this model is also one of the future research directions66,67.
Electronic supplementary material
Below is the link to the electronic supplementary material.
Acknowledgments
Disclaimer
The statements, opinions and data contained in all publications are solely those of the individual author(s) and contributor(s) and not of MDPI and/or the editor(s). MDPI and/or the editor(s) disclaim responsibility for any injury to people or property re-sulting from any ideas, methods, instructions, or products referred to in the content.
Author contributions
Conceptualization, writing—original draft preparation, F.W.; methodology, Y.L.; data curation and validation, X.F. and S.C.; writing—review and editing, F.W. and J.T.; project administration, Z.P.; funding acquisition, Y.L. All authors have read and agreed to the published version of the manuscript.
Funding
This research was funded by the Fundamental Research Funds for Central Universities, grant number 413000626, the Social Science Foundation of Hubei Province, grant number 22ZD004, and the Natural Science Foundation of Hubei Province, grant number 2023AFC026.
Data availability
The data is included as supplementary file. wengfei@whu.edu.cn.
Declarations
Competing interests
The authors declare no competing interests.
Footnotes
Publisher’s note
Springer Nature remains neutral with regard to jurisdictional claims in published maps and institutional affiliations.
Contributor Information
Zhenyu Pan, Email: zn000382@whu.edu.cn.
Yang Liu, Email: dabailiu@whu.edu.cn.
References
- 1.Yang, S. L. & Wu, Z. H. Measurement of entrepreneurs’ marketization courses. In Proceedings of the International Conference on Management Science and Engineering, Atlanta, Ga, 15–17 Aug 2003; pp. 2494–2499. (2003).
- 2.Acero, R., Santolaria, J., Brau, A. & Pueo, M. Virtual distances methodology as verification technique for AACMMs with a capacitive sensor based indexed metrology platform. Sensors16, 1940 (2016). [DOI] [PMC free article] [PubMed] [Google Scholar]
- 3.Witkovsky, V., Wimmer, G., Durisova, Z., Duris, S. & Palencar, R. Brief Overview of Methods for Measurement Uncertainty Analysis: GUM Uncertainty Framework, Monte Carlo Method, Characteristic Function Approach. In Proceedings of the 11th International Conference on Measurement, Smolenice, SLOVAKIA, 29–31 May ; pp. 35–38. (2017).
- 4.Pathak, R. et al. A. A data-driven statistical model that estimates measurement uncertainty improves interpretation of ADC reproducibility: a multi-site study of liver metastases. Sci. Rep.7, 14084 (2017). [DOI] [PMC free article] [PubMed] [Google Scholar]
- 5.Li, J. S., Mao, Y. J. & Zhang, J. Maintenance and Quality Control of Medical Equipment Based on Information Fusion Technology. Comput. Intell. Neurosci. 2022, 9333328. (2022). [DOI] [PMC free article] [PubMed]
- 6.Hamdi, N., Oweis, R., Abu, Z. H. & Abu, S. D. An intelligent healthcare management system: A new approach in Work-order prioritization for medical equipment maintenance requests. J. Med. Syst.36, 557–567 (2012). [DOI] [PubMed] [Google Scholar]
- 7.Deng, H. B. & Ge, Y. The application of SPC in medical equipment quality control. In Proceedings of the World Engineers Convention, Shanghai, China, 02–06 Nov ; pp. 189–191. (2004).
- 8.Madan, J., Kumar, M. B., Taegtmeyer, M., Barasa, E. & Singh, S. P. SEEP-CI: A structured economic evaluation process for complex health system interventions. Int. J. Environ. Res. Public. Health. 17, 6780 (2020). [DOI] [PMC free article] [PubMed] [Google Scholar]
- 9.Odhiambo-Otieno, G. W. Evaluation criteria for district health management information systems: lessons from the ministry of health, Kenya. Int. J. Med. Inf.74, 31–38 (2005). [DOI] [PubMed] [Google Scholar]
- 10.Lin, F. Q., Zhang, Q. X., Yu, P. & Guo, J. Graded evaluation of health status of hydraulic system with variable operating conditions based on parameter identification. Appl. Sci.13, 6052 (2023). [Google Scholar]
- 11.Tian, B. Q., Xue, H. M. & Hu, S. Z. Study on Functional Performance Evaluation of Community Health Service Institutions in Songjiang District. In proceedings of the 5th International Institute of Statistics and Management Engineering Symposium, Qingdao, PEOPLES R CHINA, 20–25 July ; pp. 286–291. (2012).
- 12.Yu, C. S. A GP-AHP method for solving group Decision-making fuzzy AHP problems. Comput. Oper. Res.29, 1969–2001 (2002). [Google Scholar]
- 13.Zhang, L. X., Wang, Y. W., Zhang, J. K., Zhang, S. & Guo, Q. L. Rockfall hazard assessment of the slope of Mogao grottoes, China based on AHP, F-AHP and AHP-TOPSIS. Environ. Earth Sci.81, 377 (2022). [Google Scholar]
- 14.Guo, D. Application of Decision Tree Algorithm in Lumber Hierarchies. In proceedings of the 1st International Conference on Intelligent System and Applied Material, Taiyuan, PEOPLES R CHINA, 13–15, July ; pp: 308–313. (2012).
- 15.Qiao, J. W. et al. A hybrid particle swarm optimization algorithm for solving engineering problem. Sci. Rep.14, 8357 (2024). [DOI] [PMC free article] [PubMed] [Google Scholar]
- 16.Tang, G., Lu, P., Hu, X. & Men, S. Y. Control system research in wave compensation based on particle swarm optimization. Sci. Rep.11, 15316 (2021). [DOI] [PMC free article] [PubMed] [Google Scholar]
- 17.Vaidya, O. S. & Kumar, S. Analytic hierarchy process: an overview of applications. EUR. J. OPER. RES.169, 1–29 (2006). [Google Scholar]
- 18.Lou, S. W., Li, Danny, H. W., Chan, W. W. & Lam, J. C. Life-cycle analysis of photovoltaic systems in Hong Kong. J. Renew. Sustainable Energy. 9, 045901 (2017). [Google Scholar]
- 19.Sahin, T., Ocak, S. & Top, M. Analytic hierarchy process for hospital site selection. HEALTH POLICY TECHN. 8, 42–50 (2019). [Google Scholar]
- 20.Lim, Y. R., Ariffin, A. S., Ali, M. & Chang, K. L. A hybrid MCDM model for Live-Streamer selection via the fuzzy Delphi method, AHP, and TOPSIS. Appl. Sci.11, 9322 (2024). [Google Scholar]
- 21.Mahmoudzadeh, M. & Bafandeh, A. R. A new method for consistency test in fuzzy AHP. J. Intell. Fuzzy Syst.25, 457–461 (2013). [Google Scholar]
- 22.Wang, W. J. et al. The comfort and measurement Precision-Based Multi-Objective optimization method for gesture interaction. Bioengineering10, 1191 (2023). [DOI] [PMC free article] [PubMed] [Google Scholar]
- 23.Saaty, T. L. An exposition of the AHP in reply to the paper remarks on the analytic hierarchy process. Manage. Sci.36, 259–268 (1990). [Google Scholar]
- 24.Saaty, T. L. Decision-making with the AHP: why is the principal eigenvector necessary. Eur. J. Oper. Res.145, 85–91 (2003). [Google Scholar]
- 25.Saleh, N., Gaber, M. N., Eldosoky, M. A. & Soliman, A. M. Vendor evaluation platform for acquisition of medical equipment based on multi-criteria decision-making approach. Sci. Rep. 13,12746. (2023). [DOI] [PMC free article] [PubMed]
- 26.Zibarzani, M., Bin, L. H., Ali, K. N. B., Abd-Majid, M. Z. & Abd-Rozan, M. Z. Adapted Grounded Group Decision Making Model. Proc. Natl. Acad. Sci., India, Sect. A. 85: 319–327. (2015).
- 27.Amenta, P., Ishizaka, A., Lucadamo, A., Marcarelli, G. & Vyas, V. Computing a common preference vector in a complex multi-actor and multi-group decision system in analytic hierarchy process context. Ann. Oper. Res.284, 33–62 (2020). [Google Scholar]
- 28.Dyer, R. F. & Forman, E. H. Group decision support with the analytic hierarchy process. Decis. Support Syst.8, 99–124 (1992). [Google Scholar]
- 29.Subedi, P., Subedi, K., Thapa, B. & Subedi, P. Sinkhole susceptibility mapping in Marion County, Florida: evaluation and comparison between analytical hierarchy process and logistic regression-based approaches. Sci. Rep.9, 7140 (2019). [DOI] [PMC free article] [PubMed] [Google Scholar]
- 30.Moreno-Jiménez, J. M., Aguarón, J. & Escobar, M. T. The core of consistency in AHP-group decision making. Group. Decis. Negot.17, 249–265 (2008). [Google Scholar]
- 31.Escobar, M. T. & Moreno-Jiménez, J. M. Aggregation of individual preference structures in AHP-group decision making. Group. Decis. Negot.16, 287–301 (2007). [Google Scholar]
- 32.Aguarón, J., Escobar, M. T., Moreno-Jiménez, J. M. & Turón, A. AHP-Group Decis. Mak. Based Consistency Math.7, 242. (2019). [Google Scholar]
- 33.Angiz, L. M. Z., Mustafa, A., Ghani, N. A. & Kamil, A. A. Group decision via usage of analytic hierarchy process and preference aggregation method. Sains Malays. 41, 361–366 (2012). [Google Scholar]
- 34.Yu, S., Ding, H. H. & Zeng, Y. F. Evaluating water-yield property of karst aquifer based on the AHP and CV. Sci. Rep.12, 3308 (2022). [DOI] [PMC free article] [PubMed] [Google Scholar]
- 35.Palamara, R., Manti, F. & Tufano, A. GIS-Multicriteria analysis using AHP to evaluate the landslide risk in road lifelines. Appl. Sci.12, 4707 (2022). [Google Scholar]
- 36.Peng, Y. Metrological evaluation of size specifications in ISO 14405-1. The University of North Carolina at Charlotte, Mechanical Engineering, North Carolina, United States, (2015).
- 37.Srdevic, B. & Srdevic, Z. Multi-Model assessing and visualizing consistency and compatibility of experts in group Decision-Making. Mathematics12, 1699 (2024). [Google Scholar]
- 38.Blokus-Dziula, A. & Soszynska-Budny, J. Condition-Based maintenance and availability analysis of wind farm infrastructure. J. Infrastruct. Syst.28, 05022001 (2022). [Google Scholar]
- 39.James, A. T., Asjad, M. & Panchal, R. Purchase decision making of garage equipment using an integrated fuzzy AHP and grey relation analysis method. Grey Syst.13, 238–260 (2023). [Google Scholar]
- 40.Kaur, I. et al. Primary Hepatocyte Isolation and Cultures: Technical Aspects, Challenges and Advancements. Bioengineering 10. (2023). [DOI] [PMC free article] [PubMed]
- 41.Yu, Y., Ji, X., Wang, D., Zhao, F. & Tang, J. H. Study of the Knowledge-Based Integrated Equipment Management System for Process Enterprise. In Proceedings of the 2nd International Conference on Manufacturing Science and Engineering, Guilin, China, 09–11 Apr 09–11 ; pp. 912–919. (2011).
- 42.Alnimr, M. A. Analytical solution for transient laminar fully-developed free-convection in vertical concentric annuli. Int. J. Heat. Mass. Transf.36, 2385–2395 (1993). [Google Scholar]
- 43.Saaty, T. L. Homogeneity and clustering in AHP ensures the validity of the scale. Eur. J. Oper. Res.72, 598–601 (1994). [Google Scholar]
- 44.Bazyleva, V., Garibay, V. M. & Roy, D. Trajectory-based global sensitivity analysis in multiscale models. Sci. Rep.14, 13902 (2024). [DOI] [PMC free article] [PubMed] [Google Scholar]
- 45.Nadeem, M., Islam, A., Senol, M. & Alsayaad, Y. The dynamical perspective of soliton solutions, bifurcation, chaotic and sensitivity analysis to the (3 + 1)-dimensional Boussinesq model. Appl. Sci.14, 9173 (2024). [DOI] [PMC free article] [PubMed] [Google Scholar]
- 46.Pietrenko-Dabrowska, A. & Koziel, S. Variable resolution machine learning optimization of antennas using global sensitivity analysis. Appl. Sci.14, 27783 (2024). [DOI] [PMC free article] [PubMed] [Google Scholar]
- 47.Kiran, R., Li, L. & Khandelwal, K. Complex perturbation method for sensitivity analysis of nonlinear trusses. J. Struct. Eng.143, 04016154 (2017). [Google Scholar]
- 48.Perfetti, C. M. & Rearden, B. T. Development of a generalized perturbation theory method for sensitivity analysis using Continuous-Energy Monte Carlo methods. Nucl. Sci. Eng.182, 354–368 (2016). [Google Scholar]
- 49.Zhang, Y. M. Perturbation Method for Reliability-based Sensitivity Analysis. In proceedings of the 8th International Conference on Mechatronics and Information Technology (ICMIT09), Inst Control, Robotics & Syst, Gwangju, SOUTH KOREA, 03–05 Dec (2009).
- 50.Chen, X., Valdmanis, V. & Yu, T. Productivity growth in Chinese medical institutions during 2009–2018. Sustainability12, 3080 (2020). [Google Scholar]
- 51.Cheng, S. Y. et al. The patient safety culture scale for Chinese primary health care institutions: development, validity and reliability. J. Patient Saf.17, 114–121 (2021). [DOI] [PMC free article] [PubMed] [Google Scholar]
- 52.Neyt, M. et al. Introduction of high-risk medical devices: National measures that can be taken under the current European legislation to put the patient interest central. Expert Rev. Med. Devices. 14, 181–188 (2017). [DOI] [PubMed] [Google Scholar]
- 53.Gutierrez-Martinez, J., Toledo-Peral, C. L., Vega-Martinez, G. & Mercado-Gutierrez, J. A. Medical Equipment Design based on Risk Analysis: General Considerations. In Proceedings of the Conference of the Global-Medical-Engineering-Physics-Exchanges / Conference of the Pacific-Health-Care-Engineering (GMEPE/PAHCE), Inha Univ, Coll Med, Dept Mol Med, Incheon, SOUTH KOREA, 27–31 Mar, (2023).
- 54.Geng, J. B., Xu, S. Q., Niu, J. Z. & Wei, K. J. Research on Technical Condition Evaluation of Equipments Based on Matter Element Theory and Hidden Markov Model. In Proceedings of the 4th Annual International Workshop on Materials Science and Engineering (IWMSE), Xian, China, 18–20 May (2018).
- 55.Wang, X. Q., Li, X. P., Li, Y. R. & Wu, C. M. Payback period Estimation and parameter optimization of subcritical organic Rankine cycle system for waste heat recovery. Energy88, 734–745 (2015). [Google Scholar]
- 56.Kim, B-C., Shim, E. & Reinschmidt, K. F. Probability distribution of the project payback period using the equivalent cash flow decomposition. Eng. Econ.58, 112–136 (2013). [Google Scholar]
- 57.Çoban, V. Developing random indices and consistency ratios for inconsistency methods in pairwise comparison. J. Fac. Eng. Archit. Gaz.38, 781–793 (2023). [Google Scholar]
- 58.Wu, X. G. et al. Multisource information fusion for real-time prediction and multi objective optimization of large-diameter slurry shield attitude. Reliab. Eng. Syst. Safe. 250, 110305 (2024). [Google Scholar]
- 59.Tummala, V. M. R. & Ling, H. Sampling distribution of the random consistency index of the analytic hierarchy process (AHP). J. Stat. Comput. Sim. 55, 121–131 (1996). [Google Scholar]
- 60.Tummala, V. M. R. & Ling, H. A note on the computation of the mean random consistency index of the analytic hierarchy process (AHP). Thero Decis.44, 221–230 (1998). [Google Scholar]
- 61.Du, Z. F. & Liu, D. The Relation between Conjoint Analysis and Analysis of Variance. In proceedings of the Conference of the International-Institute-of-Applied-Statistics-Studies, Yantai, PEOPLES R CHINA, 1 Jan 2008, pp: 397–405.
- 62.Gaddis, M. L. Analysis of variance, analysis of covariance, and multivariate analysis of varianc. Acad. Emerg. Med.5, 258–265 (1998). [DOI] [PubMed] [Google Scholar]
- 63.Wu, X. G. et al. Predicting existing tunnel deformation from adjacent foundation pit construction using hybrid machine learning. Automat Constr.165, 105516 (2024). [Google Scholar]
- 64.Globa, A. et al. Hybrid kinetic facade: fabrication and feasibility evaluation of full-scale prototypes. Archit. Eng. Des. Manag. 18, 791–811 (2022). [Google Scholar]
- 65.Akbar, H. et al. Prioritizing major factors affecting groundwater stress using multi-criteria decision methods. Groundw. Sustain. Dev.23, 100970 (2023). [Google Scholar]
- 66.Fan, K. C. & Kinnell, P. Special issue on manufacturing metrology. Appl. Sci.11, 10660 (2021). [Google Scholar]
- 67.Kunzmann, H., Pfeifer, T., Schmitt, R., Schwenke, H. & Weckenmann, A. Productive metrology - Adding value to manufacture. Cirp Ann-Manuf Techn. 54, 691–704 (2005). [Google Scholar]
Associated Data
This section collects any data citations, data availability statements, or supplementary materials included in this article.
Supplementary Materials
Data Availability Statement
The data is included as supplementary file. wengfei@whu.edu.cn.