



Abstract
Chimeric antigen receptor (CAR) T cells have dramatically improved the treatment of hematologic malignancies. T cell receptor (TCR)-based cell therapies are yet to achieve comparable outcomes. Importantly, CARs not only target selected antigens, but reprogram T cell functions through the costimulatory pathways they engage upon antigen recognition. We show here that a fusion receptor comprising the CD80 ectodomain and the 4–1BB cytoplasmic domain, termed 80BB, acts as both a ligand and a receptor to engage the CD28 and 4–1BB pathways, thereby increasing the anti-tumour potency of HLA-independent TCR (HIT) receptor- or TCR-engineered T cells and tumour-infiltrating lymphocytes (TILs). Furthermore, 80BB serves as a switch receptor that provides agonistic 4–1BB costimulation upon its ligation by the inhibitory CTLA4 molecule. Combining multiple costimulatory features in a single antigen-agnostic synthetic receptor, 80BB is a promising tool to sustain CD3-dependent T cell responses in a wide range of targeted immunotherapies.
T cell engineering with synthetic receptors for antigen known as chimeric antigen receptors (CARs) has yielded remarkable responses in patients with refractory hematological malignancies1. While TCR-engineered cell therapies are a promising anti-cancer therapeutic modality, effective, sustained anti-tumour responses are still limited2–5. CAR and TCR-targeted therapies diverge in many aspects, including tumour types and target antigens. One major distinction lies in the structure and signaling properties of these antigen receptors: second-generation CARs provide costimulatory support that enhances the functional characteristics of engineered T cells6, 7, whereas the TCR and CD3-dependent CARs are targeting devices that on their own only initiate T cell activation8. Akin to the TCR, CD3-dependent CARs such as the T cell antigen coupler (TAC)9, the antibody-TCR (AbTCR)10, the T cell receptor fusion construct (TRuC)11, the synthetic T cell receptor and antigen receptor (STAR)12, the TCR-like CAR (TCAR)13 and the HLA-independent TCR (HIT)14, do not possess autochthonous costimulatory machinery and are thus all deprived of this constitutive advantage inherent to second-generation CARs.
The therapeutic benefits of providing exogenous agonistic costimulation to T cells in situ have been amply documented in numerous pre-clinical and clinical studies delivering agonistic costimulatory antibodies directed against receptors including CD28, 4–1BB, OX40, GITR, and CD40L15, 16. The fusion of co-stimulatory domains to TCR chains has proven to be challenging17, 18. Orthogonal costimulation provided independently of the TCR through a chimeric costimulatory receptor (CCR), on the other hand, has been more fruitful19, 20. CCR function depends on binding to a cognate cell surface tumour antigen. Alternatively, switch receptors that coopt inhibitory ligands as agonistic ligands, including FasL, CD200 or PD-L1, are a promising approach to antagonize T cell inhibition21–24.
Providing an agonistic signal by engaging the CD28 and 4–1BB costimulatory pathways has proven to be pivotal for the success of CAR engineered T cells25, 26. Soliciting the CD28 pathway in CAR T cells increases their lytic capacities, antigen sensitivity and glycolytic metabolism, while 4–1BB-based CARs sustain greater T cell persistence and mitochondrial fitness7, 8, 27. These two pathways may act independently or additively to promote the expansion and acquisition of robust effector functions by T cells in various molecular configurations7, 28, 29. There is strong supportive evidence that engagement of both CD28 and 4–1BB co-stimulation in engineered T cells can augment or sustain their anti-tumour activity30–33. Noticeably, however, CARs that bear arrayed CD28 and 4–1BB signaling domains have not so far provided superior clinical outcomes relative to those achieved with either CD28 or 4–1BB-based CARs27, 33, highlighting the importance of what molecular structure is generated to effectively engage these two pathways.
To boost the therapeutic potency of T cells that engage antigen through a CD3-dependant receptor for antigen, we aimed to design a single molecule capable of providing both CD28 and 4–1BB signals in antigen-agnostic manner. We further wanted such a molecule to be as compact as possible to easily incorporate it in muticistronic viral vectors or DNA templates for homologous recombination. To this end, we combined a ligand for CD28 with the signaling domain of 4–1BB. We chose CD80 as the CD28 ligand for its dimeric structure, knowing that 4–1BB signaling domains can function in this format7, 34. As CD80 also binds to the inhibitory ligand CTLA435, 36, we hypothesized that this synthetic costimulatory molecule, hereafter referred to as 80BB, may also serve as a switch receptor when bound by CTLA4.
Results
80BB augments HIT T cell anti-tumour potency
We designed the chimeric 80BB receptor by fusing the extracellular and transmembrane domains of the human CD80 ligand to the intracellular domain of the human 4–1BB receptor (Fig. 1a), hypothesizing that it could at once serve as a CD28 agonist and a 4–1BB costimulatory receptor. To investigate its functional properties, we expressed it in human peripheral blood T cells engineered with a HIT receptor, a CAR that signals through the CD3 complex and does not possess a costimulatory endodomain14. We targeted the anti-CD19 HIT receptor (19-HIT) cDNA to the TRAC locus as previously reported14, 37 and retrovirally transduced the 80BB cDNA (Extended Data Fig. 1a). 80BB was well expressed in T cells, markedly exceeding endogenous CD80 levels (Fig. 1a). Its transduction into T cells maintained surface expression of the HIT receptor (Extended Data Fig. 1b) and did not alter the in vitro cytolytic activity of HIT T cells upon initial exposure to CD19+ NALM6wt cells (19-HIT80BB vs 19-HIT, Extended Data Fig. 1c, 1d) nor elicit non-specific killing of NALM6CD19 KO (Extended Data Fig. 1d). Expression of 80BB in 19-HIT cells moderately increased IL-2 and TNFα secretion but not IFNɣ in response to a single NALM6wt stimulation (Extended Data Fig. 1e). Upon repeated exposure to antigen, however, 80BB augmented T cell expansion and accumulation, achieving >15-fold higher T cell numbers by day 14 after 7 repeated antigen stimulations with NALM6wt cells (Fig. 1b). Furthermore, these 19-HIT80BB cells retained their cytolytic function in contrast to control 19-HIT T cells, which started exhibiting diminished tumour lysis by the third tumour challenge and failed to clear subsequent challenges (Fig. 1c). 19-HIT80BB cells sustained superior cytolytic function in both CD4 and CD8 T cell fractions (Extended Data Fig. 1f). Moreover, 19-HIT80BB exhibited greater mitochondrial and glycolytic capacities after three repeated stimulations (Fig. 1d).
Figure 1: Synthetic costimulatory molecule (80BB) enhances HIT cell anti-tumour function.
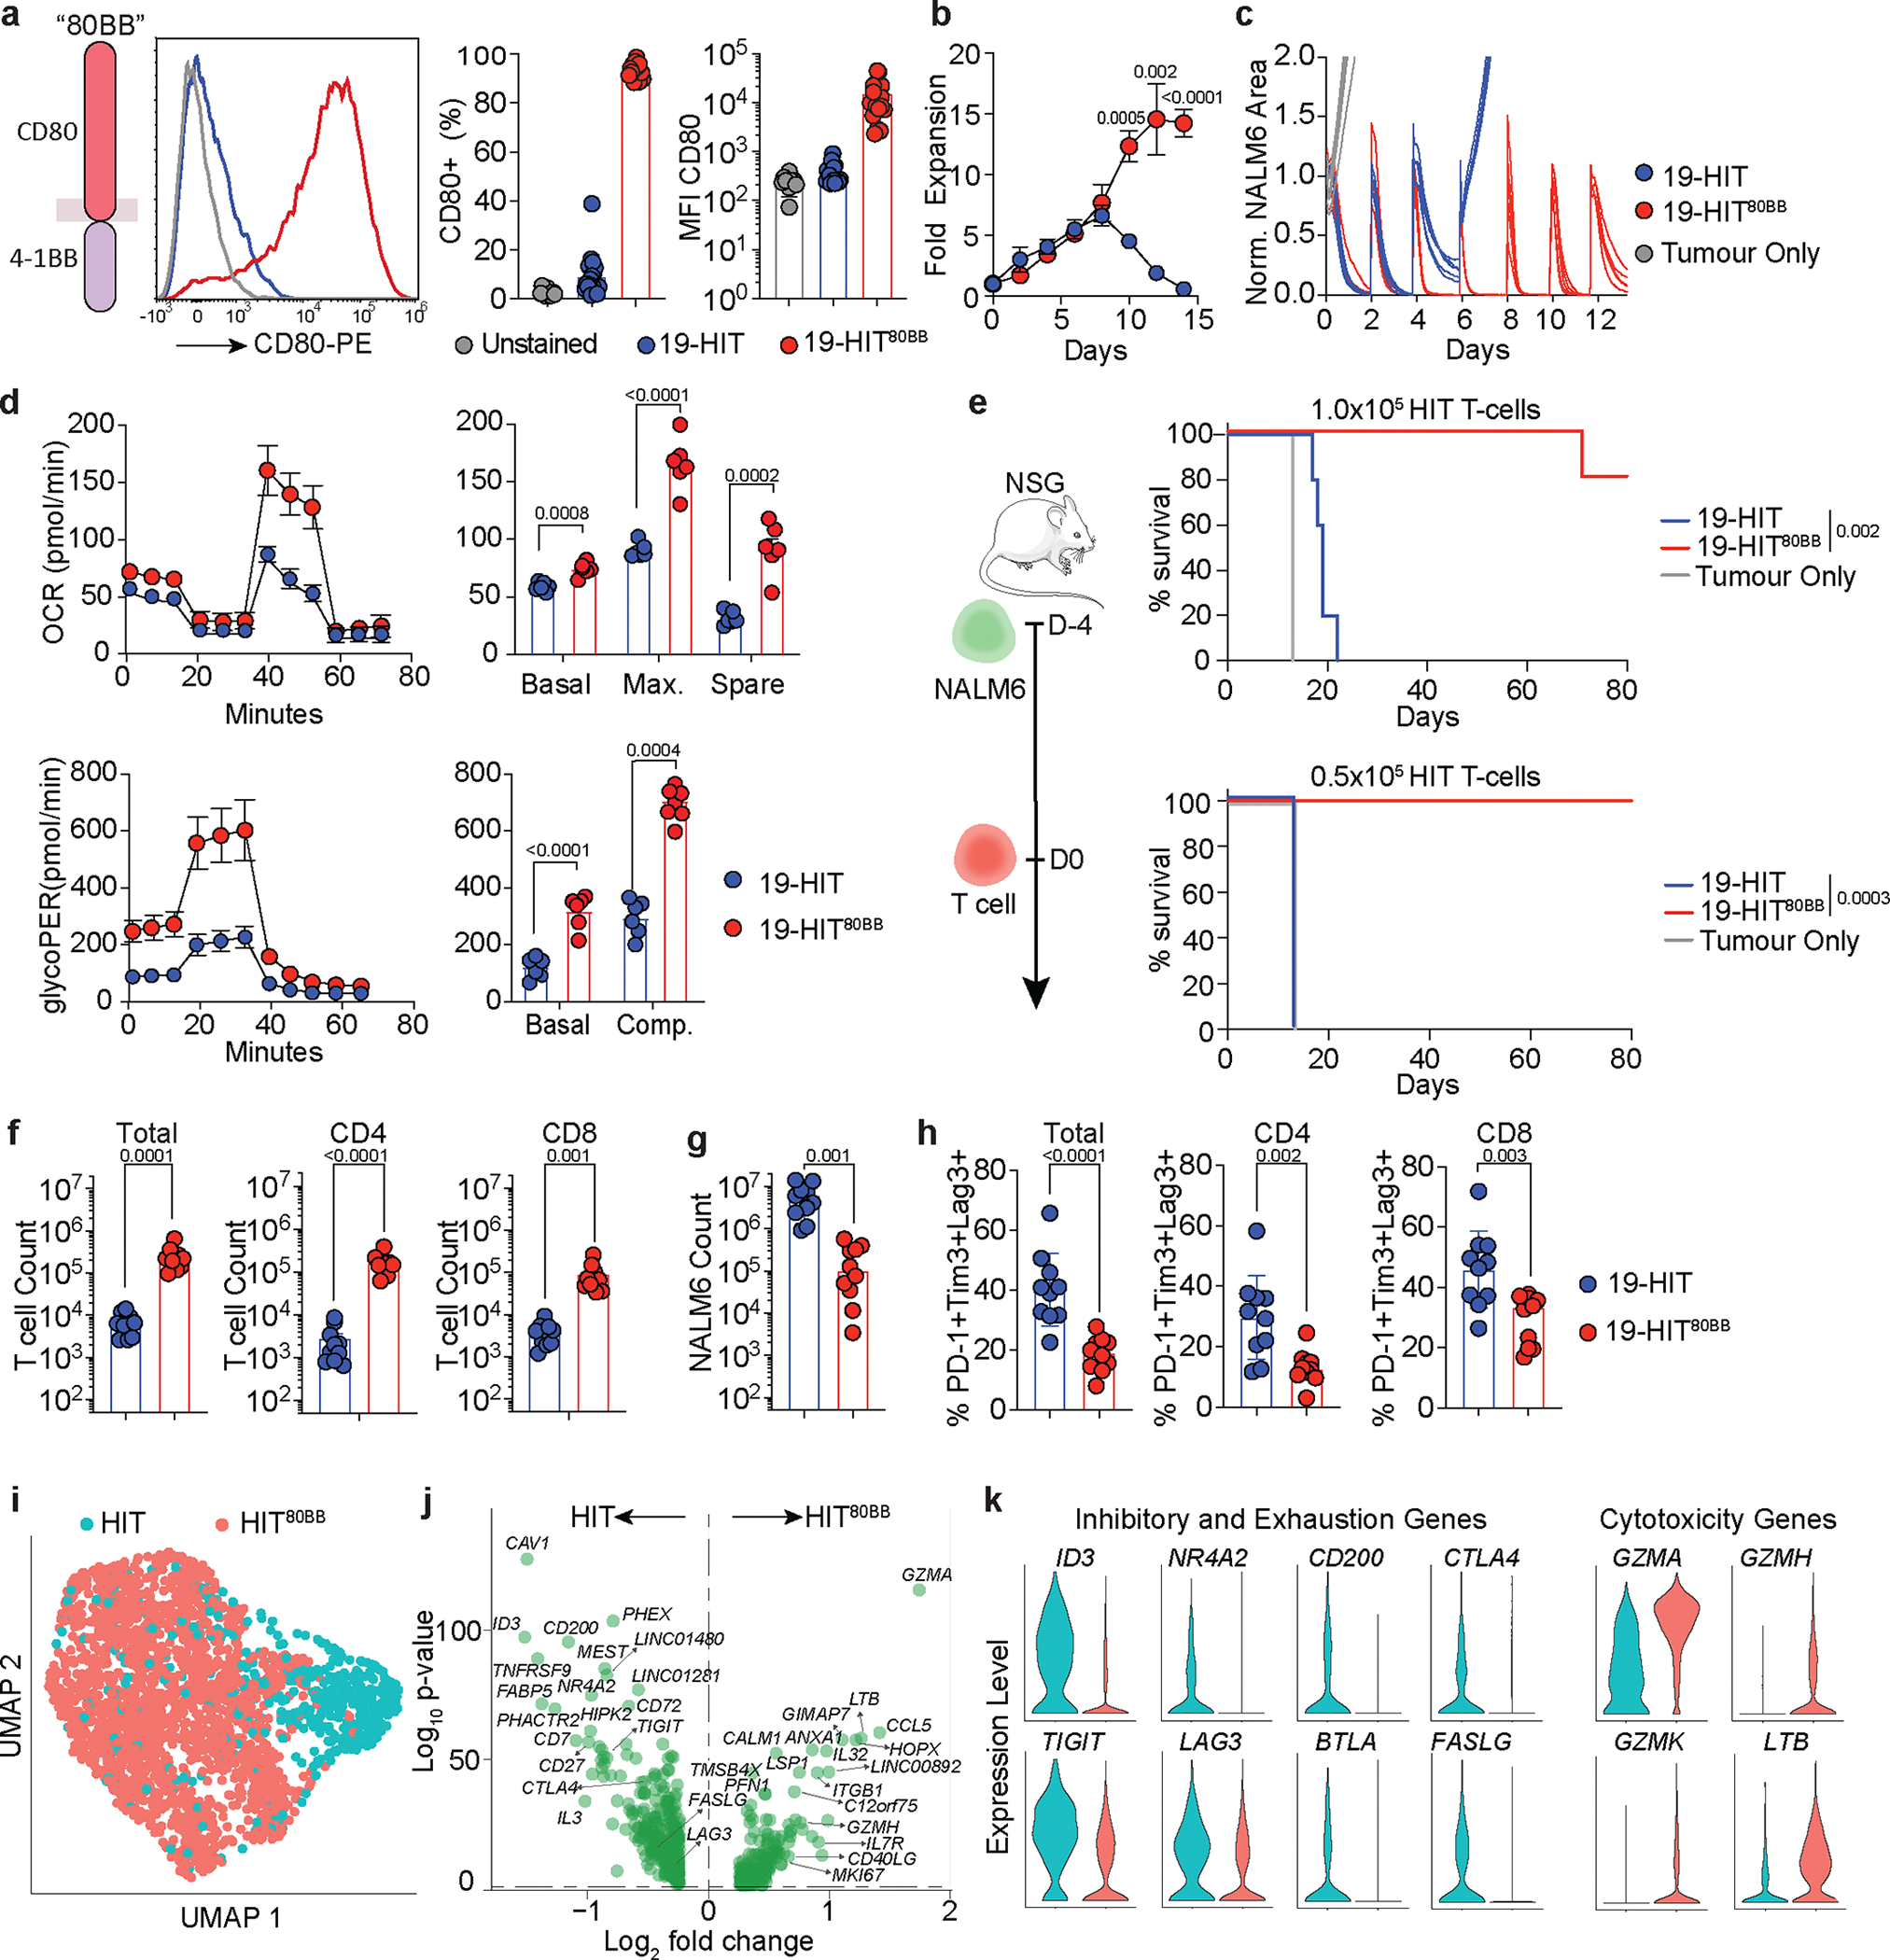
a, Left, diagram depicting the fusion of the extracellular and transmembrane domain of CD80 with the intracellular domain of 4–1BB to generate “80BB” molecule. Middle, representative flow cytometry profile of CD80 on the surface of 19-HIT T cells with (red, 19-HIT80BB) or without (blue, 19-HIT) retrovirally transduced 80BB. Right, CD80 percentages and MFI of 19-HIT and 19-HIT80BB cells. n=18 independent healthy donors. b, T cell fold expansion upon repetitive antigen stimulation. n=3 independent co-cultures of cells from a healthy donor, representative of 3 donors. c,Serial in vitro cytotoxicity assay using NALM6. n=5 independent co-cultures from of cells from a healthy donor, representative of >10 donors. d, Mitochondrial stress (top), and glycolytic rate (bottom) Seahorse assays performed after 3 rounds of stimulation with NALM6 cells. “Max” and “Comp” refer to the maximum respiratory capacity and compensatory glycolytic rate, respectively. n=5 (19-HIT) or 6 (19-HIT80BB) independent reactions of cells from a healthy donor, representative of n=6 (Mitochondrial stress) and n=4 (Glycolytic rate) donors. e, Left, diagram depicting in vivo treatment of NALM6-bearing mice with 19-HIT or 19-HIT80BB cells. Right, Kaplan–Meier survival analysis of NALM6 bearing mice treated with 1×10⁵ (top) or 0.5×10⁵ (bottom) 19-HIT or 19-HIT80BB cells (n=5 mice/group). Data are representative of 3 donors. f, Absolute counts of total (left), CD4+ (middle), CD8+ (right) T-cells. g, Absolute count of NALM6. h, Percentages of T cells co-expressing inhibitory markers PD-1, Lag3, Tim3 in total T cells (left), CD4 (middle) and CD8 (right). f, g, h: n=10 mice/group. i, UMAP projection of 2591 T cells isolated from the bone marrow of NALM6-bearing mice nine days post 19-HIT or 19-HIT80BB treatment. j, Volcano plot of differentially expressed genes between 19-HIT and 19-HIT80BB cells. k, Violin plots of selected genes significantly up or downregulated in 19-HIT and 19-HIT80BB highlighting Inhibitory, Exhaustion and Cytotoxicity genes. f-k, Data are pooled from 5 mice treated with 1×10⁵ and 5 mice with 0.5×10⁵ T cells. P values were determined by two-tailed t-test (a, b, d, f, g, h), log-rank Mantel–Cox test (e) or two-tailed Wilcoxon rank sum test (j, k). Data are mean ± sem.
Encouraged by these findings, we proceeded to an initial in vivo evaluation of 19-HIT80BB function in the well-established NALM6 leukemia model in immunodeficient NSG mice14, 33, 37. NALM6 is an acute lymphoblastic leukemia that does not express CD80, CD86, 4–1BBL, PD-L1 or CTLA4 (Extended Data Fig. 1g). At doses where treatment with 19-HIT cells without co-stimulation provided minimal (1×10⁵/mouse) or no (0.5×10⁵/mouse) survival advantage relative to untreated control mice, 19-HIT80BB cells markedly improved survival (Fig. 1e). 19-HIT80BB likewise exhibited increased therapeutic potency against NALM6 variants expressing lower target antigen densities (i.e., 2000 or 200 CD19 molecules per cell14; Extended Data Fig. 1h).
Analysis of bone marrow 9 days after 19-HIT cell infusion in mice bearing unmodified NALM6 (NALM6wt) demonstrated greater in vivo accumulation of 19-HIT80BB cells and a concomitant decrease in tumour cells (Fig. 1f, g). Both CD4 and CD8 T cells were increased in number by 2–2.5-fold (p<0.01, Fig. 1f). These observations were further confirmed on day 17 in another experiment with another donor (Extended Data Fig. 1i, j). These 19-HIT80BB cells also showed reduced expression of PD-1, Lag3, and Tim3 compared to 19-HIT cells (Fig. 1h). These observations were corroborated by single-cell RNA sequencing performed on 19-HIT and 19-HIT80BB cells retrieved from mouse bone marrow on day 9. 19-HIT and 19-HIT80BB cells clustered separately (Fig. 1i, Extended Data Fig. 2a–c) and differed in their expression of genes associated with T cell dysfunction (ID3, NR4A2, Fig. 1k, Extended Data Fig. 3a)38, 39. We also observed increased expression of inhibitory receptors (CD200, CTLA4, TIGIT, LAG3, BTLA) in HIT cells and cell division and cytotoxicity genes (MKI67, IL7R, GZMA, GZMH, GZMM, LTB) in HIT80BB (Fig. 1j, k, Extended Data Fig. 2d, 3a, b). These findings are consistent with 80BB imparting increased accumulation and prolonged functional maintenance to HIT T cells. Altogether, our in vitro and in vivo characterization of HIT80BB cells underscores the benefits of expressing 80BB in adoptively transferred T cells to sustain their numbers and function.
80BB directs both CD28 and 4–1BB costimulation
To validate the functionality of the 4–1BB moiety of 80BB, we compared HIT cells expressing either 80BB (HIT80BB), a truncated variant lacking the intracellular 4–1BB domain (HIT80ΔBB) or full-length CD80 (HITCD80) in vitro and in vivo. All three molecules were well expressed at the T cell surface (Extended Data Fig. 4a). T cells endowed with 80BB, 80ΔBB or CD80 all produced increased levels of interleukin-2 (IL-2) upon exposure to antigen compared to HIT cells (Fig. 2a, left panel). However, secretion of IL-13, a cytokine more closely associated with 4–1BB signalling40, was comparable between HIT, 80ΔBB and CD80 and only increased in HIT80BB cells, suggesting that it reflected 4–1BB signaling (Fig. 2a, right panel).
Figure 2: 80BB provides dual 4–1BB and CD28 costimulation required for optimal anti-tumour function.
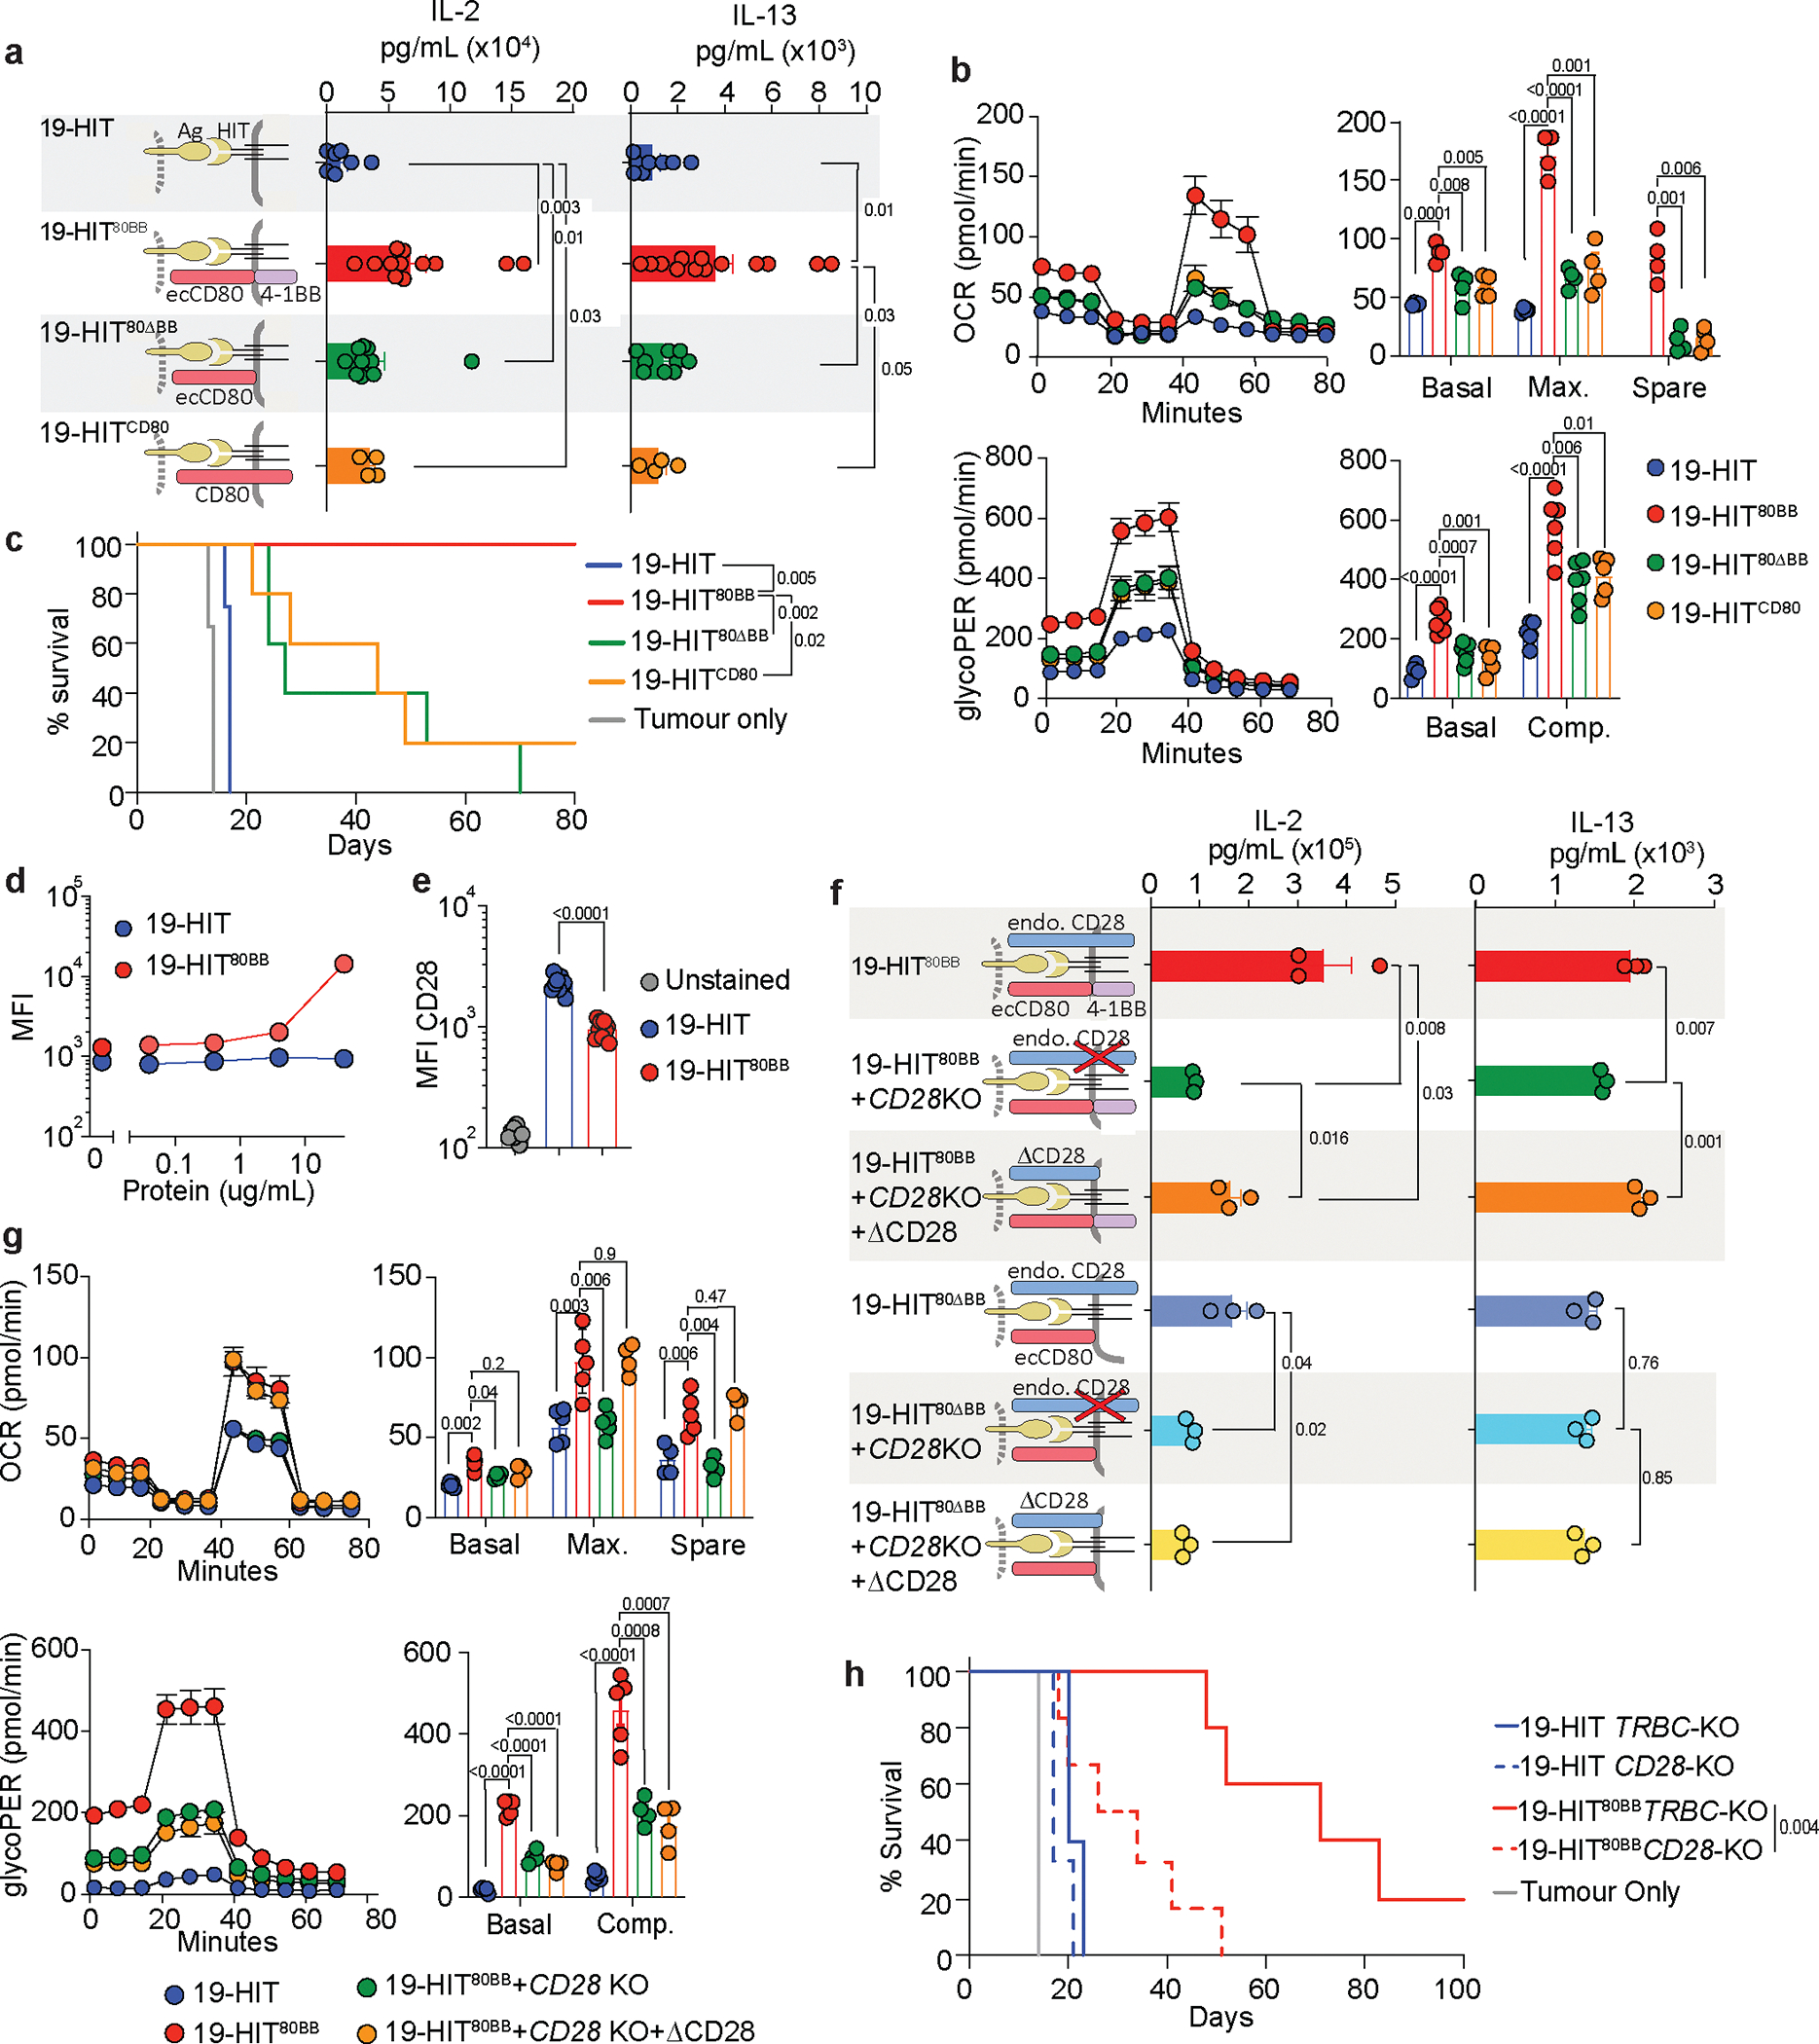
a, Left, diagrams depicting 19-HIT, 19-HIT80BB, 19-HIT expressing 80BB lacking the intracellular domain (19-HIT80ΔBB) and 19-HIT expressing full-length CD80 (HITCD80). Right, human IL-2 and IL-13 supernatant concentration 24hr post co-culture with NALM6 target cells at E:T ratio of 1:2. n=13 (19-HIT80BB, and 19-HIT80ΔBB), n=7 (19-HIT) or n=4 (19-HITCD80) independent healthy donors. b, Mitochondrial stress (top) and glycolytic rate (bottom) Seahorse assays were performed after 3 rounds of stimulation with NALM6 cells. n=6 independent reactions of cells from a healthy donor, representative of 3 healthy donors. c, Kaplan–Meier survival analysis of NALM6-bearing mice treated with 1×10⁵ 19-HIT, 19-HIT80BB, 19-HITCD80 or 19-HIT80ΔBB T cells (n=5 mice/group). d, Human CD28-Fc binding assay. T cells were incubated with increasing concentrations of CD28-Fc and then stained with PE-anti-Fc. Data are representative of 2 donors. e, MFI of CD28 surface staining 4 days after 19-HIT and 19-HIT80BB transduction. n=9 independent healthy donors. f, Left, diagrams depicting 19-HIT80BB, 19-HIT80BB+CD28 KO, 19-HIT80BB+CD28 KO transduced with CD28 lacking the intracellular domain (ΔCD28; HIT80BB+CD28 KO+ΔCD28), HIT80ΔBB, HIT80ΔBB+CD28 KO and HIT80ΔBB+ΔCD28. Right, human IL-2 and IL-13 supernatant concentration 24 h post co-culture with NALM6 target cells at E:T ratio of 1:2. n=3 independent co-cultures of cells from a healthy donor, representative of 3 donors. g, Mitochondrial stress (top) and glycolytic rate (bottom) Seahorse assays performed after 3 rounds of cell stimulation with NALM6. n=5 independent reactions of cells from a healthy donor, representative of 3 donors. h,Kaplan–Meier survival analysis of NALM6-bearing mice treated with 1×10⁵ 19-HIT80BB with KO-TRBC (control, n=5 mice), KO-CD28 (n=6 mice), or 1×10⁵ 19-HIT with KO-TRBC (control, n=5 mice) or KO-CD28 (n=5 mice). P values were determined by two-tailed Mann-Whitney test (a), two-tailed t-test (e), or log-rank Mantel-Cox test (c, h). Data are mean sem. q values in b, f, g were calculated based on two-tailed t-test p-values and adjusted using the two-state step-up method of Benjamini, Krieger and Yekutieli.
Further consistent with 4–1BB co-stimulation7, 41, HIT80BB cells exhibited greater basal, maximal, and spare respiratory capacity after three rounds of tumour stimulation relative to HIT80ΔBB and HITCD80 T cells (Fig. 2b). HIT80ΔBB and HITCD80 cells also exhibited reduced glycolysis compared to cells endowed with full-length 80BB (Fig. 2b), highlighting the breadth of metabolic benefits endowed by 80BB. It is noteworthy that 80ΔBB or CD80 still tended to endow greater respiratory capacities and glycolytic rates compared to HIT alone, pointing to a 4–1BB-independent metabolic effect of 80BB dependent on its CD80 moiety engaging CD28.
Consistent with greater strength of activation, we detected increased phosphorylation of PLCγ, AKT, NK-ĸB and ERK in stimulated 80BB-transduced T cells relative to 80ΔBB-endowed or mock-transduced T cells, further confirming the ability of 80BB to drive signalling via multiple known pathways downstream of CD28 and 4–1BB (Extended Figure 4b)42, 43.
The impact of 4–1BB signaling was readily evidenced in vivo by the reduced ability of HIT80ΔBB and HITCD80 T cells to control tumour growth in the NALM6 B-ALL mouse model relative to HIT80BB T cells (Fig. 2c). At the same time, T cells expressing either 80ΔBB or CD80 were still more effective in vivo than control HIT cells, consistent with our in vitro findings showing that 80BB can support T cell activity beyond its 4–1BB function.
To establish the nature of this additional effect, we first confirmed that 80BB could bind to CD28, as shown by incubating 80BB-expressing T cells with Fc-tagged CD28 protein (Fig. 2d, Extended Data Fig. 4c). T cells expressing 80BB also showed decreased cell surface expression of endogenous CD28 (Fig. 2e), consistent with its masking or internalization upon ligation to CD80. CD28 engagement was further supported by measuring decreased antigen-induced IL-2 secretion by HIT80BB cells when endogenous CD28 expression was ablated using CRISPR/Cas9 (Fig. 2f, Extended Data Fig. 4d). Re-expression of a non-signaling, truncated ΔCD28 (Extended Data Fig. 2e) in CD28 knock-out (CD28 KO) cells did not fully restore IL-2 secretion (Fig. 2f). Conversely, IL-13 secretion, which was also decreased in the absence of CD28, was fully restored upon ΔCD28 expression (Fig. 2f), indicating that maximal IL-13 secretion depended on 80BB binding to CD28 but not CD28 signaling. This is consistent with CD28 itself directly activating downstream IL-2 secretion and indirectly promoting IL-13 secretion by serving as an agonistic ligand for 80BB. Thus, CD28 and 80BB not only interact but serve as reciprocal activating ligands. HIT80ΔBB cells, which lack the 4–1BB signalling domain, do not exhibit increased IL-2 or IL-13 restoration upon ΔCD28 expression, further agreeing with the need for both CD28 and 80BB-dependent 4–1BB functions to uphold both cytokines’ secretion (Fig. 2f). Of note, the increased IL-2 and IL-13 secretion by HIT80BB cells could owe to both cis and trans interactions, as it was still observed at very low E:T ratios that minimize T cell : T cell interactions44, 45 (Extended Data Fig. 2f) and IL-13 was increased by exposure to NALM6 cells expressing exogenous ΔCD28 (Extended Data Fig. 2g).
We further assessed what function endogenous CD28 may contribute to the metabolic enhancement imparted by 80BB. CD28 disruption resulted in decreased metabolic respiration and glycolytic rates in HIT80BB cells (Fig. 2g). Expression of ΔCD28 in CD28-edited cells led to an increase in mitochondrial fitness, but no significant effect on glycolytic rate, consistent with previous reports on the metabolic effects of CD28 and 4–1BB co-stimulation41, 46 (Fig. 2g). To evaluate the relevance of endogenous CD28 for in vivo therapeutic efficacy, we treated NALM6-bearing NSG mice with HIT80BB, in which endogenous CD28 was either intact or edited (Extended Data Fig. 4d). HIT80BB cells performed significantly less well when CD28 was edited, confirming the dependence of 80BB on endogenous CD28 for its optimal activity (Fig. 2h). All together, the data confirm the dual co-stimulation ability of 80BB and dependence on both CD28 and 4–1BB signalling for optimal function.
CTLA4 is an alternate agonist ligand for 80BB
Since the CD28 KO did not completely abrogate anti-tumour efficacy, we investigated whether CTLA4, an alternate CD80 ligand, could serve as an 80BB agonist. If so, 80BB could then serve as a switch receptor, interacting with the negative regulator CTLA4 to produce an agonistic 4–1BB signal. Incubation of HIT80BB cells with soluble Fc-tagged CTLA4 confirmed CTLA4 binding (Fig. 3a, Extended Data Fig. 5a), with greater intensity and at lower protein concentrations than binding to CD28 (Fig. 2d vs. 3a). As CTLA4 is largely confined to intracellular compartment and is only transiently expressed at the cell surface following T cell activation, we generated a truncated form of CTLA4 (ΔCTLA4) known to constitutively traffic to the cytoplasmic membrane47. Following the double transduction of ΔCTLA4 and 80BB encoded by two separate vectors, we observed an inverse correlation between CD80 and ΔCTLA4 cell surface staining intensities (Fig. 3b), consistent with the excess ΔCTLA4 precluding the detection of cell surface CD80.
Figure 3: CTLA4 binding to 80BB enhances HIT T cell anti-tumour function.
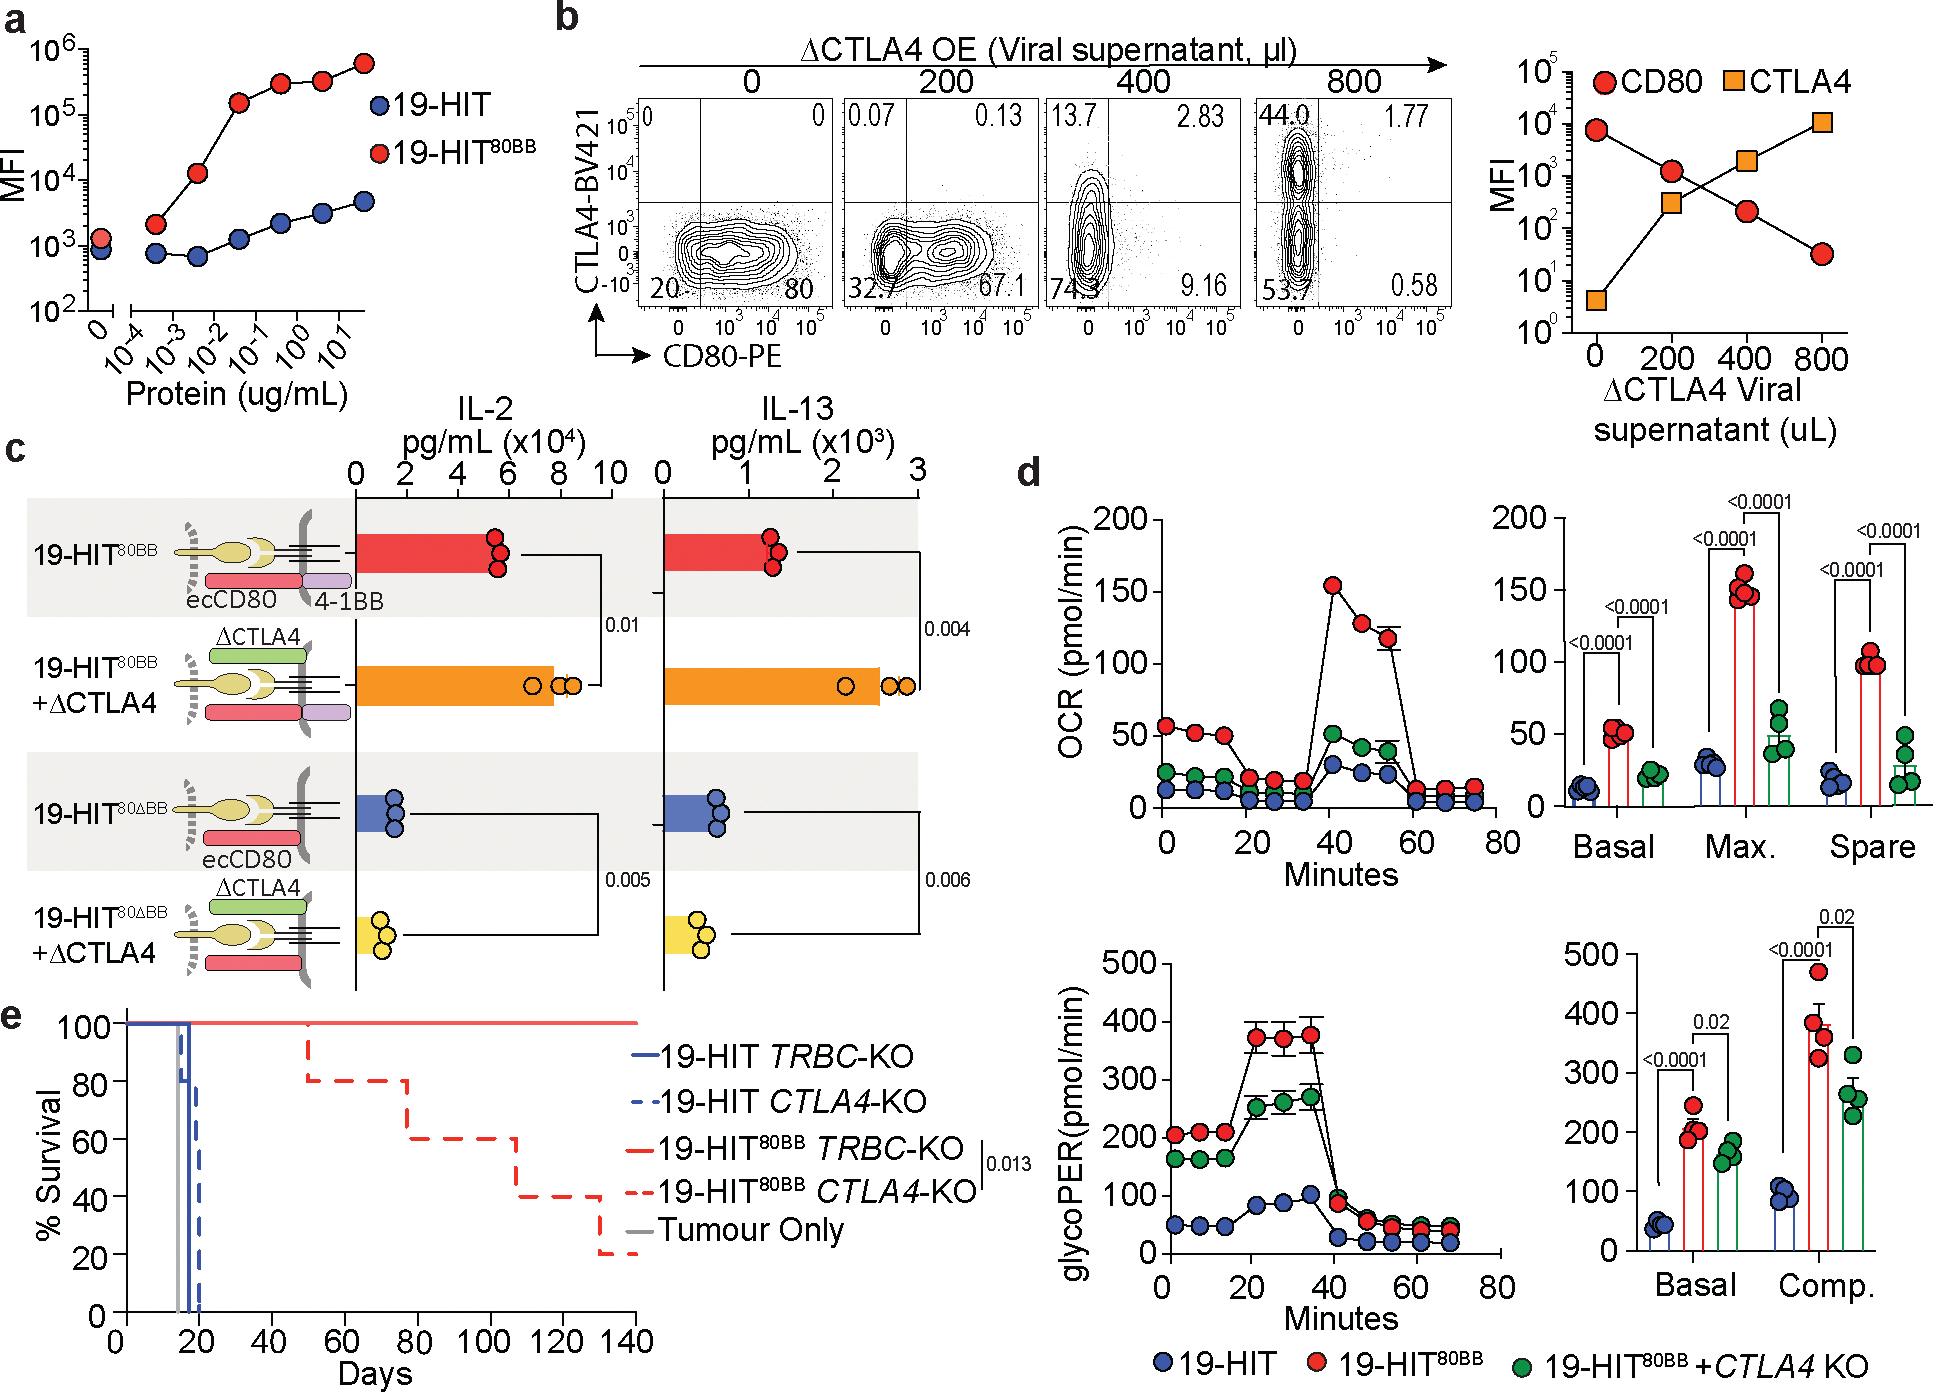
a, Human CTLA4-Fc binding assay. T cells were incubated with increasing concentrations of CTLA4-Fc and then stained with PE-anti-Fc. Data are representative of 2 donors. b, Flow cytometry profile of CD80 and CTLA4 surface expression. T cells co-transduced with stable amount of viral supernatant encoding for 80BB and a gradient of viral supernatant encoding for truncated CTLA4 lacking its intracellular domain (ΔCTLA4). Right, MFI of CD80 and CTLA4 surface detection. MFI quantified in right panel. Data are representative of 3 donors. c, Diagram depicting 19-HIT80BB, 19-HIT80BB transduced with ΔCTLA4 (HIT80BB+ΔCTLA4), 19-HIT80ΔBB and HIT80ΔBB+ΔCTLA4. Human IL-2 and IL-13 supernatant concentration 24 h post co-culture with NALM6 target cells at E:T ratio of 1:2. n=3 independent co-cultures of cells from a healthy donor, representative of 3 donors. d, Mitochondrial stress (top) and glycolytic rate (bottom) Seahorse assays were performed after 3 rounds of cell stimulation with NALM6 target cells. n=5 (19-HIT, 19-HIT80BB top panel) or n=4 (all other conditions) independent reactions of cells from a healthy donor, representative of 3 donors. e, Kaplan–Meier survival analysis of NALM6-bearing mice treated with 1×10⁵ 19-HIT80BB or 19-HIT with KO TRBC (control) or KO CTLA4 (n=5 mice/group). P values were determined by two-tailed t-test (c) or log-rank Mantel-Cox test (e). Data are mean ± sem. q values in d were calculated based on two-tailed t-test p-values and adjusted using the two-state step-up method of Benjamini, Krieger and Yekutieli.
To assess the functional consequences of CTLA4 binding to 80BB, we first overexpressed ΔCTLA4 in HIT cells and measured IL-2 and IL-13 secretion. HIT80BB cells expressing ΔCTLA4 significantly increased IL-2 and IL-13 secretion, consistent with an agonistic effect of CTLA4 binding to 80BB (Fig. 3c). HIT80ΔBB did not show an increase in IL-2 or IL-13 secretion upon ΔCTLA4 overexpression, confirming the dependence of the observed cytokine induction on the intracellular 4–1BB domain. Consistent with our observations with NALM6 cells expressing exogenous ΔCD28 (Extended Data Fig. 2g), NALM6 overexpressing ΔCTLA4 increased IL-13 secretion in HIT80BB but not HIT cells (Extended Data Fig. 5b). This interaction in trans further sustained the cytolytic activity of HIT80BB T cells, as evidenced by the latter’s greater efficacy against NALM6ΔCTLA4 compared to NALM6wt in an in vitro tumour rechallenge assay (Extended Data Fig. 5c).
To establish whether endogenous CTLA4 contributes to 80BB overall activity, we ablated CTLA4 and assessed the metabolic consequences in HIT80BB cells (Fig. 3d, Extended Data Fig. 5d). CTLA4-edited HIT80BB cells exhibited decreased respiratory and glycolytic capacities, although still elevated relative to HIT cells (Fig. 3d, Extended Data Fig. 5d). We further evaluated the contribution of endogenous CTLA4 on 80BB function in vivo by treating NALM6-bearing mice with T cells in which the endogenous CTLA4 was either intact or edited. Tumour elimination was substantially reduced in mice treated with CTLA4-edited HIT80BB cells (Fig. 3e), confirming the agonistic role of CTLA4 in increasing HIT80BB cell potency.
Our findings that both endogenous CD28 and CTLA4 editing reduced HIT80BB function led to us to examine side by side the relative kinetics of CD28 and CTLA4 ablation in the in vitro tumour rechallenge model. The CD28 KO in HIT80ΔBB and HIT80BB T cells resulted in earlier T cell failure compared to the CTLA4 KO (Extended Data 5e), confirming the importance of both 80BB ligands and further suggesting an earlier role for CD28 and a later one for CTLA4.
HIT80BB cells exhibit a suitable safety profile
The occurrence of 80BB interactions with CD28 in trans raised the possibilities of by-stander T cell activation and cytokine release syndrome. Other ligands such as CD28 super-agonist antibodies have been shown to elicit acute cytokine release from T cells48. We therefore co-cultured by-stander HIT cells with either HIT80BB cells at ratio 1:1 or with CD28 super-agonist antibody (CD28SA; Extended Data Fig. 6a). The co-culture of bystander HIT with HIT80BB cells did not result in CD69 up-regulation nor increased cytokine secretion, in contrast to cells exposed to CD28SA (Extended data 6b, c). To further probe the HIT80BB safety profile, we tested whether 80BB expression on T cells exacerbated CRS in vivo. To this end, we administered a high dose of HIT or CAR T cells to mice bearing CD19+ RAJI cells in a previously described CRS model49. Mice receiving HIT80BB T cells developed a similar or lesser clinical CRS than mice given clinically relevant 19–28z CAR T cells50–52 as evidenced by similar trends in weight loss (Extended Data Fig. 6d) and lesser diarrhea with HIT80BB T cells compared to 19–28z (Extended data Fig. 6e). Serum cytokine levels (IL-6 and G-CSF) did not differ between HIT and HIT80BB-treated mice and tended to be lower than found in the 19–28z-treated group (Extended data 6f). Collectively, these data underscore the favourable safety profile of T cells that express 80BB.
80BB enhances TCR-mediated tumour rejection
Having hitherto focused on CD19 HIT T cells in the well-established NALM6 leukemia model, we sought to expand the spectrum of therapeutic contexts in which 80BB may be useful. Thus, we investigated the activity of 80BB in TCR engineered T cells targeting melanoma. We transduced an NY-ESO-1-specific, HLA-A0201-restricted TCR (ESO-TCR; Fig. 4a) into the TRAC locus, with or without the addition of 80BB (Extended Data Fig. 7a). Similar to its effect in HIT T cells, 80BB enhanced the ability of NY-ESO-1 specific T cells to control tumour in a serial cytotoxicity assay (Fig. 4b). Treatment of mice bearing subcutaneous HLA-A0201+/NY-ESO-1+ SK-MEL-37 melanoma cells with ESO-TCR80BB achieved superior tumor control to the ESO-TCR treated group (2.5×10⁶ ESO-TCR cells, Fig. 4c) and led to improved survival (1.0×10⁶ cells, 0.5×10⁶ ESO-TCR cells, Fig. 4d).
Figure 4: 80BB enhances TCR-engineered T cell control of subcutaneous melanomas.
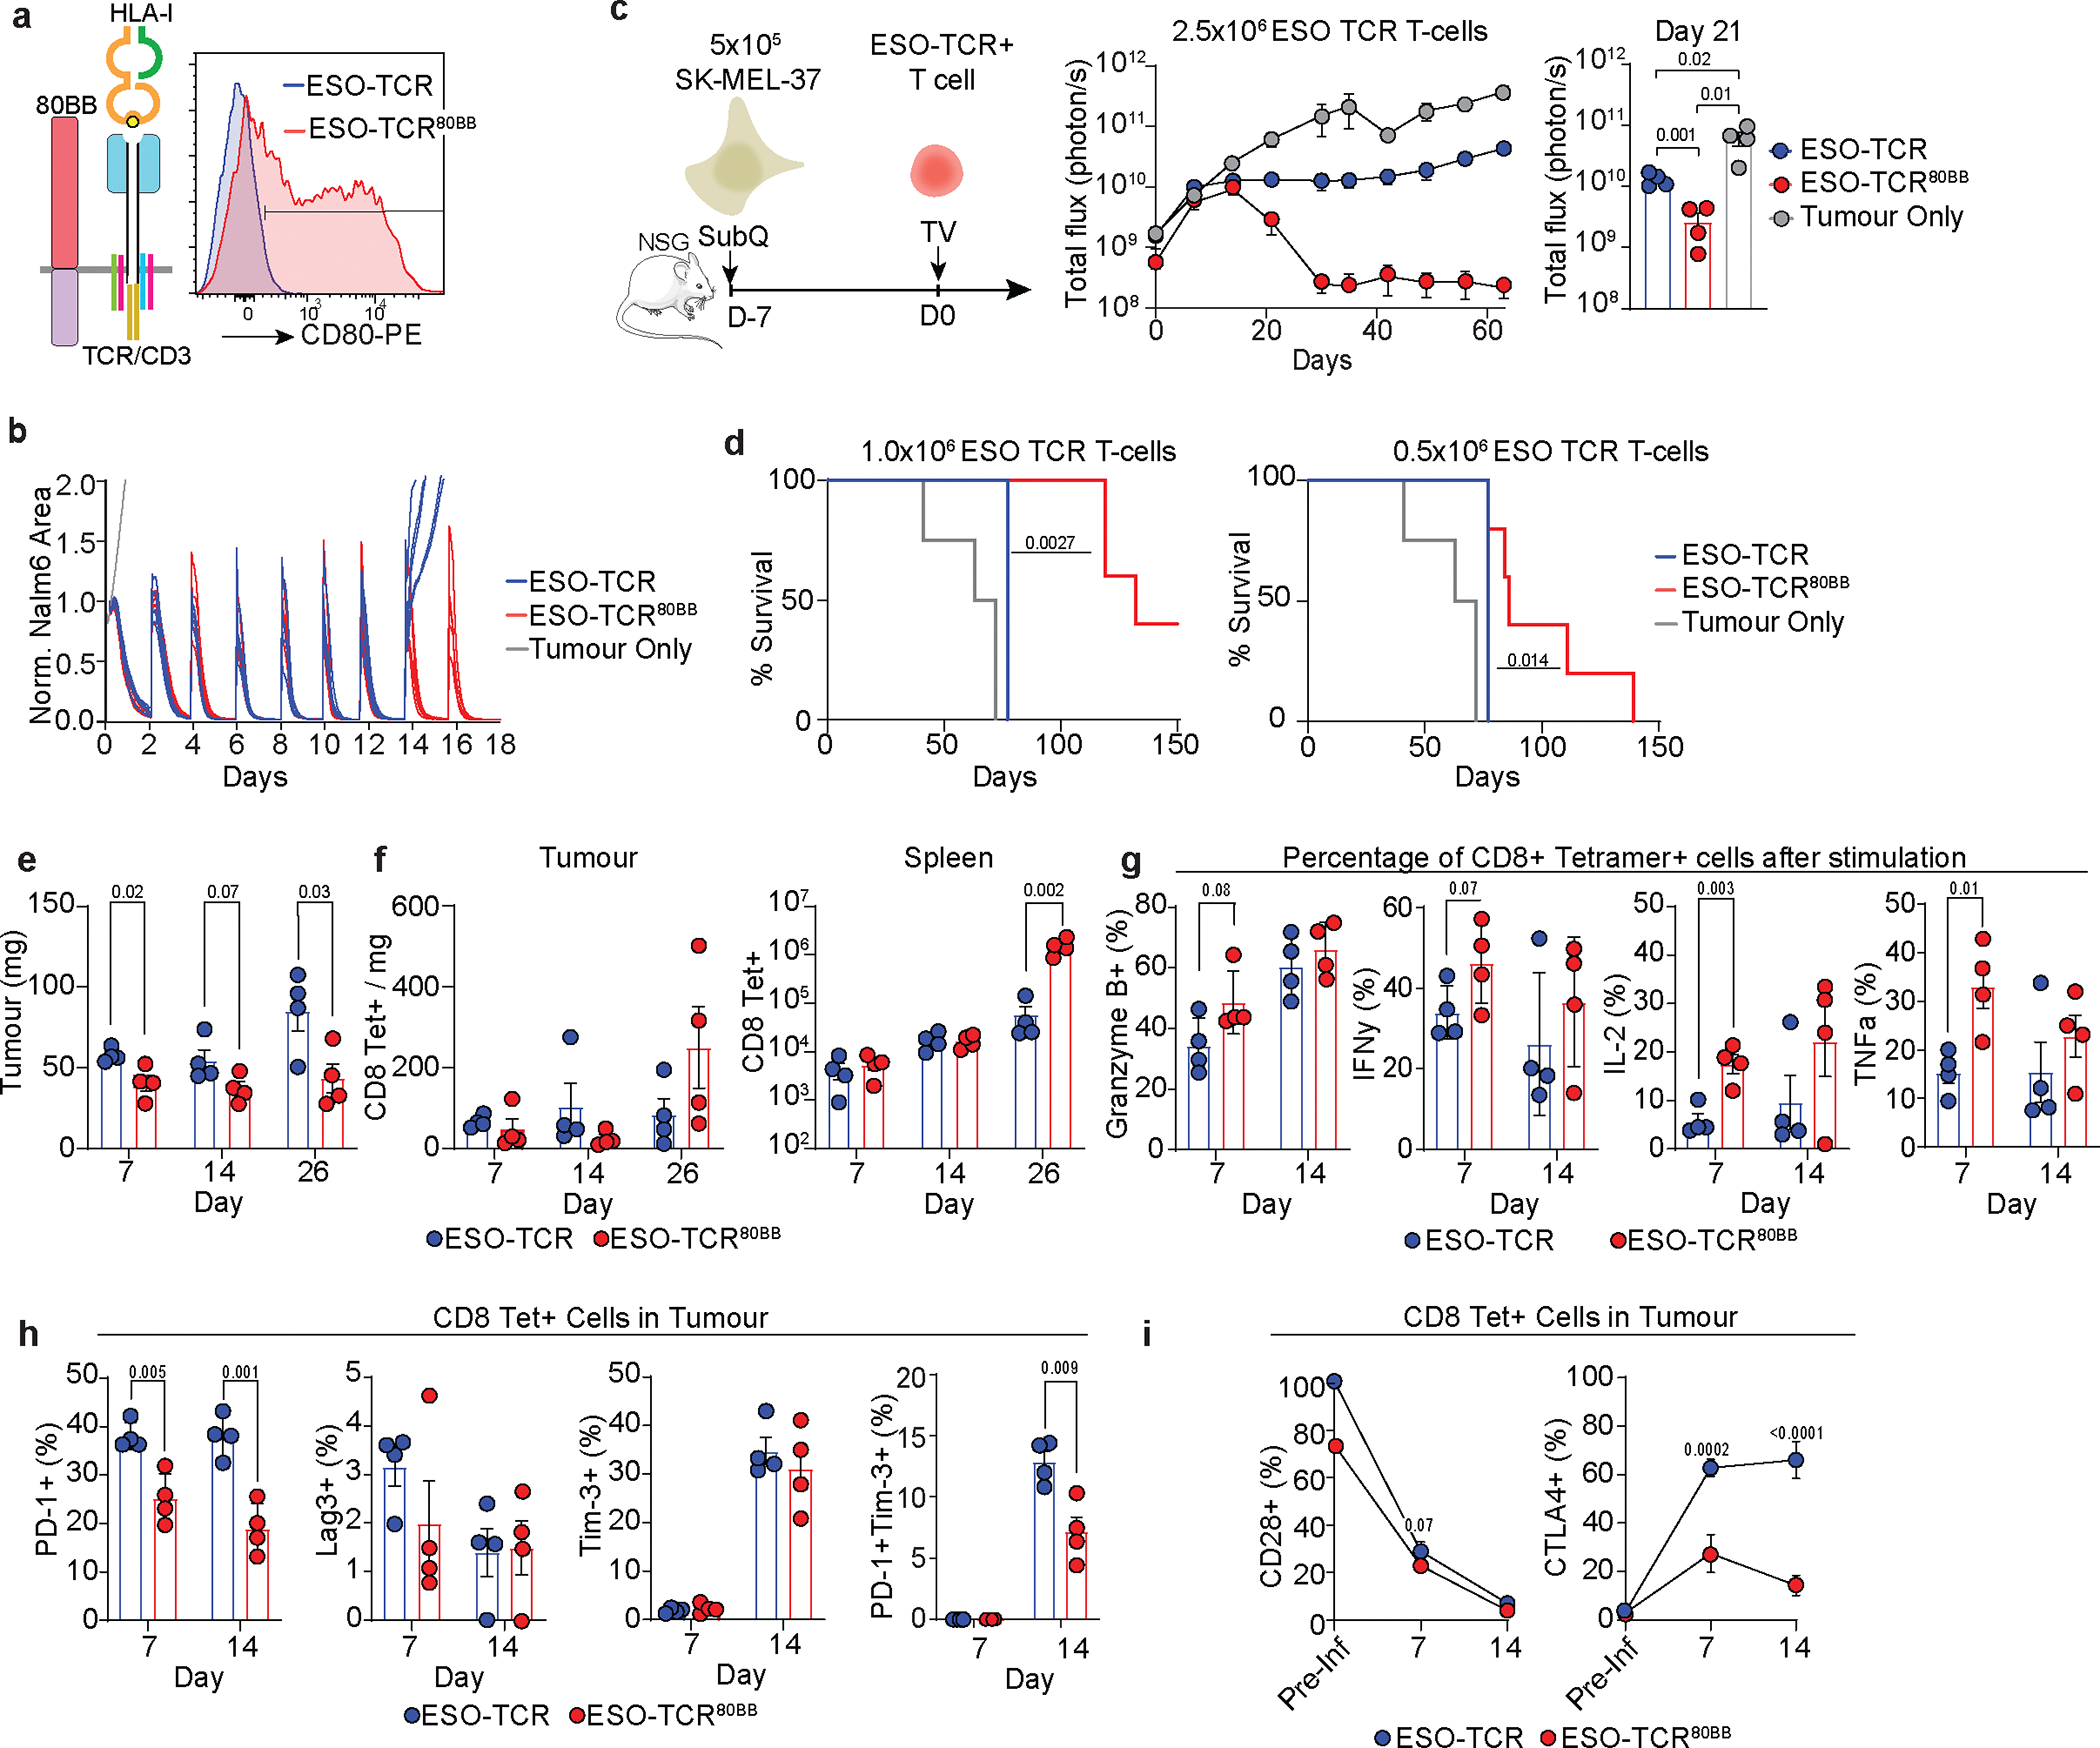
a, Left, diagram of NY-ESO-1 TCR-endowed cell expressing 80BB (ESO-TCR80BB). Right, representative flow cytometry plot of CD80 expression on ESO-TCR+ T cells. Data are representative of 10 donors. b, Serial in vitro cytotoxicity assay of ESO-TCR+ T cells co-cultured with fresh NALM6 cells added every 2 days. Each line represents n=5 independent co-cultures of cells from a healthy donor. c,Left, diagram depicting in vivo treatment of SK-MEL-37 (HLA.A2.1+, NY-ESO-1+)-bearing mice with ESO-TCR+ T cells. Right, tumour burden was monitored using bioluminescence imaging (total flux); tumour burden at day 21 post T cell injection is shown. n=4 mice per group. d, Kaplan–Meier survival analysis of mice bearing subcutaneous SK-MEL-37 treated with 1×10⁶ and 0.5×10⁶ ESO-TCR or ESO-TCR80BB (n=5 mice/group). e, Weight of tumours. f, Counts of CD8+ NY-ESO-1 Tetramer+ T cells isolated from tumour (count/mg, left) and spleen (abs. count, right). g,Percentage of CD8+ Tetramer+ T cells staining for Granzyme B, IFNγ, IL-2 and TNFα after 4hrs of PMA/Ionomycin stimulation. h,Expression of PD-1, Lag3, and Tim3 on CD8+ Tetramer+ tumour-isolated T cells. i,Expression of CD28 and CTLA4 on CD8+ NY-ESO-1 Tetramer+ T cells pre-infusion and tumour-isolated T cells. e-i, Samples from mice inoculated with SK-MEL-37 and treated with 2.5×10⁶ ESO-TCR cells or ESO-TCR80BB cells at specified time points. n=4 mice per group per time point. P values were determined by log-rank Mantel-Cox test (d), or two-tailed t-test (c, e, f, h, i). Data are mean ± sem.
Characterization of T cells retrieved from spleens collected 7, 14 or 26 days post 2.5×10⁶ ESO-TCR T cell infusion showed increased accumulation of CD8+ ESO-TCR80BB over ESO-TCR cells (Extended Data Fig. 7b), which paralleled a similar trend of increased accumulation at the tumour site (Fig. 4e, f). In spleen, significantly increased ESO-TCR80BB T cell counts, included a significantly higher number of central and effector memory cells (Extended Data Fig. 7c).
The functional potential of T cells during the phase of tumor eradication (days 7 and 14) was evaluated ex vivo by stimulating isolated T cells with PMA/ionomycin. ESO-TCR80BB exhibited elevated expression levels of effector cytokines Granzyme B, IFNɣ, IL-2 and TNFα (Fig. 4g, Extended Data Fig. 7d). This enhanced functionality was associated with decreased PD-1, Tim3 and CTLA4 expression in ESO-TCR80BB cells (Fig. 4h, I, Extended Data Fig. 7e). In pre-infusion T cells, we observed CD28 but no CTLA4 expression, whereas by day 14, CD28 was not detected in tumour-isolated T cells, concomitant with increased detection of CTLA4 (Fig. 4i). Altogether, these data highlight the superior functionality and accumulation of ESO-TCR80BB in this solid tumor model.
Since the efficacy of single TCR targeting may be limited in solid tumours, the latter finding prompted us to explore whether 80BB could boost the function of tumour-infiltrating lymphocytes (TILs) expressing their endogenous TCRs. Adoptive transfer of ex vivo expanded TILs is a promising cellular therapy in metastatic melanoma53; thus, we examined whether 80BB could enhance the function of TILs in a pre-clinical tumor model. To this end, we expanded T cells from a metastatic melanoma specimen resected from a patient with no prior systemic therapy, using a rapid expansion protocol (REP) and transduced them 3 days after OKT3 activation with either 80BB or a control vector encoding LNGFR (Fig. 5a). We verified that REP-expanded TILs expressed CD28 and were effectively transduced (Extended Data Fig. 8a, b). TILs80BB and TILsLNGFR were phenotypically similar (Extended Data Fig. 8b, c, d) and comparably lytic against melanoma immediately after REP but showed increased expansion over 5 days following exposure to autologous tumour stimulation (Fig. 5b, Extended Data Fig. 8e). In an in vitro repetitive challenge experiment with autologous tumour, TILs80BB and TILsLNGFR showed comparable tumour lysis at the first tumour challenge, but TILs80BB exhibited greater cytolytic potential in subsequent rechallenges (Fig. 5c). Metabolic studies after 3 rounds of stimulation with patient-matched tumour cells showed increased mitochondrial function and glycolytic rates in TILs80BB, highlighting the ability of 80BB to endow TILs with improved metabolism (Fig. 5d, e). In an in vivo autologous tumour xenograft model, TILs80BB provided superior survival compared to TILsLNGFR, which only achieved a transient early response (Fig. 5f, g, h). In summary, our studies support the effectiveness and usefulness of expressing 80BB to support the function of T cells engaging their target through CD3-dependent receptors for antigen, including HIT and TCR engineered T cells.
Figure 5: 80BB endowed TILs exert improved anti-tumour function in vitro and in vivo.

a, Diagram of TIL rapid expansion protocol (REP) and γ-retrovirus transduction with LNGFR (control, TILsLNGFR) or 80BB (TILs80BB). b, Flow cytometry profile (left) and quantification (right) of CellTrace violet labeled TILs 5 days post-stimulation with autologous patient-derived tumour (SK-MEL-956A). n=6 independent co-cultures of cells from 1 patient-derived tumour sample. c, Serial in vitro cytotoxicity assay with fresh SK-MEL-956A cells added every 4 days to the culture. n=6 (TILS80BB, TILsLNGFR) or n=3 (Tumour only) independent co-cultures of cells from 1 patient-derived tumour sample. d, e,Mitochondrial stress (d) and Glycolytic rate (e) Seahorse assays were performed after 3 rounds of cell stimulation with patient-matched target cells. n=8 independent reactions of cells from 1 patient-derived tumour sample. f, Diagram depicting in vivo treatment of SK-MEL-956A-FFluc-bearing mice with 1×10⁷ TILsLNGFR or TILs80BB. g, h, SK-MEL-956A-FFluc-bearing mice treated with 107 TILsLNGFR or TILs80BB (n=5 mice/group for TILsLNGFR and n=4 mice/group for TILs80BB). g, Tumour burden monitored using bioluminescence image (total flux). Tumour burden at days 31 and 87 post T cell injection is shown. h, Kaplan–Meier survival analysis. P values were determined by log-rank Mantel-Cox test (h), or two-tailed t-test (b, d, e, g). Data are mean ± sem.
Discussion
We demonstrate, in hematologic and solid tumour models, the therapeutic benefit of expressing 80BB in HIT or TCR-engineered T cells. 80BB is a chimeric receptor capable of activating both CD28 and 4–1BB costimulatory pathways. It acts as an agonist for endogenous CD28 and provides a 4–1BB effect upon binding to either CD28 or CTLA4. HIT80BB cells consistently showed robust T cell expansion while maintaining improved T cell metabolic fitness and tumour lysis capabilities. In vivo, HIT80BB showed long-term tumour control at stress-level T cell doses, which HIT T cells lacking 80BB could not achieve. We found increased HIT80BB T cell accumulation in the bone marrow of leukemic mice at day 9, accompanied by lesser expression of inhibitory markers and transcription factors associated with T cell dysfunction38, 39, 54 (Fig. 1). Our studies underscore the benefit of co-expressing 80BB with an NY-ESO-1 specific TCR to control a subcutaneous melanoma in immunodeficient mice. T cell potentiation was also obtained in polyclonal TILs of a melanoma patient, resulting in improved control of autologous melanoma (Fig. 4). Overall, our findings underscore the efficacy and versatility of the 80BB receptor, and while we only investigated 80BB with TCR or HIT T cells, we anticipate that 80BB will enhance the potency of any of the CD3-dependent CARs9–14.
Based on protein binding assays, genetic ablation, and over-expression studies, we established that 80BB has the ability to bind to CD28 and CTLA4 whereupon it mimics 4–1BB co-stimulation as reflected in cytokine secretion, metabolic fitness, and enhanced tumour elimination (Fig. 2). As 80BB can interact with CD28, which is constitutively expressed in early differentiated T cells, and CTLA4, which is transiently expressed upon T cell activation and is enriched in terminal effector and exhausted T cells54, 80BB has the potential to support T cell function at different stages of T cell differentiation. Our studies in the NALM6 model demonstrate that 80BB-mediated enhancement of tumour rejection does not require the expression of 80BB ligands by the targeted tumour cell.
Cognizant of the risk of engaging CD28 with non-physiological CD28 super-agonist antibody therapy48, we carefully monitored for potential toxicities imparted by 80BB. No safety signals such as weight loss, tumour-independent T cell proliferation nor increased rates of GvHD, were observed in mice treated with 80BB-expressing T cells in either HIT, TCR or TIL settings. Given the known structural and functional differences between murine and human CD28, 4–1BB and CTLA4,48, 55–58 we did not establish a syngeneic model, but rather investigated the potential for 80BB to elicit by-stander T cell activation in two human T cell models. We found that 80BB costimulation did not transactivate co-cultured human T cells in vitro and that 19-HIT80BB cells did not elicit greater CRS than a conventional CAR T cell in an established CRS model in vivo49.
Various synthetic engineering approaches have been previously developed to support the survival or function of natural or TCR-engineered T cells, some of which aimed to provide costimulatory support to T cells. Chimeric co-stimulatory receptors allow for tumour-antigen (GD2, CD19, or FOLR1) induced delivery of costimulation19, 20, 59. Unlike 80BB, CCRs are dependent on antigen expression by tumour cells. TCR-engineered T cells may be protected from TGFβ inhibition or Fas-mediated apoptosis by dominant-negative receptors60, 61; these receptors abate inhibitory signals but do not deliver agonistic co-stimulation. The fusion of a co-stimulatory signalling motif to a dominant negative receptor or an inhibitory receptor, such as CD200R, Fas, TGFß-R2 or PD-1 can protect from inhibitory signals and further provide supportive co-stimulation leading to more functional T cells in preclinical models21, 22, 24, 62. These switch receptors largely require expression of their specific ligands in the tumour microenvironment to deliver their costimulatory signal, although some have been detected in T cells63, 64, suggesting possible T cell intrinsic interactions. The incorporation of costimulatory domains directly into TCR α or β chains has been previously attempted17, 18 including fusing the OX40 signaling domain to TCR α and β chains in the STAR receptor.65 However, the degree to which chimeric TCR α and β chains augment T cell potency without compromising antigen sensitivity remains to be elucidated18.
Clinically investigated strategies to enhance the efficacy of TCR-directed T cells are overall confined to TILs, which are typically dependent on exogenous IL-2 for their engraftment and persistence53. As multiple approaches to support T cells with systemically active cytokines or co-stimulatory agonist antibodies have led to toxicities15, 16, 53, efforts increasingly focus on T cell engineering approaches that may be more effective and less toxic. TILs constitutively expressing IL-2 or IL-12 have to date led to limited therapeutic success 66, 67. Clinical trials to evaluate TCR or chimeric TCR engineered cells or TILs either lacking PD-168, 69, co-expressing a CCR59 or a switch receptor70 have been recently initiated.
80BB further extends the tools available to support adoptive cell therapies that rely on TCR or CD3-dependant CARs for tumour recognition2, 4, 5 as an approach to provide T cell-restricted, antigen-independent costimulatory support. 80BB will be especially useful to support HIT T cells, which are HLA-independent and capable of detecting lower antigen levels than current CARs and are thus poised to reduce antigen-low relapses. The small size of the 80BB cDNA makes it an easy adjunct to incorporate in a variety of genetic engineering strategies to further expand the efficacy and scope of T cell therapies.
Methods
Ethical Approval
All animal experiments were performed under a protocol approved by the MSKCC Institutional Animal Care and Use Committee (Protocol #04–10-024, 17–08-005). Human biospecimen collection and use were approved by the MSK Institutional Review Board (IRB# 19–101).
Cell lines and cell culture
NALM6 B-ALL leukemia cells (Cat# CRL-3273) and Burkitt Lymphoma Raji cells (Cat# CCL-86) were obtained from ATCC and transduced to express firefly luciferase-GFP. NALM6 (NY-ESO-1+ and CD19+) cells for CD19 HIT and NY-ESO-1 TCR experiments for Incucyte assays were generated by sequential transduction and sorting with NY-ESO-1-P2A-mCherry, HLA-A0201-P2A-mTangerine and β2m-P2A-mKate. NALM6ΔCTLA4 and NALM6ΔCD28 were generated by transduction of NALM6 to express truncated ΔCTLA4 and ΔCD28 and sorted by flow cytometry. NALM6 cell lines with decreased CD19 densities were previously described14. SK-MEL-37 were provided by the Ludwig Center for Immunotherapy at Memorial Sloan-Kettering Cancer Center. SK-MEL-37 and SK-MEL-956A was transduced to express firefly luciferase-GFP or Incucyte® Nuclight Red (Essen Bioscience) for Incucyte analysis. All cell lines were maintained in RPMI-1640 medium (Corning) supplemented with 10% FBS except for SK-MEL-956A, which were maintained in medium supplemented with 20% FBS (Neuromics), 10 mM HEPES (Invitrogen), 2 mM L-glutamine (Gibco), 1× NEAA (Invitrogen), 1 mM sodium pyruvate (Invitrogen), 100 U/ ml penicillin, 100 μg/ ml streptomycin (Corning). NALM6 media was supplemented with 50 μM β-mercaptoethanol (Gibco). Cells were regularly tested for mycoplasma.
T cell activation, gene targeting and transduction
Buffy coats from healthy volunteer donors were obtained from the New York Blood Center. Sex of donors was not available. Peripheral blood mononuclear cells (PBMCs) were isolated by density gradient centrifugation using Lymphocyte Separation medium (Corning), subsequently T cells were isolated using a Pan T cell isolation kit (Miltenyi Biotec). Cells were activated using CTS Dynabeads™ CD3/CD28 activation beads (ThermoFisher) at a 1:1 Bead: T cell ratio. T cells were cultured in RPMI-1640, supplemented with 10% FBS, and 100 U/ ml penicillin, 100 μg/ ml streptomycin and 2 mM L-glutamine with 3000 units IL-7 (Miltenyi Biotec) and 100 units IL-15 (Miltenyi Biotec) at a starting concentration of 1×10⁶ T cells/mL. Cells were cultured in a 37°C incubator with 5% CO2. 48hr after T cell activation, CD3/CD28 beads were magnetically removed, cells were resuspended in P3 buffer Cas9 ribonucleoprotein (RNP) and relevant gRNA were co-delivered using the Nucleofector 4D device (Lonza). Following electroporation, cells were resuspended in 1mL of X-Vivo 15 (Lonza) media without serum, 100 U/ ml penicillin, 100 μg/ ml streptomycin and 3000 units IL-7 and 100 units IL-15 per 1×10⁷ T cells pre-electroporation. Recombinant AAV6 donor vector (Signagen) was added at an MOI of 4×10⁴ per viable T cell, assuming a 66.6% viability after electroporation. 24hr later, T cells were mixed with a titrated amount of SFG γ-retroviral vector, diluted to 1.5×10⁶ T cells/mL in T cell media, and plated onto non-tissue culture treated 6-well plates (Falcon) pre-coated with Retronectin (Takara, T100B). Plates were centrifuged for 1hr at 300g. Cell cultures were replenished with additional T cell media as needed to maintain a density of 1–1.5 × 10⁶ cells/ml, with fresh 3000 units IL-7 and 100 units IL-15 replenished every 48hr. For assays using sorted CD4 or CD8 only T cells, column-based depletion was performed using either CD4 Microbeads (Miltenyi Biotec) or CD8 Microbeads (Miltenyi Biotec) as per the manufacturer’s instructions.
Autologous patient-derived tumors and Tumour-Infiltrating Lymphocyte (TILs) culture
All the patients signed an approved informed consent before providing tissue samples. Patient samples were collected on a tissue-collection protocol approved by the MSK Institutional Review Board. Sex was not considered in this study due to limited patient number (n=1) and all comparisons were done against control-treated cells from the same patient. Single-cell suspensions from patients’ tumors were obtained by digesting the tumor samples with 2 mg/ml type I collagenase (ThermoFisher), 2 mg/ml type V hyaluronidase (Sigma-Aldrich), and 200 U/ml type IV deoxyribonuclease I (Sigma-Aldrich) in serum-free RPMI 1640 using a GentleMACs Octo Dissociator (Miltenyi Biotec) and viably frozen at −80°C prior to use. Patient-derived SK-MEL-956A melanoma cells were generated by culturing fresh single-cell suspension from a patient in RPMI-1640 with 20% FCS (ThermoFisher), and 100 U/ ml penicillin, 100 μg/ ml streptomycin and subsequently cultured as described above.
TILs rapid expansion protocol (REP) was adapted from Dudley et al71. Briefly, TILs were resuspended in 2mL of Complete Medium (RPMI-1640, Corning; 25mM HEPES, Invitrogen; 10% Human Serum, GeminiBio; 1× NEAA, Invitrogen; 1x Glutamax, Gibco; 100 U/ ml penicillin, 100 μg/ ml streptomycin Corning), with 6,000 IU/mL of rhIL-2 (Miltenyi Biotec). rhIL-2 was added twice weekly, and cells were split once media colour indicating cell growth. On day 14, cells were resuspended in 15mL of 1:1 mixture of complete media and AIM V Medium (Thermo Fisher Scientific) per 5×10⁵ cells and co-cultured with 5×10⁶ irradiated (50 Gy) allogeneic PBMC feed cells from 5 pooled donors with 3,000 IU rhIL-2 (Miltenyi Biotec) and 30ng/mL OKT3 (Biolegend) as previously reported71. On day 3 post activation, cells were transferred to non-tissue culture treated 6-well plates (Falcon) pre-coated with Retronectin (Takara) at 5×10⁶ cells / well in 2mL of 1:1 RPMI 1640/AIM V media and SFG γ-retroviral vector encoding LNGFR or 80BB. Cells were centrifuged for 1hr at 300g. Fresh media was given to cells twice weekly. 11 days post transduction, T cells were bead sorted to remove any residual PBMCs using a human pan T cell isolation kit (Miltenyi Biotec) and used for subsequent experiments.
Vector constructs and production
The cDNA containing the extracellular domain, transmembrane domain, and first four intracellular amino acids of human CD80 and the corresponding intracellular domain of human 4–1BB were cloned into the SFG γ-retroviral vector to express of CD80–4-1BB fusion molecule (80BB). Sequence: MGHTRRQGTSPSKCPYLNFFQLLVLAGLSHFCSGVIHVTKEVKEVAT LSCGHNVSVEELAQTRIYWQKEKKMVLTMMSGDMNIWPEYKNRTIFDITNNLSIVILALRPSDEGTYECVVLKYEKDAFKREHLAEVTLSVKADFPTPSISDFEIPTSNIRRIICSTSGGFPEPHLSWLENGEELNAINTTVSQDPETELYAVSSKLDFNMTTNHSFMCLIKYGHLRVNQTFNWNTTKQEHFPDNLLPSWAITLISVNGIFVICCLTYCF*. Constructs encoding truncated human CD80 (80ΔBB) were created using the cDNA corresponding to the extracellular domain, transmembrane domain and first four intracellular amino acids of CD80, while CD80 was generated by cloning the cDNA of full-length human CD80, into the SFG γ-retroviral vector. Human ΔCTLA4, constructs were generated by cloning cDNA corresponding to the extracellular domain, transmembrane domain and 7 first intracellular amino acids of CTLA4. Truncated CD28 (ΔCD28) construct was generated by cloning the CD28 extracellular domain and transmembrane domain. LNGFR reporter was described previously29. 19–28z CAR was previously described72. Viral supernatant was produced as previously described20. Briefly, vesicular stomatitis virus glycoprotein G pseudotyped retroviral supernatants derived from transduced gpg29 fibroblasts (H29) were used to construct stable retrovirus-producing cell lines73, 74. Supernatant from stable retroviral-producing cell lines was collected and concentrated using Retro-X (Takara) as per the manufacturer’s protocol.
The CD19 specific HIT (19-HIT) receptor AAV construct was made as described previously, based on a pAAV-GFP backbone (Cell Biolabs)14. To allow for NY-ESO-1-specific TCR-delivery into the endogenous TRAC locus using a TCR donor AAV, the complete TCRβ-P2A-TCRα sequence of an NY-ESO-1 TCR (Clone Lau 155) was cloned after the splice acceptor site and P2A sequence into the previously described pAAV-TRAC-1928z37, 75. AAV6 viruses were produced and quantified by SignaGen.
Cas9 protein, RNP formation and AAV6
Cas9 protein (40 μM) was obtained from the QB3-Berkeley Macrolab core facility. RNP was prepared by mixing Cas9 protein and total gRNA at 1:2 molar ratio and incubated in 37 °C water bath for 15 min and immediately used for T cell electroporation. gRNAs were purchased from Synthego with 2′-O-methyl 3′-phosphorothioate modifications in the first and last three nucleotides, with the following target sequences: TRAC: 5′-CAGGGTTCTGGATATCTGT, TRBC: 5’-GCAGUAUCUGGAGUCAUUGA, CD28, 5’-CACCAAAAUCUUGUUUCCUG and 5’-UCACCAAAAUCUUGUUUCCU, CTLA4: 5’-UUCCAUGCUAGCAAUGCACG, 5’-ACACAAAGCUGGCGAUGCCU, 5’-CCGGGUGACAGUGCUUCGGC. gRNA was resuspended with TE buffer at 40 μM.
Knock-out efficiencies were evaluated by flow cytometry (TRAC, CD28) or by inference of CRISPR Editing (ICE) for CTLA4 (Synthego). For inference of CRISPR Editing (ICE), primers were designed that bind 150 bp 5’ and 3’ of the anticipated cut sites Fwd: GGGTGTGGAGAGGGGAAGGGG, Rvs: GCCCAGGTAGTATGGCGGTGGG). Genomic DNA from CTLA4 knockout and control cells was isolated using a DNeasy kit (Qiagen), and the region of interest was amplified using Q5 polymerase (NEB). PCR product was verified on a gel and purified using a Nucleospin column (Macherey-Nagel). PCR product was submitted for sanger sequencing using the PCR primers, and resultant traces were input into ICE analysis software (Synthego).
T cell proliferation assay
NALM6 were used as targets for repetitive stimulation assays. For in vitro expansion assays, 1×10⁵ 19-HIT+ T cells were co-cultured with 2×10⁵ NALM6 target cells (ratio 1:2; E:T) in 500μL of T cell media with no exogenous cytokines. Every 2 days, cells were analyzed by flow cytometry to determine 19-HIT percentage and counted using Countbright beads (Invitrogen). 19-HIT cells were replated at 1×10⁵ HIT+ T cells and re-stimulated with 2×10⁵ NALM6 until cells ceased proliferating in response to stimulation.
For TILs proliferation assay, T cells were stained with CellTrace Violet (CTV) assay as per the manufacture protocol (ThermoFisher) and stimulated with autologous unlabeled targets at an E:T ratio of 1:2 with no exogenous cytokines. 5 days later, CTV dilution was measured by flow cytometry.
Cytotoxicity Assays
For repetitive cytotoxic assay using an Incucyte S3, 2×10⁴ NALM6 cells were plated per well onto a 96-well plate precoated with fibronectin (Sigma-Aldrich) for 1hr at room temperature. 1×10⁴ 19-HIT or TCR+ T cells were added to each well in a final volume of 200μL T cell culturing media. Plates were briefly centrifuged and cultured in an Incucyte S3 inside a 37°C incubator with 5% CO2. Every 2 days, 100μL of media from preceding culture was collected and added to new plate containing 2×10⁴ NALM6 cells in 100μL fresh media until T cells failed to control fresh NALM6 cells.
For TIL anti-melanoma cytotoxic assays, 5×10³ SK-MEL-956A cells were plated onto a fibronectin-coated plate. 24hr later, 2×10⁴ TILs were added on the plate for a final volume of 200μL. 100 μL of co-culture was added new 96-well plate containing 5×10³ SK-MEL-956A cells. Wells were imaged on an Incucyte S3 every 2hr.
Tumour was quantified by red-fluorescent surface area measured by Incucyte S3 software (Essen BioScience) and normalized to the red-fluorescent surface area after each tumour cell addition.
For standard luciferase-based cytotoxicity assay, TILs transduced with 80BB or LNGFR were culture with autologous, firefly luciferase-GFP transduced SK-MEL-956A cells. Cells were co-cultured in triplicates at the indicated effector : target ratios in a final volume of 100μL with 2 × 10⁴ target cells. 18hr later, 100μl luciferase substrate (Bright-Glo; Promega) was added to each well. Emitted light was detected in a luminescence plate reader (Agilent BioTek S1L) and lysis was calculated using the formula 100 × (1 −(RLUsample)/(RLUtarget alone).
Cytokine Analyses
1×10⁵ 19-HIT+ T cells were co-cultured with 2×10⁵ NALM6, NALM6CD28Δ or NALM6CTLA4Δ target cells (effector: target 1:2) or 5×10³ 19-HIT+ T cells were co-cultured with 5 × 10⁵ NALM6 target cells (effector 1:100), as indicated for each experiment in 200μL culturing media in the presence of IL-2 receptor blocking antibody (B-B10, ThermoFisher). After 24hr of co-culture, 40μL aliquots of supernatant were collected. Cytokines were measured using a BD Cytometric Bead Array (CBA), as per the manufacturer protocol. Samples were measured on a BD LSR Fortessa and analyzed using BD FCAP software (BD).
Flow Cytometry
19-HIT expression was measured with Alexa-Fluor-647-conjugated goat anti-mouse (ab’)2 antibody (Jackson ImmunoResearch). TCR was detected using NY-ESO-1 tetramers (MBL International). T cell phenotypes were evaluated using BUV395 mouse anti-human CD4 (BD), BUV805 mouse anti-human CD8 (BD), PE mouse anti-human CD80 (Biolegend), BB515 mouse anti-human CD28 (BD), BV480 mouse anti-human PD-1 (BD), PerCp-eFluor710 mouse anti-human LAG3 (eBioscience), BV785 mouse anti-human Tim3 (Biolegend), BV421 mouse anti-human CTLA4 (Biolegend), APC-Cy7 mouse anti-human CD45 (Biolegend) or PE mouse anti-human CD45 (Biolegend), PE/Dazzle-594 mouse anti-human LNGFR (Biolegend), and BV711 mouse anti-human CD69 (Biolegend). Countbright beads (Invitrogen) were used to determine the absolute number of cells according to the manufacturer’s protocol. 7-AAD or DAPI was used to exclude dead cells (Biolegend). FcR Blocking Reagent mouse (Miltenyi Biotec) was used to block Fc receptors. Antibody clones and dilutions used can be found in the Reporting Summary. Representative gating strategy available as Supplementary Figure 1.
NALM6 expression of CD28, CTLA4, CD80, were evaluated using antibodies listed above, and PE- mouse anti-human CD86 (Biolegend), PE- mouse anti-human 4–1BBL (Biolegend), PerCP-Cy5.5 mouse anti-human PD-L1 (Biolegend). HLA-A2 was stained using PE mouse anti-human HLA-A2 (Biolegend). For protein binding assays, 1 × 10⁵ T cells were co-cultured with serially diluted human CD28-Fc protein (BPS Bioscience) or human CTLA4-Fc protein (BPS Bioscience) for 30 minutes at room temperature, washed with flow buffer (2% FBS in PBS) then stained with mouse anti-human IgG Fc (Biolegend) for 10 minutes at room temperature. Cells were washed twice. Flow cytometric data were acquired on a 5-laser Aurora (Cytek Biosciences) and analyzed in FlowJo v10.8.1 (Treestar). Experiments were done under the same gain settings and the machine was calibrated using QC beads daily. Cell sorting was performed on a BD FACSAria cell sorter (operated using BD FACSDiva software).
Trans-Stimulation Assay
1×10⁵ 19-HIT+ CellTrace Violet labelled cells were plated onto wells with 1 × 10⁵ 19-HIT+ CellTrace Far-Red labelled cells, 1×10⁵ 19-HIT+80BB CellTrace Violet cells, or onto wells pre-incubated overnight with CD28 SuperAgonist antibody (EMD Millipore) at a concentration of 50ug/mL. CD69 expression was measured by flow cytometry and cytokines were measured by BD CBA assays.
T cell Metabolic Assays
1×10⁶ engineered 19-HIT+ T cells were co-cultured with 2×10⁶ NALM6 cells in 2mL of culturing media and no exogenous cytokine. Every 72hr, cells were replated at 1×10⁶ 19-HIT+ T cells per 2×10⁶ CD19+ NALM6. After 3 total stimulations, cells were counted, and resuspended in XF RPMI (Agilent) supplemented with 10mM glucose (Agilent), 2mM glutamine (Agilent), 1 mM sodium pyruvate (Agilent) at 1×10⁵ cells / 40 μL. Cells were plated onto a poly-L-Lysine coated plate (Fisherbrand), spun down and media was added to a final volume of 180μL. Cells were analyzed as per the manufacturer’s protocol using the Mito Stress Assay kit (Agilent) and the Glycolytic Rate Assay kit (Agilent). Assays were run on the Seahorse XFe96 Analyzer (Agilent).
Mouse tumour models
For all models, male and female 8–12-week-old NOD/SCID/IL-2Rγ-null (NSG) mice (Jackson Laboratory) were used. Animal facility is maintained at a temperatures of 21–23°C, 40–60% humidity and 12hr light/12hr dark cycle. For B-ALL models, mice injected via tail vein with 5×10⁵ firefly luciferase-GFP transduced NALM6 (or NALM62000 or NALM6200) cells per mouse. For subcutaneous melanoma models, were subcutaneously implanted with 5×10⁵ firefly luciferase-GFP transduced SK-MEL-37 cells mixed with Matrigel (Corning). Engineered T cells were injected at the indicated doses. For patient-matched TIL experiments, mice were injected via tail vein with donor matched 5×10⁵ firefly luciferase-GFP transduced SK-MEL-956A. One week later, TILs transduced with 80BB or LNGFR were injected at the indicated doses.
Tumour engraftment was confirmed using bioluminescence imaging measured on the Xenogen IVIS Imaging System (Xenogen). Living Image software (Xenogen) was used to analyze acquired bioluminescence data. Mice were monitored and sacrificed upon evidence of hind-limb paralysis, tumour volume exceed 1cm3, over 10% of the animal body weight, or other clinical signs of distress. Injections of tumour cells and T cells and imaging was performed by double-blinded investigators.
For ex vivo T cell characterization 4–5 mice per group were sacrificed at the indicated timepoints (day 7, 9, 14, 17 or 26) post T cell injection, and cell were extracted from the femur, tibia, and fibula or from subcutaneous tumour site. Solid tumours were dissociated using Human Tumour Dissociation Kit (Miltenyi) at 37°C. After PBS wash, RBC lysis was performed using ACK buffer (Lonza) and washed again. Mouse cell depletion was performed as per the manufacturer’s protocol (Miltenyi Biotec). Cells were then stained for flow cytometry as described above.
For single-cell RNA sequencing analysis, 5 Mice per group were injected with NALM6 tumour as described above and treated with 1×10⁵ or 5×10⁴ 19-HIT+ T cells per mouse on day 4 post tumour injection. On day 9 post T cell injection, bone marrow cells were isolated as described above. Cells from mice within one condition were pooled and labelled with PE mouse anti-human CD45 (Biolegend) and TotalSeq™-B0251 anti-human Hashtag 1 Antibody (Biolegend) for 19-HIT treated mice or TotalSeq™-B0254 anti-human Hashtag 4 Antibody (Biolegend) for 19-HIT80BB treated mice. Cells were FACS sorted for CD45+ GFP- cells (human T cells, excluding NALM6). Cells from different conditions were pooled together at a balanced ratio and submitted for 10X 3’ RNA sequencing.
For mouse cytokine release syndrome models, experiments were performed as described in Giavridis et al49. Briefly, 3×10⁶ CD19+ Raji cells were injected intraperitoneally into female C.B.Igh-1b/GbmsTac-PrkdcscidLystbgN7 (SCID-beige) mice (Taconic). 20 days after tumour implantation, 30×106 CAR or HIT+ T cells were injected intraperitoneally. Sera samples were collected 18hr after T cell injection.
Western Blotting
5×10⁶ T cells transduced with 80BB, 80ΔBB or LNGFR (control) were counted and activated with CD3 beads (ThermoFisher) in a 15mL falcon tube in 1mL T cell media. 1hr later, T cells and beads were centrifuged, and re-suspended 250 uL in 1x Laemmeli buffer (Bio-Rad) supplemented with β-mercaptoethanol (Bio-Rad). Samples were heated at 99°C for 10 mins. 20uL of each sample was loaded onto a 7.5% Mini-PROTEAN SDS/PAGE gel (Bio-Rad). Gel was run at 100V in 1x Tris/Glycine/SDS (Bio-Rad). Samples were transferred onto a methanol activated PVDF membrane (Bio-Rad) at 100V in 1x Tris/Glycine Buffer/Methonol (Bio-Rad). Blots were cut based on anticipated band sizes for proteins of interest using ladder as reference. Blots blocked using 5% BSA (Jackson ImmunoResearch) in 1x TBST buffer (Bioworld) for 1hr, and then stained with primary anti-phospho protein antibody (p-PLCy: 2821S; p-AKT: 4060S; p-p65: 3033L; p-ERK: 4370S; all from Cell Signaling) over night. Blots were washed 4x with TBST and labelled with HRP anti-rabbit IgG (Cell Signaling) for 1hr. Blots were further washed with TBST. Blot luminescence was measured using Bio-Rad ChemiDoc after developing with Immobilon Western Chemiluminescent HRP Substrate (Millipore). Blots were rinsed in TBST, and then subsequently labelled with the corresponding total protein primary antibody (PLCy: 5690S, AKT: 9272S, p65: 8242S, ERK: 4695S, all Cell Signaling) over night. Cells were rinsed stained with a HRP anti-rabbit antibody and imaged as described above. Chemiluminescent and colourimetric blot images were merged using Fiji Software.
Single-cell transcriptome sequencing and analysis
Cells were stained with Trypan blue and Countess II Automated Cell Counter (ThermoFisher) was used to assess both cell number and viability. Following QC, the single cell suspension was loaded onto Chromium Next GEM Chip G (10X Genomics PN 1000120) and GEM generation, cDNA synthesis, cDNA amplification, and library preparation of 15–21,000 cells proceeded using the Next GEM Single Cell 3’ Kit v3.1 (10X Genomics PN 1000268) according to the manufacturer’s protocol. cDNA amplification included 11 cycles and 10 μL of the material was used to prepare sequencing libraries with 8–10 cycles of PCR. Indexed libraries were pooled equimolar and sequenced on a NovaSeq 6000 in a PE28/88 run using the NovaSeq 6000 S2 or S4 Reagent Kit (100 or 200 cycles) (Illumina). An average of 21 thousand paired reads was generated per cell.
Amplification products generated using the methods described above included both cDNA and feature barcodes tagged with cell barcodes and unique molecular identifiers. Smaller feature barcode fragments were separated from longer amplified cDNA using a 0.6X cleanup with aMPure XP beads (Beckman Coulter). Feature barcode libraries were constructed using the 3’ Feature Barcode Kit (10X Genomics PN 1000276) according to the manufacturer’s protocol with 10 cycles of PCR. Indexed libraries were pooled equimolar and sequenced on a NovaSeq 6000 in a PE28/88 paired end run using the NovaSeq 6000 S4 Reagent Kit (200 cycles) (Illumina). An average of 56 million paired reads was generated per sample.
Raw fastq data was processed by Cell Ranger (v6.1.1) multi command with reference assembly GRCh38, to demultiplex cells to original hashtags and to obtain gene counts. The two doses were aggregated with Cell Ranger aggr command. The count matrix was imported into R (v4.0.2) and analyzed with Seurat R package (v4.0.4). Cells were filtered by (1) over 200 unique genes and below 5000 unique genes expressed; (2) below 20000 total genes molecules; (3) below 12% UMIs derived from the mitochondrial genome; (4) doublets detected by DoubletFinder(v2.0). Principal component analysis (PCA) was performed using a set of 1000 top variable genes and then dimensionality reduction was performed using UMAP algorithm with top 18 PCAs. Seurat assigned cluster identities were used to exclude cells clustering separately, not expressing canonical T cell markers, and positive for canonical B-ALL markers.
Statistics & Reproducibility
All experimental data are presented as mean ± s.e.m. No statistical methods were used to predetermine sample size, but our sample sizes are similar to those reported in previous publications10, 11, 14, 33, 34. Appropriate statistical tests were used to analyze data, as described in the Figure legends. Data distribution was assumed to be normal, but this was not formally tested. Statistical analysis was performed on GraphPad Prism v.9 software and R v.4. The experiments were not randomized, and the investigators were not blinded to allocation during experiments and outcome assessment. Investigators were blinded when assessing animal health during in vivo experiments. 1 mouse in the TILs80BB group of the experiment described in Fig. 4c was excluded due to poor injection and tumour growing in the tail instead of being disseminated. Further information on research design is available in the Nature Research Reporting Summary linked to this article.
Extended Data
Extended Data Fig. 1. Cell engineering diagram and extended characterization of 19-HIT80BB cells.
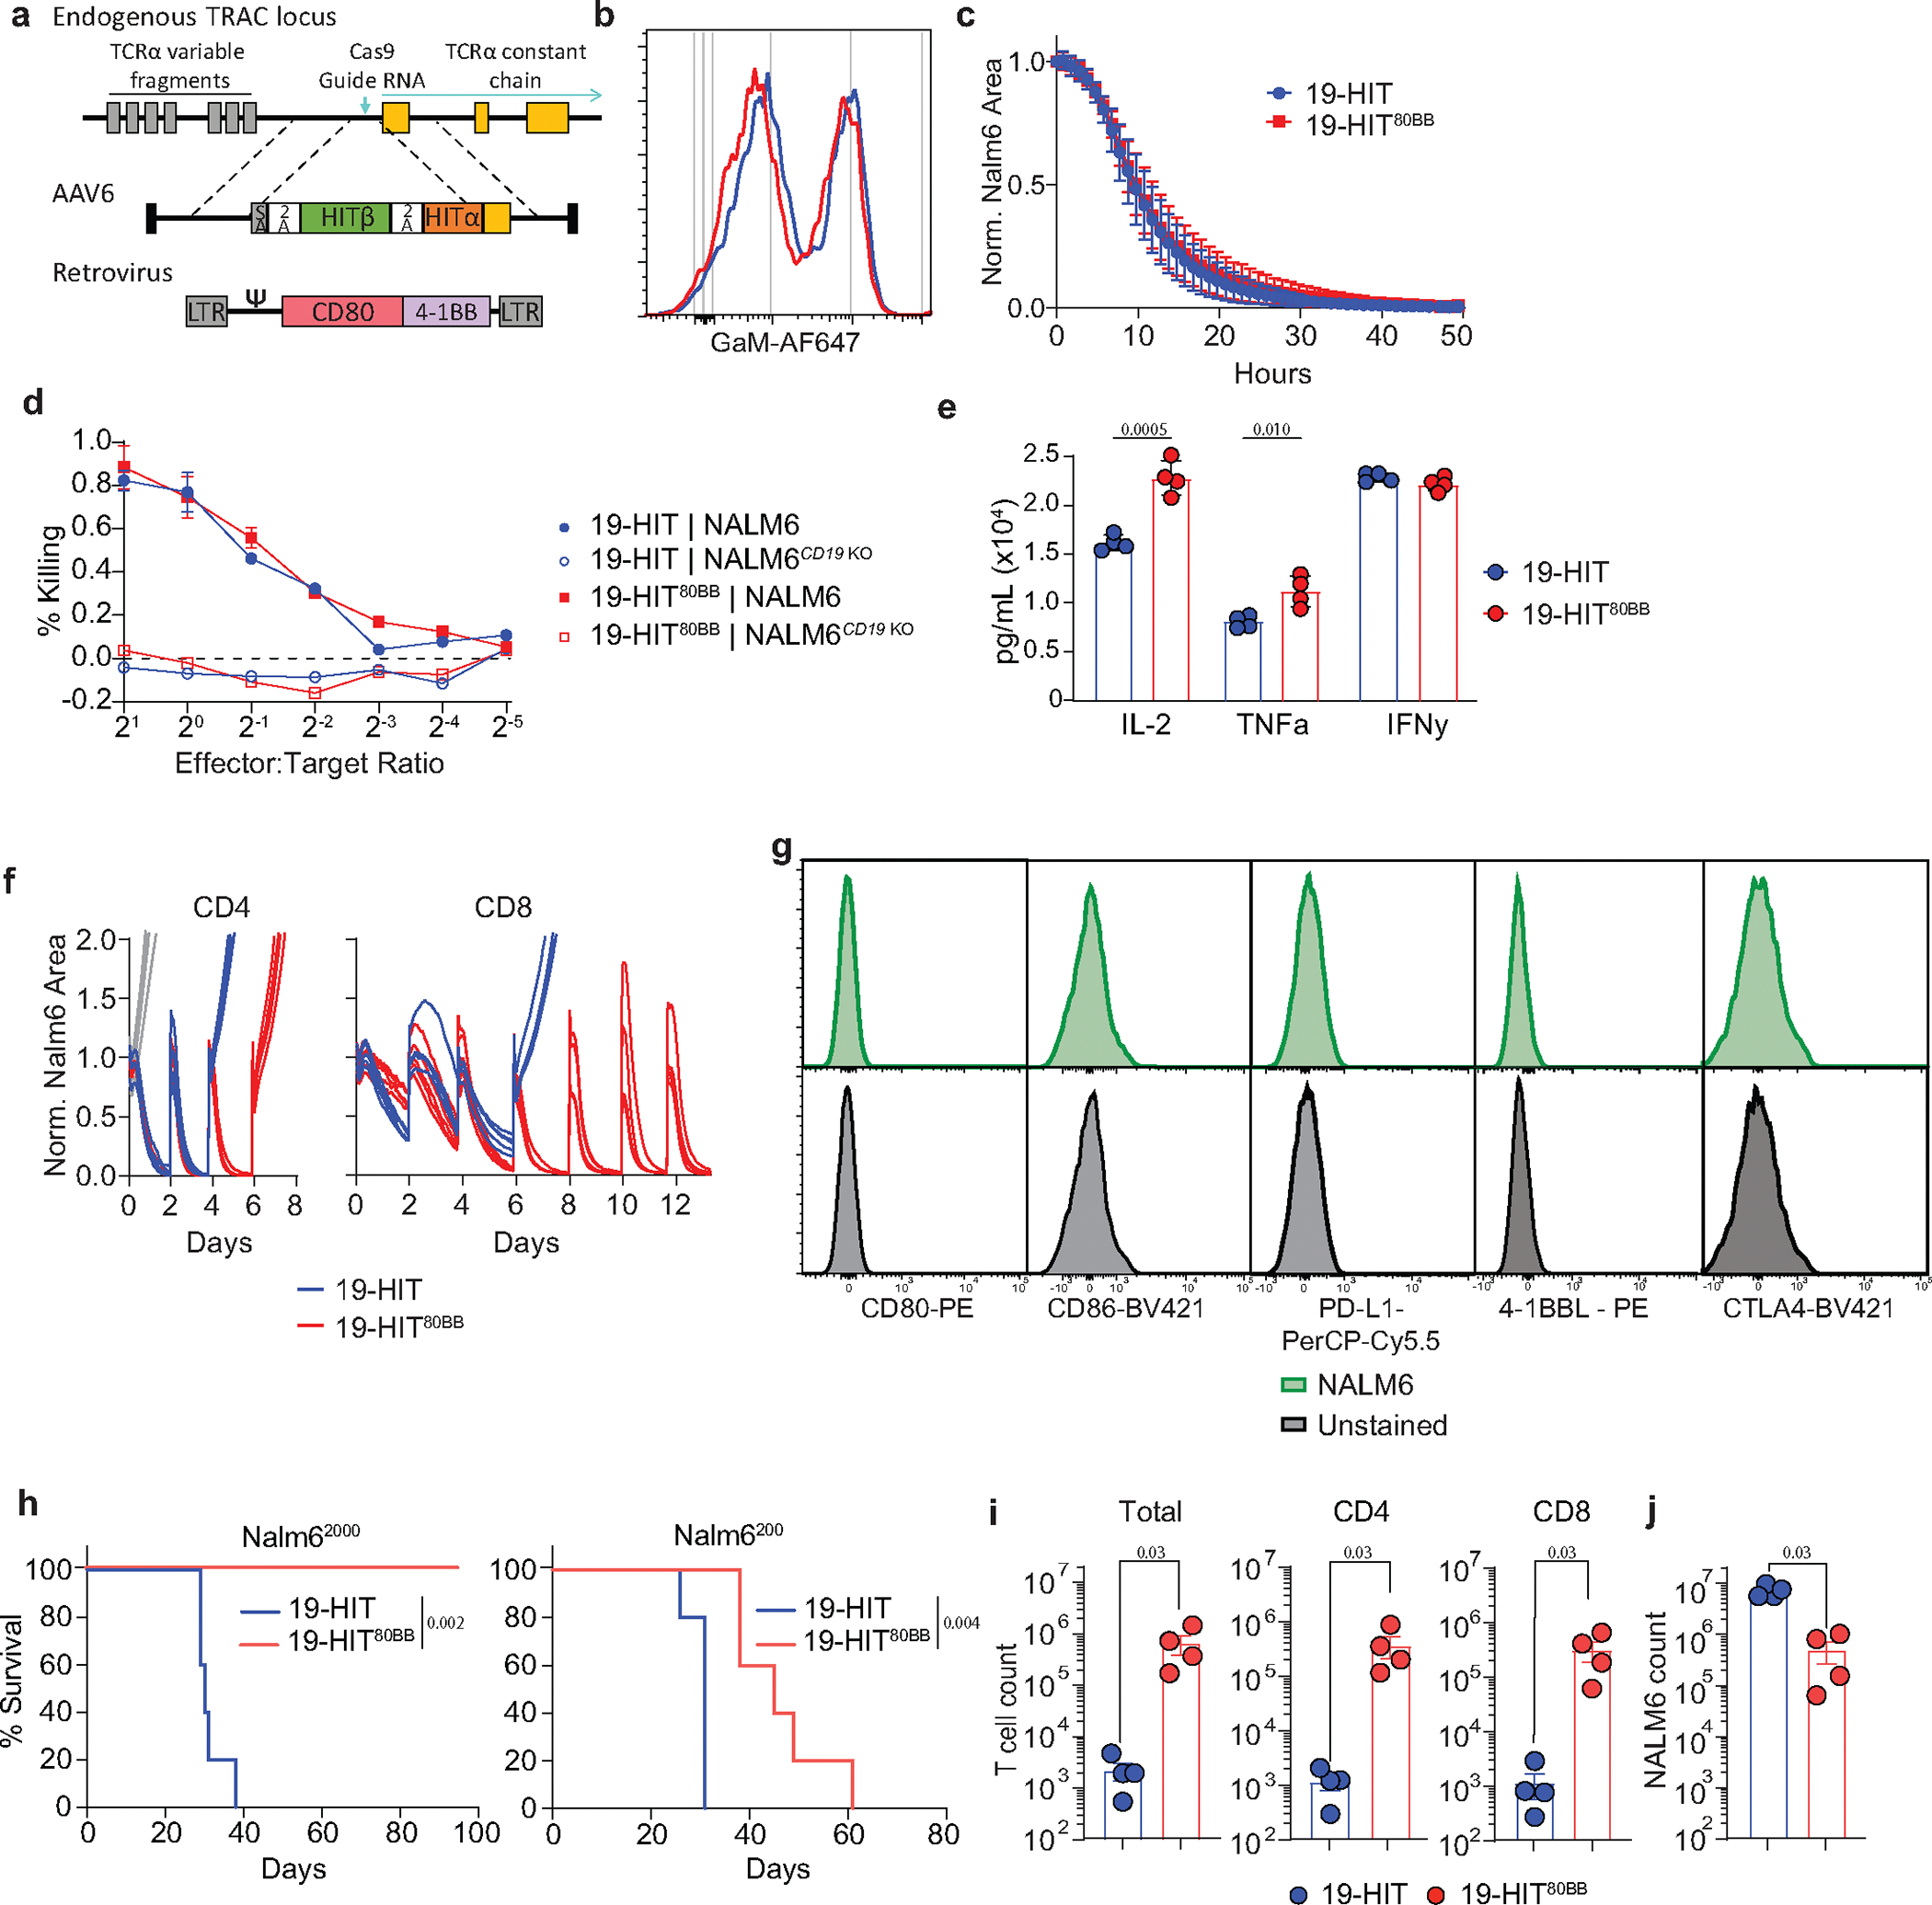
a, Diagram illustrating genetic T cell engineering strategy of HIT and HIT80BB cells. The alpha and beta chains of HIT directed against CD19 were targeted into the TRAC locus as previously described37. 80BB construct was delivered using a γ-retroviral vector. b,Flow cytometry profile of HIT expression on 19-HIT (blue) and 19-HIT80BB (red) measured using a goat anti-mouse antibody (GaM). c, 48hr serial in vitro cytotoxicity assay using NALM6 targets. Cells were plated at an effector: target ratio of 1:2. n=7 independent co-cultures of cells from a healthy donor. d,18hr cytotoxicity assay with NALM6 and NALM6CD19 KO. n=3 independent co-cultures of cells from a healthy donor, representative of 4 donors. e,Human IL-2, TNFα and IFNɣ supernatant concentration 24hr post co-culture with NALM6 target cells at E:T ratio of 1:2. n=4 independent co-cultures of cells from a healthy donor, representative of 3 donors. f, Serial in vitro cytotoxicity assay with fresh NALM6 cells added every 2 days, starting with sorted CD4 (left) and CD8 T cells (right) at a ratio of 1 effector : 2 targets. Each line is an independent co-culture of cells from a healthy donor. g, Flow cytometry profiles of CD80, CD86 and PD-L1, 4–1BBL and CTLA4 on NALM6 cells. h, Kaplan–Meier survival analysis of NALM62000 (2000 CD19 mol/cell, left) or NALM6200 (200 CD19 mol/cell, right) -bearing mice treated with 1×10⁵ (left) or 4×10⁵ (right); respectively, 19-HIT+ T cells. n=5 mice/group. i, j, Absolute count of total (i, left), CD4 (i, middle), CD8 (i, right) T cells and absolute count of NALM6 cells (j) were isolated from bone marrow of NALM6 bearing mice seventeen days post 1×10⁵ HIT or HIT80BB cell treatment. n=4 mice/group treated with 1×10⁵ HIT+ T cells/mouse. P values were determined by two-tailed t-test (d, e), Mann-Whittney test (i, j), or log-rank Mantel-Cox test (h). Data are mean ± sem
Extended Data Fig. 2. UMAP projections and Suerat clustering of 19-HIT and 19-HIT80BB cells.

a, UMAP projection of 2591 cells isolated from bone marrow of NALM6 bearing mice nine days post HIT or HIT80BB treatment. Cells are coloured based on Suerat assigned cluster identities. Clusters 0, 1, 2, 3 and 5 are composed of HIT80BB cells. Cluster 4 is predominantly composed of HIT cells. b, Feature and violin plots of CD8A (left), CD4 (right) transcripts. c, Dot plot of top 10 differentially enriched genes in each cluster. Colour of dot indicates expression level, and size of dot indicated percentage of cells expressing marker. d, Feature and violin plots of MKI67 (left), IL7R (right). For violin plots, cells are plotted segregated by cluster and by treatment type.
Extended Data Fig. 3. Feature plots of selected inhibitory, exhaustion and cytotoxicity genes.
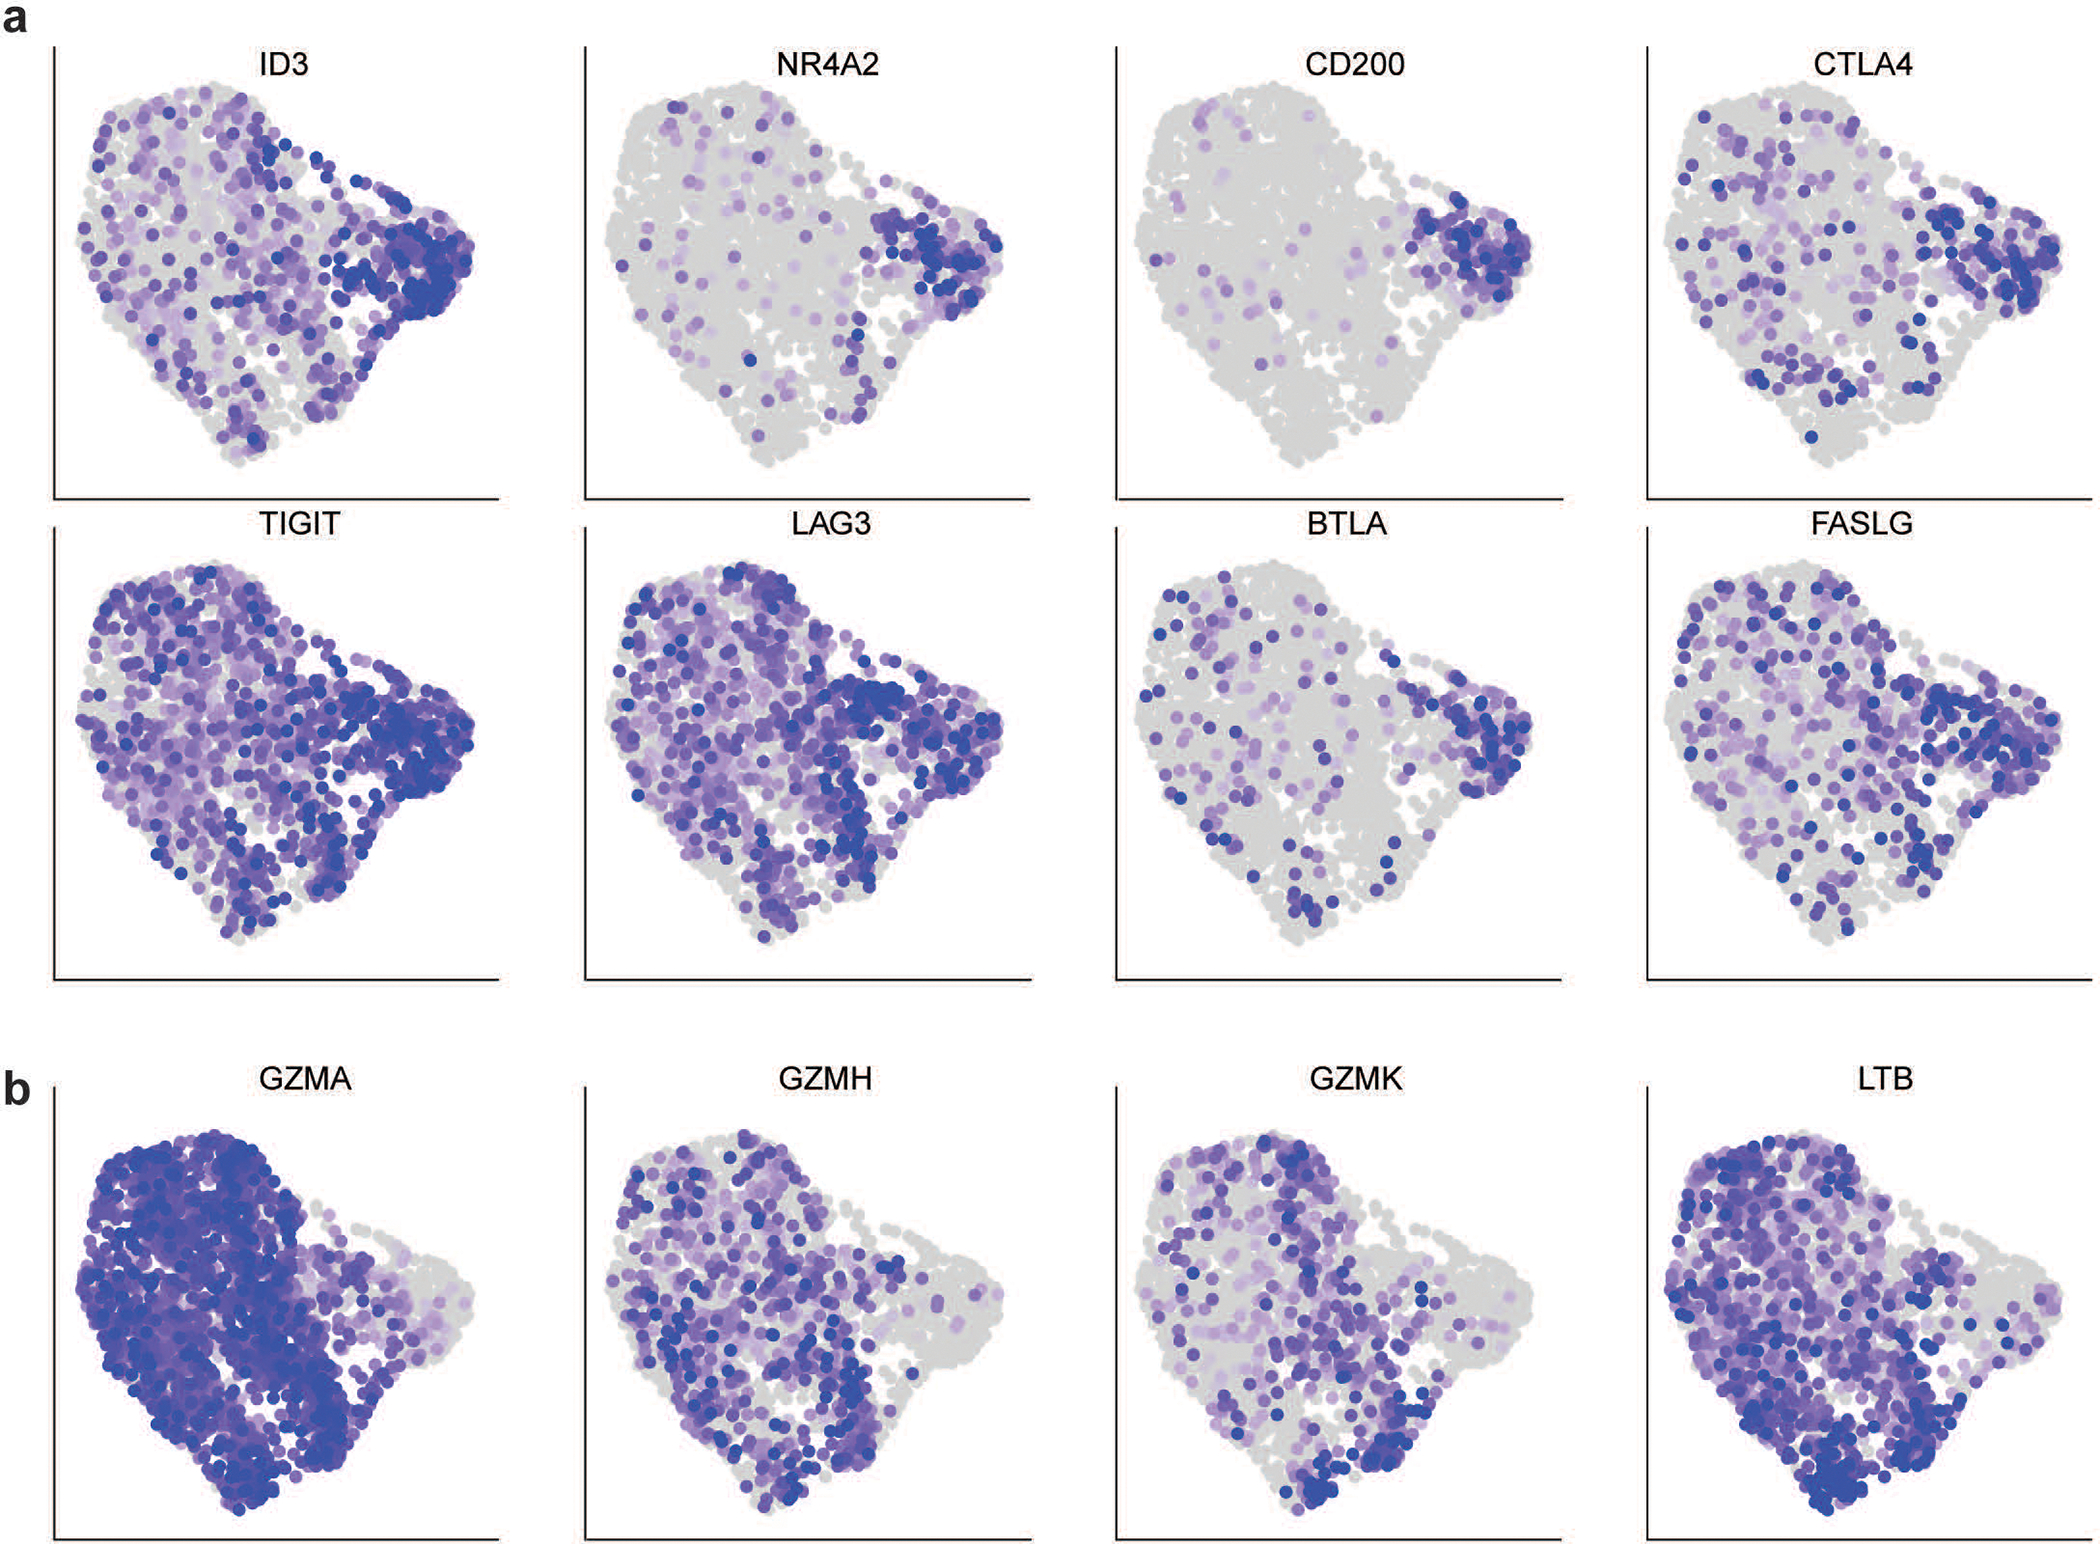
a, b Feature plots of inhibitory and exhaustion (a) and cytotoxicity (b) genes corresponding to violin plots in Fig. 1f.
Extended Data Fig. 4. Extended characterization of 80BB dependence on 4–1BB and CD28 signaling.
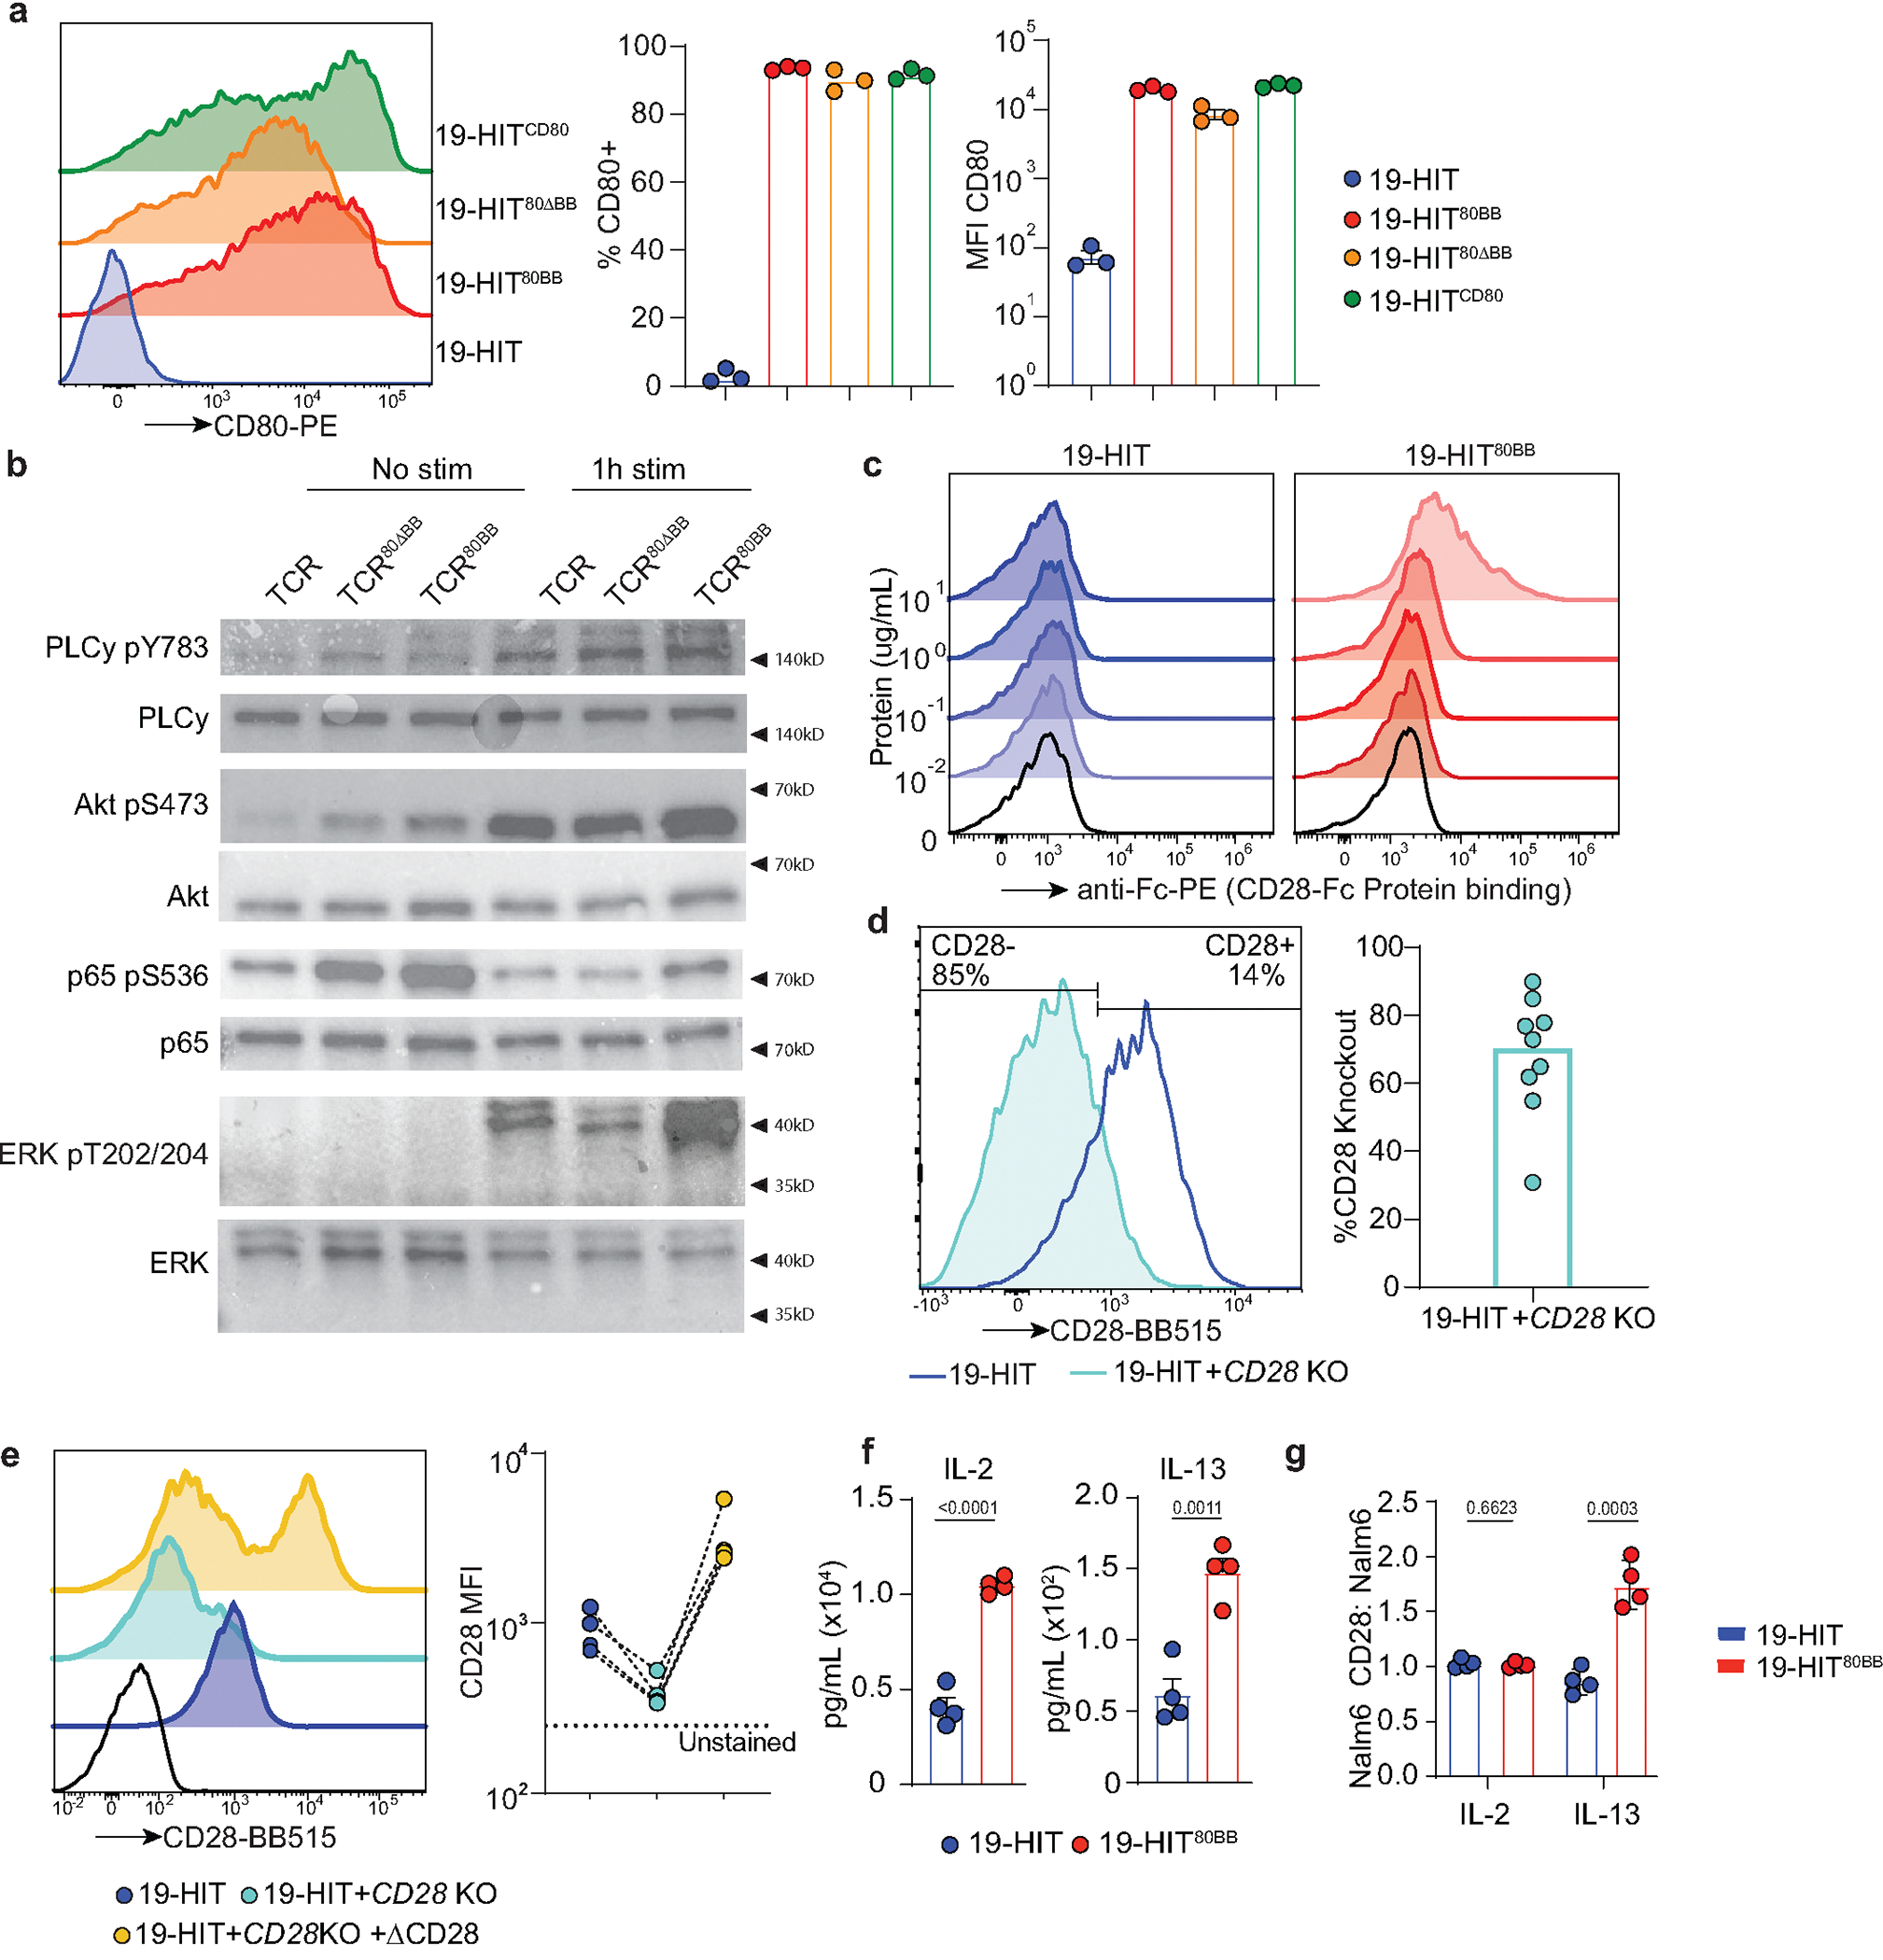
a, Left, representative flow cytometry profiles of HIT, HIT80BB, HIT80ΔBB and HITCD80 stained for CD80. Representative of 4 independent healthy donors. Right, summary of CD80 MFI and percentage from 3 independent donors analyzed at same flow cytometry settings. b, T cells were engineered with LNGFR (control), 80BB or 80ΔBB and unstimulated or stimulated with anti-CD3 beads for 1hr at a 4:1 bead to T cell ratio. Phospho PLCyY783, total PLCy, phospho-AKTS473, total ATK, phospho-p65S536, total p65, phospho-ERKT202/Y204 and total ERK were measured by western blot. Western blots representative of two technical replicates. c, Flow cytometry plots of CD28-Fc binding assay. T cells were incubated with increasing concentrations of CD28-Fc, and then stained with PE-anti-Fc. d, Left, representative flow cytometry plot of HIT and HIT CD28KO cells 5 days post CRISPR Cas9 editing. Right, summary of decrease of CD28 surface expression indicating CD28 KO in 9 donors. e, Left, flow cytometry plot of unstained cells, HIT TRBC KO, HIT CD28 KO cells, and HIT CD28 KO+ΔCD28 OE cells. Right, summary of CD28 MFI after ΔCD28 overexpression in HIT cells. Each dot is an independent healthy donor. f, Human IL-2 and IL-13 supernatant concentration 24hrs post co-culture of NALM6 target cells with 19-HIT and 19-HIT80BB cells at an effector: target ratio of 1:100. g, Ratio of human IL-2 and IL-13 secreted by 19-HIT and 19-HIT80BB cells after 24hr co-culture with Nalm6CD28 relative to NALM6wt. f, g, n=4 independent co-cultures of cells from a healthy donor, representative of 3 donors. P values were determined by two-tailed t-test (f, g). Data are mean ± sem
Extended Data Fig. 5. Extended characterization of 80BB and CTLA4 interactions.
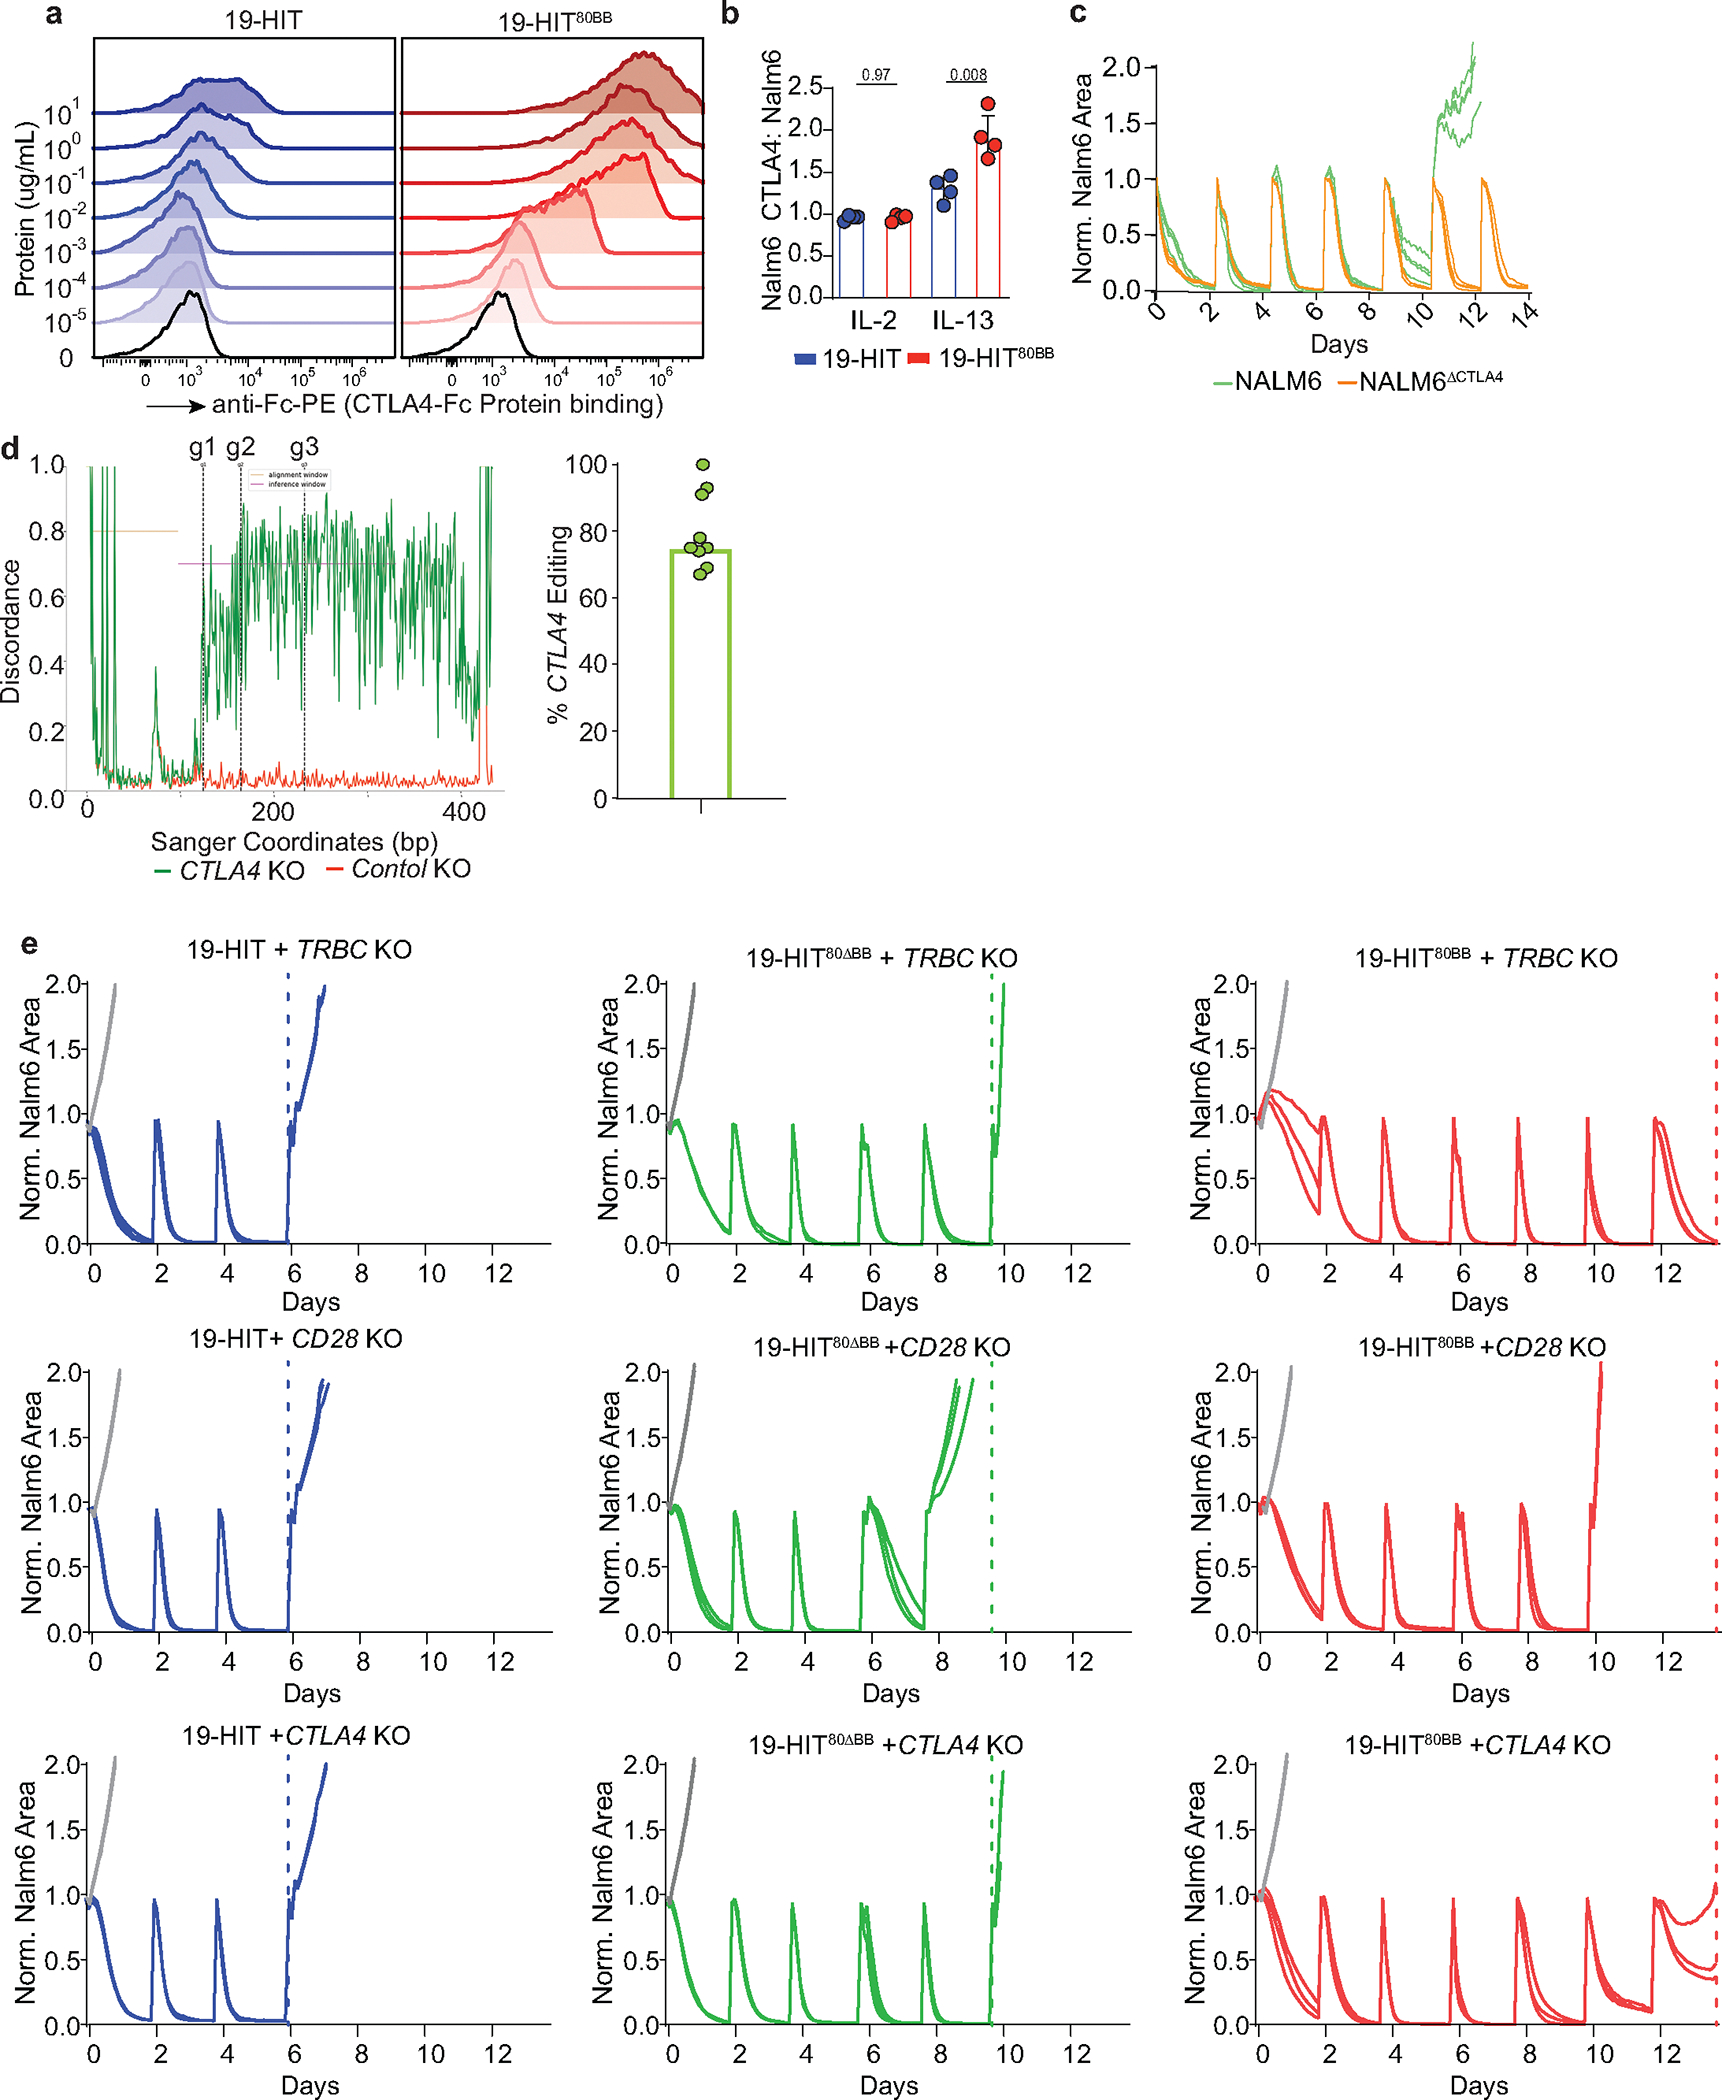
a, Flow cytometry plots of CTLA4-Fc binding assay. Cells were incubated with increasing concentrations of CTLA4-Fc, and then stained with PE-anti-Fc. b, Ratio of human IL-2 and IL-13 secreted by 19-HIT and 19-HIT80BB cells after 24hr co-culture with Nalm6CD28 relative to Nalm6. n=4 independent co-cultures of cells from a healthy donor, representative of 3 donors. c, Serial in vitro cytotoxicity assay using NALM6 or NALM6ΔCTLA4. Fresh target cells were added every 2 days. Each line is an independent co-culture of cells from a healthy donor, representative of 3 donors. d, Left, trace from inference of CRISPR Edits (ICE) tool (Synthego) highlighting extent of CTLA4 knockout. Right, summary of extent of CTLA4 editing indicating CTLA4 knockout evaluated by ICE from 9 donors. e, Serial in vitro cytotoxicity assay of HIT, HIT80ΔBB, or HIT80BB with TRBC, CD28 or CTLA4 genes CRISPR edited. Fresh NALM6 target cells were added every 2 days. Each line is an independent co-culture of cells from a healthy donor, representative of 3 donors. P values were determined by two-tailed t-test (b). Data are mean ± sem
Extended Data Fig. 6. 80BB does not lead to by-stander cell activation nor increased CRS compared to a clinical-licensed CAR.
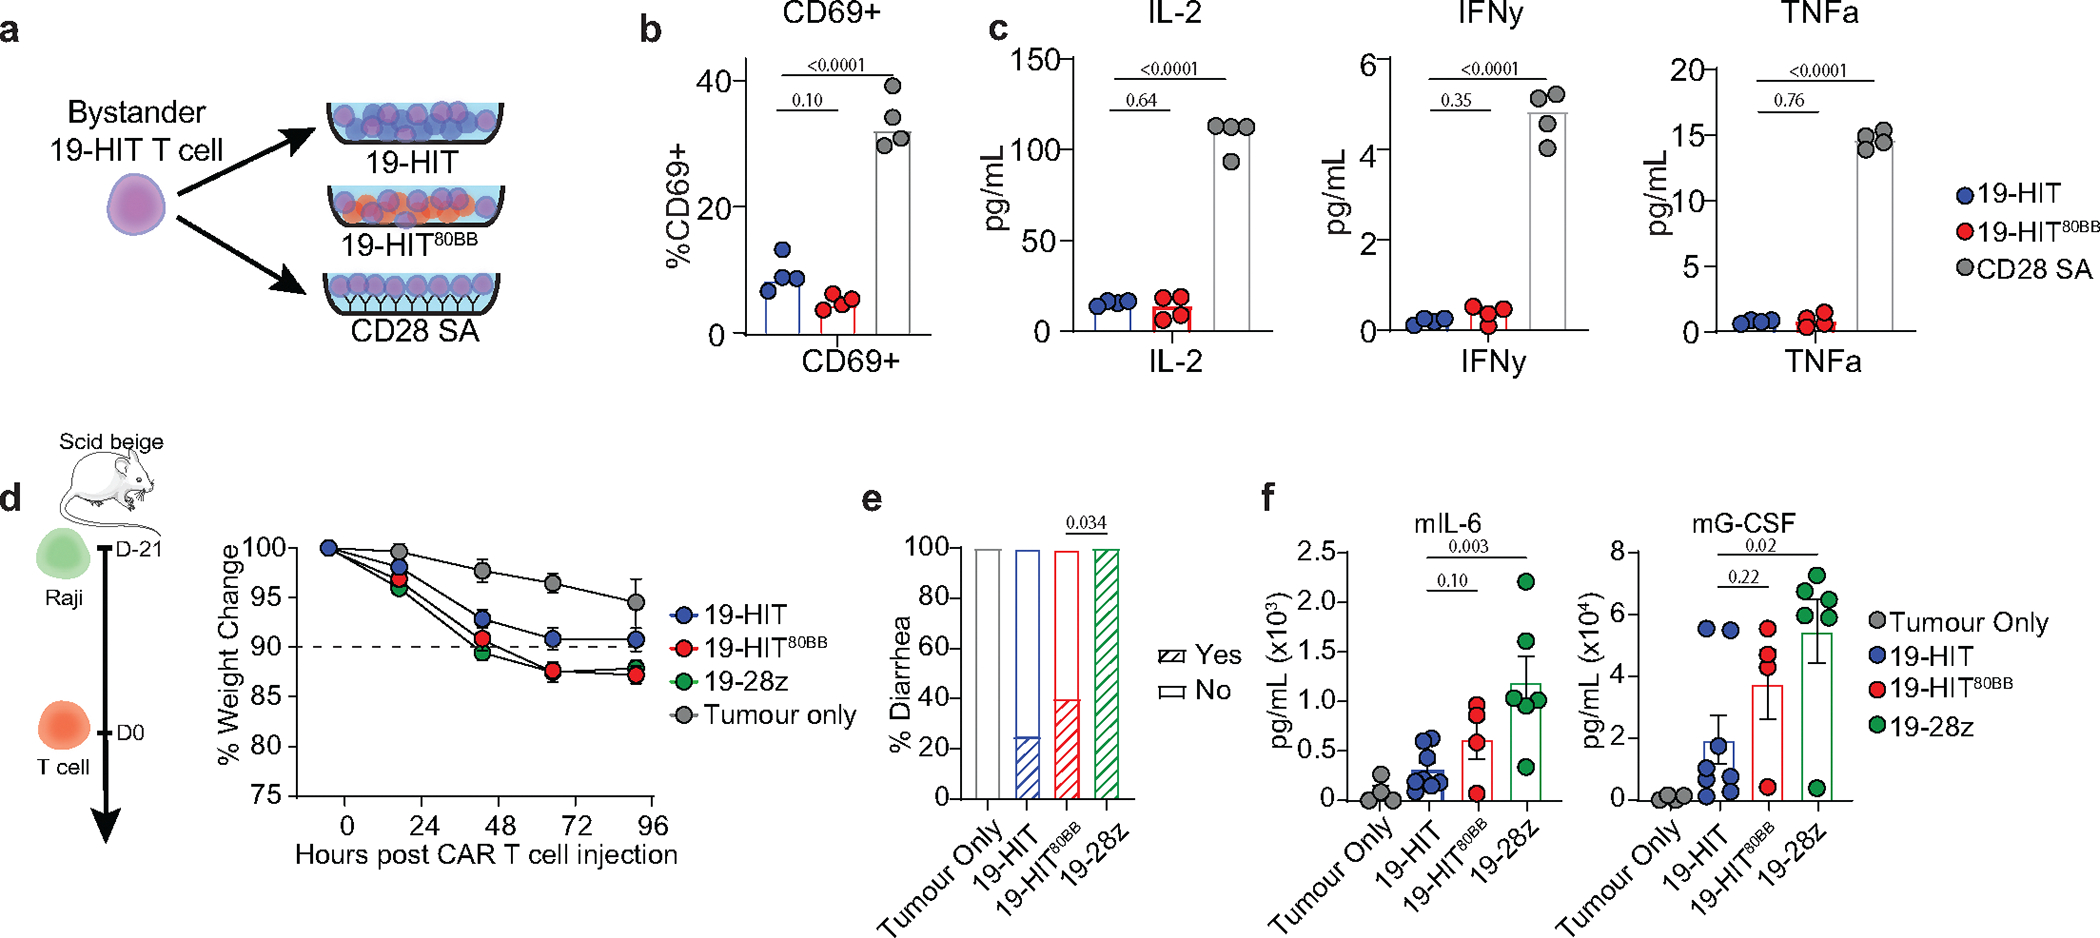
a, Representation of in vitro by-stander activation assay. Labelled HIT T cells were plated onto wells with HIT cells or HIT80BB cells, or wells coated with CD28 superagonist antibody (CD28 SA) in the absence of target cells. b, c, Quantification of cell-surface CD69 on bystander HIT cells (b) and levels of IL-2, IFNɣ and TNFα in the supernatant (c) 24hrs after exposure to wells containing HIT, HIT80BB or coated with CD28SA. n=4 independent co-cultures of cells from a donor, representative of 2 donors. d, Left, Diagram depicting in vivo cytokine release syndrome (CRS) model. Right, weight change of tumour-bearing mice after 19-HIT (n=8 mice), 19-HIT80BB (n=4 mice), 1928z CAR (n=6 mice) or no (n=4 mice) T cell transfer. Weight per mouse is normalized to starting weight before T cell infusion. 10% cut-off for CRS is illustrated with a dotted line. e, f, Frequency of diarrhea in days (e) and serum cytokine levels 18hrs (f) after T cell infusion into tumour-bearing Scid Beige mice. P values were determined by two-tailed t-test (b, c, f) and Chi-square test(e). Data are mean ± sem.
Extended Data Fig. 7. Extended characterization of ESO80BB TCR T cells in a subcutaneous melanoma model.
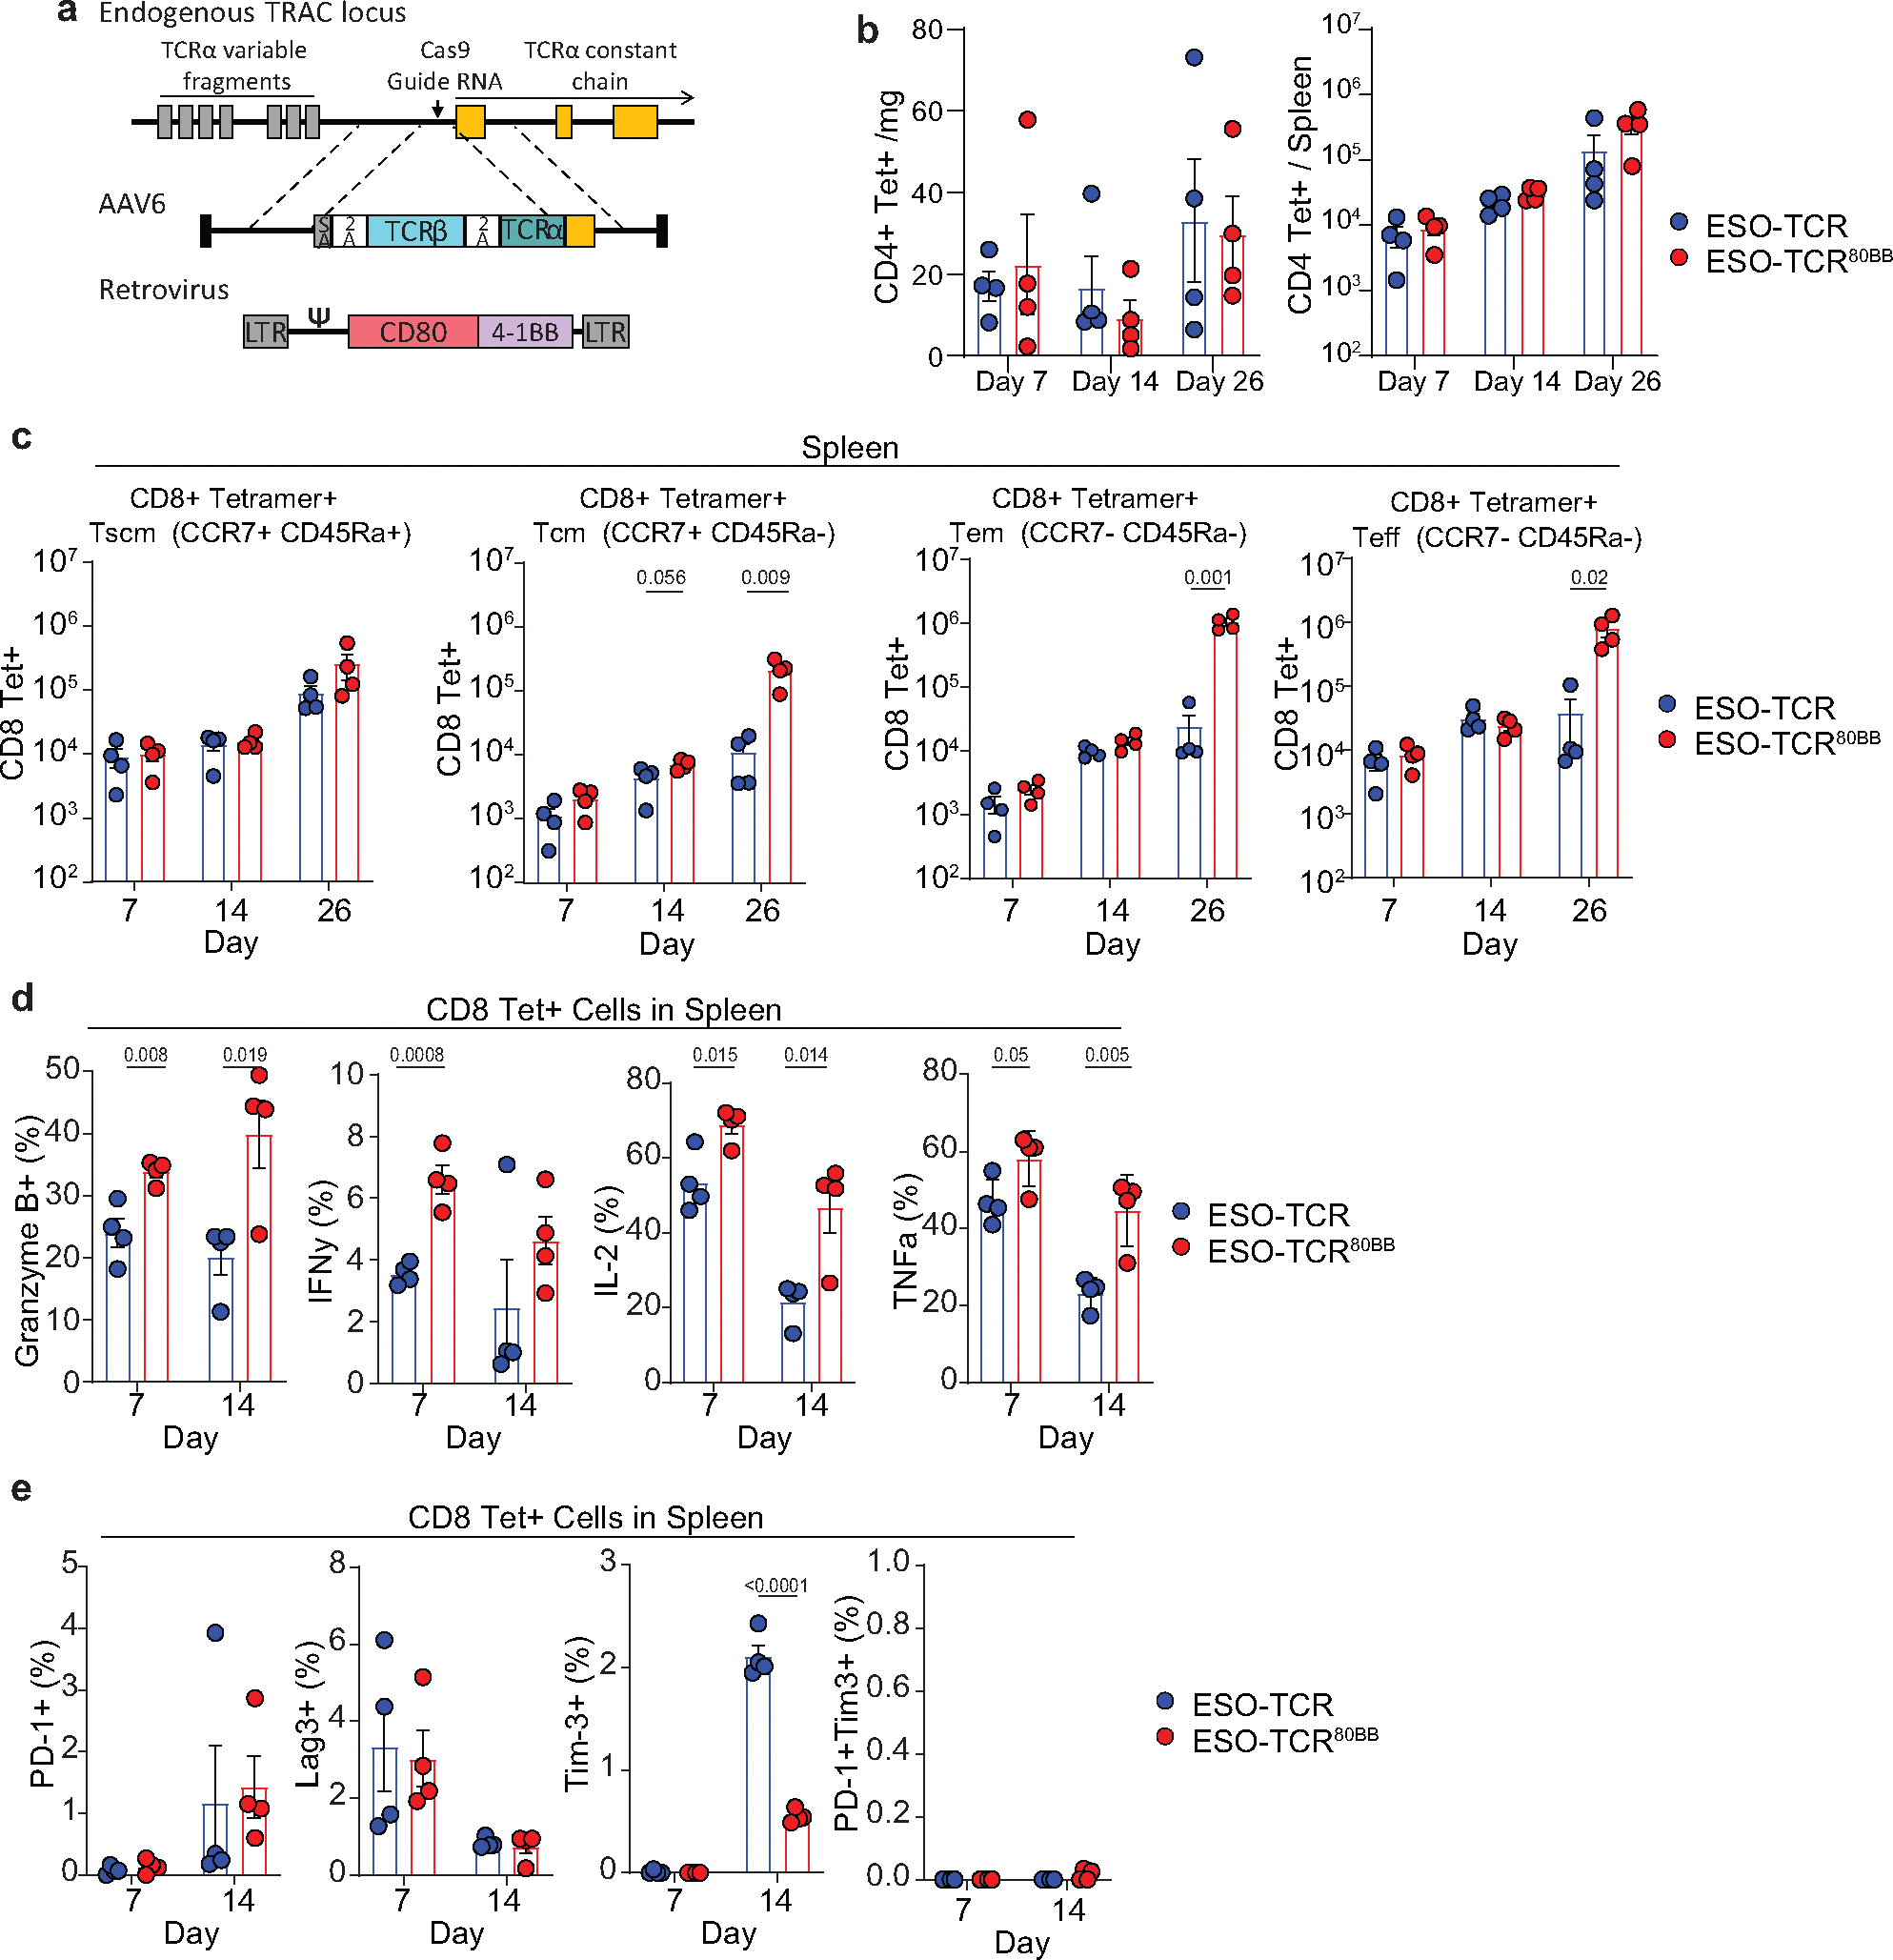
a, Diagram depicting TCR T cell engineering. The alpha and beta chains of an NY-ESO-1 directed TCR were targeted into the TRAC locus as previously described34. 80BB was delivered using the SFG γ-retroviral vector. b, c, d, e, Analyses of T cells isolated from the tumours or spleens of mice implanted with subcutaneous SK-Mel-37 and treated with ESO-TCR or ESO-TCR80BB. n=4 mice per group per time point b, CD4+ Tetramer+ T cell counts isolated from tumours or spleens. c, counts of CD8+Tetramer+ T stem cell memory (Tscm, CCR7+, CD45Ra+), CD8+Tetramer+ T central memory cells (Tcm, CCR7+, CD45Ra-), CD8+Tetramer+ T effector memory cells (Tem, CCR7-, CD45Ra-) CD8+Tetramer+ T effector cells (Teff, CCR7-, CD45Ra+) isolated from spleens. d, Percentage of Tetramer+ CD8+ spleen-isolated T cells expressing Granzyme B, IFNɣ, IL-2 TNF-a after PMA/Ionomycin stimulation. e, Frequency of Tetramer+ CD8+ spleen-isolated T cells expressing PD-1, Lag3, Tim3 or PD-1 and Tim3 double positive cells. P values were determined by two-tailed t-test (c, d, e). Data are mean ± sem.
Extended Data Fig. 8. Flow characterization of post-rapid expansion protocol patient-derived tumour infiltrating lymphocytes.
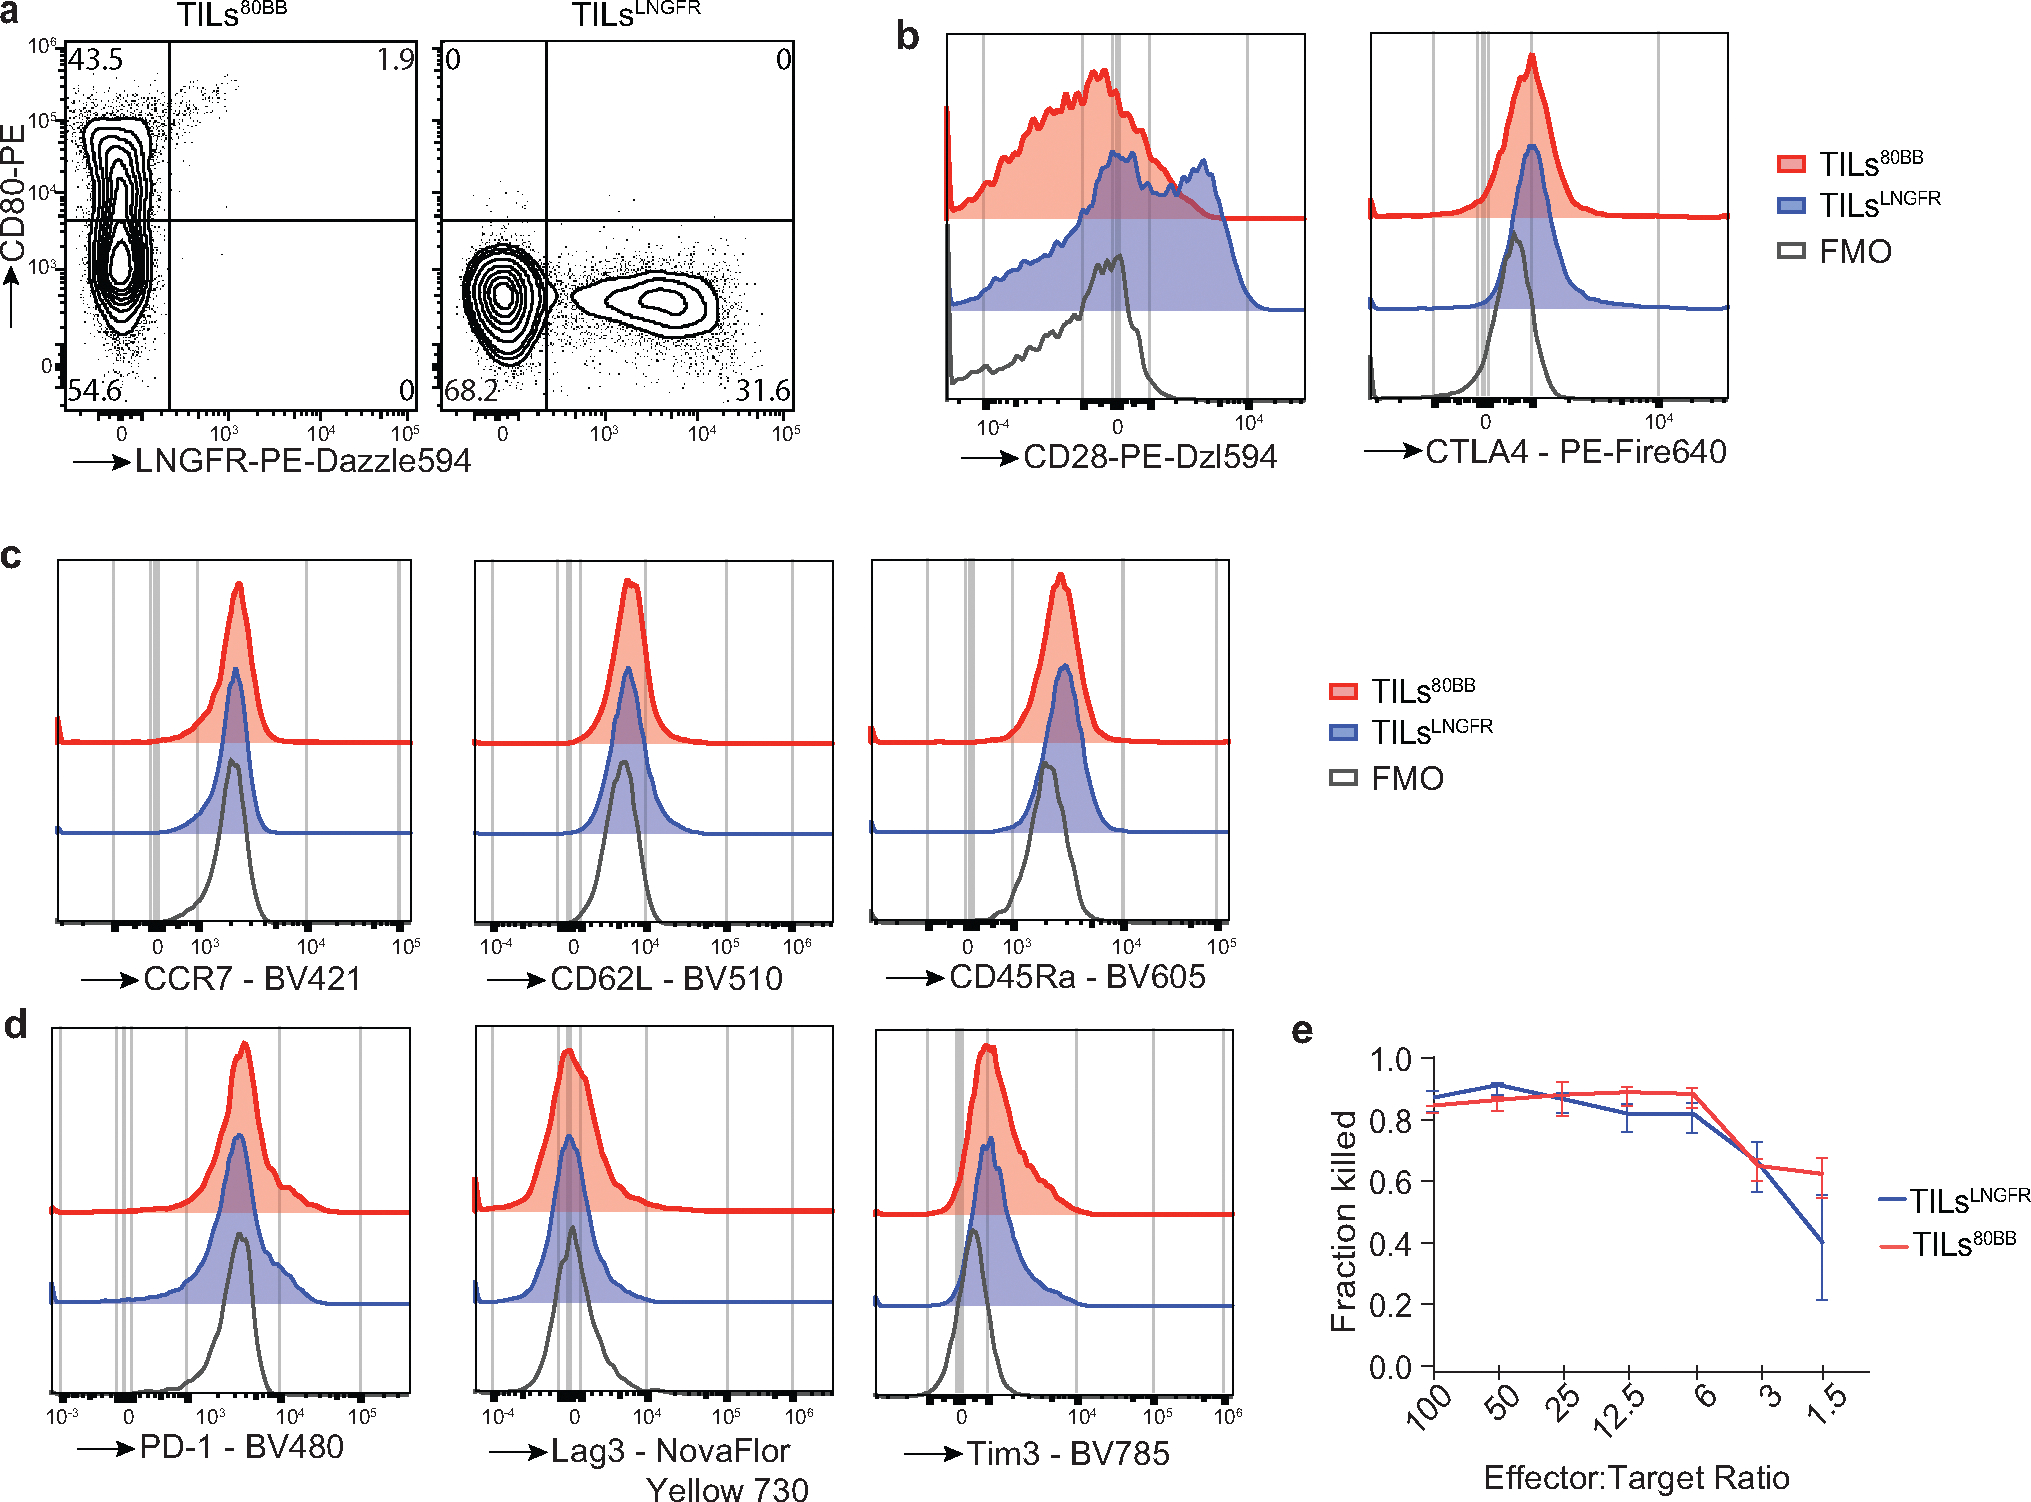
a, Flow profile of transduced TILs transduced for 80BB (left) and LNGFR (right). b, c, d, Flow profile of post-rapid expansion protocol TILsLNGFR (blue) and TILs80BB (red) cells stained for 80BB ligands CD28 and CTLA4 (b), differentiation markers CCR7, CD62L, CD45Ra (c), exhaustion markers PD-1, Lag3, Tim3 (d). e, Fraction of cells killed after 18hrs of co-culture of transduced TILs and autologous tumour cells. n=3 independent co-cultures from cells expanded from 1 patient-derived tumour sample. Data are mean ± sem.
Supplementary Material
Acknowledgements
We thank G. Gunset and M. Lopez for logistical and technical assistance. We thank the Sadelain lab for helpful comments and discussion. We thank Jonathan Khan for helpful discussion on mouse models. We thank the Cell therapy and Cell Engineering Facility, the Antitumor Assessment Facility, the Animal Core Facility, the Flow Cytometry Core Facility and the Integrated Genomics Operation, which are in part supported by NCI Cancer Center Support Grant P30 CA08748, Cycle for Survival, and the Marie-Josée and Henry R. Kravis Center for Molecular Oncology, for their expert assistance.
This work was supported by the Lake Road Foundation, the Lymphoma and Leukemia Society, the Pasteur-Weizmann/Servier award and the Leopold Griffuel award (MS) and the Canadian Institutes of Health Research (DFSA fellowship, A.D.).
The mouse illustration in Figures 1e, 4c, 5f; Ext. Data Fig. 6d was generated using Servier Medical Art, Creative Commons Attribution 3.0 Unported License (https://creativecommons.org/licenses/by/3.0/).
Footnotes
Competing interests
Memorial Sloan Kettering has submitted a patent application based in part on results presented in this manuscript (A.D., M.H. and M.S. are listed among the inventors). M.S. reports research funding from Fate Therapeutics, Takeda Pharmaceuticals, Atara Biotherapeutics and Mnemo Therapeutics. All other authors declare no competing interests.
Code availability
Code used to analyze scRNA in this manuscript is available: at https://github.com/Sadelain-Lab/Dobrin-et-al-NC-2024.git.
Data availability
The single-cell RNA-sequencing data is available from the Gene Expression Omnibus (GEO) under accession code GSE223211. Numerical source data for all figures has been provided. All other data supporting the findings of this study are available from the corresponding author on reasonable request.
References
- 1.June CH & Sadelain M Chimeric Antigen Receptor Therapy. New England Journal of Medicine 379, 64–73 (2018). [DOI] [PMC free article] [PubMed] [Google Scholar]
- 2.Chandran SS & Klebanoff CA T cell receptor-based cancer immunotherapy: Emerging efficacy and pathways of resistance. Immunol Rev 290, 127–147 (2019). [DOI] [PMC free article] [PubMed] [Google Scholar]
- 3.DeRenzo C & Gottschalk S Genetically Modified T-Cell Therapy for Osteosarcoma: Into the Roaring 2020s. Adv Exp Med Biol 1257, 109–131 (2020). [DOI] [PMC free article] [PubMed] [Google Scholar]
- 4.Ecsedi M, McAfee MS & Chapuis AG The Anticancer Potential of T Cell Receptor-Engineered T Cells. Trends Cancer 7, 48–56 (2021). [DOI] [PMC free article] [PubMed] [Google Scholar]
- 5.Foy SP et al. Non-viral precision T cell receptor replacement for personalized cell therapy. Nature (2022). [DOI] [PMC free article] [PubMed] [Google Scholar]
- 6.Sadelain M, Riviere I & Riddell S Therapeutic T cell engineering. Nature 545, 423–431 (2017). [DOI] [PMC free article] [PubMed] [Google Scholar]
- 7.van der Stegen SJ, Hamieh M & Sadelain M The pharmacology of second-generation chimeric antigen receptors. Nat Rev Drug Discov 14, 499–509 (2015). [DOI] [PMC free article] [PubMed] [Google Scholar]
- 8.Hamieh M, Mansilla-Soto J, Rivière I & Sadelain M Programming CAR T Cell Tumor Recognition: Tuned Antigen Sensing and Logic Gating. Cancer Discov 13, 829–843 (2023). [DOI] [PMC free article] [PubMed] [Google Scholar]
- 9.Helsen CW et al. The chimeric TAC receptor co-opts the T cell receptor yielding robust anti-tumor activity without toxicity. Nat Commun 9, 3049 (2018). [DOI] [PMC free article] [PubMed] [Google Scholar]
- 10.Xu Y et al. A novel antibody-TCR (AbTCR) platform combines Fab-based antigen recognition with gamma/delta-TCR signaling to facilitate T-cell cytotoxicity with low cytokine release. Cell Discov 4, 62 (2018). [DOI] [PMC free article] [PubMed] [Google Scholar]
- 11.Baeuerle PA et al. Synthetic TRuC receptors engaging the complete T cell receptor for potent anti-tumor response. Nat Commun 10, 2087 (2019). [DOI] [PMC free article] [PubMed] [Google Scholar]
- 12.Liu Y et al. Chimeric STAR receptors using TCR machinery mediate robust responses against solid tumors. Sci Transl Med 13 (2021). [DOI] [PubMed] [Google Scholar]
- 13.Birtel M et al. A TCR-like CAR Promotes Sensitive Antigen Recognition and Controlled T-cell Expansion Upon mRNA Vaccination. Cancer Research Communications 2, 827–841 (2022). [DOI] [PMC free article] [PubMed] [Google Scholar]
- 14.Mansilla-Soto J et al. HLA-independent T cell receptors for targeting tumors with low antigen density. Nat Med 28, 345–352 (2022). [DOI] [PMC free article] [PubMed] [Google Scholar]
- 15.Cabo M et al. Trial Watch: Immunostimulatory monoclonal antibodies for oncological indications. Oncoimmunology 6, e1371896 (2017). [DOI] [PMC free article] [PubMed] [Google Scholar]
- 16.Kraehenbuehl L, Weng C-H, Eghbali S, Wolchok JD & Merghoub T Enhancing immunotherapy in cancer by targeting emerging immunomodulatory pathways. Nature Reviews Clinical Oncology 19, 37–50 (2022). [DOI] [PubMed] [Google Scholar]
- 17.Stone JD et al. A novel T cell receptor single-chain signaling complex mediates antigen-specific T cell activity and tumor control. Cancer Immunol Immunother 63, 1163–1176 (2014). [DOI] [PMC free article] [PubMed] [Google Scholar]
- 18.Govers C et al. TCRs genetically linked to CD28 and CD3ε do not mispair with endogenous TCR chains and mediate enhanced T cell persistence and anti-melanoma activity. J Immunol 193, 5315–5326 (2014). [DOI] [PubMed] [Google Scholar]
- 19.Krause A et al. Antigen-dependent CD28 signaling selectively enhances survival and proliferation in genetically modified activated human primary T lymphocytes. J Exp Med 188, 619–626 (1998). [DOI] [PMC free article] [PubMed] [Google Scholar]
- 20.Omer B et al. A Costimulatory CAR Improves TCR-based Cancer Immunotherapy. Cancer Immunol Res 10, 512–524 (2022). [DOI] [PMC free article] [PubMed] [Google Scholar]
- 21.Oda SK et al. A CD200R-CD28 fusion protein appropriates an inhibitory signal to enhance T-cell function and therapy of murine leukemia. Blood 130, 2410–2419 (2017). [DOI] [PMC free article] [PubMed] [Google Scholar]
- 22.Anderson KG et al. Engineering adoptive T cell therapy to co-opt Fas ligand-mediated death signaling in ovarian cancer enhances therapeutic efficacy. J Immunother Cancer 10 (2022). [DOI] [PMC free article] [PubMed] [Google Scholar]
- 23.Guo J, Kent A & Davila E Chimeric non-antigen receptors in T cell-based cancer therapy. J Immunother Cancer 9 (2021). [DOI] [PMC free article] [PubMed] [Google Scholar]
- 24.Prosser ME, Brown CE, Shami AF, Forman SJ & Jensen MC Tumor PD-L1 co-stimulates primary human CD8(+) cytotoxic T cells modified to express a PD1:CD28 chimeric receptor. Mol Immunol 51, 263–272 (2012). [DOI] [PubMed] [Google Scholar]
- 25.Maher J, Brentjens RJ, Gunset G, Riviere I & Sadelain M Human T-lymphocyte cytotoxicity and proliferation directed by a single chimeric TCRzeta /CD28 receptor. Nat Biotechnol 20, 70–75 (2002). [DOI] [PubMed] [Google Scholar]
- 26.Imai C et al. Chimeric receptors with 4–1BB signaling capacity provoke potent cytotoxicity against acute lymphoblastic leukemia. Leukemia 18, 676–684 (2004). [DOI] [PubMed] [Google Scholar]
- 27.Cappell KM & Kochenderfer JN A comparison of chimeric antigen receptors containing CD28 versus 4–1BB costimulatory domains. Nat Rev Clin Oncol 18, 715–727 (2021). [DOI] [PubMed] [Google Scholar]
- 28.Croft M Co-stimulatory members of the TNFR family: keys to effective T-cell immunity? Nature Reviews Immunology 3, 609–620 (2003). [DOI] [PubMed] [Google Scholar]
- 29.Melero I et al. Amplification of tumor immunity by gene transfer of the co-stimulatory 4–1BB ligand: synergy with the CD28 co-stimulatory pathway. Eur J Immunol 28, 1116–1121 (1998). [DOI] [PubMed] [Google Scholar]
- 30.Wang J et al. Optimizing adoptive polyclonal T cell immunotherapy of lymphomas, using a chimeric T cell receptor possessing CD28 and CD137 costimulatory domains. Hum Gene Ther 18, 712–725 (2007). [DOI] [PubMed] [Google Scholar]
- 31.Hirabayashi K et al. Dual-targeting CAR-T cells with optimal co-stimulation and metabolic fitness enhance antitumor activity and prevent escape in solid tumors. Nature Cancer 2, 904–918 (2021). [DOI] [PMC free article] [PubMed] [Google Scholar]
- 32.Katsarou A et al. Combining a CAR and a chimeric costimulatory receptor enhances T cell sensitivity to low antigen density and promotes persistence. Sci Transl Med 13, eabh1962 (2021). [DOI] [PMC free article] [PubMed] [Google Scholar]
- 33.Zhao Z et al. Structural Design of Engineered Costimulation Determines Tumor Rejection Kinetics and Persistence of CAR T Cells. Cancer Cell 28, 415–428 (2015). [DOI] [PMC free article] [PubMed] [Google Scholar]
- 34.Salzer B et al. Engineering AvidCARs for combinatorial antigen recognition and reversible control of CAR function. Nat Commun 11, 4166 (2020). [DOI] [PMC free article] [PubMed] [Google Scholar]
- 35.Ikemizu S et al. Structure and dimerization of a soluble form of B7–1. Immunity 12, 51–60 (2000). [DOI] [PubMed] [Google Scholar]
- 36.Rudd CE, Taylor A & Schneider H CD28 and CTLA-4 coreceptor expression and signal transduction. Immunol Rev 229, 12–26 (2009). [DOI] [PMC free article] [PubMed] [Google Scholar]
- 37.Eyquem J et al. Targeting a CAR to the TRAC locus with CRISPR/Cas9 enhances tumour rejection. Nature (2017). [DOI] [PMC free article] [PubMed] [Google Scholar]
- 38.Chen J et al. NR4A transcription factors limit CAR T cell function in solid tumours. Nature 567, 530–534 (2019). [DOI] [PMC free article] [PubMed] [Google Scholar]
- 39.Good CR et al. An NK-like CAR T cell transition in CAR T cell dysfunction. Cell 184, 6081–6100 e6026 (2021). [DOI] [PMC free article] [PubMed] [Google Scholar]
- 40.Nam KO, Shin SM & Lee HW Cross-linking of 4–1BB up-regulates IL-13 expression in CD8(+) T lymphocytes. Cytokine 33, 87–94 (2006). [DOI] [PubMed] [Google Scholar]
- 41.Kawalekar OU et al. Distinct Signaling of Coreceptors Regulates Specific Metabolism Pathways and Impacts Memory Development in CAR T Cells. Immunity 44, 712 (2016). [DOI] [PubMed] [Google Scholar]
- 42.Esensten JH, Helou YA, Chopra G, Weiss A & Bluestone JA CD28 Costimulation: From Mechanism to Therapy. Immunity 44, 973–988 (2016). [DOI] [PMC free article] [PubMed] [Google Scholar]
- 43.Ward-Kavanagh LK, Lin WW, Šedý JR & Ware CF The TNF Receptor Superfamily in Co-stimulating and Co-inhibitory Responses. Immunity 44, 1005–1019 (2016). [DOI] [PMC free article] [PubMed] [Google Scholar]
- 44.Zhao Y et al. cis-B7:CD28 interactions at invaginated synaptic membranes provide CD28 co-stimulation and promote CD8+ T cell function and anti-tumor immunity. Immunity 56, 1187–1203.e1112 (2023). [DOI] [PMC free article] [PubMed] [Google Scholar]
- 45.Stephan MT et al. T cell-encoded CD80 and 4–1BBL induce auto- and transcostimulation, resulting in potent tumor rejection. Nat Med 13, 1440–1449 (2007). [DOI] [PubMed] [Google Scholar]
- 46.Menk AV et al. 4–1BB costimulation induces T cell mitochondrial function and biogenesis enabling cancer immunotherapeutic responses. Journal of Experimental Medicine 215, 1091–1100 (2018). [DOI] [PMC free article] [PubMed] [Google Scholar]
- 47.Nakaseko C et al. Cytotoxic T lymphocyte antigen 4 (CTLA-4) engagement delivers an inhibitory signal through the membrane-proximal region in the absence of the tyrosine motif in the cytoplasmic tail. J Exp Med 190, 765–774 (1999). [DOI] [PMC free article] [PubMed] [Google Scholar]
- 48.Schraven B & Kalinke U CD28 superagonists: what makes the difference in humans? Immunity 28, 591–595 (2008). [DOI] [PubMed] [Google Scholar]
- 49.Giavridis T et al. CAR T cell-induced cytokine release syndrome is mediated by macrophages and abated by IL-1 blockade. Nat Med 24, 731–738 (2018). [DOI] [PMC free article] [PubMed] [Google Scholar]
- 50.Davila ML et al. Efficacy and Toxicity Management of 19–28z CAR T Cell Therapy in B Cell Acute Lymphoblastic Leukemia. Science Translational Medicine 6, 224ra225–224ra225 (2014). [DOI] [PMC free article] [PubMed] [Google Scholar]
- 51.Locke FL et al. Axicabtagene Ciloleucel as Second-Line Therapy for Large B-Cell Lymphoma. New England Journal of Medicine 386, 640–654 (2021). [DOI] [PubMed] [Google Scholar]
- 52.Park JH et al. Long-Term Follow-up of CD19 CAR Therapy in Acute Lymphoblastic Leukemia. N Engl J Med 378, 449–459 (2018). [DOI] [PMC free article] [PubMed] [Google Scholar]
- 53.Rosenberg SA IL-2: the first effective immunotherapy for human cancer. J Immunol 192, 5451–5458 (2014). [DOI] [PMC free article] [PubMed] [Google Scholar]
- 54.van der Leun AM & Schumacher TN An atlas of intratumoral T cells. Science 374, 1446–1447 (2021). [DOI] [PubMed] [Google Scholar]
- 55.Sharma A et al. Anti-CTLA-4 Immunotherapy Does Not Deplete FOXP3(+) Regulatory T Cells (Tregs) in Human Cancers. Clin Cancer Res 25, 1233–1238 (2019). [DOI] [PMC free article] [PubMed] [Google Scholar]
- 56.Bitra A & Zajonc DM Evolution of differential 4–1BB signaling in Human and Murine immune system. The FASEB Journal 33, 461.463–461.463 (2019). [Google Scholar]
- 57.Porciello N et al. A non-conserved amino acid variant regulates differential signalling between human and mouse CD28. Nature Communications 9, 1080 (2018). [DOI] [PMC free article] [PubMed] [Google Scholar]
- 58.Li G et al. 4–1BB enhancement of CAR T function requires NF-κB and TRAFs. JCI Insight 3 (2018). [DOI] [PMC free article] [PubMed] [Google Scholar]
- 59.Kalaitsidou M et al. Signaling via a CD28/CD40 chimeric costimulatory antigen receptor (CoStAR™), targeting folate receptor alpha, enhances T cell activity and augments tumor reactivity of tumor infiltrating lymphocytes. Frontiers in Immunology 14 (2023). [DOI] [PMC free article] [PubMed] [Google Scholar]
- 60.Bollard CM et al. Adapting a transforming growth factor beta-related tumor protection strategy to enhance antitumor immunity. Blood 99, 3179–3187 (2002). [DOI] [PubMed] [Google Scholar]
- 61.Yamamoto TN et al. T cells genetically engineered to overcome death signaling enhance adoptive cancer immunotherapy. J Clin Invest 129, 1551–1565 (2019). [DOI] [PMC free article] [PubMed] [Google Scholar]
- 62.Roth TL et al. Pooled Knockin Targeting for Genome Engineering of Cellular Immunotherapies. Cell 181, 728–744.e721 (2020). [DOI] [PMC free article] [PubMed] [Google Scholar]
- 63.Diskin B et al. PD-L1 engagement on T cells promotes self-tolerance and suppression of neighboring macrophages and effector T cells in cancer. Nature Immunology 21, 442–454 (2020). [DOI] [PubMed] [Google Scholar]
- 64.Green DR & Ware CF Fas-ligand: privilege and peril. Proc Natl Acad Sci U S A 94, 5986–5990 (1997). [DOI] [PMC free article] [PubMed] [Google Scholar]
- 65.Wang J et al. A novel adoptive synthetic TCR and antigen receptor (STAR) T-Cell therapy for B-Cell acute lymphoblastic leukemia. Am J Hematol 97, 992–1004 (2022). [DOI] [PubMed] [Google Scholar]
- 66.Heemskerk B et al. Adoptive cell therapy for patients with melanoma, using tumor-infiltrating lymphocytes genetically engineered to secrete interleukin-2. Hum Gene Ther 19, 496–510 (2008). [DOI] [PMC free article] [PubMed] [Google Scholar]
- 67.Zhang L et al. Tumor-infiltrating lymphocytes genetically engineered with an inducible gene encoding interleukin-12 for the immunotherapy of metastatic melanoma. Clin Cancer Res 21, 2278–2288 (2015). [DOI] [PMC free article] [PubMed] [Google Scholar]
- 68.Stadtmauer EA et al. CRISPR-engineered T cells in patients with refractory cancer. Science 367, eaba7365 (2020). [DOI] [PMC free article] [PubMed] [Google Scholar]
- 69.Chesney J et al. 883TiP A phase I/II open-label study (IOV-GM1–201) of TALEN-mediated PD-1 inactivated autologous tumor-infiltrating lymphocytes (TIL; IOV-4001) in patients with advanced melanoma and NSCLC. Annals of Oncology 33, S952 (2022). [Google Scholar]
- 70.Lesch S et al. PD-1-CD28 fusion protein strengthens mesothelin-specific TRuC T cells in preclinical solid tumor models. Cell Oncol (Dordr) (2022). [DOI] [PMC free article] [PubMed] [Google Scholar]
Methods Only References
- 71.Dudley ME, Wunderlich JR, Shelton TE, Even J & Rosenberg SA Generation of tumor-infiltrating lymphocyte cultures for use in adoptive transfer therapy for melanoma patients. J Immunother 26, 332–342 (2003). [DOI] [PMC free article] [PubMed] [Google Scholar]
- 72.Brentjens RJ et al. Genetically targeted T cells eradicate systemic acute lymphoblastic leukemia xenografts. Clin Cancer Res 13, 5426–5435 (2007). [DOI] [PubMed] [Google Scholar]
- 73.Ghani K, Cottin S, de Campos-Lima PO, Caron MC & Caruso M Characterization of an alternative packaging system derived from the cat RD114 retrovirus for gene delivery. J Gene Med 11, 664–669 (2009). [DOI] [PubMed] [Google Scholar]
- 74.Gallardo HF, Tan C, Ory D & Sadelain M Recombinant retroviruses pseudotyped with the vesicular stomatitis virus G glycoprotein mediate both stable gene transfer and pseudotransduction in human peripheral blood lymphocytes. Blood 90, 952–957 (1997). [PubMed] [Google Scholar]
- 75.Derré L et al. Distinct sets of alphabeta TCRs confer similar recognition of tumor antigen NY-ESO-1157–165 by interacting with its central Met/Trp residues. Proc Natl Acad Sci U S A 105, 15010–15015 (2008). [DOI] [PMC free article] [PubMed] [Google Scholar]
Associated Data
This section collects any data citations, data availability statements, or supplementary materials included in this article.
Supplementary Materials
Data Availability Statement
The single-cell RNA-sequencing data is available from the Gene Expression Omnibus (GEO) under accession code GSE223211. Numerical source data for all figures has been provided. All other data supporting the findings of this study are available from the corresponding author on reasonable request.