

ABSTRACT
Four 2,2,6,6‐tetramethylpiperidinyloxyl (TEMPO) derivatives with molecular weights of 339–1131 Da were synthesized to investigate their ionization behaviors in fast atom bombardment (FAB), electron ionization (EI), direct analysis in real time (DART), electrospray ionization (ESI), atmospheric pressure chemical ionization (APCI), atmospheric pressure photoionization (APPI), and matrix‐assisted laser desorption/ionization mass spectrometry (MALDI‐MS). These include 4‐dodecanoylamino‐2,2,6,6‐tetramethyl‐1‐piperidinyloxy (1), 4‐dodecylamino‐2,2,6,6‐tetramethyl‐1‐piperidinyloxy (2), N,N′‐bis(2,2,6,6‐tetramethyl‐1‐oxyl‐4‐piperidinyl)dodecanediamide (3), and bis‐cholesterol TEMPO derivative 4. For TEMPO derivatives 1 and 2 (molecular weights: 353 Da and 339 Da), [M]+, [M+H]+•, and [M+2H]+ peaks were detected. TEMPO derivative 3, containing two TEMPO moieties, showed [M]+•, [M+H]+, [M+2H]+•, and [M+3H]+ peaks. EI was optimal for smaller derivatives, as molecular ion peaks were predominant. For larger analytes, molecular ion intensities weakened, favoring hydrogen adduct peaks. EI and DART‐MS failed to detect bis‐cholesterol TEMPO derivative 4. Under APCI and APPI‐MS, N–O bond cleavage was observed. MALDI‐MS detected only hydrogen adduct peaks. FAB, ESI, APCI, and APPI‐MS detections varied with scan numbers, unlike EI, DART, and MALDI‐MS.
Keywords: bi‐radical, ionization mechanism, ionization method, mono‐radical, TEMPO derivatives
1. Introduction
2,2,6,6‐Tetramethylpiperidinyloxyl (TEMPO) derivatives [1, 2, 3] have been widely applied to catalysts [2, 3, 4], building blocks [5, 6], imaging agents and probes [7, 8, 9, 10], antioxidants [11], energy storage materials [12], additives [13], and friction modifiers [14] in lubrication oils, among other uses. Mass spectrometry (MS) is a powerful method of characterizing these TEMPO derivatives [7, 14, 15, 16, 17, 18, 19, 20, 21, 22]. Electron spin resonance (ESR) is also a well‐established measurement method to detect radical species such as TEMPOs [7, 16, 20, 23]; however, very few facilities are equipped with ESR instruments. Thus, the usefulness of MS analysis would be expanded if information on radical species as well as molecular weights could be obtained through MS analysis. It is also important to know what kind of information can be obtained by measuring radical species through MS analysis coupled with various ionization methods. Fast atom bombardment (FAB) [7, 14, 16, 17], electron ionization (EI) [18, 19], electrospray ionization (ESI) [19, 20, 21], and matrix‐assisted laser desorption/ionization mass spectrometry (MALDI‐MS) [22] have been frequently employed to obtain information on the molecular weight of TEMPO radicals. However, their ionization behaviors have not been reported in detail. For example, reported ions of mono TEMPO derivatives by FAB‐MS measurements vary from report to report: [M+2H]+ ions were consistently described as FAB‐MS data [14, 16], while [M]+ and/or [M+H]+• ions were reported depending on the mono TEMPO derivative [17]. The same variation was observed for ESI‐MS [20]. These discrepancies were an impetus for this study. In our research into a friction modifier, the generation of the hydrogen adduct [M+2H]+ from the molecular ion [M]+ was observed during FAB measurement of TEMPO derivative 1 (Figure 1) [14]. On the basis of this observation, an initial investigation was conducted using FAB‐MS. As a result, we observed that the behaviors of the TEMPO radicals were dependent on scan time, matrix, concentration, and additive. To clarify the ionization processes of TEMPO radicals on the MS measurement, we decided to focus our investigation on the effects of ionization method, structure, molecular weight, and scan time. Here, we report a systematic investigation of various MS behaviors of the four synthesized TEMPO derivatives shown in Figure 1 by using FAB, EI, direct analysis in real time (DART), ESI, atmospheric pressure chemical ionization (APCI), atmospheric pressure photoionization (APPI), and MALDI‐MS. These include TEMPO derivative 1 with an amide moiety [7, 14], TEMPO derivative 2 with an amine [16], bis‐TEMPO derivative 3 [7], and bis‐cholesterol TEMPO derivative 4 with a molecular weight of more than 1000 Da. For comparison, we also conducted MS analyses of hydroxylalkylamines 5 and 6 (Figure 1) to investigate the ionization processes of TEMPO derivatives 1–4. The behaviors of these derivatives with molecular weights of 339–1131 Da during the ionization processes were clarified using FAB, EI, DART, ESI, APCI, APPI, and MALDI‐MS and are summarized in Table S1.
FIGURE 1.
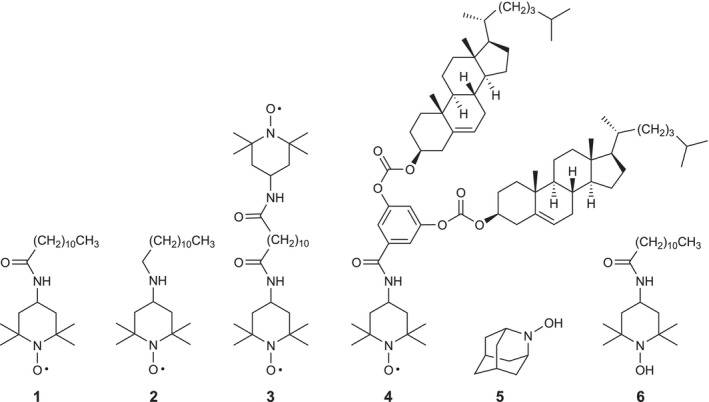
Structures of TEMPO derivatives 1–4 and hydroxylalkylamines 5 and 6 investigated in this study.
2. Methods
2.1. General
The TEMPO derivatives were synthesized by using the usual Schlenk technique on a dual‐manifold vacuum–argon system. Thin‐layer chromatography (TLC) analysis was conducted by using silica gel 60 F254 (Merck No. 5715, thickness 0.25 mm; Merck Millipore, Darmstadt, Germany). Normal‐phase medium‐pressure liquid chromatography (MPLC) was conducted using Purif‐Pack SI‐25 columns (size 60, 120) on a Purif‐compact purification system (Shoko Science, Yokohama, Japan). Melting points were measured on an MPA 100 apparatus (Stanford Research Systems, Sunnyvale, CA, USA). Infrared (IR) spectra were recorded on an FT/IR‐460 spectrometer (JASCO, Tokyo, Japan).
2.2. Materials
3‐Nitrobenzyl alcohol (NBA), glycerol, 2‐hydroxy‐2‐azaadamantane (5), and L‐ascorbic acid (7) were purchased from Tokyo Chemical Industry Co. Ltd., Tokyo, Japan. Ethyl acetate, methanol (MeOH), and tetrahydrofuran (THF) were purchased from FUJIFILM Wako Pure Chemical Corporation, Osaka, Japan. 2,5‐Dihydroxybenzoic acid (2,5‐DHB) was purchased from Bruker Daltonics GmbH & Co. KG, Bremen, Germany. Dehydrated CHCl3 and dimethyl sulfoxide (DMSO) were commercially supplied by FUJIFILM Wako Pure Chemical Corporation and stored in 1‐L Schlenk tubes. CH2Cl2 was distilled from CaH2 prior to use. TEMPO derivatives 1 [7, 14], 2 [16], and 3 [7] were prepared by the established procedures. 4‐Amino‐2,2,6,6‐tetramethylpiperidine 1‐oxyl free radical (8), 3,5‐diacetoxybenzoic acid (9), cholesterol chloroformate, 4‐dimethylaminopyridine (DMAP), and 1‐(3‐dimethylaminopropyl)‐3‐ethylcarbodiimide hydrochloride (EDAC•HCl) were purchased from Tokyo Chemical Industry Co. Ltd. TEMPO derivative 4 was newly synthesized from 8, 9, and cholesterol chloroformate (Scheme S1).
2.3. Mass Spectrometry
All MS spectra were acquired in positive‐ion mode. FAB–MS experiments were performed using JMS‐700 (JEOL Ltd., Akishima, Japan). Highly concentrated samples were prepared by dissolving TEMPO derivative 1 (0.3 mg) in NBA or glycerol (10 μL). Dilute samples were prepared by dissolving compounds 1–5 (1 mg) in NBA (0.2 mL). Compound 6 was prepared by dissolving 5 mg of L‐ascorbic acid (7) and 1 mg of TEMPO derivative 1 in a mixture of NBA (0.2 mL) and MeOH (50 μL). EI–MS experiments were performed using JMS‐T100GCV (JEOL). The temperature of the ionization chamber was 200 °C. Samples were prepared by dissolving compounds 1–5 (1 mg) in ethyl acetate (1 mL). Compound 6 was prepared by dissolving 5 mg of 7 and 1 mg of TEMPO derivative 1 in a mixture of ethyl acetate (0.5 mL) and MeOH (0.5 mL). DART–MS experiments were performed using JMS‐T100TD (JEOL). The measurement temperature was 200 °C. Dilute samples were prepared by dissolving compounds 1–5 (1 mg) in ethyl acetate (0.2 mL). Compound 6 was prepared by dissolving 5 mg of 7 and 1 mg of TEMPO derivative 1 in a mixture of ethyl acetate (0.2 mL) and MeOH (0.1 mL). ESI–MS experiments were performed using a compact system (Bruker, Billerica, MA, USA). The dry temperature was 200 °C. Samples were prepared by dissolving compounds 1–5 (1 mg) in ethyl acetate (1 mL) and then diluting the resulting solution 100 times with ethyl acetate. APCI–MS experiments were performed using a compact system (Bruker). The dry and vaporizer temperatures were 220 and 350 °C, respectively. Samples were prepared by dissolving compounds 1–5 (1 mg) in ethyl acetate (1 mL) and then diluting the resulting solution 100 times with ethyl acetate. APPI–MS experiments were performed using a compact system (Bruker). The dry and vaporizer temperatures were 200 and 350 °C, respectively. Samples were prepared by dissolving compounds 1–5 (1 mg) in ethyl acetate (1 mL) and then diluting the resulting solution 100 times with ethyl acetate. MALDI–MS experiments were performed by using ultrafleXtreme (Bruker) operated in reflectron mode. Samples were prepared by mixing 3 μL of compounds 1–5 (1 mg in ethyl acetate (0.5 mL)) and 3 μL of 2,5‐dihydroxybenzoic acid (2,5‐DHB) (10 mg in THF (1 mL)) as a matrix. The resulting mixtures (1 μL) were spotted on the MALDI sample plate, air dried, and analyzed.
2.4. ESR Measurement
X‐band ESR measurements were performed using the JES‐TE200 (JEOL) at room temperature. Each g‐value was determined using the Mn2+/MgO marker as an internal standard. Samples were prepared by dissolving TEMPO derivatives 1–4 (1 mg) in toluene (1 mL); 1 and 2 were then diluted 200 times and 3 and 4 were diluted 100 times. All samples were measured using an NMR tube as a sample container. TEMPO derivatives 1–4 used for MS experiments are guaranteed to be radicals by ESR measurements (Figures S44–S47). The g‐values of TEMPO derivatives 1–4 were determined as follows: 1, g = 2.00644; 2, g = 2.00642; 3: g = 2.00642; 4; g = 2.00643. The ESR spectra of TEMPO radicals 1, 2, and 4 show a typical triplet due to the isotropic interaction of N nuclei (Figures S44, S45, and S47), while that of TEMPO diradical 3 suggests an interaction between the two TEMPO moieties (Figure S46). ESR spectra of di‐TEMPO are available in reference [20]. Based on the ESR spectra, the radicals of TEMPO derivatives 1–4 are located on the oxygen side of the N–O bond.
3. Results and Discussion
3.1. Measurements of TEMPO Derivatives 1–4 by FAB‐MS
TEMPO derivative 1 was dissolved in NBA (30 mg/mL) and measured by FAB‐MS [15, 24, 25] in positive mode. As shown in Figure 2A, the molecular ion [M]+ was detected as a major peak. [M]+ was generated from 1 by removing one electron (Scheme 1). However, the intensity of [M]+ gradually weakened as the number of scans increased. The peak of [M+2H]+ then became predominant (Figure 2B), which was consistent with our previous MS experiment [14]. [M+2H]+ might be formed through [M]+, [M+H], and [M+H]+ • (Scheme 1), as indicated by scan‐related changes in the peak intensities of [M]+, [M+H]+ •, and [M+2H]+ (Figure S3). The intermediate [M+H] may form from [M]+ mainly through the addition of a hydrogen anion, and this intermediate may further convert to [M+2H]+ by the addition of a proton. Alternatively, [M+H] could potentially transition to [M+H]+ • by removing one electron. The subsequent removal of another electron, followed by the addition of a hydrogen anion, could lead to the formation of [M+2H]+ (Scheme 1). When measuring a diluted concentration of 5 mg/mL of TEMPO derivative 1 in NBA, where the amount of NBA as a proton source per mol amount of compound 1 increased, the main peak observed from the outset of the scan was [M+2H]+ (Figure 2C). After 90 scans, the peak of [M+2H]+ was predominant (Figure S4). In measurements using samples with even lower concentrations (1 mg/mL and 0.1 mg/mL), the relative intensities of [M]+ and [M+H]+ • weaken compared to that of [M+2H]+, which became predominant within only two scans (Figure S5). These experiments demonstrate that the relative intensity of the detected species by FAB‐MS was significantly influenced by the concentration and the scan number of the analyte. The [M]+ ion remained relatively stable at the high concentration, whereas the conversion from [M]+ to [M+2H]+ occurred more easily at the low concentration. This conversion could be prompted by irradiating a beam of fast neutral atoms of Xe [15, 24, 25, 26] while NBA serves as a proton source. When the matrix was replaced with glycerol, the primary ion peak observed from the outset of the scan was [M+2H]+ (Figure 2D). Because the proton‐rich matrix potentially aids in protonation [26], the conversion to [M+2H]+ would happen within only two scans.
FIGURE 2.

FAB mass spectra of TEMPO derivative 1 by JMS‐700 using a highly concentrated sample in NBA (30 mg/mL) [(A) 2 scans, (B) 85 scans], a dilute sample in NBA (5 mg/mL) [(C) 2 scans], and a highly concentrated sample in glycerol (30 mg/mL) [(D) 2 scans]. The dashed arrows indicate peaks that increase with the number of scans under the same matrix conditions. The dashed lines indicate corresponding peaks under different matrix conditions.
SCHEME 1.

A plausible ionization mechanism of TEMPO derivative 1 [(i) addition of a hydrogen radical, (ii) one‐electron oxidation, (iii) addition of a hydrogen anion, (iv) protonation, (v) one‐electron oxidation, (vi) one‐electron oxidation with the addition of a hydrogen anion].
The stability of the NO–H functional group during the ionization process is crucial information in practical MS analysis. Thus, compounds with an NO–H functional group were measured. An analysis of 2‐hydroxy‐2‐azaadamantane (5) was conducted, yielding the protonated [M+H]+ without any fragmentation (Figure S10). In addition, an assessment of N‐(1‐hydroxy‐2,2,6,6‐tetramethyl‐4‐piperidinyl)dodecanamide (6) produced in situ by the reduction of TEMPO derivative 1 using l‐ascorbic acid (7) as a radical scavenger [27] resulted in the detection of the protonated [M+H]+ peak within a single scan (Figure S11). These observations revealed that hydroxylamines primarily lead to the detection of the protonated [M+H]+ peak. Comparing the FAB‐MS spectra of compounds 1, 5, and 6, it is deduced, without the assistance of ESR spectrometry, that any unknown analyte exhibiting peaks of [M]+ and [M+H]+ • detected via FAB‐MS likely originates from a nitroxyl radical and not from a compound containing an NO–H functional group. This estimation enhances the potential of MS spectrometry. However, care must be taken when measuring unknown analytes at lower concentrations, as the relative intensities of [M]+ and [M+H]+ • compared to [M+2H]+ would be weaker.
TEMPO derivative 2 was measured by FAB‐MS at a diluted concentration (5 mg/mL) in NBA (Figures 3A and S7). In contrast to TEMPO derivative 1, the hydrogen adduct [M+H]+ •, resulting from the addition of a proton to [M]•, was primarily observed due to a nucleophilic attack of the amino group (Figure 3A, Scheme 2). Subsequently, the peak of [M+2H]+ was detected gradually (Figure S7, Scheme 2). [M+2H]+ could also be generated through a mechanism similar to that of TEMPO derivative 1 (Scheme S2). The ionization of bis‐TEMPO derivative 3 initially resulted in the primary peak of [M+2H]+• (Figure 3B), which then gradually transitioned to the peak of [M+3H]+ (Figure S8). Several pathways leading to [M+2H]+ • are shown in Scheme 3. For example, [M]2 • loses one electron to become [M]+ •, which then undergoes the addition of a hydrogen radical. The resulting [M+H]+ accepts a hydride and loses one electron, yielding [M+2H]+ •. Another pathway starts from the addition of two hydrogen radicals to [M]2 •. The resulting [M+2H] loses one electron, producing [M+2H]+ •. In the case of bis‐cholesterol TEMPO derivative 4, only the peak of [M+2H]+ was detected (Figure 3C), which may be a characteristic of TEMPO derivatives larger than 1000 Da. The most stable ion, [M+2H]+, could be identified despite the potential formation of several ion species. The ionization process might be similar to that of TEMPO derivative 1 due to the amide moieties (Scheme S3). Regarding mono TEMPO derivatives, the presence of [M]+ and [M+H]+• indicates the existence of a nitroxyl radical. In contrast, for the bis‐TEMPO derivative, the detection of [M]+•, [M+H]+, and [M+2H]+• affords the radical information. Nonetheless, analyzing the mono TEMPO derivative larger than 1000 Da does not yield radical information.
FIGURE 3.

FAB mass spectra of TEMPO derivatives 2–4 in NBA by JMS‐700 using a diluted sample (5 mg/mL) [(A) TEMPO 2 (2 scans), (B) TEMPO 3 (1 scan), (C) TEMPO 4 (2 scans)].
SCHEME 2.

A plausible ionization mechanism of TEMPO derivative 2 [(i) protonation, (ii) addition of a hydrogen radical, (iii) proton transfer].
SCHEME 3.

A plausible ionization mechanism of bis‐TEMPO derivative 3 [(i) addition of hydrogen radicals, (ii) one‐electron oxidation, (iii) addition of a hydrogen radical, (iv) addition of a hydrogen anion, (v) protonation, (vi) one‐electron oxidation, (vii) addition of a hydrogen anion and one‐electron oxidation, (viii) addition of a hydrogen radical].
3.2. Measurements of TEMPO Derivatives 1–4 by EI‐MS
EI‐MS has been used traditionally to characterize low‐molecular‐weight stable organic radicals such as TEMPO derivatives [18, 19] and 2‐azaadamantane‐N‐oxyl (AZADO) [28], because the molecular ion was known to be easily detected [15]. As expected, a molecular ion peak [M]+ was obtained in the measurement of TEMPO derivative 1 (Figure 4A). In the case of TEMPO derivative 2, the hydrogen adduct [M+H]+• was also observed, albeit at a weaker intensity (Figure 4C). This peak is assigned to [M+H]+• in comparison to the theoretical isotopic pattern (Figure S1). When bis‐TEMPO derivative 3 was measured, only the molecular ion [M]+• was detected (Figure 4D). This is in sharp contrast to the FAB‐MS spectra (Figures 3B). To exclude the possibility of cleavage of an NO–H bond during the EI ionization process, 2‐hydroxy‐2‐azaadamantane (5) was examined. As a result, primarily [M]+• was observed, with the peak of fragmented [M–H]+ detected at a negligible level (Figure 4E). Furthermore, a measurement of N‐(1‐hydroxy‐2,2,6,6‐tetramethyl‐4‐piperidinyl)dodecanamide (6) exclusively afforded the molecular ion [M]+• (Figure 4B). These observations indicated that peaks derived from nitroxyl radicals can be distinguished from those derived from hydroxylamines in EI‐MS measurements. Even at 400 °C on the probe tips, no molecular ion peak of bis‐cholesterol TEMPO derivative 4 with a molecular weight exceeding 1000 Da was detected because 4 is hard to vaporize [15] (Figure S15). None of the detected ion species of TEMPO derivatives 1 – 3 depended on the number of scans. It was confirmed that EI‐MS was suitable for low‐ to medium‐molecular‐weight TEMPO radicals but not for large‐molecular‐weight ones. It was demonstrated that the NO–H bond of hydroxylamine was not cleaved during the EI ionization process. Thus, EI‐MS measurements can distinguish between nitroxyl radicals and hydroxylamines.
FIGURE 4.

EI mass spectra of TEMPO derivatives 1–4, 6 and 2‐hydroxy‐2‐azaadamantane (5) in ethyl acetate by JMS‐T100GCV [(A) TEMPO 1, (B) N‐(1‐hydroxy‐2,2,6,6‐tetramethyl‐4‐piperidinyl)dodecanamide (6), (C) TEMPO 2, (D) TEMPO 3, (E) 2‐hydroxy‐2‐azaadamantane (5)].
3.3. Measurements of TEMPO Derivatives 1–4 by DART‐MS
When TEMPO derivative 1 was detected using DART‐MS, primarily a molecular ion peak of [M]+ was obtained (Figure 5A), despite DART‐MS typically providing ion peaks of hydrogen adducts [15, 29, 30]. In the case of TEMPO derivative 2, the [M]+ and [M+H]+• peaks were observed with approximately the same intensity (Figure 5C). These observations might be attributable to the difference between the amide and amine bonds (Schemes 1 and 2). In the case of bis‐TEMPO derivative 3, the intensity of the hydrogen adduct [M+H]+ in the isotopic pattern was the strongest, followed by [M+2H]+•, [M]+•, and [M+3H]+, in that order (Figure 5D). To confirm whether an NO–H bond was cleaved during the DART ionization process, 2‐hydroxy‐2‐azaadamantane (5) was measured to afford the hydrogen adduct [M+H]+ as the main peak. However, an unexpected peak [M–H]+ was observed, which was smaller than the main peak by two hydrogen atoms (Figure 5E). This unexpected peak could be attributed to a protonated adduct of a compound with the loss of two hydrogens from 5 or assigned to a cation of the nitroxyl radical produced from 5. Conversely, hydroxylamine 6 produced only the hydrogen adduct [M+H]+ without any cleavage (Figure 5B). Because measurements of TEMPO derivatives 1–3 and 6 did not afford any cleavage peak, the ionization pattern of 5 in this measurement might be specific to this compound. Finally, bis‐cholesterol TEMPO derivative 4 was examined, but the desired molecular ion peak could not be detected because 4 is hard to vaporize [30] (Figure S21). DART‐MS measurement from small to medium‐sized TEMPO derivatives detected molecular and hydrogen adduct ions, and none of them depended on the number of scans. These measurements yielded peaks corresponding to nitroxyl radicals. However, a specific case, namely that of compound 5, merits special attention.
FIGURE 5.

DART mass spectra of TEMPO derivatives 1–4, 6 and 2‐hydroxy‐2‐azaadamantane (5) in ethyl acetate by JMS‐T100TD [(A) TEMPO 1, (B) N‐(1‐hydroxy‐2,2,6,6‐tetramethyl‐4‐piperidinyl)dodecanamide (6), (C) TEMPO 2, (D) TEMPO 3, (E) 2‐hydroxy‐2‐azaadamantane (5)].
3.4. Measurements of TEMPO Derivatives 1–4 by ESI‐MS
In ESI‐MS measurements, it is well known that a protonated peak tends to be easily detected [15, 31, 32]. Actually, the ESI measurement of TEMPO derivative 1 primarily resulted in the hydrogen adduct peak [M+2H]+ (Figure 6A). A peak of the molecular ion [M]+ was initially observed, albeit with low intensity, in the first scan (Figure 6A). In the following scan, this peak almost disappeared (Figure 6B), mirroring the scan time dependency seen in FAB‐MS. It might be deduced that the number of protons and hydrogen radicals would increase gradually in the atmosphere of the ion chamber.
FIGURE 6.

ESI mass spectra of TEMPO derivatives 1–3 in ethyl acetate by a compact system [(A) TEMPO 1 (21 scans), (B) TEMPO 1 (40 scans), (C) TEMPO 2 (16 scans), (D) TEMPO 3 (27 scans)]. The dashed arrows indicate peaks that increase with the number of scans.
When employing TEMPO derivative 2, the main peak observed was the radical cation [M+H]+•, undergoing the gradual addition of a hydrogen radical to produce [M+2H]+ (Figures 6C and S25). The tendency for [M+H]+• to form aligns with the ionization behavior observed for 2 via FAB and DART. The amine group's nitrogen lone pair in 2 readily facilitates protonation, leading to the detection of the resulting radical cation species (Scheme 2).
The analysis of bis‐TEMPO derivative 3 revealed the hydrogen adduct ion [M+2H]+• as the most prominent peak, followed by [M+H]+, [M+3H]+, and [M]+• after 27 scans (Figure 6D). The initial identification of [M+2H]+• and its evolution with the number of scans mirrored closely the behavior observed for compound 3 using FAB. During the initial ionization processes, the bi‐radical 3 could potentially undergo simultaneous transformation into [M+2H] and [M]+• species through the addition of two hydrogen radicals and the removal of one electron, respectively (Scheme 3). Next, one electron is removed from [M+2H] to provide [M+2H]+• as the main peak, and the addition of a hydrogen radical to [M]+• would afford [M+H]+. [M+3H]+ was produced from [M+2H] and [M+2H]+•. Each initially detected ion underwent a reaction with a single hydrogen atom, leading to a spectrum where the highest peak shifted to [M+3H]+ after 43 scans (Figure S26).
In the measurement of bis‐cholesterol TEMPO derivative 4, only the hydrogen adduct [M+2H]+ was observed (Figure 7A and Scheme S3). Considering FAB measurements and this consistent observation, larger radicals are likely to produce hydrogen adducts [M+2H]+ without preserving radical information. The lifetimes of [M]+ and [M+H]+• might be quite short because the influence of the nitroxyl radical on the whole molecule of 4 is small. On the other hand, the relatively stable ion [M+2H]+ could be rapidly produced due to the presence of potentially large moieties in 4 that can readily accept hydrogen atoms. Thus, the [M+2H]+ peak was predominantly observed and remained unaffected by the number of scans. Finally, examination of 2‐hydroxy‐2‐azaadamantane (5) led to the identification of only the protonated [M+H]+ without any cleavage (Figure 7B). Both TEMPO radical 4 and compound 5 formally afforded peaks similar to those of the protonated hydroxylamines. The peaks observed from 4 provided no radical information due to its large molecular size. On the other hand, 5 afforded no peak derived from nitroxyl radical species due to the presence of its stable O–H bond. As for radical information, ESI measurements tended to mirror those of FAB‐MS. The detection of [M]+, [M]+•, [M+H]+•, [M+H]+, and [M+2H]+• indicated the presence of nitroxyl radicals.
FIGURE 7.

ESI mass spectra of (A) TEMPO derivative 4 and (B) 2‐hydroxy‐2‐azaadamantane (5) in ethyl acetate by a compact system.
3.5. Measurements of TEMPO Derivatives 1–4 by APCI and APPI‐MS
Ionizations in APCI and APPI‐MS are conducted in a spray‐generated atmosphere similar to that of ESI, though with differing ionization energy sources: APCI‐MS uses a corona discharge [15, 33], whereas APPI‐MS relies on UV light [15, 34]. The experiments conducted using APCI and APPI‐MS demonstrated a comparable trend to those observed with ESI (Figures 8 and 9). Hydrogen adduct peaks such as [M+H]+• and [M+2H]+ were easily observed; their relative intensities depended slightly on the number of scans due to changes in the spray‐generated atmosphere during the measurements. On the other hand, clear differences were observed in the cleavage of N–O bonds. Especially, prominent peaks of [M–O+2H]+ were observed for TEMPO derivative 1 (Figures 8A and 9A). In contrast, for TEMPO derivatives 2 – 4, the N–O cleavage peaks exhibited lower intensities (Figures 8B–D, S30–S32, 9B–D, and S35–S37). 2‐Hydroxy‐2‐azaadamantane (5) displayed a minor cleavage peak (Figure 10A and B). This result indicates that the ionization of TEMPO derivatives by APCI and APPI are more complicated than that of ESI‐MS. The distinct N–O cleavage peak of TEMPO derivative 1 might originate from the electron‐withdrawing amide group. Bis‐cholesterol TEMPO derivative 4 exhibited minimal N–O cleavage, likely due to its considerable molecular weight (Figures 8D and 9D ). APCI and APPI are detectable for nitroxyl radicals. However, these ionization methods are not suitable for the measurement of nitroxyl radicals because the resulting spectra are often complex.
FIGURE 8.

APCI mass spectra of TEMPO derivatives 1–4 in ethyl acetate by a compact system [(A) TEMPO 1 (30 scans), (B) TEMPO 2 (37 scans), (C) TEMPO 3 (15 scans), (D) TEMPO 4 (19 scans)].
FIGURE 9.

APPI mass spectra of TEMPO derivatives 1–4 in ethyl acetate by a compact system [(A) TEMPO 1 (17 scans), (B) TEMPO 2 (43 scans), (C) TEMPO 3 (15 scans), (D) TEMPO 4 (21 scans)].
FIGURE 10.

(A) APCI and (B) APPI mass spectra of 2‐hydroxy‐2‐azaadamantane (5) by a compact system.
3.6. Measurements of TEMPO Derivatives 1–4 by MALDI‐MS
In the MALDI‐MS measurements of TEMPO derivatives 1–4 [15, 35], only the peaks corresponding to hydrogen adducts were detected (Figure 11). In each instance, the N–O• moieties were converted into N–OH by the addition of hydrogen radicals, resulting in hydrogen adducts that were subsequently protonated to form cationic species (Schemes 1, 3, 2, 3, S2, and S3). The detected peaks of mono TEMPO radicals 1, 2, and 4 were [M+2H]+ (Figure 11A, B, and D). For the bi‐radical TEMPO 3, the primary detection was [M+3H]+, accompanied by a minor peak of [M+2H]+• (Figure 11C). It was found that the TEMPO radicals were quite easily transformed into hydrogen adducts under laser irradiation (355 nm) in the presence of matrix. It should be noted that the conversion to hydrogen adducts occurred irrespective of the molecular weight. As an additional experiment, it was confirmed that the NO–H bond cleavage of 2‐hydroxy‐2‐azaadamantane (5) did not occur during the MALDI ionization process (Figure 11E). While MALDI‐MS had the advantage of detecting the complete molecular weight, it did not retain information about radical species.
FIGURE 11.

MALDI mass spectra of TEMPO derivatives 1–4, and 2‐hydroxy‐2‐azaadamantane (5) with 2,5‐DHB by ultrafleXtreme [(A) TEMPO 1, (B) TEMPO 2, (C) TEMPO 3, (D) TEMPO 4, (E) 2‐hydroxy‐2‐azaadamantane (5)].
4. Conclusions
The behaviors of four TEMPO derivatives with molecular weights of 339–1131 Da during the ionization processes by FAB, EI, DART, ESI, APCI, APPI, and MALDI‐MS were clarified (Table S1). This study demonstrated the scope and limitation of the detection of TEMPO radicals by mass analysis. For TEMPO derivatives 1 and 2 with small molecular weights, FAB, EI, DART, ESI, APCI, and APPI‐MS were able to detect the molecular ion [M]+ and/or the hydrogen adduct [M+H]+•, which could arise from the nitroxyl radical [M]• but not from a hydroxylalkylamine derivative. Thus, these ionization methods are useful for characterizing nitroxyl radicals. The measurements of TEMPO derivatives 1 and 2 by MALDI‐MS exclusively detected the hydrogen adduct [M+2H]+. Bis‐TEMPO derivative 3 afforded [M]+•, [M+H]+, [M+2H]+ •, and [M+3H]+ peaks (Table S1). For the detection of molecular ions of small to medium‐sized molecules such as 1 – 3, EI ionization was found to be the most suitable method, as it primarily detected molecular ions. The large molecular bis‐cholesterol TEMPO derivative 4 could be detected by FAB, ESI, APCI, APPI, and MALDI‐MS, but it could not be detected by EI and DART‐MS at all. For derivative 4, MALDI exhibited the highest sensitivity, providing a straightforward and easily analyzable ion pattern, even though it did not produce the molecular ion [M]+ typically associated with radical species. It turned out that the ions produced by FAB, ESI, APCI, and APPI‐MS tended to transition into stable hydrogen adducts depending on the number of scans, unlike those observed through EI, DART, and MALDI‐MS. TEMPO radicals are valuable compounds, leading to the synthesis of diverse derivatives containing these moieties across a broad spectrum of fields. We consider the insights into the behaviors of TEMPO derivatives obtained through seven mass spectrometry methods to be valuable for characterizing nitroxyl radicals as well as other radical species. Our results have broader applicability, as the characterization of radical species is essential in materials science.
Author Contributions
K.‐I.O. and M.T. conceived the project and designed the experiments. The TEMPO derivatives were synthesized and characterized by S.H., M.T., and K.‐I.O. MS and ESR analyses were carried out by K.‐I.O. Data analysis performed by all authors. The manuscript was written by K.‐I.O. and M.T. All authors read and approved the final manuscript.
Conflicts of Interest
The authors declare no conflicts of interest.
Supporting Information
Additional supporting information can be found online in the Supporting Information section at the end of this article, including the synthetic procedure of 4, plausible ionization mechanisms of 2 and 4, theoretical isotopic patterns of 1 – 6, mass spectra of 1 – 6, and ESR spectra of 1 – 4 (PDF).
Supporting information
Scheme S1 Synthesis of bis‐cholesterol TEMPO derivative 4.
Scheme S2 A plausible ionization mechanism of TEMPO derivative 2.
Scheme S3 A plausible ionization mechanism of TEMPO derivative 4.
Figure S1 Theoretical isotopic patterns of compounds 1–6 by Bruker Compass DataAnalysis software.
Figure S2 FAB mass spectra of TEMPO derivative 1 by JMS‐700 using a highly concentrated sample in NBA (30 mg/mL).
Figure S3 Scan‐related change in the peak intensity of TEMPO 1 by FAB‐MS (JMS‐700) under a highly concentrated sample in NBA (30 mg/mL).
Figure S4 FAB mass spectra of TEMPO derivative 1 by JMS‐700 using a dilute sample in NBA (5 mg/mL).
Figure S5 FAB mass spectra of TEMPO derivative 1 by JMS‐700 using varying concentrations in NBA (2 scans).
Figure S6 FAB mass spectra of TEMPO derivative 1 by JMS‐700 using a highly concentrated sample in glycerol (30 mg/mL).
Figure S7 FAB mass spectra of TEMPO derivative 2 by JMS‐700 using a dilute sample in NBA (5 mg/mL).
Figure S8 FAB mass spectra of TEMPO derivative 3 by JMS‐700 using a dilute sample in NBA (5 mg/mL).
Figure S9 FAB mass spectrum of TEMPO derivative 4 by JMS‐700 using a dilute sample in NBA (5 mg/mL).
Figure S10 FAB mass spectrum of 2‐hydroxy‐2‐azaadamantane (5) by JMS‐700 using a dilute sample in NBA (5 mg/mL).
Figure S11 FAB mass spectrum of N‐(1‐hydroxy‐2,2,6,6‐tetramethyl‐4‐piperidinyl)dodecanamide (6) formed from TEMPO derivative 1 and L‐ascorbic acid (7) in NBA and MeOH by JMS‐700.
Figure S12 EI mass spectrum of TEMPO derivative 1 in AcOEt by JMS‐T100GCV.
Figure S13 EI mass spectrum of TEMPO derivative 2 in AcOEt by JMS‐T100GCV.
Figure S14 EI mass spectrum of TEMPO derivative 3 in AcOEt by JMS‐T100GCV.
Figure S15 EI mass spectrum of TEMPO derivative 4 in AcOEt by JMS‐T100GCV. The molecular ion of TEMPO derivative 4 was not observed.
Figure S16 EI mass spectrum of 2‐hydroxy‐2‐azaadamantane (5) in AcOEt by JMS‐T100GCV.
Figure S17 EI mass spectrum of N‐(1‐hydroxy‐2,2,6,6‐tetramethyl‐4‐piperidinyl)dodecanamide (6) formed from TEMPO derivative 1 and L‐ascorbic acid (7) in AcOEt and MeOH by JMS‐T100GCV.
Figure S18 DART mass spectrum of TEMPO derivative 1 in AcOEt by JMS‐T100TD.
Figure S19 DART mass spectrum of TEMPO derivative 2 in AcOEt by JMS‐T100TD.
Figure S20 DART mass spectrum of TEMPO derivative 3 in AcOEt by JMS‐T100TD.
Figure S21 DART mass spectrum of TEMPO derivative 4 in AcOEt by JMS‐T100TD. The molecular ion of TEMPO derivative 4 was not observed.
Figure S22 DART mass spectrum of 2‐hydroxy‐2‐azaadamantane (5) in AcOEt by JMS‐T100TD.
Figure S23 DART mass spectrum of N‐(1‐hydroxy‐2,2,6,6‐tetramethyl‐4‐piperidinyl)dodecanamide (6) formed from TEMPO derivative 1 and L‐ascorbic acid (7) in AcOEt and MeOH by JMS‐T100TD.
Figure S24 ESI mass spectra of TEMPO derivative 1 in AcOEt by a compact system.
Figure S25 ESI mass spectra of TEMPO derivative 2 in AcOEt by a compact system.
Figure S26 ESI mass spectra of TEMPO derivative 3 in AcOEt by a compact system.
Figure S27 ESI mass spectrum of TEMPO derivative 4 in AcOEt by a compact system.
Figure S28 ESI mass spectrum of 2‐hydroxy‐2‐azaadamantane (5) in AcOEt by a compact system.
Figure S29 APCI mass spectra of TEMPO derivative 1 in AcOEt by a compact system.
Figure S30 APCI mass spectra of TEMPO derivative 2 in AcOEt by a compact system.
Figure S31 APCI mass spectra of TEMPO derivative 3 in AcOEt by a compact system.
Figure S32 APCI mass spectra of TEMPO derivative 4 in AcOEt by a compact system.
Figure S33 APCI mass spectrum of 2‐hydroxy‐2‐azaadamantane (5) in AcOEt by a compact system.
Figure S34 APPI mass spectra of TEMPO derivative 1 in AcOEt by a compact system.
Figure S35 APPI mass spectra of TEMPO derivative 2 in AcOEt by a compact system.
Figure S36 APPI mass spectra of TEMPO derivative 3 in AcOEt by a compact system.
Figure S37 APPI mass spectra of TEMPO derivative 4 in AcOEt by a compact system.
Figure S38 APPI mass spectrum of 2‐hydroxy‐2‐azaadamantane (5) in AcOEt by a compact system.
Figure S39 MALDI mass spectrum of TEMPO derivative 1 with 2,5‐DHB by ultrafleXtreme.
Figure S40 MALDI mass spectrum of TEMPO derivative 2 with 2,5‐DHB by ultrafleXtreme.
Figure S41 MALDI mass spectrum of TEMPO derivative 3 with 2,5‐DHB by ultrafleXtreme.
Figure S42 MALDI mass spectrum of TEMPO derivative 4 with 2,5‐DHB by ultrafleXtreme.
Figure S43 MALDI mass spectrum of 2‐hydroxy‐2‐azaadamantane (5) with 2,5‐DHB by ultrafleXtreme.
Table S1 Significant ions observed in various mass spectra of TEMPO derivatives 1–4 and hydroxylamines 5 and 6.
Figure S44 ESR spectrum of TEMPO derivative 1 in toluene (14 × 10−6 mol/L) by JES‐TE200.
Figure S45 ESR spectrum of TEMPO derivative 2 in toluene (15 × 10−6 mol/L) by JES‐TE200.
Figure S46 ESR spectrum of TEMPO derivative 3 in toluene (19 × 10−6 mol/L) by JES‐TE200.
Figure S47 ESR spectrum of TEMPO derivative 4 in toluene (9 × 10⁻⁶ mol/L) by JES‐TE200.
Acknowledgements
This research was partly supported by JSPS KAKENHI Grant Number 24H00282.
Funding: This work was supported by JSPS KAKENHI Grant, 24H00282.
Contributor Information
Kin‐ichi Oyama, Email: oyama.kin-ichi.k2@f.mail.nagoya-u.ac.jp.
Masaki Tsukamoto, Email: tsukamoto@i.nagoya-u.ac.jp.
Data Availability Statement
The data that support the findings of this study are available from the corresponding author upon reasonable request.
References
- 1. Lebedev O. L. and Kazarnovsky S. N., “Intermediate Products of Oxidation of Amines by Pertungstate,” Tr. Khim. Khim. Tekhnol. 2 (1959): 649 Chemical Abstracts 1962, 56, 15479f. [Google Scholar]
- 2. Tebben L. and Studer A., “Nitroxides: Applications in Synthesis and in Polymer Chemistry,” Angewandte Chemie, International Edition 50 (2011): 5034–5068. [DOI] [PubMed] [Google Scholar]
- 3. Leifert D. and Studer A., “Organic Synthesis Using Nitroxides,” Chemical Reviews 123 (2023): 10302–10380. [DOI] [PubMed] [Google Scholar]
- 4. Sheldon R. A. and Arends I. W. C., “Organocatalytic Oxidations Mediated by Nitroxyl Radicals,” Advanced Synthesis & Catalysis 346 (2004): 1051–1071. [Google Scholar]
- 5. Keana J. F. W., “Newer Aspects of the Synthesis and Chemistry of Nitroxide Spin Labels,” Chemical Reviews 78 (1978): 37–64. [Google Scholar]
- 6. Hansen K.‐A. and Blinco J. P., “Nitroxide Radical Polymers – A Versatile Material Class for High‐Tech Applications,” Polymer Chemistry 9 (2018): 1479–1516. [Google Scholar]
- 7. Gallez B., Demeure R., Debuyst R., Leonard D., Dejehet F., and Dumont P., “Evaluation of Nonionic Nitroxyl Lipids as Potential Organ‐Specific Contrast Agents for Magnetic Resonance Imaging,” Magnetic Resonance Imaging 10 (1992): 445–455. [DOI] [PubMed] [Google Scholar]
- 8. Zhelev Z., Bakalova R., Aoki I., Lazarova D., and Saga T., “Imaging of Superoxide Generation in the Dopaminergic Area of the Brain in Parkinson's Disease, Using Mito‐TEMPO,” ACS Chemical Neuroscience 4 (2013): 1439–1445. [DOI] [PMC free article] [PubMed] [Google Scholar]
- 9. Hou M., Lu X., Zhang Z., et al., “Conjugated Polymer Containing Organic Radical for Optical/MR Dual‐Modality Bioimaging,” ACS Applied Materials & Interfaces 9 (2017): 44316–44323. [DOI] [PubMed] [Google Scholar]
- 10. Lee J.‐u., Lee S. T., Park C. R., Moon B., Kim H. I., and Oh H. B., “TEMPO‐Assisted Free‐Radical‐Initiated Peptide Sequencing Mass Spectrometry for Ubiquitin Ions: An Insight on the Gas‐Phase Conformations,” Journal of the American Society for Mass Spectrometry 33 (2022): 471–481. [DOI] [PubMed] [Google Scholar]
- 11. DeJulius C. R., Dollinger B. R., Kavanaugh T. E., et al., “Optimizing an Antioxidant TEMPO Copolymer for Reactive Oxygen Species Scavenging and Anti‐Inflammatory Effects In Vivo,” Bioconjugate Chemistry 32 (2021): 928–941. [DOI] [PMC free article] [PubMed] [Google Scholar]
- 12. Hatakeyama‐Sato K. and Oyaizu K., “Redox: Organic Robust Radicals and Their Polymers for Energy Conversion/Storage Devices,” Chemical Reviews 123 (2023): 11336–11391. [DOI] [PubMed] [Google Scholar]
- 13. Li D., Gao P., Sun X., Zhang S., Zhou F., and Liu W., “The Study of TEMPOs as Additives in Different Lubrication Oils for Steel/Steel Contacts,” Tribology International 73 (2014): 83–87. [Google Scholar]
- 14. Zhang X., Tsukamoto M., Zhang H., Mitsuya Y., Itoh S., and Fukuzawa K., “Experimental Study of Application of Molecules With a Cyclic Head Group Containing a Free Radical as Organic Friction Modifiers,” Journal of Advanced Mechanical Design Systems 14 (2020): JAMDSM0044. [Google Scholar]
- 15. Gross J. H., Mass Spectrometry: A Textbook (Springer, 2017). [Google Scholar]
- 16. Nakatsuji S., Mizumoto M., Ikemoto H., Akutsu H., and Yamada J.‐i., “Preparation and Properties of Organic Radical Compounds With Mesogenic Cores,” European Journal of Organic Chemistry 12 (2002): 1912–1918, . [DOI] [Google Scholar]
- 17. Sasada Y., Ichinoi R., Oyaizu K., and Nishide H., “Supramolecular Organic Radical Gels Formed With 2,2,6,6‐Tetramethylpiperidin‐1‐Oxyl‐Substituted Cyclohexanediamines: A Very Efficient Charge‐Transporting and ‐Storable Soft Material,” Chemistry of Materials 29 (2017): 5942–5947. [Google Scholar]
- 18. Sosnovsky G., Baysal M., and Erciyas E., “In the Search for new Anticancer Drugs: 28. Synthesis and Evaluation of Highly Active Aminoxyl Labeled Amino Acid Derivatives Containing the [N′‐(2‐Chloroethyl)‐N′‐Nitrosoamino]Carbonyl Group,” Journal of Pharmaceutical Sciences 83 (1994): 999–1005. [DOI] [PubMed] [Google Scholar]
- 19. Zakrzewski J., “Reactions of Nitroxides XIII: Synthesis of the Morita–Baylis–Hillman Adducts Bearing a Nitroxyl Moiety Using 4‐Acryloyloxy‐2,2,6,6‐Tetramethylpiperidine‐1‐Oxyl as a Starting Compound, and DABCO and Quinuclidine as Catalysts,” Beilstein Journal of Organic Chemistry 8 (2012): 1515–1522. [DOI] [PMC free article] [PubMed] [Google Scholar]
- 20. Kavala M., Brezová V., Švorc Ľ., et al., “Synthesis, Physicochemical Properties and Antimicrobial Activity of Mono−/Dinitroxyl Amides,” Organic & Biomolecular Chemistry 12 (2014): 4491–4502. [DOI] [PubMed] [Google Scholar]
- 21. Kavala M., Brezová V., Švorc Ľ., et al., “Synthesis, Physicochemical Properties and Antimicrobial Activity of Mono−/Dinitroxyl Amides,” Angewandte Chemie, International Edition 60 (2021): 22230–22235.34387410 [Google Scholar]
- 22. Zhuang J.‐L., Liu X.‐Y., Zhang Y., et al., “Zr‐Metal–Organic Frameworks Featuring TEMPO Radicals: Synergistic Effect Between TEMPO and Hydrophilic Zr‐Node Defects Boosting Aerobic Oxidation of Alcohols,” ACS Applied Materials & Interfaces 11 (2019): 3034–3043. [DOI] [PubMed] [Google Scholar]
- 23. Bobbitt J. M., Eddy N. A., Cady C. X., et al., “Preparation of Some Homologous TEMPO Nitroxides and Oxoammonium Salts; Notes on the NMR Spectroscopy of Nitroxide Free Radicals; Observed Radical Nature of Oxoammonium Salt Solutions Containing Trace Amounts of Corresponding Nitroxides in an Equilibrium Relationship,” Journal of Organic Chemistry 82 (2017): 9279–9290. [DOI] [PubMed] [Google Scholar]
- 24. Barber M., Bordoli R., Sedgwick R., and Tyler A. N., “Fast Atom Bombardment of Solids as an ion Source in Mass Spectrometry,” Nature 293 (1981): 270–275. [Google Scholar]
- 25. Barber M., Bordoli R., Sedgwick R., and Tyler A. N., “Fast Atom Bombardment of Solids (F.A.B.): A new ion Source for Mass Spectrometry,” Journal of the Chemical Society, Chemical Communications (1981): 325–327. [Google Scholar]
- 26. Takayama M., “Fast Atom Bombardment Mass Spectrometry: Matrix Effects on ion Formation and Fragmentation,” Journal of the Mass Spectrometry Society of Japan 42 (1994): 249–275. [Google Scholar]
- 27. Yang H., Chen J.‐Q., Li J., Lv Y., and Gao S., “The Effect of TEMPO in the Hydroxylation of Benzene to Phenol on the [(CH3)4N]4PMo11VO40/Ascorbic Acid/TEMPO/O2 Catalytic System: Formation of Ascorbic Acid Radicals Through Hydrogen Exchange of Ascorbic Acid and TEMPO,” Applied Catalysis A: General 415–416 (2012): 22–28. [Google Scholar]
- 28. Shibuya M., Tomizawa M., Suzuki I., and Iwabuchi Y., “2‐Azaadamantane N‐Oxyl (AZADO) and 1‐Me‐AZADO: Highly Efficient Organocatalysts for Oxidation of Alcohols,” Journal of the American Chemical Society 128 (2006): 8412–8413. [DOI] [PubMed] [Google Scholar]
- 29. Cody R. B., Laramée J. A., and Durst H. D., “Versatile new ion Source for the Analysis of Materials in Open air Under Ambient Conditions,” Analytical Chemistry 77 (2005): 2297–2302. [DOI] [PubMed] [Google Scholar]
- 30. Gross J. H., “Direct Analysis in Real Time—A Critical Review on DART‐MS,” Analytical and Bioanalytical Chemistry 406 (2014): 63–80. [DOI] [PubMed] [Google Scholar]
- 31. Yamashita M. and Fenn J. B., “Electrospray ion Source. Another Variation on the Free‐Jet Theme,” Journal of Physical Chemistry 88 (1984): 4451–4459. [Google Scholar]
- 32. Fenn J. B., Mann M., Meng C. K., Wong S. F., and Whitehouse C. M., “Electrospray Ionization–Principles and Practice,” Mass Spectrometry Reviews 9 (1990): 37–70. [Google Scholar]
- 33. Carroll D. I., Dzidic I., Stillwell R. N., Haegele K. D., and Horning E. C., “Atmospheric Pressure Ionization Mass Spectrometry. Corona Discharge ion Source for use in a Liquid Chromatograph‐Mass Spectrometer‐Computer Analytical System,” Analytical Chemistry 47 (1975): 2369–2373. [Google Scholar]
- 34. Robb D. B., Covey T. R., and Bruins A. P., “Atmospheric Pressure Photoionization: An Ionization Method for Liquid Chromatography−Mass Spectrometry,” Analytical Chemistry 72 (2000): 3653–3659. [DOI] [PubMed] [Google Scholar]
- 35. Tanaka K., Waki H., Ido Y., et al., “Protein and Polymer Analyses up to m/z 100 000 by Laser Ionization Time‐Of‐Flight Mass Spectrometry,” Rapid Communications in Mass Spectrometry 2 (1988): 151–153. [Google Scholar]
Associated Data
This section collects any data citations, data availability statements, or supplementary materials included in this article.
Supplementary Materials
Scheme S1 Synthesis of bis‐cholesterol TEMPO derivative 4.
Scheme S2 A plausible ionization mechanism of TEMPO derivative 2.
Scheme S3 A plausible ionization mechanism of TEMPO derivative 4.
Figure S1 Theoretical isotopic patterns of compounds 1–6 by Bruker Compass DataAnalysis software.
Figure S2 FAB mass spectra of TEMPO derivative 1 by JMS‐700 using a highly concentrated sample in NBA (30 mg/mL).
Figure S3 Scan‐related change in the peak intensity of TEMPO 1 by FAB‐MS (JMS‐700) under a highly concentrated sample in NBA (30 mg/mL).
Figure S4 FAB mass spectra of TEMPO derivative 1 by JMS‐700 using a dilute sample in NBA (5 mg/mL).
Figure S5 FAB mass spectra of TEMPO derivative 1 by JMS‐700 using varying concentrations in NBA (2 scans).
Figure S6 FAB mass spectra of TEMPO derivative 1 by JMS‐700 using a highly concentrated sample in glycerol (30 mg/mL).
Figure S7 FAB mass spectra of TEMPO derivative 2 by JMS‐700 using a dilute sample in NBA (5 mg/mL).
Figure S8 FAB mass spectra of TEMPO derivative 3 by JMS‐700 using a dilute sample in NBA (5 mg/mL).
Figure S9 FAB mass spectrum of TEMPO derivative 4 by JMS‐700 using a dilute sample in NBA (5 mg/mL).
Figure S10 FAB mass spectrum of 2‐hydroxy‐2‐azaadamantane (5) by JMS‐700 using a dilute sample in NBA (5 mg/mL).
Figure S11 FAB mass spectrum of N‐(1‐hydroxy‐2,2,6,6‐tetramethyl‐4‐piperidinyl)dodecanamide (6) formed from TEMPO derivative 1 and L‐ascorbic acid (7) in NBA and MeOH by JMS‐700.
Figure S12 EI mass spectrum of TEMPO derivative 1 in AcOEt by JMS‐T100GCV.
Figure S13 EI mass spectrum of TEMPO derivative 2 in AcOEt by JMS‐T100GCV.
Figure S14 EI mass spectrum of TEMPO derivative 3 in AcOEt by JMS‐T100GCV.
Figure S15 EI mass spectrum of TEMPO derivative 4 in AcOEt by JMS‐T100GCV. The molecular ion of TEMPO derivative 4 was not observed.
Figure S16 EI mass spectrum of 2‐hydroxy‐2‐azaadamantane (5) in AcOEt by JMS‐T100GCV.
Figure S17 EI mass spectrum of N‐(1‐hydroxy‐2,2,6,6‐tetramethyl‐4‐piperidinyl)dodecanamide (6) formed from TEMPO derivative 1 and L‐ascorbic acid (7) in AcOEt and MeOH by JMS‐T100GCV.
Figure S18 DART mass spectrum of TEMPO derivative 1 in AcOEt by JMS‐T100TD.
Figure S19 DART mass spectrum of TEMPO derivative 2 in AcOEt by JMS‐T100TD.
Figure S20 DART mass spectrum of TEMPO derivative 3 in AcOEt by JMS‐T100TD.
Figure S21 DART mass spectrum of TEMPO derivative 4 in AcOEt by JMS‐T100TD. The molecular ion of TEMPO derivative 4 was not observed.
Figure S22 DART mass spectrum of 2‐hydroxy‐2‐azaadamantane (5) in AcOEt by JMS‐T100TD.
Figure S23 DART mass spectrum of N‐(1‐hydroxy‐2,2,6,6‐tetramethyl‐4‐piperidinyl)dodecanamide (6) formed from TEMPO derivative 1 and L‐ascorbic acid (7) in AcOEt and MeOH by JMS‐T100TD.
Figure S24 ESI mass spectra of TEMPO derivative 1 in AcOEt by a compact system.
Figure S25 ESI mass spectra of TEMPO derivative 2 in AcOEt by a compact system.
Figure S26 ESI mass spectra of TEMPO derivative 3 in AcOEt by a compact system.
Figure S27 ESI mass spectrum of TEMPO derivative 4 in AcOEt by a compact system.
Figure S28 ESI mass spectrum of 2‐hydroxy‐2‐azaadamantane (5) in AcOEt by a compact system.
Figure S29 APCI mass spectra of TEMPO derivative 1 in AcOEt by a compact system.
Figure S30 APCI mass spectra of TEMPO derivative 2 in AcOEt by a compact system.
Figure S31 APCI mass spectra of TEMPO derivative 3 in AcOEt by a compact system.
Figure S32 APCI mass spectra of TEMPO derivative 4 in AcOEt by a compact system.
Figure S33 APCI mass spectrum of 2‐hydroxy‐2‐azaadamantane (5) in AcOEt by a compact system.
Figure S34 APPI mass spectra of TEMPO derivative 1 in AcOEt by a compact system.
Figure S35 APPI mass spectra of TEMPO derivative 2 in AcOEt by a compact system.
Figure S36 APPI mass spectra of TEMPO derivative 3 in AcOEt by a compact system.
Figure S37 APPI mass spectra of TEMPO derivative 4 in AcOEt by a compact system.
Figure S38 APPI mass spectrum of 2‐hydroxy‐2‐azaadamantane (5) in AcOEt by a compact system.
Figure S39 MALDI mass spectrum of TEMPO derivative 1 with 2,5‐DHB by ultrafleXtreme.
Figure S40 MALDI mass spectrum of TEMPO derivative 2 with 2,5‐DHB by ultrafleXtreme.
Figure S41 MALDI mass spectrum of TEMPO derivative 3 with 2,5‐DHB by ultrafleXtreme.
Figure S42 MALDI mass spectrum of TEMPO derivative 4 with 2,5‐DHB by ultrafleXtreme.
Figure S43 MALDI mass spectrum of 2‐hydroxy‐2‐azaadamantane (5) with 2,5‐DHB by ultrafleXtreme.
Table S1 Significant ions observed in various mass spectra of TEMPO derivatives 1–4 and hydroxylamines 5 and 6.
Figure S44 ESR spectrum of TEMPO derivative 1 in toluene (14 × 10−6 mol/L) by JES‐TE200.
Figure S45 ESR spectrum of TEMPO derivative 2 in toluene (15 × 10−6 mol/L) by JES‐TE200.
Figure S46 ESR spectrum of TEMPO derivative 3 in toluene (19 × 10−6 mol/L) by JES‐TE200.
Figure S47 ESR spectrum of TEMPO derivative 4 in toluene (9 × 10⁻⁶ mol/L) by JES‐TE200.
Data Availability Statement
The data that support the findings of this study are available from the corresponding author upon reasonable request.