

Abstract
Objective
C-reactive protein-triglyceride-glucose index (CTI) has been proposed as a novel biomarker for insulin resistance and inflammation. However, the association between CTI and the risk of stroke, particularly in individuals with different glycemic status, remains unclear.
Methods
A total of 10,443 middle-aged and elderly participants were enrolled from the China Health and Retirement Longitudinal Study (CHARLS). The primary endpoint was the occurrence of stroke events. The CTI was calculated using the formula 0.412* Ln (CRP [mg/L]) + Ln (TG [mg/dl] × FPG [mg/dl])/2. The Kaplan–Meier curves, Cox proportional hazard models, and restricted cubic spline analysis were applied to explore the association between CTI and the risk of stroke according to gender, age and glycemic status.
Results
During a median follow-up of 9 years, 960 (9.2%) participants experienced a stroke. Our findings revealed a significant positive linear relationship between CTI and the occurrence of stroke. The association was similar between male and female, despite the HR tended to be higher in females (HR 1.22, 95% CI 1.09, 1.36) than males (HR 1.15, 95% CI 1.02, 1.29), and similar in middle-aged (HR 1.25, 95% CI 1.11, 1.41) and elderly participants (HR 1.12, 95% CI 1.00, 1.26). In different glycemic status, high levels of CTI were found to be linked to an increased risk of stroke in individuals with normal glucose regulation (NGR) (HR 1.33, 95% CI 1.11, 1.59) and prediabetes mellitus (Pre-DM) (HR 1.20, 95% CI 1.04, 1.39). However, this association was not observed in individuals with diabetes mellitus (DM).
Conclusions
Our findings revealed a significant positive linear relationship between CTI and the occurrence of stroke. The association between CTI and stroke was similar between male and female, and similar in middle-aged and elderly participants. In different glycemic status, the association was significant in individuals with NGR and Pre-DM.
Graphical abstract

Supplementary Information
The online version contains supplementary material available at 10.1186/s12933-025-02686-9.
Keywords: Inflammation, Insulin resistance, C-reactive protein-triglyceride glucose index, Stroke, CHARLS
What is currently known about this topic?
CTI has been proposed as a novel biomarker for insulin resistance and inflammation.
What is the key research question?
What is the relationship between CTI and stroke risk under different genders, ages, and glycemic status?
What is new?
This is the first large-scale study to demonstrate this relationship between the CTI and stroke risk, and assessed this relationship according to gender, ages and glycemic status.
How might this study influence clinical practice?
Our research findings demonstrate a significant positive linear relationship between CTI and the incidence of stroke. To reduce the risk of stroke, different strategies must be adopted to manage CTI levels based on gender, age, and glycemic status.
Supplementary Information
The online version contains supplementary material available at 10.1186/s12933-025-02686-9.
Introduction
Stroke remains a leading cause of mortality and long-term disability on a global scale, placing a significant burden on public health systems [1, 2]. The risk of stroke in the Chinese population ranks first in the world, with over 2 million new cases annually [3]. Despite advances in prevention and treatment, stroke incidence continues to rise [4, 5]. According to recent data covering the period from 2010 to 2017, the prevalence of stroke has increased by 19.3%, and about 7 to 18% of strokes are related to carotid atherosclerosis [6–8]. Therefore, identifying modifiable risk factors and executing effective preventive measures are crucial for primary stroke prevention.
Insulin resistance refers to the weakening of the physiological effect of insulin in the body, which is a common pathological mechanism of a variety of metabolic related diseases, and is closely related to the occurrence and development of atherosclerosis [9–11]. Insulin resistance can lead to atherosclerosis and stroke by promoting inflammation, oxidative stress and damaging endothelial cell function [12–14]. The triglyceride glucose (TyG) index was first proposed in 2008, as a reliable biomarker of insulin resistance, it has been widely used in clinic [15, 16]. More and more evidence indicated that there is a significant correlation between TyG index and atherosclerosis, stroke and the poor prognosis of cardiovascular disease [17–20]. In addition, inflammation is also considered to be an extremely important risk factor for stroke [21]. Inflammation can significantly increase the occurrence of stroke by promoting atherosclerosis, damaging vascular endothelial function and increasing thrombosis [22, 23]. C-reactive protein (CRP), as a non-specific inflammatory marker, is closely related to the risk of stroke and has become a promising biomarker for stroke risk assessment [24, 25]. Atherosclerosis is the key risk factor of stroke, and insulin resistance and vascular inflammation are the key driving factors of its pathogenesis [26, 27]. Therefore, it is very important to develop a comprehensive index reflecting insulin resistance and inflammation as a tool for predicting stroke. C-reactive protein-triglyceride glucose index (CTI) was first proposed by Ruan et al. [28], which comprehensively reflected inflammation and IR, and then it was widely used in clinical research. CTI has demonstrated strong predictive value for the prognosis of patients experiencing cancer cachexia, cancer mortality in the general population, and the incidence of coronary heart disease [29–31]. However, the association between CTI and the risk of stroke, particularly in individuals with different glycemic status, remains unclear.
To address these critical research gaps, we analyzed the data of the China Health and Retirement Longitudinal Study (CHARLS), aiming to explore the complex relationship between CTI and the risk of stroke under different glucose metabolic states, and provide more evidence for the practical application of CTI in the real world.
Methods
Study design
The data for this study is derived from the CHARLS, a national longitudinal survey employing a multi-level stratified sampling method. The first national baseline survey (Wave 1) was conducted in 2011, gathering information from 17,708 middle-aged and elderly participants across 28 provinces, 150 regions, and 450 villages in China. Standardized questionnaires were utilized to gather essential information from all participants. Subsequently, follow-up visits will be conducted every 2–3 years to monitor their health status. We did not conduct any interviews for this analysis. To date, five waves of surveys have been completed, conducted in 2011, 2013, 2015, 2018, and 2020, and we used the data from these five Waves. The research methods and data collection procedures for the implementation of CHARLS have been recorded in detail in the literature [32].The Ethics Committee of Peking University approved the CHARLS study, and all participants signed informed consent forms.
Study population
The participant screening process for this study is illustrated in Fig. 1. Initially, the dataset comprised 17,708 participants identified during Wave 1, which served as the baseline. We excluded 6072 participants due to missing information regarding CRP at baseline. Additionally, 28 participants were removed for not providing data on fasting plasma glucose (FPG) and triglycerides (TG) in Wave 1. Furthermore, 104 participants were excluded due to the unavailability of hemoglobin A1c (HbA1c) data in Wave 1. Moreover, 357 participants were removed for not disclosing their age or for being under the age of 45 in Wave 1. Lastly, 732 participants were excluded due to a history of stroke, missing stroke data, or loss to follow-up. Consequently, a total of 7265 participants were excluded, resulting in 10,443 participants remaining in the final cohort of this study.
Fig. 1.

Flow chart of the study population
Calculation of CTI
The CTI index was obtained by using the following formula [28]: CTI = 0.412 × Ln (CRP [mg/L]) + Ln (TG [mg/dl] × FPG [mg/dl])/2.
Assessment of incident stroke
The primary objective of this study was to evaluate the incidence of stroke, which was assessed by asking the critical question: “Have you ever been diagnosed with a stroke by a physician?” The stroke onset period was defined as the interval between the last interview and the one in which the stroke was first recorded [33, 34].
Assessments of covariates
The baseline data for the participants was meticulously collected by trained interviewers using structured questionnaires. (1): Demographic and lifestyle data: This section includes gender, age, residence, education level, marital status, smoking status, and drinking status. (2) Body measurements: The measurements recorded consist of height, weight, body mass index (BMI), as well as systolic and diastolic blood pressure (SBP and DBP). (3) Information on Disease and medication history: This encompasses information regarding existing conditions such as heart disease, hypertension, diabetes, and dyslipidemia, along with details about medications taken for hypertension, dyslipidemia, and diabetes. (4) Laboratory test data: The laboratory data collected includes FPG, total cholesterol (TC), TG, high-density lipoprotein cholesterol (HDL-C), low-density lipoprotein cholesterol (LDL-C), and HbA1c.
Definitions
Hypertension was defined by meeting one of the following criteria: (1) SBP ≥ 140 mmHg, (2) DBP ≥ 90 mmHg, (3) self-reported hypertension diagnosed by a physician, (4) taking antihypertensive medications. DM was defined by meeting at least one of the following criteria: (1) FPG ≥ 126 mg/dL, or (2) HbA1c ≥ 6.5%, (3) and/or current use of antidiabetic medications, (4) and/or self-reported diabetes diagnosed by a doctor. Pre-DM was characterized by an FPG of 100 to 125 mg/dL or an HbA1c of 5.7–6.4%. NGR was defined as FPG < 100 mg/dL and HbA1c < 5.7% [35]. Dyslipidemia was identified by TG ≥ 150 mg/dL, TC ≥ 240 mg/dL, HDL-C < 40 mg/dL, LDL-C ≥ 160 mg/dL, current use of lipid-lowering drugs, or self-reported dyslipidemia diagnosed by a physician.
Statistical analysis
The extent of missing data in this study is detailed in Table S1. To address the issue of missing values and mitigate potential bias, we utilized multiple imputations. For quantitative variables that follow a normal distribution, results are presented as means and standard errors. Differences between groups are assessed using analysis of variance (ANOVA). For quantitative variables that do not conform to a normal distribution, we provide the median and interquartile range, evaluating differences among groups with the Kruskal–Wallis test. Categorical variables are described using counts and percentages, with statistical evaluations conducted using the Chi-square test.
Participants were stratified into four groups according to the quartiles of the CTI. Quartile (Q)1 ≤ 8.16; 8.16 < Q2 ≤ 8.68; 8.68 < Q3 ≤ 9.27; Q4 > 9.27. The CTI was also assessed as a continuous variable to enhance the robustness of the findings. Kaplan–Meier curves and log-rank tests were employed to evaluate the incidence of stroke. To investigate potential collinearity between the CTI and other covariates, tolerance values and variance inflation factors (VIFs) were examined. The analysis indicated that the VIFs for TC (VIF = 15.70) and LDL-C (VIF = 13.37) exceeded a value of 5, which led to their exclusion from the multivariate model (Table S2). The association between the CTI and stroke incidence was investigated using Cox regression models. Three distinct models were developed to facilitate a comprehensive analysis: Model 1 was unadjusted; Model 2 included adjustments for gender, age, residence, marital status, education level, smoking status, and drinking status; and Model 3 contained additional adjustments for hypertension, dyslipidemia, heart disease, hypertension medications, dyslipidemia medications, BMI, SBP and DBP. Additionally, a fully adjusted restricted cubic splines (RCS) analysis was performed to explore the dose–response relationship between the CTI and the risk of stroke. The receiver operating characteristics (ROC) curves were established to assess the predictive value of CTI, CRP and TyG index on the incidence of stroke. The area under the ROC curve (AUC) was used to evaluate the incremental effect of CTI. Furthermore, we also assessed the relationship between the CTI and stroke risk across different genders, ages, and glycemic statuses (categorized as NGR, Pre-DM, and DM).
Subgroup analyses were conducted to evaluate whether the impact of the CTI on the incidence of stroke varied among different demographic groups. These analyses were stratified by several factors, including gender, age (45–60 years and ≥ 60 years), smoking status, drinking status, hypertension, dyslipidemia, and BMI (BMI categorized as follows: < 24, 24–28, and ≥ 28 kg/m2). To enhance the reliability of our findings, we carried out four robust sensitivity analyses. Firstly, we reanalyzed the dataset after removing all missing values. Secondly, non-fasting participants were excluded from the dataset before conducting further analyses. Thirdly, we removed all deceased participants and conducted a reanalysis. Fourthly, we conducted piecewise Cox regression model to explore the relationship between CTI and stroke risk. Fifthly, we also used Logistic regression model to explore the relationship between CTI and stroke incidence. Finally, we calculated the E-value to quantify the minimum strength of association that an unmeasured confounder would require with both CTI and stroke risk to explain away the observed associations. The calculation method of E-value was as follows: E = RR + sqrt{RR × (RR−1)} [36]. All statistical analyses were conducted using R version 4.2.2, with P < 0.05, which was considered statistically significant.
Results
Population characteristics
The study included 10,443 participants from the CHARLS. The average age of participants was 59.13 ± 9.31 years, and 4892 (46.8%) were male. Among them, there were 4122 (39.5%) patients with NGR, 4636 (44.4%) patients with Pre-DM, and 1685 (16.1%) patients with DM. Additionally, individuals with higher quartiles of the CTI were more likely female, urban residents, never smokers, and tended to have hypertension, diabetes, dyslipidemia and heart disease than those with lower quartiles of the CTI. For body measurements and laboratory test, higher CTI quartiles were associated with increased Weight, BMI, SBP, DBP, FPG, TC, and TG. In contrast, higher quartiles of the CTI were associated with lower levels of HDL-C. The demographic and clinical characteristics of all patients were shown in Table 1. A comparison of baseline characteristics between participants included and those who were not excluded in the analysis was shown in Table S3.
Table 1.
Patient demographics and baseline characteristics
| Characteristic | CTI quartiles | p | ||||
|---|---|---|---|---|---|---|
| Overall | Q1 | Q2 | Q3 | Q4 | ||
| No. of subjects | 10,443 | 2,610 | 2,611 | 2,612 | 2,610 | |
| Gender | < 0.001 | |||||
| Male | 4,892 (46.8%) | 1,308 (50.1%) | 1,254 (48.0%) | 1,177 (45.1%) | 1,153 (44.2%) | |
| Female | 5,551 (53.2%) | 1,302 (49.9%) | 1,357 (52.0%) | 1,435 (54.9%) | 1,457 (55.8%) | |
| Age, year | 59.13 ± 9.31 | 58.01 ± 9.18 | 59.36 ± 9.37 | 59.69 ± 9.33 | 59.48 ± 9.26 | < 0.001 |
| Residence | < 0.001 | |||||
| Rural | 6,710 (64.3%) | 1,813 (69.5%) | 1,762 (67.5%) | 1,618 (61.9%) | 1,517 (58.1%) | |
| Urban | 3,733 (35.7%) | 797 (30.5%) | 849 (32.5%) | 994 (38.1%) | 1,093 (41.9%) | |
| Marital status | 0.227 | |||||
| Marred | 9,208 (88.2%) | 2,319 (88.9%) | 2,311 (88.5%) | 2,275 (87.1%) | 2,303 (88.2%) | |
| Other | 1,235 (11.8%) | 291 (11.1%) | 300 (11.5%) | 337 (12.9%) | 307 (11.8%) | |
| Education level | 0.297 | |||||
| No formal education | 4,949 (47.4%) | 1,224 (46.9%) | 1,272 (48.7%) | 1,250 (47.9%) | 1,203 (46.1%) | |
| Primary school | 2,249 (21.5%) | 571 (21.9%) | 583 (22.3%) | 538 (20.6%) | 557 (21.3%) | |
| Middle school | 2,123 (20.3%) | 542 (20.8%) | 488 (18.7%) | 538 (20.6%) | 555 (21.3%) | |
| High school or above | 1,122 (10.7%) | 273 (10.5%) | 268 (10.3%) | 286 (10.9%) | 295 (11.3%) | |
| Smoking status | < 0.001 | |||||
| Never | 6,550 (62.7%) | 1,608 (61.6%) | 1,622 (62.1%) | 1,654 (63.3%) | 1,666 (63.8%) | |
| Former | 855 (8.2%) | 181 (6.9%) | 209 (8.0%) | 217 (8.3%) | 248 (9.5%) | |
| Current | 3,038 (29.1%) | 821 (31.5%) | 780 (29.9%) | 741 (28.4%) | 696 (26.7%) | |
| Drinking status | 0.002 | |||||
| Never | 6,383 (61.1%) | 1,521 (58.3%) | 1,583 (60.6%) | 1,649 (63.1%) | 1,630 (62.5%) | |
| Former | 834 (8.0%) | 199 (7.6%) | 215 (8.2%) | 211 (8.1%) | 209 (8.0%) | |
| Current | 3,226 (30.9%) | 890 (34.1%) | 813 (31.1%) | 752 (28.8%) | 771 (29.5%) | |
| Hypertension | 5,150 (49.3%) | 1,011 (38.7%) | 1,182 (45.3%) | 1,362 (52.1%) | 1,595 (61.1%) | < 0.001 |
| Diabetes | 1,685 (16.1%) | 114 (4.4%) | 213 (8.2%) | 391 (15.0%) | 967 (37.0%) | < 0.001 |
| Dyslipidemia | 5,056 (48.4%) | 471 (18.0%) | 860 (32.9%) | 1,497 (57.3%) | 2,228 (85.4%) | < 0.001 |
| Heart disease | 1,261 (12.1%) | 236 (9.0%) | 262 (10.0%) | 337 (12.9%) | 426 (16.3%) | < 0.001 |
| Hypertension medications | 2,007 (19.2%) | 301 (11.5%) | 371 (14.2%) | 584 (22.4%) | 751 (28.8%) | < 0.001 |
| Diabetes medications | 400 (3.8%) | 32 (1.2%) | 52 (2.0%) | 81 (3.1%) | 235 (9.0%) | < 0.001 |
| Dyslipidemia medications | 507 (4.9%) | 54 (2.1%) | 88 (3.4%) | 132 (5.1%) | 233 (8.9%) | < 0.001 |
| Height, m | 1.58 ± 0.09 | 1.58 ± 0.08 | 1.58 ± 0.09 | 1.58 ± 0.09 | 1.58 ± 0.08 | 0.019 |
| Weight, kg | 58.93 ± 11.01 | 55.47 ± 9.63 | 57.22 ± 10.14 | 59.95 ± 11.09 | 63.09 ± 11.53 | < 0.001 |
| BMI, kg/m2 | 23.45 (21.19, 25.71) | 22.03 (20.20, 23.74) | 22.96 (20.85, 24.83) | 24.16 (21.86, 26.14) | 25.20 (22.85, 27.48) | < 0.001 |
| SBP, mmhg | 130.43 ± 19.87 | 125.79 ± 19.01 | 128.68 ± 19.22 | 132.01 ± 19.84 | 135.24 ± 20.12 | < 0.001 |
| DBP, mmhg | 75.80 ± 11.23 | 73.48 ± 11.10 | 74.75 ± 11.04 | 76.68 ± 11.05 | 78.30 ± 11.12 | < 0.001 |
| CRP, mg/dl | 1.03 (0.55, 2.15) | 0.48 (0.34, 0.74) | 0.82 (0.53, 1.39) | 1.34 (0.79, 2.43) | 2.55 (1.34, 5.49) | < 0.001 |
| FPG, mg/dl | 102.42 (94.50, 113.40) | 96.12 (89.10, 103.50) | 100.26 (93.42, 107.64) | 103.50 (96.12, 113.04) | 114.66 (102.96, 139.14) | < 0.001 |
| TC, mg/dl | 193.45 ± 38.70 | 182.34 ± 33.62 | 190.20 ± 34.93 | 195.15 ± 37.18 | 206.10 ± 44.31 | < 0.001 |
| TG, mg/dl | 106.20 (75.22, 155.76) | 66.38 (53.99, 80.54) | 96.46 (77.88, 115.93) | 127.44 (100.00, 157.53) | 199.13 (143.37, 277.89) | < 0.001 |
| HDL-C, mg/dl | 51.11 ± 15.37 | 60.22 ± 15.02 | 54.09 ± 13.69 | 48.94 ± 13.24 | 41.20 ± 12.72 | < 0.001 |
| LDL-C, mg/dl | 116.07 ± 35.43 | 110.63 ± 29.24 | 118.43 ± 31.85 | 121.17 ± 34.42 | 114.05 ± 43.64 | < 0.001 |
| HbA1c, % | 5.10 (4.90, 5.40) | 5.00 (4.80, 5.30) | 5.10 (4.90, 5.30) | 5.10 (4.90, 5.40) | 5.30 (5.00, 5.80) | < 0.001 |
| GMS | < 0.001 | |||||
| NGR | 4,122 (39.5%) | 1,572 (60.2%) | 1,215 (46.5%) | 896 (34.3%) | 439 (16.8%) | |
| Pre-DM | 4,636 (44.4%) | 924 (35.4%) | 1,183 (45.3%) | 1,325 (50.7%) | 1,204 (46.1%) | |
| DM | 1,685 (16.1%) | 114 (4.4%) | 213 (8.2%) | 391 (15.0%) | 967 (37.0%) | |
Association between the CTI and the risk of stroke
During an average follow-up period of 9 years, 960 (9.2%) participants experienced their first stroke. The incidence of stroke increased progressively from Q1 to Q4, with 156 (6.0%) in Q1, 208 (8.0%) in Q2, 275 (10.5%) in Q3, and 321 (12.3%) in Q4, respectively. Analysis of the Kaplan–Meier cumulative incidence curve revealed a gradual increase in stroke events from the Q1 to Q4 groups, with statistically significant difference observed (log-rank test P < 0.001, Fig. 2A). The association between CTI and incident stroke was explored using Cox proportional hazards regression models. After adjust the potential confounding variables (Model 3), per 1-unit increase in CTI was associated with a 19% higher risk of stroke (HR 1.19, 95% CI 1.09, 1.29), which was higher than the 1% increased risk for CRP (HR 1.01, 95% CI 1.00, 1.02) and higher than the 17% increased risk for TyG index (HR 1.17, 95% CI 1.05, 1.30) (Table 2) (Table S4) Additionally, compared to Q1, stroke risk increased with higher CTI levels, with HRs of 1.24 (95% CI 1.00, 1.53), 1.48 (95% CI 1.20, 1.82), and 1.55 (95% CI 1.25, 1.92) for Q2, Q3, and Q4, respectively (Table 2). Furthermore, the RCS analysis revealed a significant positive linear relationship between CTI and the occurrence of stroke events in total participants (Fig. 3A). The highest quartile HR were 1.30 for CRP (HR 1.30, 95% CI 1.08, 1.57) and 1.43 for TyG index (HR 1.43, 95% CI 1.14, 1.79), both lower than CTI’s highest quartile HR of 1.55 (HR 1.55, 95% CI 1.25, 1.92) (Table S4). The ROC curves indicated that baseline CTI had the highest diagnostic efficacy of stroke incidence (AUC 0.587, 95% CI 0.569, 0.606), followed by CRP (AUC: 0.565, 95% CI 0.547, 0.584), and TyG index (AUC: 0.567, 95% CI 0.549, 0.586) (Fig. S1). These findings suggest that CTI may be a more effective predictor for stroke risk stratification than CRP and TyG index. Further research suggests that higher cumulative CTI levels are associated with higher stroke incidence (Fig. S2) (Table S5).
Fig. 2.

The Kaplan–Meier curves analysis depict the cumulative incidence of stroke across the CTI index quartiles. A total participants; B participants with NGR; C participants with Pre-DM, D and participants with DM
Table 2.
Association between the CTI and stroke incidence
| Characteristic | Event, n | Model 1 | Model 2 | Model 3 | ||||||
|---|---|---|---|---|---|---|---|---|---|---|
| HR | 95%CI | p | HR | 95%CI | p | HR | 95%CI | p | ||
| CTI (per 1 unit) | 960 | 1.36 | 1.27, 1.46 | < 0.001 | 1.35 | 1.26, 1.45 | < 0.001 | 1.19 | 1.09, 1.29 | < 0.001 |
| CTI quartile | ||||||||||
| Q1 | 156 | Ref | Ref | Ref | ||||||
| Q2 | 208 | 1.34 | 1.09, 1.65 | 0.005 | 1.30 | 1.06, 1.61 | 0.012 | 1.24 | 1.00, 1.53 | 0.046 |
| Q3 | 275 | 1.80 | 1.48, 2.19 | < 0.001 | 1.75 | 1.44, 2.13 | < 0.001 | 1.48 | 1.20, 1.82 | < 0.001 |
| Q4 | 321 | 2.14 | 1.76, 2.59 | < 0.001 | 2.08 | 1.71, 2.52 | < 0.001 | 1.55 | 1.25, 1.92 | < 0.001 |
| P for trend | < 0.001 | < 0.001 | < 0.001 | |||||||
HR Hazard Ratio, CI Confidence Interval
Model 1: unadjusted for any covariates
Model 2: adjusted for gender, age, residence, marital status, education level, smoking status, and drinking status
Model 3: adjusted for gender, age, residence, marital status, education level, smoking status, drinking status, hypertension, dyslipidemia, heart disease, hypertension medications, dyslipidemia medications, SBP, DBP, and BMI
Fig. 3.

Association of the CTI index and the risk of stroke according to gender. A total participants; B male; C female. Adjusted for gender, age, residence, marital status, education level, smoking status, drinking status, hypertension, dyslipidemia, heart disease, hypertension medications, dyslipidemia medications, SBP, DBP, and BMI
Regardless of gender, this relationship remained statistically significant after adjusting for variables. As shown in Table 3, the HR tended to be higher in females (HR 1.22, 95% CI 1.09, 1.36) than males (HR 1.15, 95% CI 1.02, 1.29). Interaction analysis showed that there was no interaction between CTI and stroke in group of gender (P for interaction = 0.617). Therefore, the association between CTI and stroke was similar between male and female. Moreover, the RCS analysis revealed a significant linear relationship between CTI and the occurrence of stroke events both in males and females (Fig. 3B and C).
Table 3.
Association between the CTI and stroke incidence according to gender
| Gender | Characteristic | Event, n | Model 1 | Model 2 | Model 3 | ||||||
|---|---|---|---|---|---|---|---|---|---|---|---|
| HR | 95%CI | p | HR | 95%CI | p | HR | 95%CI | p | |||
| Male | CTI (per 1 unit) | 463 | 1.35 | 1.22, 1.48 | < 0.001 | 1.36 | 1.23, 1.50 | < 0.001 | 1.15 | 1.02, 1.29 | 0.019 |
| Q1 | 76 | Ref | Ref | Ref | |||||||
| Q2 | 106 | 1.41 | 1.05, 1.89 | 0.022 | 1.38 | 1.03, 1.86 | 0.031 | 1.28 | 0.95, 1.72 | 0.105 | |
| Q3 | 127 | 1.70 | 1.28, 2.26 | < 0.001 | 1.66 | 1.25, 2.21 | < 0.001 | 1.35 | 1.01, 1.82 | 0.046 | |
| Q4 | 154 | 2.11 | 1.61, 2.78 | < 0.001 | 2.10 | 1.60, 2.77 | < 0.001 | 1.45 | 1.06, 1.97 | 0.019 | |
| P for trend | < 0.001 | < 0.001 | 0.025 | ||||||||
| Female | CTI (per 1 unit) | 497 | 1.38 | 1.25, 1.52 | < 0.001 | 1.33 | 1.21, 1.47 | < 0.001 | 1.22 | 1.09, 1.36 | < 0.001 |
| Q1 | 78 | Ref | Ref | Ref | |||||||
| Q2 | 100 | 1.29 | 0.96, 1.74 | 0.090 | 1.22 | 0.91, 1.64 | 0.193 | 1.19 | 0.88, 1.60 | 0.258 | |
| Q3 | 147 | 1.94 | 1.47, 2.55 | < 0.001 | 1.83 | 1.39, 2.41 | < 0.001 | 1.67 | 1.25, 2.22 | < 0.001 | |
| Q4 | 172 | 2.29 | 1.75, 3.00 | < 0.001 | 2.10 | 1.60, 2.75 | < 0.001 | 1.76 | 1.30, 2.39 | < 0.001 | |
| P for trend | < 0.001 | < 0.001 | < 0.001 | ||||||||
HR Hazard ratio, CI Confidence interval
Model 1: unadjusted for any covariates
Model 2: adjusted for gender, age, residence, marital status, education level, smoking status, and drinking status
Model 3: adjusted for gender, age, residence, marital status, education level, smoking status, drinking status, hypertension, dyslipidemia, heart disease, hypertension medications, dyslipidemia medications, SBP, DBP, and BMI
As shown in Table 4, the CTI was significantly associated with stroke risk at different ages after adjusting for variables. The HR value of middle-aged (45–60 years old) participants (HR 1.25, 95% CI 1.11, 1.41) was higher than that of elderly (> 60 years old) participants (HR 1.12, 95% CI 1.00, 1.26). Interaction analysis showed that there was no interaction between CTI and stroke in group of age (P for interaction = 0.132). Therefore, the association between CTI and stroke was similar between male and female. Moreover, the RCS analysis revealed a significant linear relationship between CTI and the occurrence of stroke events both in middle-aged and elderly participants (Fig. 4A and B). Regardless of gender and age, CTI is related to the increased risk of stroke, and this relationship remains stable even after multi-factor adjustment.
Table 4.
Association between the CTI and stroke incidence according to age
| Age | Characteristic | Event, n | Model 1 | Model 2 | Model 3 | ||||||
|---|---|---|---|---|---|---|---|---|---|---|---|
| HR | 95%CI | p | HR | 95%CI | p | HR | 95%CI | p | |||
| Age 45–60 | CTI (per 1 unit) | 425 | 1.44 | 1.31, 1.59 | < 0.001 | 1.43 | 1.29, 1.58 | < 0.001 | 1.25 | 1.11, 1.41 | < 0.001 |
| Q1 | 66 | Ref | Ref | Ref | |||||||
| Q2 | 84 | 1.28 | 0.93, 1.76 | 0.136 | 1.24 | 0.90, 1.71 | 0.193 | 1.19 | 0.86, 1.65 | 0.286 | |
| Q3 | 120 | 1.85 | 1.37, 2.50 | < 0.001 | 1.79 | 1.33, 2.43 | < 0.001 | 1.54 | 1.12, 2.11 | 0.007 | |
| Q4 | 155 | 2.44 | 1.83, 3.26 | < 0.001 | 2.37 | 1.77, 3.16 | < 0.001 | 1.83 | 1.31, 2.55 | < 0.001 | |
| P for trend | < 0.001 | < 0.001 | < 0.001 | ||||||||
| Age ≥ 60 | CTI (per 1 unit) | 535 | 1.28 | 1.16, 1.40 | < 0.001 | 1.27 | 1.15, 1.40 | < 0.001 | 1.12 | 1.00, 1.26 | 0.041 |
| Q1 | 94 | Ref | Ref | Ref | |||||||
| Q2 | 120 | 1.29 | 0.98, 1.69 | 0.065 | 1.31 | 1.00, 1.71 | 0.053 | 1.23 | 0.94, 1.61 | 0.137 | |
| Q3 | 156 | 1.71 | 1.32, 2.20 | < 0.001 | 1.71 | 1.32, 2.21 | < 0.001 | 1.47 | 1.12, 1.91 | 0.005 | |
| Q4 | 165 | 1.82 | 1.41, 2.34 | < 0.001 | 1.81 | 1.40, 2.34 | < 0.001 | 1.37 | 1.03, 1.83 | 0.028 | |
| P for trend | < 0.001 | < 0.001 | 0.020 | ||||||||
HR Hazard Ratio, CI Confidence Interval
Model 1: unadjusted for any covariates
Model 2: adjusted for gender, age, residence, marital status, education level, smoking status, and drinking status
Model 3: adjusted for gender, age, residence, marital status, education level, smoking status, drinking status, hypertension, dyslipidemia, heart disease, hypertension medications, dyslipidemia medications, SBP, DBP, and BMI
Fig. 4.

Association of the CTI index and the risk of stroke according to age. A age 45–60; B age ≥ 60. Adjusted for gender, age, residence, marital status, education level, smoking status, drinking status, hypertension, dyslipidemia, heart disease, hypertension medications, dyslipidemia medications, SBP, DBP, and BMI
Association between the CTI and stroke risk according to glycemic status
During the follow-up period, 317(7.7%) participants with NGR, 440(9.5%) participants with Pre-DM and 203(12.0%) participants with DM were detected with the first stroke. The Kaplan–Meier curves showed a significant difference in the cumulative incidence of stroke among NGR and Pre-DM and across the four CTI groups (all log-rank test P < 0.001, Fig. 2B and C), while no significant difference was observed for DM (log-rank test P = 0.267, Fig. 2D). As shown in Table 5, the results revealed a significant association between CTI and stroke risk in individuals with NGR and Pre-DM in Model 3. However, no significant difference was found in individuals with DM (all P > 0.05). Specifically, per 1 unit increment in CTI was associated with a 33% increase in the risk of stroke in individuals with NGR (HR 1.33, 95% CI 1.11, 1.59), and per 1 unit increment in CTI was linked with a 20% increase in the risk of stroke in individuals with Pre-DM (HR 1.20, 95% CI 1.04, 1.39). The RCS analysis indicated a significant nonlinear relationship between the CTI and stroke events in individuals with NGR (Fig. 5A), and a significant linear relationship was observer in individuals with Pre-DM (Fig. 5B). Conversely, the analysis did not reveal a significant dose–response correlation between CTI and the risk of stroke in individuals with DM (Fig. 5C).
Table 5.
Association between the CTI and stroke incidence according to glucose regulation state
| GMS | Characteristic | Event, n | Model 1 | Model 2 | Model 3 | ||||||
|---|---|---|---|---|---|---|---|---|---|---|---|
| HR | 95%CI | p | HR | 95%CI | p | HR | 95%CI | p | |||
| NGR | CTI (per 1 unit) | 317 | 1.47 | 1.25, 1.73 | < 0.001 | 1.44 | 1.22, 1.69 | < 0.001 | 1.33 | 1.11, 1.59 | 0.002 |
| Q1 | 53 | Ref | Ref | Ref | |||||||
| Q2 | 60 | 1.14 | 0.79, 1.65 | 0.492 | 1.10 | 0.76, 1.59 | 0.622 | 1.07 | 0.74, 1.55 | 0.722 | |
| Q3 | 95 | 1.84 | 1.31, 2.57 | < 0.001 | 1.76 | 1.25, 2.46 | 0.001 | 1.64 | 1.16, 2.31 | 0.005 | |
| Q4 | 109 | 2.12 | 1.53, 2.95 | < 0.001 | 2.04 | 1.47, 2.84 | < 0.001 | 1.83 | 1.28, 2.61 | < 0.001 | |
| P for trend | < 0.001 | < 0.001 | < 0.001 | ||||||||
| Pre-DM | CTI (per 1 unit) | 440 | 1.39 | 1.23, 1.57 | < 0.001 | 1.40 | 1.23, 1.58 | < 0.001 | 1.20 | 1.04, 1.39 | 0.014 |
| Q1 | 76 | Ref | Ref | Ref | |||||||
| Q2 | 94 | 1.24 | 0.92, 1.68 | 0.161 | 1.23 | 0.91, 1.66 | 0.181 | 1.15 | 0.85, 1.56 | 0.379 | |
| Q3 | 124 | 1.66 | 1.25, 2.21 | < 0.001 | 1.69 | 1.27, 2.26 | < 0.001 | 1.40 | 1.04, 1.90 | 0.028 | |
| Q4 | 146 | 1.99 | 1.51, 2.62 | < 0.001 | 2.00 | 1.51, 2.65 | < 0.001 | 1.50 | 1.10, 2.06 | 0.012 | |
| P for trend | < 0.001 | < 0.001 | 0.006 | ||||||||
| DM | CTI (per 1 unit) | 203 | 1.17 | 1.02, 1.35 | 0.021 | 1.19 | 1.04, 1.37 | 0.013 | 1.08 | 0.92, 1.26 | 0.345 |
| Q1 | 40 | Ref | Ref | Ref | |||||||
| Q2 | 51 | 1.30 | 0.86, 1.97 | 0.212 | 1.27 | 0.84, 1.93 | 0.255 | 1.14 | 0.74, 1.74 | 0.558 | |
| Q3 | 49 | 1.24 | 0.82, 1.89 | 0.309 | 1.23 | 0.81, 1.86 | 0.342 | 1.01 | 0.64, 1.59 | 0.967 | |
| Q4 | 63 | 1.64 | 1.10, 2.43 | 0.015 | 1.71 | 1.14, 2.55 | 0.009 | 1.30 | 0.83, 2.04 | 0.258 | |
| P for trend | 0.023 | 0.014 | 0.328 | ||||||||
HR Hazard Ratio, CI Confidence Interval
Model 1: unadjusted for any covariates
Model 2: adjusted for gender, age, residence, marital status, education level, smoking status, and drinking status
Model 3: adjusted for gender, age, residence, marital status, education level, smoking status, drinking status, hypertension, dyslipidemia, heart disease, hypertension medications, dyslipidemia medications, SBP, DBP, and BMI
Fig. 5.
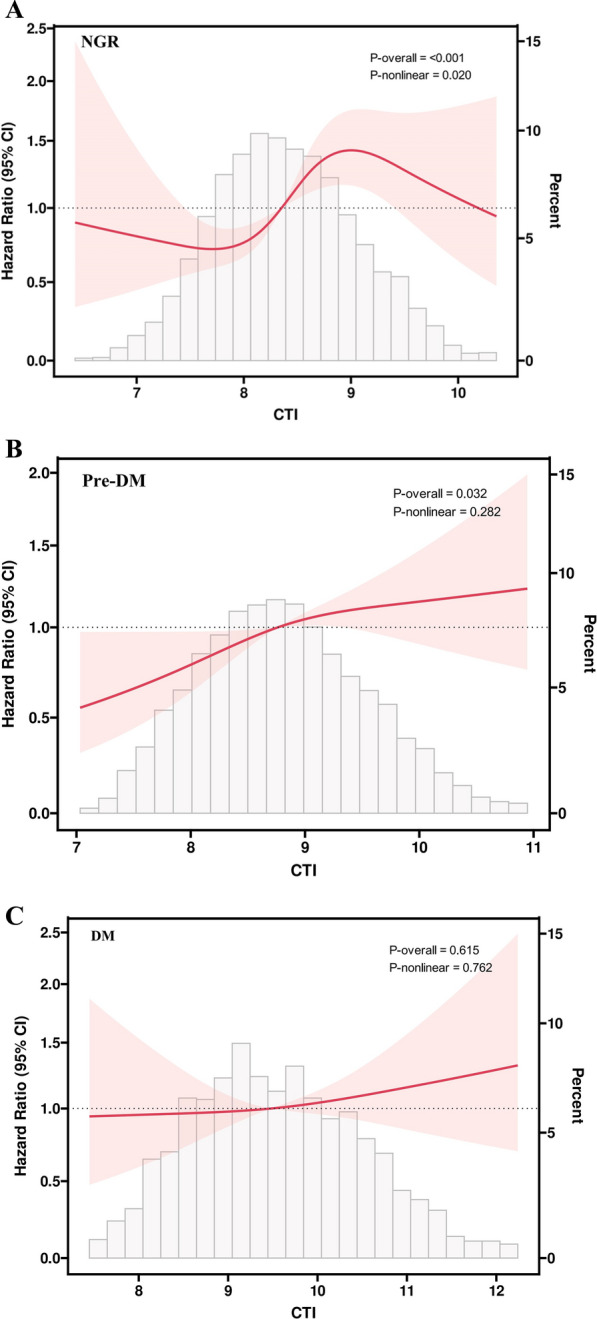
Association of the CTI index and the risk of stroke according to glucose metabolic states. A participants with NGR; B participants with Pre-DM. C participants with DM. Adjusted for gender, age, residence, marital status, education level, smoking status, drinking status, hypertension, dyslipidemia, heart disease, hypertension medications, dyslipidemia medications, SBP, DBP, and BMI
As shown in Table 6, in female participants, there was a significant association between CTI and stroke risk in individuals with NGR (HR 1.55, 95% CI 1.20, 1.99) and Pre-DM (HR 1.24, 95% CI 1.00, 1.53), and no significant difference was observed in individuals with DM. However, in male participants, when CTI is analyzed as a continuous variable, no significant difference was found in individuals with NGR, Pre-DM, and DM (all P > 0.05). However, when CTI is analyzed as a classified variable, the risk of stroke was significantly higher in Q4 (HR 1.67, 95% CI 1.00, 2.78) compared to Q1, but insignificantly increased in Q2 (HR 1.05, 95% CI 0.62, 1.78), and Q3 (HR 1.46, 95% CI 0.89, 2.40).
Table 6.
Association between the CTI and stroke incidence according to different glucose regulation state and gender
| Gender | GMS | Characteristic | Event, n | Model 1 | Model 2 | Model 3 | ||||||
|---|---|---|---|---|---|---|---|---|---|---|---|---|
| HR | 95%CI | p | HR | 95%CI | p | HR | 95%CI | p | ||||
| Male | NGR | CTI (per 1 unit) | 150 | 1.30 | 1.03, 1.64 | 0.026 | 1.30 | 1.03, 1.65 | 0.027 | 1.16 | 0.90, 1.51 | 0.256 |
| Q1 | 27 | Ref | Ref | Ref | ||||||||
| Q2 | 30 | 1.11 | 0.66, 1.87 | 0.690 | 1.12 | 0.66, 1.88 | 0.680 | 1.05 | 0.62, 1.78 | 0.846 | ||
| Q3 | 42 | 1.58 | 0.97, 2.56 | 0.065 | 1.60 | 0.98, 2.60 | 0.058 | 1.46 | 0.89, 2.40 | 0.132 | ||
| Q4 | 51 | 1.93 | 1.21, 3.07 | 0.006 | 1.94 | 1.21, 3.10 | 0.006 | 1.67 | 1.00, 2.78 | 0.049 | ||
| P for trend | 0.002 | 0.002 | 0.021 | |||||||||
| Pre-DM | CTI (per 1 unit) | 223 | 1.43 | 1.21, 1.69 | < 0.001 | 1.44 | 1.21, 1.72 | < 0.001 | 1.13 | 0.92, 1.39 | 0.246 | |
| Q1 | 37 | Ref | Ref | Ref | ||||||||
| Q2 | 54 | 1.48 | 0.97, 2.25 | 0.066 | 1.43 | 0.94, 2.18 | 0.092 | 1.24 | 0.81, 1.90 | 0.313 | ||
| Q3 | 52 | 1.43 | 0.94, 2.17 | 0.099 | 1.45 | 0.95, 2.21 | 0.088 | 1.03 | 0.66, 1.61 | 0.901 | ||
| Q4 | 80 | 2.28 | 1.54, 3.36 | < 0.001 | 2.28 | 1.54, 3.38 | < 0.001 | 1.37 | 0.87, 2.15 | 0.172 | ||
| P for trend | < 0.001 | < 0.001 | 0.266 | |||||||||
| DM | CTI (per 1 unit) | 90 | 1.24 | 1.01, 1.51 | 0.041 | 1.33 | 1.07, 1.65 | 0.011 | 1.21 | 0.95, 1.56 | 0.129 | |
| Q1 | 18 | Ref | Ref | Ref | ||||||||
| Q2 | 23 | 1.30 | 0.70, 2.42 | 0.399 | 1.27 | 0.68, 2.37 | 0.449 | 1.13 | 0.60, 2.15 | 0.702 | ||
| Q3 | 21 | 1.18 | 0.63, 2.22 | 0.600 | 1.19 | 0.63, 2.25 | 0.587 | 0.99 | 0.50, 1.95 | 0.975 | ||
| Q4 | 28 | 1.61 | 0.89, 2.91 | 0.115 | 1.88 | 1.02, 3.49 | 0.044 | 1.44 | 0.72, 2.87 | 0.306 | ||
| P for trend | 0.156 | 0.064 | 0.381 | |||||||||
| Female | NGR | CTI (per 1 unit) | 167 | 1.65 | 1.32, 2.06 | < 0.001 | 1.58 | 1.25, 1.99 | < 0.001 | 1.55 | 1.20, 1.99 | < 0.001 |
| Q1 | 25 | Ref | Ref | Ref | ||||||||
| Q2 | 33 | 1.34 | 0.79, 2.25 | 0.275 | 1.24 | 0.74, 2.09 | 0.415 | 1.21 | 0.72, 2.05 | 0.466 | ||
| Q3 | 51 | 2.11 | 1.31, 3.40 | 0.002 | 1.80 | 1.11, 2.91 | 0.017 | 1.73 | 1.06, 2.83 | 0.029 | ||
| Q4 | 58 | 2.41 | 1.51, 3.85 | < 0.001 | 2.22 | 1.39, 3.57 | < 0.001 | 2.14 | 1.29, 3.53 | 0.003 | ||
| P for trend | < 0.001 | < 0.001 | 0.001 | |||||||||
| Pre-DM | CTI (per 1 unit) | 217 | 1.37 | 1.14, 1.63 | < 0.001 | 1.35 | 1.12, 1.61 | 0.001 | 1.24 | 1.00, 1.53 | 0.046 | |
| Q1 | 38 | Ref | Ref | Ref | ||||||||
| Q2 | 48 | 1.27 | 0.83, 1.95 | 0.264 | 1.28 | 0.83, 1.96 | 0.262 | 1.25 | 0.81, 1.93 | 0.308 | ||
| Q3 | 60 | 1.61 | 1.07, 2.42 | 0.022 | 1.59 | 1.06, 2.39 | 0.026 | 1.46 | 0.94, 2.25 | 0.091 | ||
| Q4 | 71 | 1.92 | 1.30, 2.85 | 0.001 | 1.87 | 1.26, 2.79 | 0.002 | 1.60 | 1.02, 2.52 | 0.040 | ||
| P for trend | < 0.001 | < 0.001 | 0.036 | |||||||||
| DM | CTI (per 1 unit) | 113 | 1.12 | 0.93, 1.35 | 0.221 | 1.12 | 0.93, 1.35 | 0.222 | 1.01 | 0.81, 1.24 | 0.963 | |
| Q1 | 23 | Ref | Ref | Ref | ||||||||
| Q2 | 24 | 1.05 | 0.59, 1.85 | 0.878 | 1.02 | 0.58, 1.82 | 0.939 | 0.92 | 0.51, 1.65 | 0.774 | ||
| Q3 | 31 | 1.37 | 0.80, 2.36 | 0.248 | 1.35 | 0.79, 2.32 | 0.277 | 1.14 | 0.63, 2.06 | 0.660 | ||
| Q4 | 35 | 1.58 | 0.93, 2.67 | 0.089 | 1.58 | 0.93, 2.68 | 0.090 | 1.22 | 0.67, 2.23 | 0.507 | ||
| P for trend | 0.051 | 0.049 | 0.373 | |||||||||
HR Hazard Ratio, CI Confidence Interval
Model 1: unadjusted for any covariates
Model 2: adjusted for gender, age, residence, marital status, education level, smoking status, and drinking status
Model 3: adjusted for gender, age, residence, marital status, education level, smoking status, drinking status, hypertension, dyslipidemia, heart disease, hypertension medications, dyslipidemia medications, SBP, DBP, and BMI
As shown in Table 7, in middle-aged participants, there was a significant association between CTI and stroke risk in participants with NGR (HR 1.46, 95% CI 1.11, 1.91) and Pre-DM (HR 1.44, 95% CI 1.16, 1.80), and no significant difference was observed in participants with DM. However, in elderly participants, no significant difference was found in individuals with NGR, Pre-DM, and DM (all P > 0.05) .
Table 7.
Association between the CTI and stroke incidence according to different glucose regulation state and age
| Gender | GMS | Characteristic | Event, n | Model 1 | Model 2 | Model 3 | ||||||
|---|---|---|---|---|---|---|---|---|---|---|---|---|
| HR | 95%CI | p | HR | 95%CI | p | HR | 95%CI | p | ||||
| Age 45–60 | NGR | CTI (per 1 unit) | 150 | 1.67 | 1.32, 2.12 | < 0.001 | 1.66 | 1.31, 2.11 | < 0.001 | 1.46 | 1.11, 1.91 | 0.006 |
| Q1 | 17 | Ref | Ref | Ref | ||||||||
| Q2 | 36 | 2.15 | 1.21, 3.82 | 0.009 | 2.10 | 1.18, 3.75 | 0.012 | 2.00 | 1.12, 3.57 | 0.020 | ||
| Q3 | 40 | 2.39 | 1.36, 4.22 | 0.003 | 2.25 | 1.28, 3.98 | 0.005 | 2.06 | 1.16, 3.68 | 0.014 | ||
| Q4 | 57 | 3.46 | 2.02, 5.95 | < 0.001 | 3.43 | 1.99, 5.90 | < 0.001 | 2.88 | 1.61, 5.16 | < 0.001 | ||
| P for trend | < 0.001 | < 0.001 | < 0.001 | |||||||||
| Pre-DM | CTI (per 1 unit) | 187 | 1.56 | 1.30, 1.87 | < 0.001 | 1.56 | 1.30, 1.87 | < 0.001 | 1.44 | 1.16, 1.80 | 0.001 | |
| Q1 | 30 | Ref | Ref | Ref | ||||||||
| Q2 | 36 | 1.20 | 0.74, 1.95 | 0.453 | 1.21 | 0.75, 1.97 | 0.437 | 1.19 | 0.73, 1.94 | 0.486 | ||
| Q3 | 48 | 1.62 | 1.03, 2.56 | 0.037 | 1.63 | 1.03, 2.58 | 0.036 | 1.44 | 0.89, 2.35 | 0.142 | ||
| Q4 | 73 | 2.54 | 1.66, 3.89 | < 0.001 | 2.56 | 1.67, 3.93 | < 0.001 | 2.18 | 1.32, 3.60 | 0.002 | ||
| P for trend | < 0.001 | < 0.001 | 0.001 | |||||||||
| DM | CTI (per 1 unit) | 88 | 1.13 | 0.92, 1.39 | 0.244 | 1.15 | 0.93, 1.43 | 0.193 | 1.06 | 0.83, 1.34 | 0.664 | |
| Q1 | 22 | Ref | Ref | Ref | ||||||||
| Q2 | 19 | 0.87 | 0.47, 1.61 | 0.661 | 0.85 | 0.46, 1.58 | 0.607 | 0.75 | 0.40, 1.43 | 0.382 | ||
| Q3 | 17 | 0.77 | 0.41, 1.45 | 0.416 | 0.74 | 0.39, 1.40 | 0.356 | 0.61 | 0.30, 1.23 | 0.170 | ||
| Q4 | 30 | 1.41 | 0.82, 2.45 | 0.217 | 1.46 | 0.84, 2.55 | 0.184 | 1.09 | 0.57, 2.10 | 0.789 | ||
| P for trend | 0.250 | 0.222 | 0.710 | |||||||||
| Age ≥ 60 | NGR | CTI (per 1 unit) | 167 | 1.25 | 1.00, 1.56 | 0.051 | 1.21 | 0.96, 1.52 | 0.099 | 1.18 | 0.92, 1.51 | 0.185 |
| Q1 | 32 | Ref | Ref | Ref | ||||||||
| Q2 | 37 | 1.17 | 0.73, 1.88 | 0.511 | 1.14 | 0.71, 1.83 | 0.589 | 1.17 | 0.72, 1.88 | 0.528 | ||
| Q3 | 48 | 1.55 | 0.99, 2.43 | 0.053 | 1.48 | 0.94, 2.31 | 0.090 | 1.45 | 0.92, 2.29 | 0.112 | ||
| Q4 | 50 | 1.60 | 1.03, 2.49 | 0.038 | 1.51 | 0.97, 2.37 | 0.071 | 1.48 | 0.92, 2.38 | 0.104 | ||
| P for trend | 0.018 | 0.038 | 0.069 | |||||||||
| Pre-DM | CTI (per 1 unit) | 253 | 1.26 | 1.06, 1.49 | 0.007 | 1.28 | 1.08, 1.52 | 0.005 | 1.02 | 0.83, 1.25 | 0.855 | |
| Q1 | 48 | Ref | Ref | Ref | ||||||||
| Q2 | 55 | 1.15 | 0.78, 1.69 | 0.486 | 1.18 | 0.80, 1.73 | 0.414 | 1.05 | 0.71, 1.56 | 0.797 | ||
| Q3 | 75 | 1.60 | 1.12, 2.30 | 0.011 | 1.66 | 1.15, 2.39 | 0.007 | 1.28 | 0.86, 1.89 | 0.222 | ||
| Q4 | 75 | 1.59 | 1.11, 2.29 | 0.012 | 1.64 | 1.14, 2.38 | 0.008 | 1.10 | 0.72, 1.68 | 0.652 | ||
| P for trend | 0.003 | 0.002 | 0.541 | |||||||||
| DM | CTI (per 1 unit) | 115 | 1.24 | 1.03, 1.49 | 0.020 | 1.26 | 1.05, 1.52 | 0.013 | 1.14 | 0.92, 1.42 | 0.233 | |
| Q1 | 19 | Ref | Ref | Ref | ||||||||
| Q2 | 30 | 1.64 | 0.92, 2.92 | 0.091 | 1.73 | 0.97, 3.08 | 0.065 | 1.53 | 0.85, 2.75 | 0.161 | ||
| Q3 | 32 | 1.75 | 0.99, 3.09 | 0.053 | 1.78 | 1.01, 3.16 | 0.048 | 1.34 | 0.72, 2.48 | 0.352 | ||
| Q4 | 34 | 1.88 | 1.07, 3.29 | 0.028 | 2.03 | 1.15, 3.60 | 0.015 | 1.57 | 0.83, 2.97 | 0.169 | ||
| P for trend | 0.035 | 0.021 | 0.270 | |||||||||
HR Hazard Ratio, CI Confidence Interval
Model 1: unadjusted for any covariates
Model 2: adjusted for gender, age, residence, marital status, education level, smoking status, and drinking status
Model 3: adjusted for gender, age, residence, marital status, education level, smoking status, drinking status, hypertension, dyslipidemia, heart disease, hypertension medications, dyslipidemia medications, SBP, DBP, and BMI
Subgroup analysis
To further explore the relationship between CTI and stroke risk, subgroup analysis was carried out. The results revealed that elevated CTI levels were consistent across different subgroups, including never and current smokers, never and current drinkers, and BMI < 24 and BMI ≥ 28, regardless of gender, age, residence, hypertension, and dyslipidemia. Notably, a significant interaction was observed between the CTI and dyslipidemia status (P for interaction = 0.015)(Fig. 6). The RCS analysis indicated a significant linear relationship between the CTI and the risk of stroke in individuals with and without dyslipidemia (Fig. S3 and S4).
Fig. 6.

Subgroup and interaction analyses of the association between CTI and stroke risk. Adjusted for gender, age, residence, marital status, education level, smoking status, drinking status, hypertension, dyslipidemia, heart disease, hypertension medications, dyslipidemia medications, SBP, DBP, and BMI
Sensitivity analysis
To assess the robustness of the findings, we conducted multiple sensitivity analyses. Firstly, the results did not materially change after excluding all missing data (Table S6, S7, S8, and S9). Secondly, when we removed all non-fasting participants and reanalyzed the results, our conclusions did not alter (Table S10, S11, S12, and S13). Thirdly, when we removed all deceased participants and reanalyzed, there was no substantial change in the results (Table S14, S15, S16, S17, and S18). Fourthly, the piecewise Cox regression model analysis have demonstrated the stability of the results (Table S19). Fifthly, when using Logistic regression models, the results remain stable (Table S20, S21, S22, and S23). Furthermore, the E-value for CTI was calculated based on Model 3, revealing a E-value of 1.67. The E-values suggest that relatively large unmeasured confounding effects could account for the observed hazard ratios.
Discussion
This is the first large-scale study to reveal a significant association between CTI and stroke risk, and assessed this relationship according to gender, age, and glycemic status. Our findings revealed a significant positive linear relationship between CTI and the occurrence of stroke. The association was similar between male and female, and similar in middle-aged and elderly participants. In different glycemic status, high levels of CTI were found to be linked to an increased risk of stroke in individuals with NGR and Pre-DM. However, this association was not observed in individuals with diabetes mellitus (DM). This study shows that CTI may be a reliable biomarker for stroke risk stratification.
CTI, developed by Ruan et al. [28], serves as a significant tool for the prognostic evaluation of cancer patients. This index synthesizes CRP, a recognized biomarker of inflammation, and TyG index, a biomarker of insulin resistance. Existing literature has established a connection between elevated levels of the TyG index and an increased risk of stroke [37]. Specifically, findings from Huo et al., utilizing the CHARLS database, indicate that a higher baseline TyG index is linked to a greater stroke risk [38]. Additionally, Wu et al. found that changes in the TyG index are significantly correlated with stroke incidence. Individuals who consistently maintain a high TyG index and have poor management of their levels face an elevated stroke risk [18]. Furthermore, Zhou et al. carried out a prospective cohort study involving 44,403 participants, identifying a significant relationship between the trajectory of the TyG index and the risk of stroke [39]. The TyG index is therefore recognized not only as a reliable indicator for predicting stroke risk within the general population but also as a pertinent measure for specific groups, such as non-diabetic individuals, middle-aged and elderly patients, and those diagnosed with hypertension or coronary heart disease [40–43]. On the other hand, inflammation is another important risk factor for stroke. Research conducted by Wang et al. demonstrates that elevated levels of CRP are independently associated with adverse outcomes in non-infected patients three months post-stroke [44]. Furthermore, a comprehensive study involving 8420 patients across ten prospective investigations established a correlation between higher CRP levels and an increased risk of stroke recurrence [25]. Additionally, a Mendelian randomization study has identified a causal relationship between CRP levels and stroke incidents [45]. Moreover, the work of Cui et al. has revealed the co-exposure effect and mutual mediation of TyG index and CRP on cardiovascular diseases [46]. In our study, regardless of whether CTI is a continuous variable or a categorical variable, its HR value is always higher than the HR values of CRP and TyG index. ROC analysis indicated a trend towards higher stroke predictive value for CTI compared to CRP and TyG index. This comprehensive approach can help doctors identify high-risk patients with stroke risk, so that clinicians can conduct accurate risk assessment and implement targeted interventions to reduce the incidence of stroke. The advantage of using the combined index (CTI) over the TyG index or CRP alone can be explained in several ways. Firstly, CTI offers a more comprehensive view of an individual's health, as the TyG index reflects the potential risk of insulin resistance, while CRP provides information about inflammation. Additionally, relying solely on either TyG or CRP captures only one aspect of potential pathological changes, whereas analyzing multiple indicators together can highlight differences across several metrics. Furthermore, there are individual variations in biomarker levels, with TyG and CRP offering insights into insulin resistance and inflammatory changes from different perspectives. This combined approach enhances the ability to identify and stratify individuals at higher risk.
In our study, we analyzed data from 10,443 participants included in the CHARLS database. The findings revealed a significant correlation between increasing levels of the CTI and the prevalence of stroke. Furthermore, the RCS analysis indicated a notable positive linear relationship between CTI levels and the occurrence of stroke events. To reduce the incidence of stroke among middle-aged and elderly individuals, it is recommended that clinicians strive to lower CTI levels as much as possible. Our research also demonstrated that the association between CTI and stroke risk was similar across both genders, and the HR appeared to be higher in females. Previous literature has shown that males generally exhibit a greater stroke risk than females [47]. However, hyperglycemia and hyperinsulinemia caused by insulin resistance may reverse this gender-based protection, and the correlation between women and HOMA-IR is stronger than that of men [48]. Notably, the 2015 Greater Cincinnati Northern Kentucky Stroke Study (GCNKSS) reported that for the first time, the stroke case fatality rate in women exceeded that of men [49]. Therefore, to effectively mitigate stroke risk, clinicians should prioritize monitoring CTI levels in females. Additionally, as middle-aged individuals demonstrate higher HR values in comparison to older adults, it is critical to focus on the CTI levels within this demographic. We further conducted a stratified analysis of CTI and stroke risk under different glycemic statuses, and the results showed that CTI was significantly correlated with stroke risk in individuals with NGR and Pre-DM. However, this association was not observed in individuals with DM. Additionally, the RCS revealed a significant nonlinear relationship between CTI and stroke events in the NGR population, while a significant linear relationship was noted among individuals with Pre-DM. These results suggest that clinicians should aim to maintain CTI within an appropriate range for individuals with NGR and strive to reduce CTI levels in those with Pre-DM to mitigate the risk of stroke. In our current analysis, we have failed to observe a significant correlation between CTI level and the reduction of stroke risk in patients with DM. There is no significant correlation between CTI and stroke risk in patients with DM, which may be explained by several factors. Firstly, CTI may not adequately reflect individual differences among DM patients, leading to a more significant stroke prediction in NGR and Pre-DM patients compared to DM groups [50]. Secondly, the metabolic disorder associated with DM may elevate stroke risk through alternative mechanisms, such as microvascular dysfunction, obesity and hypertension, etc., potentially reaching a saturation point where CTI does not provide additional predictive value [51–53]. Moreover, DM is manifested by excessive pancreatic secretions of the peptide amylin that forms cytotoxic aggregates deposited in vessel walls, which led to the occurrence of microvascular complications [54]. Furthermore, there is substantial variability in blood glucose control among individuals with diabetes. The pathological characteristics of poorly controlled diabetes may differ significantly from those of well-controlled diabetes. It is estimated that diabetes increases the risk of ischemic stroke by 2.27 times, and the severity of chronic hyperglycemia is directly related to the risk of stroke which potentially masking the correlation between CTI levels and stroke risk [14, 55–57]. Therefore, this study emphasizes the importance of interfering with CTI levels in patients according to different glucose metabolism states.
We conducted a comprehensive analysis of the relationship among gender, age, glycemic status, and the associated risk of stroke. The findings indicate that the correlation between CTI and stroke risk demonstrates a similar pattern in females with NGR and Pre-DM. This suggests that it is essential to maintain lower CTI levels in female patients, particularly those diagnosed with NGR and Pre-DM. In male patients with NGR, the risk of stroke significantly increased in Q4 compared to Q1. This underscores the necessity of closely monitoring CTI levels in male patients with NGR to prevent stroke effectively. Further analysis was conducted on middle-aged and elder adults with different glycemic statuses. The results revealed that in middle-aged patients, CTI is significantly associated with an increased risk of stroke in individuals with NGR and Pre-DM. Therefore, it is crucial to lower CTI levels to reduce the incidence of stroke in this demographic. Moreover, subgroup analyses revealed a notable interaction between CTI levels and dyslipidemia status. The RCS analysis confirmed a significant linear relationship between CTI and stroke risk, irrespective of dyslipidemia. Thus, it is advisable to reduce CTI levels in individuals with and without dyslipidemia. As far as we know, this study represents a groundbreaking analysis to explore the association between CTI and stroke risk according to gender, age and glycemic status.
Although the specific mechanism of CTI and stroke risk is still unclear, it may be explained through the following aspects. Firstly, insulin resistance and inflammation may lead to endothelial dysfunction, reduces nitric oxide utilization, disrupts normal coagulation, and accelerates atherosclerosis, ultimately increasing the risk of stroke [58–61]. Additionally, inflammation can aggravate insulin resistance, which can release inflammatory mediators from tissues and further aggravate systemic inflammatory response. Inflammation and insulin resistance have synergistic effects of mutual promotion and aggravation, which increases the risk of stroke [62, 63]. Moreover, both inflammation and insulin resistance compromise the stability of atherosclerotic plaques. This instability increases the risk of rupture, which can result in thrombosis and subsequently lead to the occurrence of a stroke [64–66]. Furthermore, patients experiencing insulin resistance and inflammation often have other comorbidities, including hypertension, diabetes, and obesity, all of which are significant risk factors for stroke [67–71]. Therefore, it is reasonable to assume that individuals with higher levels of CTI may be undergoing more severe vascular injury and have a higher incidence of stroke. Nevertheless, the exact mechanism by which CTI influences stroke remains unclear and warrants further investigation.
This study elucidates the role of CTI in stroke across gender, age, and glucose metabolic status, thereby combining previous evidence to provide a comprehensive approach to clinical decision-making. Globally, the number of patients with stroke is increasing, especially those with inflammation and insulin resistance who are more prone to stroke events. Therefore, it is necessary to identify high-risk patients with stroke in time. In clinical practice, our findings can guide clinicians to control CTI within the target range and help prevent stroke.
This research presents several notable advantages. Firstly, this study explored the correlation between CTI and the incidence of stroke according to gender, age and glycemic status for the first time. Secondly, the design of this research as a prospective, nationwide longitudinal cohort study, combined with a substantial sample size, enhances the reliability of our findings. Thirdly, we performed subgroup analyses to assess the consistency of results across various population characteristics, which provides valuable insights for clinical practice. Lastly, the CTI is very easy to obtain, which improves their practical application in clinic.
It is essential to acknowledge several limitations associated with this study. Firstly, stroke diagnoses were self-reported by participants based on evaluations from their healthcare providers, which may not accurately capture the actual incidence of stroke. Nevertheless, prior validation supports the reliability of these self-reported stroke events, thereby bolstering their credibility [72, 73]. Secondly, the CHARLS questionnaire lacks classification of stroke subtypes, which is also one of the limitations. Thirdly while multivariate adjustments were made to account for potential confounding factors, it is still possible that undiscovered confounders may influence the results. However, the calculated E-value indicates that our findings are robust, suggesting that unexamined confounding factors are unlikely to have a significant impact on the study’s outcomes. Fourthly, the study does not consider changes in glycemic status over time, and future research should consider the dynamic impact of glycemic status and CTI level over time to more comprehensively assess this relationship. Lastly, this study exclusively examines middle-aged and elderly individuals in China, which may limit the generalizability of the findings to other populations, and future research needs to validate the predictive effect of CTI on stroke in different populations and clinical environments. In the future, we can conduct intervention studies to test whether modifying CTI can reduce the risk of stroke.
Conclusion
In summary, the results revealed a significant positive linear relationship between CTI and the risk of stroke. The association between CTI and stroke was similar between male and female, and similar in middle-aged and elderly participants. In different glycemic status, the association was significant in individuals with NGR and Pre-DM. However, this association was not observed in individuals with DM. The results of this study may emphasize the need for risk management strategies for different gender, age, and glycemic status to prevent patients from developing stroke.
Supplementary Information
Acknowledgements
This study utilized data from the CHARLS database. The authors express their gratitude to the CHARLS research team and all individuals who participated in the study.
Author contributions
GH conceived and designed the study and wrote the main manuscript text. GH and YT analyzed the data. ZL, JC and ZY conducted the literature search and prepared figures. DZ performed the manuscript review. All authors reviewed and approved the final manuscript.
Funding
This work was supported by the Suzhou “Science and Education Revitalize Health” Youth Science and Technology Project (KJXW2022032) and the “Jiangsu Medical Association Interventional Medicine Phase III Special Fund Project” (SYH-3201140–0089).
Availability of data and materials
The data supporting the findings of this study are available on the CHARLS website (http://charls.pku.edu.cn/).
Declarations
Ethics approval and consent to participate
CHARLS was approved by the Institutional Review Board of Peking University (approval number: IRB00001052-11015 for the household survey and IRB00001052-11014 for blood samples), and all participants provided written informed consent.
Consent for publication
Not applicable.
Competing interests
The authors declare no competing interests.
Footnotes
Publisher's Note
Springer Nature remains neutral with regard to jurisdictional claims in published maps and institutional affiliations.
Guijun Huo and Yao Tang contributed equally to this work.
References
- 1.Feigin VL, Stark BA, Johnson CO, Roth GA, Bisignano C, Abady GG, Abbasifard M, Abbasi-Kangevari M, Abd-Allah F, Abedi V, Abualhasan A. Global, regional, and national burden of stroke and its risk factors, 1990–2019: a systematic analysis for the global burden of disease study 2019. Lancet Neurol. 2021;20(10):795–820. [DOI] [PMC free article] [PubMed] [Google Scholar]
- 2.Ma Q, Li R, Wang L, et al. Temporal trend and attributable risk factors of stroke burden in China, 1990–2019: an analysis for the global burden of disease study 2019. Lancet Public Health. 2021;6(12):e897–906. [DOI] [PMC free article] [PubMed] [Google Scholar]
- 3.Wu S, Wu B, Liu M, et al. Stroke in China: advances and challenges in epidemiology, prevention, and management. Lancet Neurol. 2019;18(4):394–405. [DOI] [PubMed] [Google Scholar]
- 4.King D, Wittenberg R, Patel A, et al. The future incidence, prevalence and costs of stroke in the UK. Age Ageing. 2020;49(2):277–82. [DOI] [PMC free article] [PubMed] [Google Scholar]
- 5.Feigin VL. Owolabi MOPragmatic solutions to reduce the global burden of stroke: a world stroke organization-lancet neurology commission. Lancet Neurol. 2023;22(12):1160–206. [DOI] [PMC free article] [PubMed] [Google Scholar]
- 6.White H, Boden-Albala B, Wang C, et al. Ischemic stroke subtype incidence among whites, blacks, and Hispanics: the Northern manhattan study. Circulation. 2005;111(10):1327–31. [DOI] [PubMed] [Google Scholar]
- 7.Li Z, Jiang Y, Li H, Xian Y, Wang Y. China’s response to the rising stroke burden. BMJ. 2019;28(364):1879. [DOI] [PMC free article] [PubMed] [Google Scholar]
- 8.Goldstein LBIntroduction for Focused Updates in Cerebrovascular Disease. Stroke. 2020;51(3):708–10. [DOI] [PubMed] [Google Scholar]
- 9.Di Pino A. DeFronzo RAInsulin resistance and atherosclerosis: implications for insulin-sensitizing agents. Endocr Rev. 2019;40(6):1447–67. [DOI] [PMC free article] [PubMed] [Google Scholar]
- 10.Scott DA, Ponir C, Shapiro MD, Chevli PA. Associations between insulin resistance indices and subclinical atherosclerosis: a contemporary review. Am J Prevent Cardiol. 2024;11:100676. [DOI] [PMC free article] [PubMed] [Google Scholar]
- 11.Lebovitz HE. Insulin resistance: definition and consequences. Exp Clin Endocrinol Diabet. 2001;109(Suppl 2):S135–48. [DOI] [PubMed] [Google Scholar]
- 12.Spagnoli LG, Mauriello A, Sangiorgi G, et al. Extracranial thrombotically active carotid plaque as a risk factor for ischemic stroke. JAMA. 2004;292(15):1845–52. [DOI] [PubMed] [Google Scholar]
- 13.Tabas I, Tall A, Accili D. The impact of macrophage insulin resistance on advanced atherosclerotic plaque progression. Circ Res. 2010;106(1):58–67. [DOI] [PMC free article] [PubMed] [Google Scholar]
- 14.Maida CD, Daidone M, Pacinella G, et al. Diabetes and ischemic stroke: an old and new relationship an overview of the close interaction between these diseases. Int J Mol Sci. 2022;23(4):2397. [DOI] [PMC free article] [PubMed] [Google Scholar]
- 15.Simental-Mendía LE, Rodríguez-Morán M. Guerrero-Romero FThe product of fasting glucose and triglycerides as surrogate for identifying insulin resistance in apparently healthy subjects. Metab Syndr Relat Disord. 2008;6(4):299–304. [DOI] [PubMed] [Google Scholar]
- 16.Tao LC, Xu JN, Wang TT, et al. Triglyceride-glucose index as a marker in cardiovascular diseases: landscape and limitations. Cardiovasc Diabetol. 2022;21(1):68. [DOI] [PMC free article] [PubMed] [Google Scholar]
- 17.Lu YW, Chang CC, Chou RH, et al. Gender difference in the association between TyG index and subclinical atherosclerosis: results from the I-lan longitudinal aging study. Cardiovasc Diabetol. 2021;20(1):206. [DOI] [PMC free article] [PubMed] [Google Scholar]
- 18.Wu Y, Yang Y, Zhang J, et al. The change of triglyceride-glucose index may predict incidence of stroke in the general population over 45 years old. Cardiovasc Diabetol. 2023;22(1):132. [DOI] [PMC free article] [PubMed] [Google Scholar]
- 19.Cui C, Qi Y, Song J, et al. Comparison of triglyceride glucose index and modified triglyceride glucose indices in prediction of cardiovascular diseases in middle aged and older Chinese adults. Cardiovasc Diabetol. 2024;23(1):185. [DOI] [PMC free article] [PubMed] [Google Scholar]
- 20.Xia X, Chen S, Tian X, et al. Association of triglyceride-glucose index and its related parameters with atherosclerotic cardiovascular disease: evidence from a 15-year follow-up of Kailuan cohort. Cardiovasc Diabetol. 2024;23(1):208. [DOI] [PMC free article] [PubMed] [Google Scholar]
- 21.Chaturvedi S. De Marchis GMInflammatory biomarkers and stroke subtype: an important new frontier. Neurology. 2024;102(2): e208098. [DOI] [PubMed] [Google Scholar]
- 22.Tzoulaki I, Murray GD, Lee AJ, et al. Relative value of inflammatory, hemostatic, and rheological factors for incident myocardial infarction and stroke: the Edinburgh artery study. Circulation. 2007;115(16):2119–27. [DOI] [PubMed] [Google Scholar]
- 23.Zhu Y, Xian X, Wang Z, et al. Research progress on the relationship between atherosclerosis and inflammation. Biomolecules. 2018;8(3):80. [DOI] [PMC free article] [PubMed] [Google Scholar]
- 24.Kaptoge S, Di Angelantonio E, Lowe G, et al. C-reactive protein concentration and risk of coronary heart disease, stroke, and mortality: an individual participant meta-analysis. Lancet. 2010;375(9709):132–40. [DOI] [PMC free article] [PubMed] [Google Scholar]
- 25.McCabe JJ, Walsh C, Gorey S, et al. C-reactive protein, interleukin-6, and vascular recurrence after stroke: an individual participant data meta-analysis. Stroke. 2023;54(5):1289–99. [DOI] [PubMed] [Google Scholar]
- 26.Yang L, Yue Q, Fang F, et al. Effect of dual residual risk of cholesterol and inflammation on all-cause mortality in patients with cardiovascular disease. Cardiovasc Diabetol. 2023;22(1):96. [DOI] [PMC free article] [PubMed] [Google Scholar]
- 27.Ding PF, Zhang HS, Wang J, Gao YY, Mao JN, Hang CH, Li W. Insulin resistance in ischemic stroke: mechanisms and therapeutic approaches. Front Endocrinol. 2022;15(13):1092431. [DOI] [PMC free article] [PubMed] [Google Scholar]
- 28.Ruan GT, Xie HL, Zhang HY, Liu CA, Ge YZ, Zhang Q, Wang ZW, Zhang X, Tang M, Song MM, Zhang XW. A novel inflammation and insulin resistance related indicator to predict the survival of patients with cancer. Front Endocrinol. 2022;20(13):905266. [DOI] [PMC free article] [PubMed] [Google Scholar]
- 29.Zhao DF. Value of C-reactive protein-triglyceride glucose index in predicting cancer mortality in the general population: results from national health and nutrition examination survey. Nutr Cancer. 2023;75(10):1934–44. [DOI] [PubMed] [Google Scholar]
- 30.Huang C, You H, Zhang Y, et al. Association between C-reactive protein-triglyceride glucose index and depressive symptoms in American adults: results from the NHANES 2005 to 2010. BMC Psychiatry. 2024;24(1):890. [DOI] [PMC free article] [PubMed] [Google Scholar]
- 31.Xu M, Zhang L, Xu D, Shi W, Zhang W. Usefulness of C-reactive protein-triglyceride glucose index in detecting prevalent coronary heart disease: findings from the national health and nutrition examination survey 1999–2018. Front Cardiovasc Med. 2024;15(11):1485538. [DOI] [PMC free article] [PubMed] [Google Scholar]
- 32.Zhao Y, Hu Y, Smith JP, et al. Cohort profile: the China health and retirement longitudinal study (CHARLS). Int J Epidemiol. 2014;43(1):61–8. [DOI] [PMC free article] [PubMed] [Google Scholar]
- 33.Li H, Zheng D, Li Z, et al. Association of depressive symptoms with incident cardiovascular diseases in middle-aged and older chinese adults. JAMA Netw Open. 2019;2(12):e1916591. [DOI] [PMC free article] [PubMed] [Google Scholar]
- 34.Zheng F, Yan L, Zhong B, et al. Progression of cognitive decline before and after incident stroke. Neurology. 2019;93(1):e20–8. [DOI] [PubMed] [Google Scholar]
- 35.ElSayed NA, Aleppo G, Aroda VR, et al. 2.Classification and diagnosis of diabetes: standards of care in diabetes-2023. Diabetes Care. 2023;46(Suppl 1):S19-s40.36507649 [Google Scholar]
- 36.VanderWeele TJ, Ding P. Sensitivity analysis in observational research: introducing the E-value. Ann Internal Med. 2017;167(4):268–74. [DOI] [PubMed] [Google Scholar]
- 37.Yang Y, Huang X, Wang Y, et al. The impact of triglyceride-glucose index on ischemic stroke: a systematic review and meta-analysis. Cardiovasc Diabetol. 2023;22(1):2. [DOI] [PMC free article] [PubMed] [Google Scholar]
- 38.Huo RR, Liao Q, Zhai L, et al. Interacting and joint effects of triglyceride-glucose index (TyG) and body mass index on stroke risk and the mediating role of TyG in middle-aged and older Chinese adults: a nationwide prospective cohort study. Cardiovasc Diabetol. 2024;23(1):30. [DOI] [PMC free article] [PubMed] [Google Scholar]
- 39.Zhou H, Ding X, Lan Y, et al. Dual-trajectory of TyG levels and lifestyle scores and their associations with ischemic stroke in a non-diabetic population: a cohort study. Cardiovasc Diabetol. 2024;23(1):225. [DOI] [PMC free article] [PubMed] [Google Scholar]
- 40.Huang Z, Ding X, Yue Q, et al. Triglyceride-glucose index trajectory and stroke incidence in patients with hypertension: a prospective cohort study. Cardiovasc Diabetol. 2022;21(1):141. [DOI] [PMC free article] [PubMed] [Google Scholar]
- 41.Huo RR, Zhai L, Liao Q, et al. Changes in the triglyceride glucose-body mass index estimate the risk of stroke in middle-aged and older Chinese adults: a nationwide prospective cohort study. Cardiovasc Diabetol. 2023;22(1):254. [DOI] [PMC free article] [PubMed] [Google Scholar]
- 42.Liu Y, Zhu B, Zhou W, et al. Triglyceride-glucose index as a marker of adverse cardiovascular prognosis in patients with coronary heart disease and hypertension. Cardiovasc Diabetol. 2023;22(1):133. [DOI] [PMC free article] [PubMed] [Google Scholar]
- 43.Sawaf B, Swed S, Alibrahim H, et al. Triglyceride-glucose index as predictor for hypertension, CHD and STROKE risk among non-diabetic patients: a NHANES cross-sectional study 2001–2020. J Epidemiol Glob Health. 2024;14(3):1152–66. [DOI] [PMC free article] [PubMed] [Google Scholar]
- 44.Wang L, Li Y, Wang C, et al. C-reactive protein, infection, and outcome after acute ischemic stroke: a registry and systematic review. Curr Neurovasc Res. 2019;16(5):405–15. [DOI] [PubMed] [Google Scholar]
- 45.Yang T, Xie W, Hu F, et al. Causal relationship between C-reactive protein and ischemic stroke caused by atherosclerosis: a Mendelian randomization study. J Stroke Cerebrovasc Dis. 2024;33(9):107873. [DOI] [PubMed] [Google Scholar]
- 46.Cui C, Liu L, Qi Y, et al. Joint association of TyG index and high sensitivity C-reactive protein with cardiovascular disease: a national cohort study. Cardiovasc Diabetol. 2024;23(1):156. [DOI] [PMC free article] [PubMed] [Google Scholar]
- 47.Appelros P, Stegmayr B. Terént ASex differences in stroke epidemiology: a systematic review. Stroke. 2009;40(4):1082–90. [DOI] [PubMed] [Google Scholar]
- 48.Nakagomi A, Sunami Y, Kawasaki Y, et al. Sex difference in the association between surrogate markers of insulin resistance and arterial stiffness. J Diabetes Complications. 2020;34(6):107442. [DOI] [PubMed] [Google Scholar]
- 49.Madsen TE, Khoury JC, Leppert M, et al. Temporal trends in stroke incidence over time by sex and age in the GCNKSS. Stroke. 2020;51(4):1070–6. [DOI] [PMC free article] [PubMed] [Google Scholar]
- 50.2. Classification and diagnosis of diabetes: standards of medical care in diabetes-2018. Diabetes Care, 2018,41(Suppl 1):S13–s27. [DOI] [PubMed]
- 51.van Sloten TT, Sedaghat S, Carnethon MR, et al. Cerebral microvascular complications of type 2 diabetes: stroke, cognitive dysfunction, and depression. Lancet Diabetes Endocrinol. 2020;8(4):325–36. [DOI] [PMC free article] [PubMed] [Google Scholar]
- 52.Bhupathiraju SN. Hu FBEpidemiology of obesity and diabetes and their cardiovascular complications. Circ Res. 2016;118(11):1723–35. [DOI] [PMC free article] [PubMed] [Google Scholar]
- 53.Bruno A. Pre-diabetes, diabetes, hyperglycemia, and stroke: bittersweet therapeutic opportunities. Curr Neurol Neurosci Rep. 2022;22(11):781–7. [DOI] [PubMed] [Google Scholar]
- 54.Despa F. Goldstein LBAmylin Dyshomeostasis hypothesis: small vessel-type ischemic stroke in the setting of type-2 diabetes. Stroke. 2021;52(6):e244–9. [DOI] [PMC free article] [PubMed] [Google Scholar]
- 55.Alter M, Lai SM, Friday G, et al. Stroke recurrence in diabetics. Does control of blood glucose reduce risk? Stroke. 1997;28(6):1153–7. [DOI] [PubMed] [Google Scholar]
- 56.Kitada M, Zhang Z, Mima A, et al. Molecular mechanisms of diabetic vascular complications. J Diabetes Investig. 2010;1(3):77–89. [DOI] [PMC free article] [PubMed] [Google Scholar]
- 57.Sarwar N, Gao P, Seshasai SR, et al. Diabetes mellitus, fasting blood glucose concentration, and risk of vascular disease: a collaborative meta-analysis of 102 prospective studies. Lancet. 2010;375(9733):2215–22. [DOI] [PMC free article] [PubMed] [Google Scholar]
- 58.Jin A, Wang S, Li J, et al. Mediation of systemic inflammation on insulin resistance and prognosis of nondiabetic patients with ischemic stroke. Stroke. 2023;54(3):759–69. [DOI] [PubMed] [Google Scholar]
- 59.Yang T, Li G, Wang C, et al. Insulin resistance and coronary inflammation in patients with coronary artery disease: a cross-sectional study. Cardiovasc Diabetol. 2024;23(1):79. [DOI] [PMC free article] [PubMed] [Google Scholar]
- 60.Sansbury BE, Hill BG. Regulation of obesity and insulin resistance by nitric oxide. Free Radic Biol Med. 2014;1(73):383–99. [DOI] [PMC free article] [PubMed] [Google Scholar]
- 61.Andrabi SM, Sharma NS, Karan A, et al. Nitric oxide: physiological functions, delivery, and biomedical applications. Adv Sci. 2023;10(30):e2303259. [DOI] [PMC free article] [PubMed] [Google Scholar]
- 62.Püschel GP, Klauder J. Henkel JMacrophages, low-grade inflammation, insulin resistance and hyperinsulinemia: a mutual ambiguous relationship in the development of metabolic diseases. J Clin Med. 2022;11(15):4358. [DOI] [PMC free article] [PubMed] [Google Scholar]
- 63.Shoelson SE, Lee J. Goldfine ABInflammation and insulin resistance. J Clin Invest. 2006;116(7):1793–801. [DOI] [PMC free article] [PubMed] [Google Scholar]
- 64.Du Y, Wei F, Dong Z, et al. Prognostic value of serum LP-PLA2 and hs-CRP in unstable atherosclerotic plaques. Clin Exp Hypertens. 2011;33(2):113–6. [DOI] [PubMed] [Google Scholar]
- 65.Huo G, Zheng J, Cao J, Zhang L, Yao Z, Zeng Y, Tang Y, Liu Z, Tan Z, Zhou D. Association between triglyceride-glucose index and carotid plaque stability in different glycemic status: a single-center retrospective study. J Am Heart Assoc. 2025;14(3):e037970. [DOI] [PMC free article] [PubMed] [Google Scholar]
- 66.Xu DL, Liu JN, Du YM, et al. The correlation of human serum Lp-PLA2 and hs-CRP and stability of coronary atherosclerotic plaques. Zhonghua Nei Ke Za Zhi. 2009;48(8):651–4. [PubMed] [Google Scholar]
- 67.DeFronzo RAInsulin resistance. lipotoxicity, type 2 diabetes and atherosclerosis: the missing links. The claude bernard lecture 2009. Diabetologia. 2010;53(7):1270–87. [DOI] [PMC free article] [PubMed] [Google Scholar]
- 68.Miranda PJ, DeFronzo RA, Califf RM, et al. Metabolic syndrome: evaluation of pathological and therapeutic outcomes. Am Heart J. 2005;149(1):20–32. [DOI] [PubMed] [Google Scholar]
- 69.Ferroni P, Basili S, Falco A, et al. Inflammation, insulin resistance, and obesity. Curr Atheroscler Rep. 2004;6(6):424–31. [DOI] [PubMed] [Google Scholar]
- 70.Lontchi-Yimagou E, Sobngwi E, Matsha TE, et al. Diabetes mellitus and inflammation. Curr Diab Rep. 2013;13(3):435–44. [DOI] [PubMed] [Google Scholar]
- 71.Agita A. Alsagaff MTInflammation, immunity, and hypertension. Acta Med Indones. 2017;49(2):158–65. [PubMed] [Google Scholar]
- 72.Yuan X, Liu T, Wu L, et al. Validity of self-reported diabetes among middle-aged and older Chinese adults: the China health and retirement longitudinal study. BMJ Open. 2015;5(4):e006633. [DOI] [PMC free article] [PubMed] [Google Scholar]
- 73.Choe S, Lee J, Lee J, et al. Validity of self-reported stroke and myocardial infarction in Korea: the health examinees (HEXA) study. J Prev Med Public Health. 2019;52(6):377–83. [DOI] [PMC free article] [PubMed] [Google Scholar]
Associated Data
This section collects any data citations, data availability statements, or supplementary materials included in this article.
Supplementary Materials
Data Availability Statement
The data supporting the findings of this study are available on the CHARLS website (http://charls.pku.edu.cn/).