

Abstract
Purpose:
To evaluate the performance of eight lung cancer prediction models on patient cohorts with screening-detected, incidentally-detected, and bronchoscopically-biopsied pulmonary nodules.
Materials and Methods:
This study retrospectively evaluated promising predictive models for lung cancer prediction in three clinical settings: lung cancer screening with low-dose CT, incidentally detected pulmonary nodules, and nodules deemed suspicious enough to warrant a biopsy. The area under the receiver operating characteristic curve (AUC) of eight validated models including logistic regressions on clinical variables and radiologist nodule characterizations, artificial intelligence (AI) on chest CTs, longitudinal imaging AI, and multi-modal approaches for prediction of lung cancer risk was assessed in 9 cohorts (n=898, 896, 882, 219, 364, 117, 131, 115, 373) from multiple institutions. Each model was implemented from their published literature, and each cohort was curated from primary data sources collected over periods within 2002 to 2021.
Results:
No single predictive model emerged as the highest-performing model across all cohorts, but certain models performed better in specific clinical contexts. Single timepoint chest CT AI performed well for screening-detected nodules but did not generalize well to other clinical settings. Longitudinal imaging and multimodal models demonstrated comparatively good performance on incidentally-detected nodules. When applied to biopsied nodules, all models showed low performance.
Conclusion:
Eight lung cancer prediction models failed to generalize well across clinical settings and sites outside of their training distributions.
Summary Statement
The performance of 8 different statistical models for lung cancer prediction depended heavily on the clinical setting they are applied in and generalized poorly on sites outside of their training distributions.
Graphical Abstract
1. Introduction
Every year, an estimated 1.57 million Americans have at least one pulmonary nodule detected either incidentally on routine chest CT or during lung cancer screening 1. While biopsy of the nodule remains the reference standard diagnostic test for malignancy, it involves an invasive procedure associated with morbidity, mortality, additional healthcare costs and anxiety for patients 2,3. With 95% of indeterminate pulmonary nodules (IPNs) being benign 4, clinical guidelines 1,5–7 recommend to risk-stratify nodules before resorting to invasive diagnostics and surgical intervention. Statistical models for predicting lung cancer have the potential to improve this risk-stratification, aiding in earlier diagnosis of malignancy as well as reducing morbidity, costs, and anxiety associated with workup of benign disease.
Validated predictive models developed to stratify pulmonary nodules consist of (1) clinical prediction models, (2) cross-sectional or longitudinal artificial intelligence (AI) models, and (3) multimodal approaches. We consider a predictive model validated if it has demonstrated competitive discriminatory performance (area under the receiver operating characteristic curve [AUC] above 0.75) on a separate test cohort. The Brock 8 and Mayo 9 models are two of the most used models in clinical practice and recommended by clinical guidelines. They are well-validated logistic regressions and are based on readily available variables, such as demographics 10, smoking history, and radiologists’ assessment of nodule features. However, they require radiologists to first detect and characterize the nodule, a step that can be subject to inter-reader variability 11–13.
Recent research has validated several AI models for cancer prediction. These operate directly on the voxels of the image, negating the need for radiologists to first describe nodule morphology or measure sizes. One of the early AI successes in lung cancer prediction was Liao et al 14. Their two-step approach involved first detecting suspicious lesions in the lung field from a single chest CT image and then computing malignancy risk from the proposed regions of interest (ROIs). Recently, Mikhael et al.15 publicly released Sybil, a predictive model that extracts global chest features along with regional attention features to predict lung cancer risk up to 6-years.
Previous work has also leveraged AI on longitudinal imaging. Gao et al.16 and Li et al.17 extended the work of Liao et al. to leverage consecutive chest CTs and the time interval between scans. In another longitudinal imaging approach, Ardila et al.18, demonstrated impressive AUC performance of a model including global chest features outside of local ROIs, but their model was not released publicly. Recently, efforts that leveraged data from multiple modalities have shown 19,20, with limited validation, that the combination of clinical variables and imaging AI can improve performance over single modality approaches.
The plethora of research is promising, but several concerns arise when considering the clinical utility of predictive models in lung cancer diagnostics. First, the comparative advantage of AI models versus commonly used linear models has not been quantitatively characterized in settings where a predictive model would arguably have the most impact. Second, almost all of the AI models are, to some extent, trained on lung screening scans from the National Lung Screening Trial (NLST) 21, which raises the question of whether they generalize across institutions and to patients with incidentally-detected nodules and metastases to the lung from other sites. Third, these models predict different outcomes. Some assess the risk of developing lung cancer over a multi-year period, whereas others estimate the probability that an observed pulmonary nodule is malignant. A comparative analysis of these models using a standardized outcome (e.g. 2-year diagnosis of lung cancer) can inform “off-label” use of models but has not yet been performed. Finally, there is an urgent need to risk-stratify intermediate-risk nodules and reduce the number of biopsies on nodules that appear indeterminate but turn out to be benign. To our knowledge, a systematic analysis of how existing models perform in this setting has not been performed.
This study aimed to evaluate 8 validated lung cancer prediction models on cohorts with screening-detected nodules, incidentally-detected nodules collected in both retrospective and prospective fashion, and nodules that underwent a bronchoscopic biopsy. These different settings are where we envision a well-designed predictive model will have a tangible impact on patient care. We implemented each model from their published code repositories and curated each cohort from their primary available source.
2. Materials and Methods
2.1. Cohorts
The data included in this retrospective study were sourced from the National Lung Screening Trial (NLST), through the Cancer Data Access System and our medical center A. This study also included data from a multi-institute consortium, which includes the Veterans Affairs associated with academic medical center A, academic medical center B, Detection of Early lung Cancer Among Military Personnel (DECAMP), and academic medical center C. We derived 10 named cohorts from these sites using different inclusion criteria (Table 1). We obtained CT scans, demographics, questionnaire data from CT arm of the NLST upon request with a data use agreement (https://cdas.cancer.gov/learn/nlst/images/). Data from Lung Screening-A (LS-A) was acquired under our home institutional review board (IRB) supervision #181279. Longitudinal Incidental-A (LI-A) and BRONCH were acquired under IRB supervision #140274. Consortium-A was acquired under IRB supervision #030763 and #000616. Consortium-B, Consortium-C, and DECAMP were acquired via academic collaborations under different grants. Data acquisition of these cohorts were HIPAA compliant. Regarding patients that have been previously reported, the NLST is a widely studied public dataset. Portions of LS-A have been reported in 22 (n=1189) and 23(n-147), LI-A was previously reported in 24,25. Patients from Consortium-A, Consortium-B, Consortium-C, and DECAMP have been previously studied in 19 (n=1331) and 26 (n=457).
Table 1.
Cohort Inclusion/exclusion criteria
| Inclusion/exclusion criteria | |
|---|---|
| NLST-test | Patients correspond to the Ardila et al.18 test set. These patients were not seen by any of the predictive models in this study. Lung cancer events were the biopsy-confirmed lung cancers reported by the NLST. Patients without a confirmed outcome were excluded from this study. |
| NLST-test-nodule | Subset of the NLST-test cohort in which included patients had at least one positive nodule finding from their CTs as defined in the NLST (>= 4 mm). |
| NLST-dev | All patients enrolled in the CT arm of the NLST and not part of NLST-test. Those without available imaging or without a confirmed outcome were excluded. |
| LS-A | Patients meeting the American Cancer Society criteria for lung screening and were enrolled in the lung screening program at medical center A from 2015 to 2018. Patients receive longitudinal follow-up after a positive screen and lung cancer events were confirmed via biopsy reports. Nodule characteristics are missing because radiology reports were not available. |
| LI-A | Patients from medical center A who acquired three chest CTs within five years between 2012 and 2019. These patients were identified through International Classification of Diseases (ICD) codes to have a pulmonary nodule and no cancer before the nodule. We defined lung cancer outcomes through ICD codes representing any malignancy found in the bronchus or lung parenchyma, including metastases from other sites 24. Nodule characteristics are missing because radiology reports were not available. |
| Consortium-A | Prospectively enrolled patients from medical center A and its associated VA between 2003 and 2017. Cohorts prefixed with consortium- meet the following inclusion criteria. Patients must be aged 18–80 and were detected incidentally to have a pulmonary nodule with a diameter between 6–30mm. Patients consented at initial nodule detection and serum and CT scan were acquired at that time. Longitudinal imaging and biopsy-confirmed diagnosis for malignant nodules were collected during a 2-year period following initial nodule detection. |
| Consortium-B | Prospectively enrolled patients from medical center B according to consortium inclusion criteria. Longitudinal imaging after initial nodule detection was not available. |
| Consortium-DECAMP | Prospectively enrolled patients from 12 clinical centers associated with the DECAMP 37 study protocol. Of note, cases and controls are matched on nodule size. |
| Consortium-C | Prospectively enrolled patients from medical center C according to MCL inclusion criteria. Longitudinal imaging after initial nodule detection was not available. |
| BRONCH | Prospectively collected cohort of patients who underwent a bronchoscopic lung biopsy for a pulmonary nodule (defined as a lesion < 3cm) at the lung nodule clinic of medical center A between the years of 2017–19. The subsequent biopsy report from the bronchoscopy was used to determine benign vs. malignant status of the nodule. |
Note.—NLST =National Lung Screening Trial , DECAMP = Detection of Early lung Cancer Among Military Personnel.
2.2. Image Preprocessing
We used a documented pipeline 27 that includes algorithmic analysis and manual visual assessment to ensure every scan used in this study passed certain image quality standards (Figure 1). Specifically, we excluded scans with severe imaging artifacts, scans with slice thickness greater than or equal to 5 mm, and scans without the full lung field in the field of view. 713 studies in total were excluded due to insufficient quality (Supp. Fig 7.). Patient health information was removed using the MIRC Anonymizer28.
Figure 1.

Image quality assurance pipeline for each cohort. Exclusion criteria included severe artifact, non-standard chest or body orientation, field of view that did not fully include the lung, and slice thickness > 5mm.
2.3. Predictive Models
We selected an array of models for lung cancer prediction (Table 3), including models designed to estimate lung cancer risk (i.e. Sybil) as well as models designed to predict the malignancy probability of a pulmonary nodule. We included the Brock 9 and Mayo 8 models, as they are among the most cited, validated, and used in clinical practice. We studied a several AI models incorporating a range of approaches that would allow us to examine the efficacy of three strategies: Liao14 and Sybil15 as a single timepoint chest CT approach, Distanced LSTM (DLSTM)16 and Time-distance Vision Transformer (TDViT)17 as a longitudinal chest CT approach, and DeepLungScreening (DLS)20 and DeepLungIPN (DLI)19 as models with multimodal inputs.
Table 3.
Lung Cancer Predictive Model Characteristics
| Model | Year Published | Input | Training Distribution | Cancer Prevalence | Outcome Criteria | Approach |
|---|---|---|---|---|---|---|
| Mayo 8 | 1997 | Age, PH, SS, NSpic, NUL, NSize† | Mayo Clinic (n=419) | 23% | 2-year LC risk proven via tissue biopsy or no findings in follow up | Logistic regression |
| Brock 9 | 2013 | Age, Sex, FH, Emp, Nsize, Nspic NUL, Ncount, Ntype‡ | PanCan 38 (n=1871) | 5.5% | 2-year LC risk proven via tissue biopsy or no findings in follow up | Logistic regression |
| Liao 14 | 2017 | Single chest CT | NLST-dev (n=5436) | 17% | 1-year LC risk proven via tissue biopsy or no findings in follow up | ResNet, nodule detection and ROI-based prediction |
| Sybil 15 | 2023 | Single chest CT | NLST-dev (n=12672) | 17% | Up to 6-year LC risk proven via tissue biopsy or no findings in follow up | ResNet, global chest features and guided attention |
| DLSTM 16 | 2020 | Longitudinal chest CT | NLST-dev (n=5436) | 17% | 6-year LC risk proven via tissue biopsy or no findings in follow up | LSTM network, ROI-based prediction, encodes time interval between scans |
| TdViT 17 | 2023 | Longitudinal chest CT | NLST-dev (n=5436) | 17% | 6-year LC risk proven via tissue biopsy or no findings in follow up | Transformer network, ROI- based prediction, encodes time interval between scans |
| DeepLungScreening 20 | 2021 | Single chest CT, Age, Education, BMI, PH, FH, SS, Quit, PYR | NLST-dev (n=5436) | 17% | 2-year LC risk proven via tissue biopsy or no findings in follow up | ResNet, ROI-based prediction, late fusion of imaging and clinical features |
| DeepLungIPN 19 | 2021 | Single chest CT, Age, BMI, PH, SS, PYR, Nsize, NSpic, NUL, Serum biomarker¶ | Consortium cross validation§ (n=1232) | 59% | 2-year LC risk proven via tissue biopsy or no findings in follow up | DeepLungScreening, serum biomarker |
PH: Personal history of any cancer, FH: Family history of lung cancer, SS: smoking status (former v.s. current smoker), SI: smoking intensity (average number of cigarettes smoked a day), SD: smoking duration, Quit: years since the person quit smoking, PYR: pack-years of smoking fNSpic: Nodule spiculation present or absent, NUL: Nodule in the upper lobes, Nodule Size: largest diameter in mm
Emp: Presence of emphysema, Ncount: Number of nodules, Ntype: nodule type, categorized as (1) nonsolid or with ground-glass opacity, (2) part-solid, and (3) solid.
Serum concentration of hs-CYFRA 21–1 (natural log of ng/ml) 39
Combination of Consortium-A, Consortium-DECAMP, Consortium-C
We split patients with confirmed follow-up in the NLST into development (NLST-dev) and test (NLST-test) sets. NLST-test contains the patients in the Ardila et al. test set that had confirmed follow-up and these scans remained unseen until evaluation. NLST-dev was used to retrain, from random weights, several of the models using a standardized 2-year lung cancer outcome. The purpose of retraining was to (1) ensure that the models were blinded to NLST-test and (2) standardize the predicted outcome across each model. Specifically, the years between initial observation of the patient and the outcome, or year-to-outcome, was not standardized across the evaluated models (Table 3). Models developed using a shorter year-to-outcome have an easier task than models developed using a longer year-to-outcome. In this way, differences in year-to-outcomes can confound model comparisons. For longitudinal imaging models, the outcome was whether the patient was diagnosed with lung cancer within two years of the patient’s latest scan. The logistic regression models were not retrained and were evaluated as published since they were already blinded to NLST-test and we did not have their original development dataset which is needed to control for year-to-outcome. Sybil was also evaluated as published because the model was already blinded to NLST-test and its prediction includes a 2-year outcome. Lastly, DeepLungIPN was originally trained using a cross-validation of Consortium-A, Consortium-DECAMP, and Consortium-C. This model was evaluated as published since the model includes a blood biomarker that was only collected in the MCL cohorts.
Implementation and training of models followed their original methodology unless otherwise specified. Details on the site of development and training distribution are reported in Supp. Table 4. Apart from removing scans that did not meet our image quality standards, we did not add` or remove any pre- or post-processing steps included in the models’ pipeline. The code supporting model training, evaluation, and statistical analysis is available at https://github.com/MASILab/lcancer_baselines.
2.4. Evaluation and Statistical Analysis
Evaluation included all the named cohorts except NLST-dev. A model-cohort evaluation was not feasible when a substantial portion of the input data was missing, specifically when an input variable was missing in more than 10% of cohort patients (Supp. Table 2). When an input variable was missing in less than 10% of patients, we conducted an evaluation using imputation based on a multivariable regression of the other available variables. The effect of imputation on model performance is evaluated in Supp. Table 3. We did not evaluate longitudinal imaging models (DLSTM and TDViT) on cohorts where longitudinal imaging was unavailable. When evaluating DeepLungIPN on the consortium cohorts, we report the out-of-fold cross validation results.
We used AUC to measure model performance for classifying lung cancer cases and benign controls. For each model-cohort evaluation, we used bootstrapping procedure to estimate the model’s performance on the cohort’s true population. The procedure drew 1000 samples of the same size with replacement from the original cohort. Each model’s AUC was calculated for each sample and we reported the mean AUC and 95% confidence interval (CI) over all bootstrapped samples. A two-sided Wilcoxon-signed rank test evaluated significance of differences, at p<0.05, in mean AUC between models within a single cohort. We did not test statistical differences across cohorts because patients were not paired across cohorts.
Model performance for non-small cell lung cancer (NSCLC) vs. small cell lung cancer (SCLC) cases were compared in NLST-test-nodules and Consortium-A. The mean AUC and 95% CI of each model was computed using the same bootstrap procedure drawn from the pool of benign patients and patients with either SCLC or NSCLC. An unpaired t-test evaluated whether a model’s discrimination of malignant versus benign was significantly different at p<0.05 with these two lung cancer subtypes.
An analysis of calibration before and after confidence correction was conducted. In each model-cohort evaluation, 10-fold cross validation was used to fit isotonic regressions on the training set of each fold. Calibration was then evaluated on the validation set of each fold (Supp. Fig. 3–6). All statistical analysis were performed in python with support from the SciPy package.
4. Results
Cohort Characteristics
The size of the evaluation cohorts ranged from 898 patients (NLST-test) to 117 patients (Consortium-B). Mean age ranged from 59 with standard deviation 13 (LI-A) to 69 with a standard deviation of 11 (Consortium-A). Male sex proportion ranged from as low as 23% (Consortium-DECAMP) to high as 61% (NLST-test). Cancer prevalence in the biopsied nodules cohort (BRONCH: 62%) was the highest, followed by incidentally-detected nodules (Consortium-A: 65%, Consortium-B: 41%, Consortium-DECAMP: 49%, Consortium-C: 50%), and lastly screening cohorts (NLST-test: 17%, LS-A: 3%, LI-A: 17%). Mean smoking pack years fell within 47 to 59 except for the biopsied nodules cohort at 29 due to the high proportion of never-smokers. Overall cohorts were distributed differently in terms of cancer prevalence, demographics, smoking background, and nodule characteristics (Table 2).
Table 2.
Cohort Characteristics
| Cohort | NLST-dev | NLST-test | NLST-test-nodule | LS-A | LI-A | Consortium-A | Consortium-B | Consortium-DECAMP | Consortium-C | BRONCH |
|---|---|---|---|---|---|---|---|---|---|---|
|
| ||||||||||
| Program Type | Screening | Screening | Screening | Screening | Screening, Incidental | Incidental | Incidental | Incidental | Incidental | Bronchosc opy |
|
| ||||||||||
| Institution | Multi-institute | Multi-institute | Multi-institute | Medical Center A | Medical Center A | Medical Center A, VA A | Medical Center B | Multiinstitute | Medical Center C | Medical Center A |
|
| ||||||||||
| Program Period | 2002–09 | 2002–09 | 2002–09 | 2015–18 | 2012–21 | 2003–17 | 2006–15 | 2013–17 | 2010–18 | 2017–19 |
|
| ||||||||||
|
No. of patients with lung cancer |
5436 901 (17%) |
898 149 (17%) |
896 147 (16%) |
882 24 (3.0%) |
219 37 (17%) |
364 238 (65%) |
117 48 (41%) |
131 64 (49%) |
115 57 (50%) |
373 230 (62%) |
|
| ||||||||||
|
No. of scans with lung cancer |
14748 1866 (13%) |
2523 313 (12%) |
2440 298 (12%) |
1483 51 (3.4%) |
515 50 (10%) |
760 517 (68%) |
117 48 (41%) |
241 100 (41%) |
115 57 (50%) |
387 240 (62%) |
|
| ||||||||||
| Slice thickness (mm) | 2.1 ± 0.65 | 2.1 ± 0.42 | 2.1 ± 0.42 | 0.81 ± 0.21 | 0.77 ± 0.61 | 1.8 ± 1.1 | 2.2 ± 0.69 | 1.7 ± 0.91 | 1.4 ± 0.79 | 0.9 ± 0.38 |
|
| ||||||||||
| Age (y) | 62 ± 5.2 | 62 ± 5.2 | 62 ± 5.2 | 65 ± 5.8 | 59 ± 13 | 69 ± 11 | 68 ± 8.5 | 68 ± 7.9 | 66 ± 8.3 | 64 ± 12 |
|
| ||||||||||
| Sex (male) | 3270 (60%) | 546 (61%) | 546 (61%) | 483 (55%) | 109 (50%) | 165 (45%) | 49 (42%) | 30 (23%) | 31 (27%) | 168 (45%) |
|
| ||||||||||
| BMI (kg/m2) | 28 ± 4.8 | 28 ± 4.9 | 28 ± 5.0 | 28.4 ± 6.0 | 27 ± 7.4 | 28 ± 6.5 | 28 ± 4.9 | 26 ± 5.4 | 29 ± 6.2 | 28 ± 6.8 |
|
| ||||||||||
| Personal cancer history | 256 (4.7%) | 43 (4.8%) | 43 (4.8%) | 135 (15%) | N/A | 129 (35%) | 3 (2.6%) | 65 (50%) | 13 (11%) | 194 (52%) |
|
| ||||||||||
| Family lung cancer history | 1194 (22%) | 179 (20%) | 177 (20%) | 149 (17%) | N/A | 41 (11%) | 0 | 0 | 10 (8.7%) | 88 (24%) |
|
| ||||||||||
| Smoking status | N/A | |||||||||
| Never | 0 | 0 | 0 | 0 | 33 (9%) | 0 | 11 (8.4%) | 22 (19%) | 90 (24%) | |
| Former | 2781 (51%) | 469 (52%) | 468 (52%) | 357 (40%) | 195 (54%) | 76 (65%) | 67 (51%) | 54 (47%) | 214 (57%) | |
| Current | 2655 (49%) | 429 (48%) | 428 (48%) | 525 (60%) | 121 (33%) | 41 (35%) | 53 (40%) | 39 (34%) | 69 (18%) | |
|
| ||||||||||
| Smoking pack-years | 56 ± 25 | 59 ± 28 | 59 ± 28 | 48 ± 21 | N/A | 47 ± 33 | 48 ± 23 | 50 ± 25 | 50 ± 33 | 29 ± 30 |
|
| ||||||||||
| Nodule size (mm) | 8.0 ± 6.2 | 7.9 ± 5.9 | 7.9 ± 5.9 | N/A | N/A | 19 ± 13 | 16 ± 8.9 | 15 ± 7.0 | 18 ± 15 | 2.2 ± 1.3 |
|
| ||||||||||
| Nodule count | 1.2 ± 1.3 | 1.3 ± 1.2 | 1.3 ± 1.2 | N/A | N/A | 1.0 ± 0.0 | 1.0 ± 0.0 | 1.0 ± 0.0 | 1.0 ± 0.0 | 1.0 ± 0.0 |
|
| ||||||||||
| Nodule attenuation | N/A | N/A | ||||||||
| Solid | 7494 (51%) | 1351 (54%) | 1351 (55%) | 725 (95%) | 99 (85%) | 241 (100%) | 115 (100%) | 325 (84%) | ||
| Part-solid | 507 (3.4%) | 69 (2.7%) | 69 (2.8%) | 21 (2.8%) | 18 (15%) | 0 | 0 | 51 (13%) | ||
| Non-solid or GGO | 1439 (10%) | 241 (9.6%) | 241 (9.9%) | 14 (1.8%) | 0 | 0 | 0 | 11 (2.8%) | ||
|
| ||||||||||
| Nodule spiculation (present) | 997 (6.7%) | 200 (7.9%) | 200 (8.2%) | N/A | N/A | 229 (30%) | 15 (13%) | 126 (52%) | 30 (26%) | 173 (45%) |
|
| ||||||||||
| Nodule location | N/A | N/A | ||||||||
| Upper lobe | 5554 (38%) | 996 (39%) | 996 (41%) | 447 (59%) | 63 (54%) | 143 (59%) | 71 (62%) | 203 (52%) | ||
| Lower lobe | 4391 (30%) | 777 (31%) | 777 (32%) | 313 (41%) | 54 (46%) | 98 (41%) | 44 (38%) | 184 (48%) | ||
Note.—Data values presented as mean ± SD or number of patients (percentage).
Model Performance
Table 4 reports the mean AUC and 95% CI for each feasible model-cohort evaluation. Supp. Table 1 also reports corresponding sensitivity and specificity using an optimal cut-point for each model-cohort evaluation. Comparing the results row-wise reveals that almost all predictive models exhibited noticeable differences in performance across cohorts (Figure 2A)
Table 4:
Model Classification of n-year lung cancer risk across selected cohorts
| NLST-test (n=898) | NLST-testnodules (n=896) | LS-A (n=882) | LI-A (n=219) | Consortium-A (n=364) | Consortium-B (n=117) | Consortium-DECAMP (n=131) | Consortium-C (n=115) | BRONCH (n=373) | Average Rank (range) n=‰ | ||
|---|---|---|---|---|---|---|---|---|---|---|---|
| Input | Model | ||||||||||
| Clinical variables | Mayo | ‡ | 0.804 [0.798, 0.809] | ‡ | ‡ | 0.706 [0.704, 0.708] | 0.864 [0.862, 0.867] | 0.568 [0.565, 0.571] | 0.716 [0.712, 0.719] | 0.621 [0.615, 0.628] | 3.5 (7, 1) n=6 |
| Clinical variables | Brock | ‡ | 0.789 [0.782, 0.796] | ‡ | ‡ | 0.716 [0.714, 0.718] | 0.885 [0.883, 0.886] | 0.662 [0.659, 0.666] | 0.713 [0.710, 0.716] | 0.497 [0.494, 0.499] | 3.2 (5, 2) n=6 |
| Single CT AI | Liao et al. | 0.751 [0.747, 0.756] | 0.755 [0.750, 0.759] | 0.723 [0.712, 0.734] | 0.644 [0.635, 0.653] | 0.662 [0.660, 0.664] | 0.779 [0.776, 0.782] | 0.706 [0.703, 0.709] | 0.660 [0.656, 0.663] | 0.621 [0.614, 0.628] | 3.9 (6, 1) n=9 |
| Single CT AI | Sybil | 0.881 [0.877, 0.885] * | 0.879 [0.872, 0.885] * | 0.779 [0.768, 0.789] | 0.763 [0.756, 0.770] | 0.700 [0.694, 0.706] | 0.889 [0.884, 0.895] | 0.606 [0.597, 0.616] | 0.764 [0.756, 0.772] | 0.623 [0.618, 0.629] | 2.6 (6, 1) n=9 |
| Longitudi nal CT AI | DLSTM | 0.738 [0.734, 0.743] | 0.727 [0.721, 0.731] | ¶ | 0.711 [0.702, 0.720] | 0.743 [0.741, 0.745] | § | 0.778 [0.774, 0.781] | § | § | 3.6 (6, 2) n=5 |
| Longitudi nal CT AI | TDViT | 0.797 [0.793, 0.802] | 0.790 [0.785, 0.794] | ¶ | 0.773 [0.764, 0.781] * | 0.753 [0.750, 0.755] | § | 0.823 [0.820, 0.825] * | § | § | 1.8 (3, 1) n=5 |
| Multimodal | DLS | 0.783 [0.778, 0.788] | 0.776 [0.771, 0.782] | 0.810 [0.799, 0.820] * | † | † | † | † | † | † | 2.7 (4, 1) n=3 |
| Multimodal | DLI | † | † | † | † | 0.856 [0.854, 0.858] * | 0.936 [0.935, 0.938] * | 0.742 [0.739, 0.745] | 0.851 [0.849, 0.854] * | † | 1.5 (3, 1) n=4 |
Note.—Data are reported as bootstrapped mean area under the receiver operating characteristic curve [95% CI]. The n-year lung cancer risk for each cohort was 2-year risk for each cohort except LI-A, which was 3-year risk, and BRONCH, which was 1-year risk.
result was significantly different compared to each other method in the column for p<0.01
nodule characteristics unavailable (missing >10% of nodule size, attenuation, count, spiculation, or lobe location)
prohibitive class imbalance (only 6/23 lung cancer cases have more than one scan)
Missing demographic, smoking history, COPD, or CYFRA covariates
No longitudinal imaging
‰ Number of cohort evaluations performed with this model
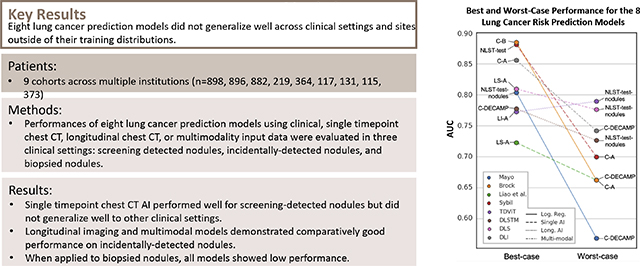
Figure 2.


(A) Mean area under the receiver operating characteristic curve (AUC) for all lung cancer prediction models applied on all study cohorts. Almost all methods demonstrate a high degree of variance in performance across cohorts within most methods, which demonstrates the importance of contextualizing a models performance by comparing it with the performance of baseline models. 95% CIs visualized in Supp. Fig 2. (B) Best- and worst-case performance for 8 predictive models reveals robust performance of longitudinal and multimodal AI methods (i.e. TDViT, DLSTM, DLS, DLI) compared to other models. A model’s worst case performance is defined as its lowest ranked performance across all cohorts except BRONCH.
A). The performance gaps were the largest between cohorts from different sites and different clinical settings (i.e. Brock on NLST-test-nodules: 0.79 [0.78, 0.80] vs. Brock on Consortium-DECAMP: 0.66 [0.66, 0.67]). The performance gap remained large between cohorts from different sites but the same clinical setting (i.e. Sybil on NLST-test: 0.88 [0.88, 0.89] vs. on LS-A: 0.78 [0.77, 0.79]). In contrast, the performance gap between different cohorts from the same site but different clinical setting was generally smaller (i.e. Liao et al. on LS-A: 0.64 [0.64, 0.65] vs. on Consortium-A: 0.66 [0.66, 0.66]).
Comparing the relative performances between multiple models across cohorts highlights the following findings.
Single chest CT AI performed well in lung cancer screening cohorts (i.e. Sybil on NLST-test: 0.88 [0.88, 0.89], Figure 3A). These models were generally competitive with linear models while longitudinal and multi-modal AI significantly outperformed linear models in every cohort. Results for Consortium-B represent this well, with Sybil (0.89 [0.88, 0.90]) performing close to Brock (0.89 [0.88, 0.89]), and DeepLungIPN (0.94 [0.94, 0.94]) outstripping the performance of both.
Figure 3.

Area under the receiver operating characteristic curves (AUCs) of 1000 bootstrapped samples from applying three selected methods across all study cohorts. Brock and Liao et al. are selected as baselines to compare with the method achieving the highest classification performance in the corresponding cohort. The best performing method differs across cohorts. Among baselines and the best performers, bootstrapped AUC distributions demonstrate high variance across cohorts. DLS seems to perform the best in cohorts with incidental nodules. Unsurprisingly, TDViT excels in the longitudinal imaging cohort (LI-A). The box and line within the box denotes the interquartile range (IQR) and median respectively. The whiskers denote 1.5*IQR and points outside the whiskers denote outliers beyond this range.
Longitudinal or multimodal AI were top performers across all cohorts with incidental nodules (Figure 3, Figure 4). They showed better worst case performances in comparison to the other approaches (Figure 2B). Ranking the results within each cohort, we define a model’s worst case as its lowest ranked performance across all cohorts except BRONCH. The worst-case performances of DLSTM (on NLST-test-nodules: 0.73 [0.72, 0.73]), TDViT (on NLST-test-nodules: 0.79 [0.79, 0.79]), DeepLungScreening (on NLST-test-nodules: 0.8 [0.77, 0.78]), and DeepLungIPN (on Consortium-DECAMP: 0.74 [0.74, 0.75]) were all moderate in terms of absolute AUC. In contrast, the worst-case performance of Mayo, Brock, Liao et al., and Sybil were low in terms of absolute AUC.
Figure 4.

The receiver operating characteristic (ROC) curves demonstrate a failure to generalize across four select cohorts. Top performers in lung screening cohorts (A) are different than the top performers in cohorts with incidentally-detected nodules (B), and vice-versa. (C) All evaluated models performed poorly on a retrospective cohort of patients selected to undergo diagnostic bronchoscopic biopsy for a pulmonary nodule. ROC curves for remaining evaluation cohorts are provided in Supp. Fig 1.
BRONCH cohort.
Models evaluated on this cohort, representing nodules that are suspicious enough to warrant a biopsy, performed poorly with mean AUCs ranging from 0.50 to 0.62 (Figure 4).
NSCLC vs SCLC (Table 5).
Table 5:
Model Classification of lung cancer risk by cancer subtype.
| NLST-test-nodules (n malignant=147, n benign=749) | Consortium-A (n malignant=238, n benign=126) | |||
|---|---|---|---|---|
| Model | SCLC (n=18) | NSCLC (n=119) | SCLC (n=39) | NSCLC (n=194) |
| Mayo | ¶ | 0.810 [0.808, 0.812] | 0.774 [0.772, 0.776] | 0.683 [0.681, 0.685] |
| Brock | ¶ | 0.792 [0.790, 0.794] | 0.794 [0.792, 0.797] | 0.688 [0.687, 0.690] |
| Liao et al. | 0.683 [0.680, 0.687] | 0.770 [0.768, 0.771] | 0.617 [0.614, 0.620] | 0.688 [0.686, 0.690] |
| Sybil | 0.728 [0.723, 0.733] * | 0.899 [0.897, 0.900] * | 0.701 [0.698, 0.703] | 0.701 [0.699, 0.702] |
| DLSTM | 0.663 [0.658, 0.668] | 0.808 [0.806, 0.809] | 0.730 [0.726, 0.735] | 0.754 [0.751, 0.757] |
| TDViT | 0.707 [0.702, 0.711] | 0.771 [0.769, 0.773] | 0.667 [0.661, 0.673] | 0.760 [0.757, 0.763] |
| DLS | 0.659 [0.654, 0.664] | 0.792 [0.791, 0.794] | † | † |
| DLI | † | † | 0.904 [0.901, 0.907] * | 0.853 [0.851, 0.855] * |
Note.—Data are reported as bootstrapped mean area under the receiver operating characteristic curve [95% CI].
result was significantly different compared to each other method in the column for p<0.01
prohibitive class imbalance (n=5)
Missing demographic, smoking history, COPD, or CYFRA covariates
AI models discriminated NSCLC cases from benign better than SCLC cases in the lung screening setting (Sybil on NLST-test for NSCLC: 0.90 [0.90, 0.90] vs. for SCLC: 0.73 [0.72, 0.73]). In both lung screening and incidental-detected nodules, longitudinal models demonstrated better performance with NSCLC cases compared with SCLC cases (TDViT on Consortium-A for NSCLC: 0.76 [0.76, 0.76] vs. for SCLC: 0.67 [0.66, 0.67]).
5. Discussion
The most prominent result was perhaps that there was no clear winner among the models evaluated. The performance of each model varied with site and clinical setting, which reflects a moderate degree of generalization failure that is often observed in both open sourced and commercial predictive models across many medical domains 29. Those interested in using predictive models in lung cancer should be aware that these models, despite previous reports of successful external validation, most reliably achieve their expected performance when they are used in the same clinical context and site as they were developed in 30. Those involved in model deployment should consider fine-tuning models with a cohort that matches the site, clinical setting, and year-to-outcome in which the model will be used. Steps should be taken during model development to mitigate a failure to generalize when site and setting are unmatched with techniques such as image harmonization 31, fine-tuning 32, and potentially directly modeling the site-specific effects 29. These results motivate further investigation into the site- and context-specific factors that are driving a variance in performance and how they can be harmonized.
This study reveals the importance of interpreting a model’s performance relative to the performance of other models on the same cohort. Doing so revealed several findings that were sustained across cohorts. Single chest CT AI (Liao et al. and Sybil) performed on par with linear models that included nodule variables (Mayo and Brock). As demonstrated previously 9,10,15, single chest CT AI is well suited for identifying individuals at risk for lung cancer who can benefit from starting or having more frequent lung imaging. Longitudinal and multimodal models demonstrated comparatively favorable performance on incidentally-detected nodules. In contrast to other models, longitudinal and multimodal AI also appeared to be more robust across cohorts, as seen from their worst-case performances.
Given that nodules in the BRONCH cohort were inherently difficult to diagnose, the poor performance on this cohort was unsurprising. Due to missing data, we were not able to evaluate longitudinal and multimodal AI on BRONCH. A predictive model that is highly specific for lung cancer in this setting has the potential to prevent invasive management of benign nodules. Therefore, evaluation of longitudinal and multimodal AI on a retrospective cohort of biopsied nodules is a high priority area for future investigation.
Longitudinal imaging models performed better on NSCLC than SCLC. One explanation for this is that NSCLC is, on average, observed more frequently as an indeterminant nodule compared to faster progressing SCLC which is often advanced stage at first observation 33. These results warn that longitudinal imaging models may underperform on SCLC cases.
The regression calibrator improved calibration for most models evaluated on the NSLT, Consortium, and BRONCH cohorts. Calibration remained poor or became worse for models evaluated on highly imbalanced cohorts (LS-A and LI-A), which align with previous findings 34.
Within the AI approaches, leveraging additional sources complementary data appears to be an effective strategy for improving classification performance. For instance, Sybil makes use of the entire chest CT whereas Liao et al. predicts on a few ROIs, a technique that crops out portions of the lung field and discards the overall chest anatomy. Additionally, using longitudinal imaging when, when available, leads to performance gains in across most of the cohorts. The integration of two or more consecutive chest CTs allows the model to consider how imaging features change over time. The use of data from multiple modalities also appears to be effective. From a clinical perspective, the advantage of multimodality is expected, as imaging findings are often interpreted in the context of the patient’s clinical risk factors. The improved performance of longitudinal AI and multimodal AI in this study suggest that combining the two approaches is a promising direction.
We note the following limitations of this study. Since the evaluation cohorts are a few years dated, we expect different numerical results on cohorts drawn from today’s practice but a similar failure to generalize across clinical context and site. Several model-cohort evaluations were not conduced due to incomplete data. Extreme class imbalance in the models’ training cohort is another confounding factor that can affect a model’s sensitivity and specificity. This is concerning for the Brock model which was trained on a cohort with a cancer prevalence much smaller than those of other models. Other confounding sources include the differences in cohort size, scanner manufacturers, and scanner protocols 35,36. Finally, the evaluation of DeepLungIPN on its training cohort is limited because the results are from cross-validation. However, it still performed well when evaluated on a true external cohort (Consortium-B).
In summary, this study presents a comparative analysis of 8 lung cancer prediction models against 9 cohorts that represent clinical relevant use cases. Our results revealed a lack of generalized performance and that certain modeling strategies excelled in lung screening vs. incidentally-detected nodules, while all models fell short in a cohort with biopsied nodules. We highlight approaches in lung cancer predictive modeling that, if investigated further, have the potential to overcome these observed limitations.
Supplementary Material
Key Points.
Models predicting lung cancer risk from a single time point had higher area under the receiver operating characteristic curve (AUC) for patients that underwent lung cancer screening but performed worse on patients with incidentally-detected nodules relative to other models.
Longitudinal models and multimodal models had comparatively high AUCs for patients with incidentally-detected nodules, but showed lower performance than single time point models in lung cancer screening cohorts.
Both clinical variable-based models and artificial intelligence-based models performed poorly on patients with pulmonary nodules that were triaged for invasive biopsies.
6. Acknowledgements.
We extend our gratitude to Dr. A for their statistical guidance in service of this research.
Funding
This research was funded by the NIH through F30CA275020, 2U01CA152662, and R01CA253923–02, as well as NSF CAREER 1452485 and NSF 2040462. This study was also funded by the Vanderbilt Institute for Surgery and Engineering through T32EB021937–07, the Vanderbilt Institute for Clinical and Translational Research through UL1TR002243–06, and the Pierre Massion Directorship in Pulmonary Medicine.
Footnotes
Data generated or analyzed during the study are available from the corresponding author by request.
7. References
- 1.Rivera MP, Mehta AC, Wahidi MM. Establishing the Diagnosis of Lung Cancer: Diagnosis and Management of Lung Cancer, 3rd ed: American College of Chest Physicians Evidence-Based Clinical Practice Guidelines. Chest. Elsevier; 2013. May 1;143(5):e142S–e165S. [DOI] [PubMed] [Google Scholar]
- 2.Lokhandwala T, Bittoni MA, Dann RA, D’Souza AO, Johnson M, Nagy RJ, Lanman RB, Merritt RE, Carbone DP. Costs of Diagnostic Assessment for Lung Cancer: A Medicare Claims Analysis. Clin Lung Cancer [Internet]. Elsevier Inc.; 2017. Jan 1 [cited 2023 Oct 7];18(1):e27–e34. Available from: http://www.clinical-lung-cancer.com/article/S1525730416301863/fulltext [DOI] [PubMed] [Google Scholar]
- 3.Massion PP, Walker RC. Indeterminate Pulmonary Nodules: Risk for Having or for Developing Lung Cancer? Cancer Prevention Research [Internet]. American Association for Cancer Research; 2014. Dec 1 [cited 2021 Oct 5];7(12):1173–1178. Available from: https://cancerpreventionresearch.aacrjournals.org/content/7/12/1173 [DOI] [PMC free article] [PubMed] [Google Scholar]
- 4.Gould MK, Tang T, Liu ILA, Lee J, Zheng C, Danforth KN, Kosco AE, Di Fiore JL, Suh DE. Recent trends in the identification of incidental pulmonary nodules. Am J Respir Crit Care Med [Internet]. American Thoracic Society; 2015. Nov 15 [cited 2021 Nov 28];192(10):1208–1214. Available from: www.atsjournals.org [DOI] [PubMed] [Google Scholar]
- 5.Mazzone PJ, Lam L. Evaluating the Patient With a Pulmonary Nodule: A Review. JAMA [Internet]. JAMA; 2022. Jan 18 [cited 2023 May 20];327(3):264–273. Available from: https://pubmed.ncbi.nlm.nih.gov/35040882/ [DOI] [PubMed] [Google Scholar]
- 6.MacMahon H, Naidich DP, Goo JM, Lee KS, Leung ANC, Mayo JR, Mehta AC, Ohno Y, Powell CA, Prokop M, Rubin GD, Schaefer-Prokop CM, Travis WD, Van Schil PE, Bankier AA. Guidelines for management of incidental pulmonary nodules detected on CT images: From the Fleischner Society 2017. Radiology [Internet]. Radiological Society of North America Inc.; 2017. Jul 1 [cited 2021 Nov 11];284(1):228–243. Available from: https://pubs.rsna.org/doi/abs/10.1148/radiol.2017161659 [DOI] [PubMed] [Google Scholar]
- 7.Detterbeck FC, Lewis SZ, Diekemper R, Addrizzo-Harris D, Alberts WM. Executive Summary: Diagnosis and Management of Lung Cancer, 3rd ed: American College of Chest Physicians Evidence-Based Clinical Practice Guidelines. Chest [Internet]. Elsevier Inc.; 2013. May 1 [cited 2023 Oct 7];143(5):7S–37S. Available from: http://journal.chestnet.org/article/S0012369213602834/fulltext [DOI] [PubMed] [Google Scholar]
- 8.Swensen SJ, Silverstein MD, Ilstrup DM, Schleck CD, Edell ES. The Probability of Malignancy in Solitary Pulmonary Nodules: Application to Small Radiologically Indeterminate Nodules. Arch Intern Med [Internet]. American Medical Association; 1997. Apr 28 [cited 2022 Oct 17];157(8):849–855. Available from: https://jamanetwork.com/journals/jamainternalmedicine/fullarticle/623212 [PubMed] [Google Scholar]
- 9.McWilliams A, Tammemagi MC, Mayo JR, Roberts H, Liu G, Soghrati K, Yasufuku K, Martel S, Laberge F, Gingras M, Atkar-Khattra S, Berg CD, Evans K, Finley R, Yee J, English J, Nasute P, Goffin J, Puksa S, Stewart L, Tsai S, Johnston MR, Manos D, Nicholas G, Goss GD, Seely JM, Amjadi K, Tremblay A, Burrowes P, MacEachern P, Bhatia R, Tsao MS, Lam S. Probability of Cancer in Pulmonary Nodules Detected on First Screening CT. New England Journal of Medicine [Internet]. Massachusetts Medical Society; 2013. Sep 5 [cited 2023 Jun 19];369(10):910–919. Available from: https://www.nejm.org/doi/10.1056/NEJMoa1214726 [DOI] [PMC free article] [PubMed] [Google Scholar]
- 10.Tammemägi MC, Katki HA, Hocking WG, Church TR, Caporaso N, Kvale PA, Chaturvedi AK, Silvestri GA, Riley TL, Commins J, Berg CD. Selection criteria for lung-cancer screening. N Engl J Med [Internet]. N Engl J Med; 2013. Feb 21 [cited 2022 Oct 6];368(8):728–736. Available from: https://pubmed.ncbi.nlm.nih.gov/23425165/ [DOI] [PMC free article] [PubMed] [Google Scholar]
- 11.Revel MP, Bissery A, Bienvenu M, Aycard L, Lefort C, Frija G. Are Two-dimensional CT Measurements of Small Noncalcified Pulmonary Nodules Reliable? Radiology [Internet]. Radiological Society of North America ; 2004. May 1 [cited 2023 Sep 23];231(2):453–458. Available from: https://pubs.rsna.org/doi/10.1148/radiol.2312030167 [DOI] [PubMed] [Google Scholar]
- 12.Oxnard GR, Zhao B, Sima CS, Ginsberg MS, James LP, Lefkowitz RA, Guo P, Kris MG, Schwartz LH, Riely GJ. Variability of lung tumor measurements on repeat computed tomography scans taken within 15 minutes. Journal of Clinical Oncology. American Society of Clinical Oncology ; 2011. Aug 10;29(23):3114–3119. [DOI] [PMC free article] [PubMed] [Google Scholar]
- 13.Devaraj A, Van Ginneken B, Nair A, Baldwin D. Use of volumetry for lung nodule management: Theory and practice1. Radiology [Internet]. Radiological Society of North America Inc.; 2017. Sep 1 [cited 2023 Sep 23];284(3):630–644. Available from: https://pubs.rsna.org/doi/10.1148/radiol.2017151022 [DOI] [PubMed] [Google Scholar]
- 14.Liao F, Liang M, Li Z, Hu X, Song S. Evaluate the Malignancy of Pulmonary Nodules Using the 3D Deep Leaky Noisy-or Network. IEEE Trans Neural Netw Learn Syst [Internet]. Institute of Electrical and Electronics Engineers Inc.; 2017. Nov 22 [cited 2021 Aug 31];30(11):3484–3495. Available from: https://arxiv.org/abs/1711.08324v1 [DOI] [PubMed] [Google Scholar]
- 15.Mikhael PG, Wohlwend J, Yala A, Karstens L, Xiang J, Takigami AK, Bourgouin PP, Chan P, Mrah S, Amayri W, Juan YH, Yang CT, Wan YL, Lin G, Sequist LV., Fintelmann FJ, Barzilay R. Sybil: A Validated Deep Learning Model to Predict Future Lung Cancer Risk From a Single Low-Dose Chest Computed Tomography. Journal of Clinical Oncology. American Society of Clinical Oncology (ASCO); 2023. Apr 20; [DOI] [PMC free article] [PubMed] [Google Scholar]
- 16.Gao R, Tang Y, Xu K, Huo Y, Bao S, Antic SL, Epstein ES, Deppen S, Paulson AB, Sandler KL, Massion PP, Landman BA. Time-distanced gates in long short-term memory networks. Med Image Anal [Internet]. Elsevier B.V.; 2020. Oct 1 [cited 2022 May 11];65:101785. Available from: 10.1016/j.media.2020.101785 [DOI] [PMC free article] [PubMed] [Google Scholar]
- 17.Li TZ, Xu K, Gao R, Tang Y, Lasko TA, Maldonado F, Sandler KL, Landman BA. Time-distance vision transformers in lung cancer diagnosis from longitudinal computed tomography. Išgum I, Colliot O, editors. 10.1117/122653911 [Internet]. SPIE; 2023. Apr 3 [cited 2023 May 20];12464:229–238. Available from: https://www.spiedigitallibrary.org/conference-proceedings-of-spie/12464/1246412/Time-distance-vision-transformers-in-lung-cancer-diagnosis-from-longitudinal/10.1117/12.2653911.full [DOI] [PMC free article] [PubMed] [Google Scholar]
- 18.Ardila D, Kiraly AP, Bharadwaj S, Choi B, Reicher JJ, Peng L, Tse D, Etemadi M, Ye W, Corrado G, Naidich DP, Shetty S. End-to-end lung cancer screening with three-dimensional deep learning on low-dose chest computed tomography. Nature Medicine 2019. 25:6 [Internet]. Nature Publishing Group; 2019 May 20 [cited 2022 Jul 29];25(6):954–961. Available from: https://www.nature.com/articles/s41591-019-0447-x [DOI] [PubMed] [Google Scholar]
- 19.Gao R, Tang Y, Xu K, Kammer M, Antic S, Riqiang Gao al, Kammer MN, Antic SL, Deppen S, Sandler KL, Massion PP, Huo Y, Landman BA. Deep multi-path network integrating incomplete biomarker and chest CT data for evaluating lung cancer risk. 10.1117/122580730 [Internet]. SPIE; 2021. Feb 15 [cited 2023 Jun 19];11596(15):387–393. Available from: https://www.spiedigitallibrary.org/conference-proceedings-of-spie/11596/115961E/Deep-multi-path-network-integrating-incomplete-biomarker-and-chest-CT/10.1117/12.2580730.full [DOI] [PMC free article] [PubMed] [Google Scholar]
- 20.Gao R, Tang Y, Khan MS, Xu K, Paulson AB, Sullivan S, Huo Y, Deppen S, Massion PP, Sandler KL, Landman BA. Cancer risk estimation combining lung screening ct with clinical data elements. Radiol Artif Intell [Internet]. Radiological Society of North America Inc.; 2021. Nov 1 [cited 2023 Jun 19];3(6). Available from: 10.1148/ryai.2021210032 [DOI] [PMC free article] [PubMed] [Google Scholar]
- 21.Reduced Lung-Cancer Mortality with Low-Dose Computed Tomographic Screening. New England Journal of Medicine [Internet]. New England Journal of Medicine (NEJM/MMS); 2011. Aug 4 [cited 2022 Jul 13];365(5):395–409. Available from: https://www.nejm.org/doi/full/10.1056/nejmoa1102873 [DOI] [PMC free article] [PubMed] [Google Scholar]
- 22.Li TZ, Lee HH, Xu K, Gao R, Dawant BM, Maldonado F, Sandler KL, Landman BA. Quantifying emphysema in lung screening computed tomography with robust automated lobe segmentation. 10.1117/1JMI104044002 [Internet]. SPIE; 2023. Jul 18 [cited 2023 Nov 24];10(4):044002. Available from: https://www.spiedigitallibrary.org/journals/journal-of-medical-imaging/volume-10/issue-4/044002/Quantifying-emphysema-in-lung-screening-computed-tomography-with-robust-automated/10.1117/1.JMI.10.4.044002.full [DOI] [PMC free article] [PubMed] [Google Scholar]
- 23.Gao R, Tang Y, Khan MS, Xu K, Paulson AB, Sullivan S, Huo Y, Deppen S, Massion PP, Sandler KL, Landman BA. Cancer Risk Estimation Combining Lung Screening CT with Clinical Data Elements. Radiol Artif Intell [Internet]. Radiological Society of North America; 2021. Nov 1 [cited 2022 Sep 6];3(6). Available from: /pmc/articles/PMC8637232/ [DOI] [PMC free article] [PubMed] [Google Scholar]
- 24.Li TZ, Xu K, Chada NC, Chen H, Knight M, Antic S, Sandler KL, Maldonado F, Landman BA, Lasko TA. Curating Retrospective Multimodal and Longitudinal Data for Community Cohorts at Risk for Lung Cancer. medRxiv [Internet]. Cold Spring Harbor Laboratory Press; 2023. Nov 4 [cited 2023 Nov 7];2023.11.03.23298020. Available from: https://www.medrxiv.org/content/10.1101/2023.11.03.23298020v1 [DOI] [PMC free article] [PubMed] [Google Scholar]
- 25.Li TZ, Still JM, Xu K, Lee HH, Cai LY, Krishnan AR, Gao R, Khan MS, Antic S, Kammer M, Sandler KL, Maldonado F, Landman BA, Lasko TA. Longitudinal Multimodal Transformer Integrating Imaging and Latent Clinical Signatures From Routine EHRs for Pulmonary Nodule Classification. 2023. Apr 6 [cited 2023 May 20]; Available from: https://arxiv.org/abs/2304.02836v3 [DOI] [PMC free article] [PubMed]
- 26.Kammer MN, Lakhani DA, Balar AB, Antic SL, Kussrow AK, Webster RL, Mahapatra S, Barad U, Shah C, Atwater T, Diergaarde B, Qian J, Kaizer A, New M, Hirsch E, Feser WJ, Strong J, Rioth M, Miller YE, Balagurunathan Y, Rowe DJ, Helmey S, Chen SC, Bauza J, Deppen SA, Sandler K, Maldonado F, Spira A, Billatos E, Schabath MB, Gillies RJ, Wilson DO, Walker RC, Landman B, Chen H, Grogan EL, Baron AE, Bornhop DJ, Massion PP. Integrated Biomarkers for the Management of Indeterminate Pulmonary Nodules. 10.1164/rccm202012-4438OC [Internet]. American Thoracic Society; 2021. Dec 1 [cited 2023 Jun 18];204(11):1306–1316. Available from: www.healthmyne. [DOI] [PMC free article] [PubMed] [Google Scholar]
- 27.Gao R, Khan MS, Tang Y, Xu K, Deppen S, Huo Y, Sandler KL, Massion PP, Landman BA. Technical Report: Quality Assessment Tool for Machine Learning with Clinical CT. [cited 2023 Jun 13]; Available from: https://www.vumc.org/radiology/lung
- 28.The MIRC DICOM Anonymizer - MircWiki [Internet]. [cited 2023 Nov 22]. Available from: https://mircwiki.rsna.org/index.php?title=The_MIRC_DICOM_Anonymizer
- 29.Lasko TA, Strobl EV., Stead WW. Why Do Clinical Probabilistic Models Fail To Transport Between Sites? 2023. Nov 8 [cited 2023 Nov 8]; Available from: https://arxiv.org/abs/2311.04787v1 [DOI] [PMC free article] [PubMed]
- 30.Youssef Alexey, Pencina Michael, Thakur Anshul, Zhu Tingting, Clifton David, Shah Nigam H.. External validation of AI models in health should be replaced with recurring local validation. Nature Medicine 2023 29:11 [Internet]. Nature Publishing Group; 2023. Oct 18 [cited 2024 Apr 12];29(11):2686–2687. Available from: https://www.nature.com/articles/s41591-023-02540-z [DOI] [PubMed] [Google Scholar]
- 31.Hu F, Chen AA, Horng H, Bashyam V, Davatzikos C, Alexander-Bloch A, Li M, Shou H, Satterthwaite TD, Yu M, Shinohara RT. Image harmonization: A review of statistical and deep learning methods for removing batch effects and evaluation metrics for effective harmonization. Neuroimage. Academic Press; 2023. Jul 1;274:120125. [DOI] [PMC free article] [PubMed] [Google Scholar]
- 32.Li TW, Lee GC. Performance Analysis of Fine-tune Transferred Deep Learning. Proceedings of the 3rd IEEE Eurasia Conference on IOT, Communication and Engineering 2021, ECICE 2021. Institute of Electrical and Electronics Engineers Inc.; 2021;315–319. [Google Scholar]
- 33.Rudin CM, Brambilla E, Faivre-Finn C, Sage J. Small-cell lung cancer. Nature Reviews Disease Primers 2021 7:1 [Internet]. Nature Publishing Group; 2021. Jan 14 [cited 2023 Nov 13];7(1):1–20. Available from: https://www.nature.com/articles/s41572-020-00235-0 [DOI] [PMC free article] [PubMed] [Google Scholar]
- 34.Meelis Kull TMSFPFlach. Beyond sigmoids: How to obtain well-calibrated probabilities from binary classifiers with beta calibration. Electron J Stat. 2017;11(2):5052–5080. [Google Scholar]
- 35.Li Y, Lu L, Xiao M, Dercle L, Huang Y, Zhang Z, Schwartz LH, Li D, Zhao B. CT Slice Thickness and Convolution Kernel Affect Performance of a Radiomic Model for Predicting EGFR Status in Non-Small Cell Lung Cancer: A Preliminary Study. Scientific Reports 2018 8:1 [Internet]. Nature Publishing Group; 2018. Dec 17 [cited 2023 Sep 23];8(1):1–10. Available from: https://www.nature.com/articles/s41598-018-36421-0 [DOI] [PMC free article] [PubMed] [Google Scholar]
- 36.Choe J, Lee SM, Do KH, Lee G, Lee JG, Lee SM, Seo JB. Deep Learning–based Image Conversion of CT Reconstruction Kernels Improves Radiomics Reproducibility for Pulmonary Nodules or Masses. Radiology [Internet]. Radiological Society of North America Inc.; 2019. Jun 18 [cited 2023 Sep 23];292(2):365–373. Available from: https://pubs.rsna.org/doi/10.1148/radiol.2019181960 [DOI] [PubMed] [Google Scholar]
- 37.Billatos E, Duan F, Moses E, Marques H, Mahon I, Dymond L, Apgar C, Aberle D, Washko G, Spira A. Detection of early lung cancer among military personnel (DECAMP) consortium: Study protocols. BMC Pulm Med [Internet]. BioMed Central Ltd.; 2019. Mar 7 [cited 2023 Jun 14];19(1):1–9. Available from: https://bmcpulmmed.biomedcentral.com/articles/10.1186/s12890-019-0825-7 [DOI] [PMC free article] [PubMed] [Google Scholar]
- 38.McWilliams A, Tammemagi MC, Mayo JR, Roberts H, Liu G, Soghrati K, Yasufuku K, Martel S, Laberge F, Gingras M, Atkar-Khattra S, Berg CD, Evans K, Finley R, Yee J, English J, Nasute P, Goffin J, Puksa S, Stewart L, Tsai S, Johnston MR, Manos D, Nicholas G, Goss GD, Seely JM, Amjadi K, Tremblay A, Burrowes P, MacEachern P, Bhatia R, Tsao MS, Lam S. Probability of Cancer in Pulmonary Nodules Detected on First Screening CT (BROCK). 10.1056/NEJMoa1214726 [Internet]. Massachusetts Medical Society; 2013. Sep 4 [cited 2021 Aug 31];369(10):910–919. Available from: https://www.nejm.org/doi/full/10.1056/NEJMoa1214726 [DOI] [PMC free article] [PubMed] [Google Scholar]
- 39.Kammer MN, Kussrow AK, Webster RL, Chen H, Hoeksema M, Christenson R, Massion PP, Bornhop DJ. Compensated Interferometry Measures of CYFRA 21–1 Improve Diagnosis of Lung Cancer. ACS Comb Sci [Internet]. American Chemical Society; 2019. [cited 2023 Jun 18]; Available from: https://pubs.acs.org/doi/full/10.1021/acscombsci.9b00022 [DOI] [PubMed] [Google Scholar]
Associated Data
This section collects any data citations, data availability statements, or supplementary materials included in this article.