Abstract
The manganese-containing superoxide dismutase (MnSOD) of Vibrio vulnificus, normally detected after the onset of the stationary phase, is expressed during the lag that immediately follows the transfer of cells grown exponentially to a fresh medium acidified to pH 5.0, whereas Fe-containing SOD is constitutively expressed. The signal triggering the growth lag and MnSOD induction therein is not low pH but intracellular superoxide accumulated under these conditions, since addition of a superoxide scavenger not only shortened the lag but also abrogated the MnSOD induction. If the lysine decarboxylase reaction proceeds in the presence of sufficient lysine, the broth is rapidly neutralized to abolish the generation of oxidative stress. Accordingly, the acid tolerance response was examined without the addition of lysine. SoxR regulates MnSOD induction. Lack of MnSOD caused by mutations in soxR or sodA resulted in low tolerance to low pH. The fur mutant derepressing MnSOD showed better tolerance than the wild type. Thus, an increase in total cytosolic SOD activity through MnSOD induction is essential for the cell to withstand the acid challenge. The contribution of cuprozinc-containing SOD to acid tolerance is not significant compared with those of cytosolic SODs.
Vibrio vulnificus, a halophilic estuarine bacterium, is a virulent pathogen which can cause food-borne gastroenteritis or infect an open wound that is exposed to seawater harboring the organism. Among individuals with chronic liver disease, it can infect the bloodstream, causing a severe illness characterized by fever and chills, decrease in blood pressure (septic shock), and skin breakdown. A rapidly progressing, fulminating septicemia can result in death (for a review, see reference 3). V. vulnificus may travel through the acidic environment of the stomach to colonize the intestinal lumen. The bacterium, however, is sensitive to the acidic gastric fluid. Thus, the ability to tolerate gastric acidity is necessary for the pathogen to cause food-borne infections.
Upon exposure of enteric bacteria to low pH, several physiological responses ensue to cope with the acid stress. These responses contribute to the virulence of pathogens, including Escherichia coli and Vibrio cholerae (26, 30, 45). Multiple effects of acid stress on gene expression have been documented in E. coli (for a review, see reference 4). One of the most striking responses to low external pH is the generation of amines (γ-aminobutyrate, cadaverine, agmatine, and putrescine) and CO2 by amino acid decarboxylases in the presence of their respective substrates (glutamate, lysine, arginine, and ornithine, respectively). Concomitant with the production and excretion of amines is some neutralization of the external pH, thus protecting cells from the acid stress (34, 48). The inhibition of porins by excreted cadaverine, and thereby porin-mediated outer membrane permeability as well, has been proposed as another mechanism that provides E. coli with the ability to survive in an acidic environment (41, 42). The induction of cadBA coding for a lysine-cadaverine antiporter (CadB) and a lysine decarboxylase (CadA) has been well illustrated as an acid pH-dependent response in E. coli and V. cholerae (30, 48). CadC, a membrane-bound protein whose gene lies upstream from cadBA, has been identified as a positive regulator of cadBA expression (31, 34). A contribution of CadBA to acid tolerance has also been demonstrated in V. vulnificus (40).
The system responsible for pH homeostasis of Salmonella enterica serovar Typhimurium during exposure to low pH is composed of a complex cascade of acid shock proteins (ASPs) that are thought to contribute to survival in an acidic environment (10). Several inducible amino acid decarboxylases are also included among the ASPs. Lysine decarboxylase, which contributes to pH homeostasis, is required for acid survival of S. enterica serovar Typhimurium (38). The acid tolerance response of S. enterica serovar Typhimurium is under the positive control of two global regulators, the iron-regulatory protein Fur (ferric uptake regulation) and an alternative sigma factor, σs (11, 24).
Interestingly, manganese-containing superoxide dismutase (MnSOD) is found among ASPs when bacterial cells, such as those of Staphylococcus aureus, Streptococcus oralis, and Streptococcus mutans, are exposed to low pH (7, 50, 51). An S. aureus sodA mutant lacking MnSOD was less able to survive acid stress (7). The precise mechanisms by which MnSOD is induced and involved in acid tolerance are not known. MnSOD and Fe-containing superoxide dismutase (FeSOD), key enzymes in the defense against the oxidative damage by superoxide (6), often have been found in the cytoplasm of prokaryotic cells (49), whereas copper- and zinc-containing superoxide dismutase (CuZnSOD) has been found in the periplasm of several gram-negative bacteria, such as E. coli (14).
FeSOD of V. vulnificus is constitutively expressed, but its MnSOD is detected when iron is limited in culture medium, suggestive of Fur-mediated expression of MnSOD (19). We found that MnSOD is also induced under acidic conditions. When growing cells of V. vulnificus were transferred to medium acidified to pH 5.0, cell growth temporarily ceased (ca. 2- to 3-h lag). The cellular superoxide level was increased during the lag, and MnSOD was induced by the control of SoxR. In an effort to understand the contributions of SODs to acid tolerance of this pathogen, sod expression and the survival of sod mutants were examined under acidic conditions. The increase in cytosolic SOD activities through MnSOD induction appears to be important for cell survival at acidic pH.
MATERIALS AND METHODS
Bacterial strains, plasmids, and growth conditions.
The strains and plasmids used in this study are listed in Table 1. V. vulnificus was grown at 30°C in Luria-Bertani (LB) medium (43) supplemented with 2% (wt/vol) NaCl (LBS), whose pH had been adjusted to pH 7.5. E. coli was grown at 37°C in LB. Cells harboring antibiotic resistance genes were selected using appropriate antibiotics; chloramphenicol (Cm), kanamycin (Km), tetracycline (Tc), and rifampin (Rif) were used at 2, 150, 2, and 50 μg/ml, respectively, for V. vulnificus, whereas ampicillin, streptomycin (Sm), spectinomycin (Sp), Cm, Km, and Tc (final concentrations of 50, 25, 20, 25, 25, and 10 μg/ml, respectively) were used for E. coli. Cell growth was monitored by measuring the culture absorbance at 600 nm (A600). If the A600 of the V. vulnificus culture was larger than 0.7, it was diluted prior to measurement.
TABLE 1.
Bacterial strains and plasmids used in this study
| Strain or plasmid | Relevant characteristic(s) | Reference or source |
|---|---|---|
| Bacterial strains | ||
| V. vulnificus | ||
| ATCC 29307 | Type strain | 21 |
| AR | ATCO 29307, Rifr | 23 |
| HLM101 | MO6-24/O, Δfur, fur::aph; Kmr | 23 |
| FSA1 | MO6-24/O, Δfur, ΔsodA; Kmr | This study |
| KPR101 | AR, ΔrpoS | 37 |
| SA1 | AR, sodA::aph; Kmr | This study |
| SB1 | AR, sodB::aph; Kmr | This study |
| SC1 | AR, sodC::aph; Kmr | This study |
| SR1 | AR, soxR::aph; Kmr | This study |
| JR203 | ATCC 29307, cadA::npt; Kmr | 40 |
| E. coli | ||
| DH5α | supE44 ΔlacU169 (φ80 lacZ ΔM15) hsdR17 recA1 endA1 gyrA96 thi-1 relA1 | 12 |
| S17-1 | C600::RP4 2-(Tc::Mu)(Km::Tn7) thi pro hsdR hsdM+recA | 46 |
| S17-1λpir | λpir lysogen of S17-1 | 46 |
| BL21(DE3) | E. coli B F−dcm ompT hsdS(rB− mB−) gal λ(DE3) | Stratagene |
| Plasmids | ||
| pRK415 | ori IncP Mob RP4 lacZa; Tcr | 16 |
| pSODAC | pRK415 + sodA::cat fusion; Tcr | This study |
| pDM4 | ori R6K Mob RP4; Cmr | 32 |
| pDMSAKm | pDM4 + 3.0-kb fragment containing sodA::aph; Kmr, Cmr | This study |
| pDMSAid | pDM4 + ΔsodA; 0.6-kb XbaI-XhoI fragment of pSAid; internally deleted (BglII-StuI) from sodA; Cmr | This study |
| pDMSB | pDM4 + 3.1-kb fragment containing sodB::aph; Kmr, Cmr | This study |
| pDMSC | pDM4 + 3.1-kb fragment containing sodC::aph; Kmr, Cmr | This study |
| pDMSXR | pDM4 + 2.8-kb fragment containing soxR::aph; Kmr, Cmr | This study |
| pRKSA | pRK415 + 0.8-kb fragment containing sodA; Tcr | This study |
| pRKSB | pRK415 + 0.8-kb fragment containing sodB; Tcr | This study |
| pRKSC | pRK415 + 1.1-kb fragment containing sodC; Tcr | This study |
For growth transition, cells were first grown in LBS (pH 7.5) with sufficient aeration (35-ml culture in 300-ml flask at 250-rpm shake) up to logarithmic growth phase (A600, ∼2.0). An aliquot (0.5 ml) was then harvested and inoculated into LBS (pH 5.0) after a brief wash with the medium. The initial A600 value was generally close to 0.1. Cells were incubated with shaking as described above, and aliquots were taken intermittently for the measurement of cell growth, pH, SOD activity, and MnSOD expression, using sodA::cat fusion (see below). The same transfer to LBS (pH 7.5) was included as a control. The experiments were repeated three times, yielding similar results; a typical experiment is shown. In this work a pH of 5.0 was chosen deliberately to monitor the adaptive responses of cells to an acidic environment wherein they could still grow. At a pH less than 4.0, cell death occurs.
Conjugation.
pRK415- and pDM4-derived plasmids were transformed into E. coli S17-1 and S17-1λpir, respectively, and were subsequently mobilized into V. vulnificus by conjugation as described previously with minor modification (37). E. coli and V. vulnificus were grown exponentially until the A600 values reached 1.0 and 2.0, respectively. The donor (100 μl) and recipient (200 μl) were mixed, washed two times with LB, spotted on LB agar, and incubated at 37°C for 8 h. The mixture was suspended in an appropriate volume of LBS following a brief wash with the medium and plated on thiosulfate-citrate-bile salts-sucrose agar (5) to select V. vulnificus or on LBS containing Rif to select V. vulnificus AR.
Detection and quantification of SOD activity.
Preparation of cell extracts, electrophoresis of a native polyacrylamide (12%) gel, and staining of SOD activity were performed as described previously (2). Cytosolic SOD activities in cell extracts were determined as described previously (29). KCN (2 mM) was included in the reaction mixture to inhibit CuZnSOD. The relative SOD levels between samples were also quantified by scanning the activity-stained gel using the Tina 2.0 program of a BIO-Imaging analyzer (FUJI, Japan). Proteins were determined by a modified Lowry method using bovine serum albumin as a standard (28).
Construction of sodA::cat fusion and chloramphenicol acetyltransferase (CAT) assay.
A 1.6-kb XbaI/BamHI DNA fragment containing cat from the pCAT-basic vector (Promega, Madison, WI) was cloned into pRK415 to generate pRKCAT. A 452-bp DNA fragment extending from −407 to 45 relative to the MnSOD initiation codon was PCR amplified using two primers: the forward primer, 5′-CTAAGCTGCAGATGAGC-3′ (mutated sequence underlined, unless otherwise noted), containing the PstI site (in bold), and the reverse primer, 5′-GTATGGCTCTAGAGCATCG-3′, containing the XbaI site (in bold). The PCR product was examined through DNA sequence analyses, digested with PstI and XbaI, and cloned into PstI/XbaI sites of pRKCAT to generate a sodA::cat fusion of pSODAC. The recombinant plasmid was mobilized through conjugation into V. vulnificus as described above.
The CAT assay was performed as described previously (44). The reaction mixture consisted of 0.1 mM acetyl-coenzyme A, 1 mM 5,5′-dithiobis-2-nitrobenzoic acid, 0.25 mM Cm in 1 ml 100 mM Tris-HCl (pH 7.8). The reaction was initiated by adding 20 μl cell extracts, followed by incubation at 30°C for 3 min, and monitored by measuring the absorbance at 412 nm. Activity was expressed as nmol Cm acetylated min−1 mg protein−1 (44).
RNA isolation and Northern (RNA) hybridization analysis.
Total RNA from V. vulnificus was extracted using a TRI reagent kit (MRC, Cincinnati, Ohio) according to the manufacturer's procedure. RNA quantification, electrophoretic separation of denatured RNA, blot transfer, labeling of the strand-specific RNA probe using [α-32P]CTP, and hybridization with the probe were performed as described previously (17, 18).
Primer extension analysis.
The primer 5′-GATGCTCAAGCTCACTG-3′, representing the coding strand of sodA between the 45th and 51st codons, was labeled with [γ-32P]ATP using T4 polynucleotide kinase (Promega, Madison, WI). Total RNA from V. vulnificus at early stationary phase (A600, ∼7.0) was used for the extension reaction (17), and the products were analyzed on an 8.3 M urea-8% polyacrylamide sequencing gel. The nucleotide sequence was determined by the dideoxy termination reaction with a Thermo Sequenase cycle sequencing kit (Amersham Pharmacia Biotech, Cleveland, Ohio).
Construction of mutants. (i) DNA for sodA disruption.
A 761-bp DNA fragment extending from −114 to 647 relative to the MnSOD initiation codon was PCR amplified from genomic DNA using forward (5′-GTTGCGAGTCACCATTAC-3′) and reverse (5′-CGATAAGCGCACGGTGCTC-3′) primers and cloned into pGEM-T (Promega, Madison, WI) to generate pBSA. The PstI site (66th residue) within sodA was interrupted with 2.2-kb Ω DNA (Kmr) (8), and the resulting 3.0-kb XbaI/XhoI fragment was cloned into the suicide vector pDM4 (32) to generate pDMSAkm.
For internal deletion of sodA on the chromosome of HLM101 (fur::aph; Kmr) (23), a 173-bp BglII-StuI DNA (residues between 55th and 113th) within sodA was deleted from pBSA, followed by fill-in and ligation, and the resulting 0.6-kb XbaI/XhoI fragment was cloned into pDM4 to yield pDMSAid.
(ii) DNA for sodB disruption.
A 909-bp DNA fragment extending from −284 to 625 relative to the FeSOD initiation codon was PCR amplified from genomic DNA using a forward (5′-GCTTCCTCGTTCACGG-3′) and reverse (5′-CTAAATTGGAACTTAAG-3′) primers and cloned into pGEM-T. The XbaI site (57th residue) of sodB was interrupted with Ω DNA (Kmr), and the resulting 3.1-kb SacI/XhoI DNA fragment was cloned into pDM4 to yield pDMSB.
(iii) DNA for sodC disruption.
From the cosmid library of V. vulnificus genomic DNA, a 1.1-kb BglII-MboI DNA fragment encompassing sodC coding for CuZnSOD was cloned into pGEM-T. The NsiI site (122nd residue) of sodC was interrupted with Ω DNA (Kmr), and the resulting 3.1-kb SacI/XbaI DNA fragment was cloned into pDM4 to yield pDMSC.
(iv) DNA for soxR disruption.
A 585-bp DNA fragment extending from −80 to 505 relative to the SoxR initiation codon was PCR amplified from genomic DNA using a forward (5′-GCTCAACTTAACTTGAGG-3′) and reverse (5′-CTTGCCACCGCAAACGC-3′) primers and inserted into pGEM-T. The HincII site (17th residue) of soxR was interrupted with Ω DNA (Kmr), and the resulting 2.8-kb XbaI/XhoI DNA fragment was cloned into pDM4 to generate pDMSXR.
(v) Mutant selection.
pDM4-derived recombinant plasmids were mobilized into V. vulnificus AR (for pDMSAkm, pDMSB, pDMSC, and pDMSXR) and V. vulnificus HLM101 (for pDMSAid) through conjugation as described above. Conjugants carrying a single crossover were selected using Cm. The mutants showing indications of double crossover (Cms) were isolated in the presence of 10% sucrose. The chromosomal structures of the mutants were examined by Southern hybridization analysis (43).
Measurement of intracellular superoxide level.
Cells were harvested, washed with phosphate-buffered saline (PBS) (43), and suspended in 50 mM potassium phosphate buffer (pH 7.3) supplemented with 2% NaCl. Cells (20 μl) were put in 0.4 ml of buffer containing 20 μl 2 mM bis-N-methylacridinium nitrate (lucigenin) (Sigma, St. Louis, MO), and luminescence was immediately measured using MicroLumatPlus LB 96V (Berthold Technologies GmbH & Co. KG) as described previously (27). The instrument was operated with a 5-s delay and 10-s integration time.
Lysine decarboxylase activity and cadaverine determination.
The lysine decarboxylase activity of V. vulnificus and the cadaverine excreted in culture medium were assayed as described previously (25, 40). The enzyme reaction was monitored by measuring the absorbance at 340 nm. Specific activities were calculated as 1,000 × A340 per min (units) per A600 (25).
Survival at acid pH.
Acid tolerance was examined as described previously (40). Cells were grown to logarithmic phase (A600, ∼2.0) in LBS (pH 7.5), harvested, washed with 10 mM sodium citrate buffer (pH 5.0) supplemented with 2% NaCl (SCBN) (40), and suspended in the same buffer to a final concentration of 105 CFU ml−1. A control experiment was performed at pH 7.5, in which PBS (pH 7.5) was used instead of SCBN. Cell suspensions were incubated at 30°C with shaking as described above for cell growth. Samples were taken intermittently for 90 min, and viable counts (CFU/ml) were determined by plating dilutions of cells on LBS (pH 7.5) agar plates. Survival was expressed as a percentage of the initial CFU. Data shown are representatives of triplicate experiments.
RESULTS
MnSOD expression of V. vulnificus is regulated transcriptionally.
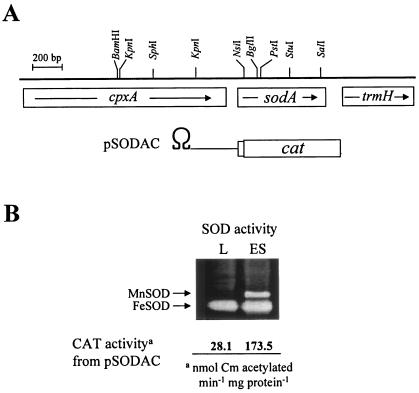
A constitutively expressed FeSOD is found in the cytoplasm of V. vulnificus together with an inducible MnSOD, which is expressed from the onset of stationary phase (Fig. 1B). Unlike E. coli, no MnSOD activity is found during the exponential growth of V. vulnificus. The bacterium also has a CuZnSOD in its periplasm, but its level is not high enough to appear on native gel with the amounts of proteins loaded. The sodA::cat transcriptional fusion construct, pSODAC (Fig. 1A), was maintained in trans in wild-type cells, and CAT activity was measured (Fig. 1B). The CAT activity from pSODAC at early stationary phase was approximately sixfold higher than in logarithmic phase. Thus, the growth-dependent expression of MnSOD appears to be regulated transcriptionally.
FIG. 1.
CAT activities from sodA::cat fusion and expression of cytosolic SODs of V. vulnificus. (A) pSODAC has an insert in which sodA regulatory DNA is transcriptionally fused to cat and cloned downstream from transcription-translation stop Ω DNA (Smr/Spr) (36). cpxA coding for a sensor of the Cpx two-component system perceiving cell envelope stress and trmH coding for tRNA methyltransferase are shown. (B) Activities of MnSOD and FeSOD in extracts of V. vulnificus cells at logarithmic (L) (A600, ∼2.0) and early stationary (ES) (A600, ∼7.0) growth phases. The same amount of protein (50 μg) was loaded in each lane unless stated otherwise. CAT activities from pSODAC in the wild type harvested at the growth phases indicated are illustrated below the gel.
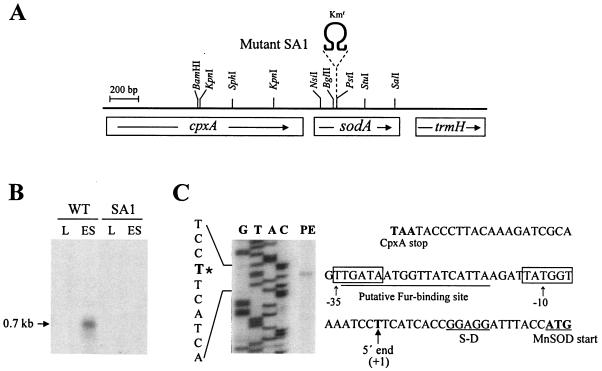
A 0.7-kb transcript was detected after hybridization of a sodA-specific probe to the total RNA from cells harvested at early stationary phase, whereas it was barely detectable from exponentially growing cells (Fig. 2B). No such transcript was found in the sodA mutant SA1 (Fig. 2A and B). The 5′ end of the transcript was mapped at 21 nucleotides upstream from the MnSOD initiation codon (Fig. 2C). Canonical sequences typical of σ70-type promoters were found, and a putative binding site of ferric uptake regulator (Fur) (35), a repressor for sodA transcription in the presence of the Fe2+ ion, is located in the promoter region (Fig. 2C).
FIG. 2.
sodA transcription. (A) sodA coding for MnSOD was interrupted with Ω DNA (Kmr) to generate mutant SA1. A 0.7-kb sodA transcript is indicated by an arrow below the restriction map. (B) Northern blot hybridization analysis with [α32P]CTP-labeled RNA probes corresponding to a 520-bp NsiI-SalI DNA fragment specific to sodA. RNA was prepared from the wild type and SA1. L and ES denote the growth phases, as described in the Fig. 1 legend. (C) Mapping of 5′ end of sodA transcript by primer extension. Extension with RNA from the wild type at ES growth phase is shown in lane PE. The same 32P-labeled oligonucleotide was used to generate the sequence ladder (lanes G, T, A, and C). DNA sequence is illustrated on the left, with the 5′ end of the transcript marked with an asterisk. The sodA regulatory DNA between the CpxA stop and MnSOD initiation codons is shown on the right. The −35 and −10 sequences typical of σ70-type promoter (5′ end [T] of the transcript: +1) are boxed, and a putative binding site of the ferric uptake regulator (Fur) is underlined. A putative ribosome-binding site (S-D) is also shown.
MnSOD expression, positively regulated by SoxR and negatively regulated by Fur, is not affected by RpoS.
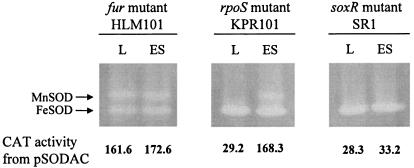
MnSOD activity was not detected in extracts of the soxR mutant SR1 (Fig. 3), which indicates that SoxR is required as a transcriptional activator as in E. coli (52). Likewise, the CAT activity from pSODAC in the soxR mutant was not induced (Fig. 3). It was tested whether the alternative sigma factor σs, a globular regulator (20) for stress resistance in many bacteria, including V. vulnificus (37), affects sodA expression. The CAT activities from pSODAC and MnSOD expression in the rpoS mutant KPR101 (Fig. 3) were the same as those in the wild type (Fig. 1B), which suggests that RpoS does not affect sodA expression even though MnSOD of V. vulnificus is expressed in stationary phase. FeSOD levels were unaffected by mutations in soxR and rpoS. In the fur mutant HLM101, sodA expression was derepressed even during exponential growth, as revealed by the activities of CAT and MnSOD (Fig. 3). The FeSOD activity of HLM101 was reduced to approximately 40% of that of the wild type. Thus, Fur, a repressor for sodA transcription, appears to act as an activator for sodB transcription.
FIG. 3.
Expression of cytosolic SODs and CAT activities from sodA::cat fusion in HLM101, KPR101, and SR1. L and ES denote the growth phases, as described in the Fig. 1 legend. The CAT activity unit is the same as in Fig. 1 unless otherwise specified.
Growth lag and MnSOD induction therein are triggered by superoxide accumulated upon cell exposure to low pH.
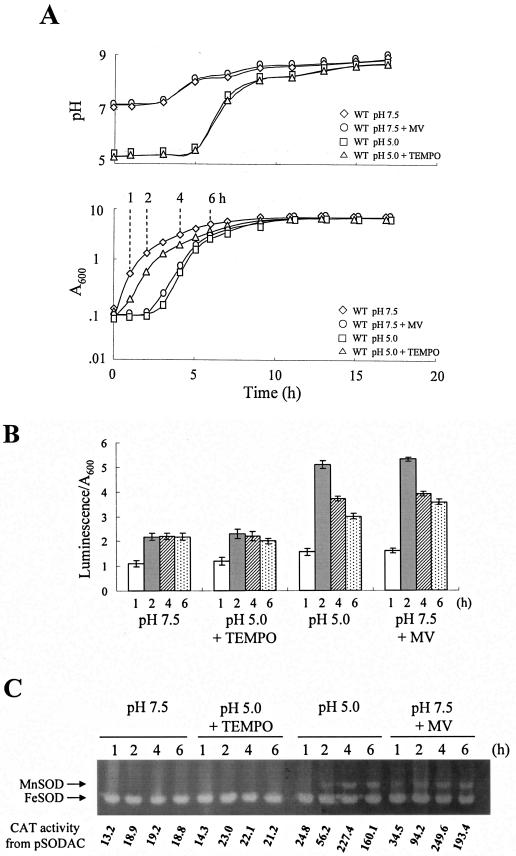
Fresh LBS whose pH had been adjusted to 5.0 was inoculated with V. vulnificus grown exponentially at pH 7.5, as described in Materials and Methods. The cells showed a growth lag of approximately 3 h, whereas no lag was observed after transition to LBS (pH 7.5) (Fig. 4A). The medium pH increased toward alkalinity during late exponential growth (Fig. 4A). The cellular superoxide level, as determined using lucigenin, increased after transition to the low pH, which was approximately twofold higher than that measured after transition to pH 7.5 (Fig. 4B). MnSOD activity, once induced during the lag (Fig. 4C), increased up to a level comparable to that observed at the early stationary growth phase (compare Fig. 4C with Fig. 1B), whereas it was barely detectable at pH 7.5 (Fig. 4C). The CAT activity from pSODAC reflecting transcriptional control of MnSOD expression paralleled enzyme activity (Fig. 4C). Addition of 4-hydroxy-2,2,6,6-tetramethylpiperidine-N-oxyl (TEMPO), a superoxide scavenger that can freely pass into the cell (22, 47), lowered the superoxide level (Fig. 4B). The scavenger not only shortened the lag (Fig. 4A) but also abolished MnSOD induction (Fig. 4C). The broth pH was not affected by TEMPO (Fig. 4A). The MnSOD expression was induced at pH 7.5 in the presence of a superoxide generator, methyl viologen (MV) (Fig. 4C), which also resulted in growth lag (Fig. 4A). The broth pH was not changed by MV (Fig. 4A). Thus, it appears that MnSOD induction of V. vulnificus is not controlled by low pH but by superoxide accumulated in cells under acidic conditions.
FIG. 4.
Growth, cellular superoxide level, and SOD expression of the wild type after transition to LBS adjusted to pHs 7.5 and 5.0. (A) Cell growth and pH curves of the culture broth after transition to LBS (pH 7.5) (⋄), LBS (pH 7.5) containing 3 mM MV (○), LBS (pH 5.0) (□), or LBS (pH 5.0) supplemented with 1 mM TEMPO (▵). Time points (1, 2, 4, and 6 h) to harvest cells for the assay of superoxide level and MnSOD expression are indicated. (B) Detection of cellular superoxide using lucigenin. Cells were harvested at 1 (white bar), 2 (shaded bar), 4 (hatched bar), and 6 h (dotted bar). The standard deviations of the luminescence are shown on each bar. (C) Expression of cytosolic SODs and CAT activity from sodA::cat fusion were determined with cells harvested at the time points indicated.
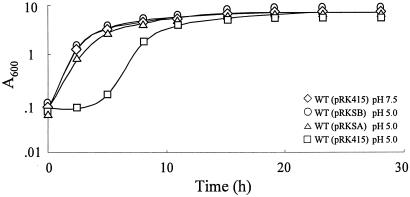
If superoxide accumulated at low pH inhibits cell growth, the growth lag should disappear by increasing SOD activities in the cytosol. sodA and sodB were cloned in downstream of the lac promoter of pRK415 and were maintained in trans in the wild type. A significant level of MnSOD, comparable to that found in the wild type at the early stationary phase, was expressed in cells containing pRKSA even during exponential growth, and an approximately twofold-higher level of FeSOD was constitutively expressed in cells containing pRKSB (data not shown). No growth lag was observed when cells containing pRKSA and pRKSB were transferred to low pH (Fig. 5). The broth pH was not affected by sod genes in trans (data not shown). Therefore, temporary cessation of cell growth at low pH is due to intracellular superoxide accumulated under the acidic conditions.
FIG. 5.
Growth of the wild type containing sod genes in trans after transition to LBS (pH 5.0). Growth of the wild type containing sodB (○), sodA (▵), and vector (pRK415) (□) in trans. The wild type containing pRK415 transferred to LBS (pH 7.5) (⋄) is included as a control.
Lysine decarboxylase reaction abolishes acid stress by rapid neutralization of the culture broth.
It was determined whether MnSOD expression is affected by the reaction catalyzed by lysine decarboxylase, since the activity is associated with neutralization of the culture broth (34, 48). Lysine decarboxylase activity increased up to approximately 55 units at its maximum level at 2 h after transfer to low pH (Table 2). However, approximately 20-fold-lower activity was detected with transfer to pH 7.5 (Table 2). Thus, the enzyme was induced during the lag after transition to low pH.
TABLE 2.
Lysine decarboxylase activities of the wild type and cadA mutant JR203 in LBS (pH 7.5) and LBS (pH 5.0) after growth transition
| Strain | pHa | Lysine decarboxylase activity (units A600−1) atb:
|
|||
|---|---|---|---|---|---|
| 1 | 2 | 4 | 6 | ||
| WTd | 7.5 | 0.0 | 2.6 | 1.2 | 0.4 |
| WT | 5.0 | 22.0 | 55.2 | 26.2 | 21.6 |
| WTc | 5.0 | 35.2 | 123.0 | 51.8 | 44.2 |
| JR203 | 7.5 | 0.0 | 0.1 | 0.0 | 0.0 |
| JR203 | 5.0 | 0.0 | 1.8 | 0.2 | 0.2 |
| JR203 | 5.0 | 0.0 | 1.7 | 0.2 | 0.2 |
Medium pH after transition.
1, 2, 4, and 6 denote the time points (h) following the transition.
Lysine (15 mM) was added to the medium right after the transition.
WT, wild type.
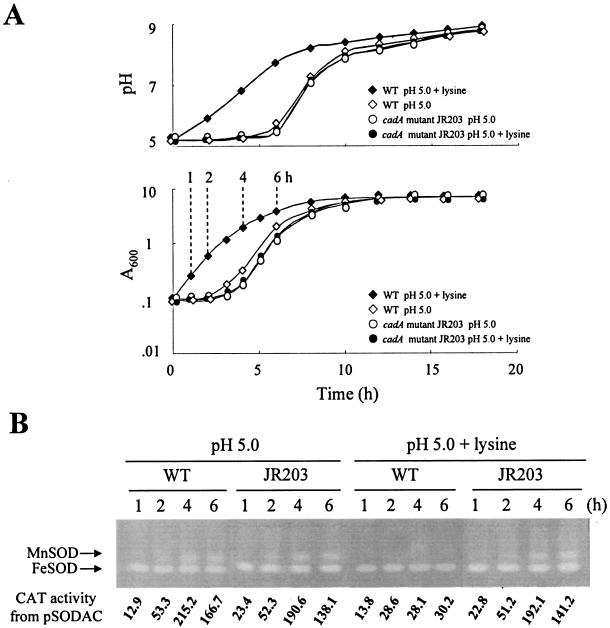
Lysine decarboxylase activity was barely detectable in the cadA mutant JR203 (Table 2), which indicates that the activity is specific to CadA, although another enzyme (or homolog) was proposed from the residual activity in JR203 (40). The mutant at low pH showed a 3- to 4-h lag, which is similar to that of the wild type (Fig. 6A, pH 5.0). The pH curves and the MnSOD expressions of the mutant were not different from those of the wild type (Fig. 6A and B, pH 5.0). However, the effect of the lysine decarboxylase reaction on pH homeostasis was valid when lysine (15 mM), known to induce the enzyme in E. coli via the periplasmic domain of CadC (32), was added to LBS (pH 5.0). The maximum level of enzyme activity of the wild type increased approximately twofold over that measured without lysine addition (Table 2). The production and excretion of cadaverine, whose concentration increased by approximately fourfold (1,186 ± 18 μM), was accompanied by rapid neutralization of the culture broth (Fig. 6A, pH 5.0, plus lysine). The cellular superoxide level of the wild type did not increase under the conditions (data not shown), which resulted in neither growth lag nor MnSOD induction (Fig. 6A and B, pH 5.0, plus lysine). Such results were not observed with JR203. Thus, the lysine decarboxylase reaction prevents generation of oxidative stress by rapid neutralization of the culture broth. The acid tolerance response was examined without lysine addition. A pH rise during late exponential growth of JR203 also suggests a lysine decarboxylase-independent mechanism(s) for neutralization of the extracellular medium, which remains to be determined.
FIG. 6.
Growth and SOD expression of the wild type and a cadA mutant after transition to LBS (pH 5.0) supplemented with lysine (15 mM). (A) Cell growth and pH curves of the culture broth of the wild type (⋄, ♦) and JR203 (○, •) without (open) or with (closed) lysine. Time points (1, 2, 4, and 6 h) to harvest cells for the assay of MnSOD expression are indicated. (B) Expression of cytosolic SODs and CAT activities from sodA::cat fusion in cells harvested at the time points indicated.
MnSOD induction at low pH is regulated through SoxR.
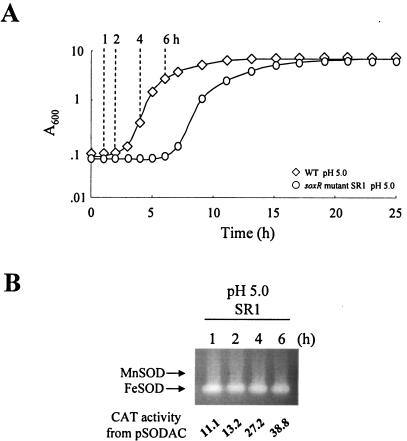
When SoxR, the positive regulator for sodA expression (52), was deleted, the mutant showed a growth lag extended to 7 h following the transfer to low pH (Fig. 7A). The medium pH increased toward alkalinity during late exponential growth (data not shown). A similar lag was observed with the sodA mutant SA1 (data not shown). Thus, the lack of MnSOD expression extended the growth lag at low pH. Neither the CAT activity from pSODAC nor MnSOD was induced in the soxR mutant SR1 (Fig. 7B), illustrating that MnSOD induction at low pH is regulated by SoxR.
FIG. 7.
Growth and SOD expression of soxR mutant after transition to LBS (pH 5.0). (A) Cell growth of SR1 (○). The wild type (⋄) after transition to the same medium is included for comparison. Time points (1, 2, 4, and 6 h) to harvest cells for the assay of MnSOD expression are indicated. (B) Expression of cytosolic SODs and CAT activities from sodA::cat fusion in SR1 harvested at the time points indicated.
Survival of V. vulnificus defective in cytosolic SOD expression is significantly affected at low pH.
Although the lag period at low pH was significantly affected by oxidative stress, it cannot be a measure for acid tolerance, as illustrated by the cadA mutant JR203. Although the lag of JR203 at low pH was comparable with that of the wild type (Fig. 6A), its acid tolerance was approximately 10-fold lower than that of the wild type (40). Thus, percent survival was determined as described in Materials and Methods for quantitative measurement of acid tolerance.
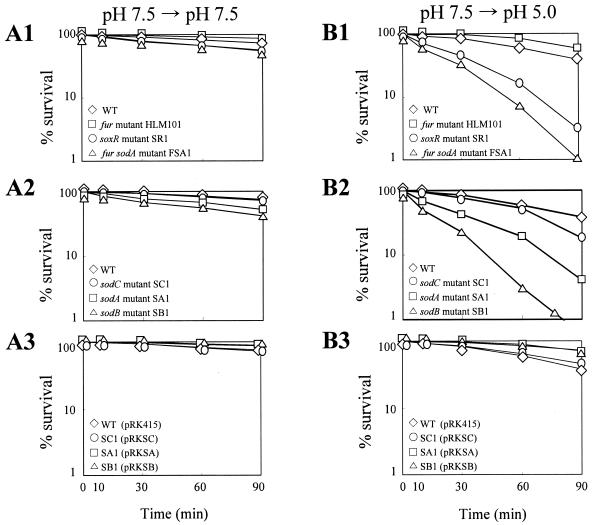
The soxR and sodA mutants SR1 and SA1 showed survival similar to that of the wild type at pH 7.5 (Fig. 8A1 and A2) but increased killing at pH 5.0 (Fig. 8A1 and B2). The results confirm that MnSOD expression is crucial for survival of V. vulnificus in acidic environments.
FIG. 8.
Acid tolerance of regulatory mutants affecting sodA expression, sod mutants, and sod mutants complemented with corresponding genes. Cells grown in LBS (pH 7.5) with transition to PBS (pH 7.5) (A) and SCBN (pH 5.0) (B). (A1 and B1) Regulatory mutants HLM101 (□), SR1 (○), and FSA1 (▵); (A2 and B2) sod mutants SC1 (○), SA1 (□), and SB1 (▵); (A3 and B3) sod mutants complemented with corresponding genes, SC1 containing pRKSC (○), SA1 containing pRKSA (□), and SB1 containing pRKSB (▵). The wild type (⋄) and the wild type containing pRK415 (⋄) are included as a control in each experiment. Survival was expressed as percentages of the initial numbers of CFU ml−1, which were approximately 105. Data shown are representative of triplicate experiments.
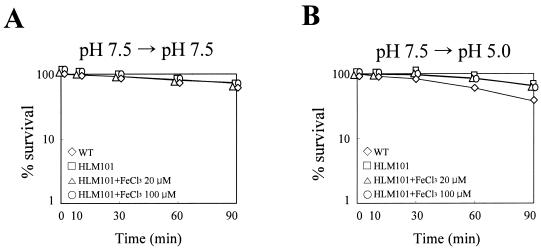
The survival of the fur mutant HLM101 derepressing MnSOD (Fig. 3) was similar to that of the wild type at pH 7.5 (Fig. 8A1). As expected, the mutant endured acidity better than the wild type (Fig. 8B1). The higher tolerance could be ascribed to the elevated level of cytosolic SODs in the mutant, since the total cytosolic SOD activity, measured in the presence of KCN as described in Materials and Methods, of HLM101 grown in LBS is always higher than that of the wild type by approximately 10 to 50% irrespective of the pH of the medium (data not shown). Iron is more soluble at acid pH than it is at alkaline pH (53), and excess intracellular iron can be detrimental to the cell (9). Accordingly, it was considered possible that the lethal effect at low pH could be enhanced by the unregulated delivery of iron into the mutant. Contrary to expectations, the addition of FeCl3 up to 100 μM did not change the survival phenotype (Fig. 9A and B). This suggests that potential iron toxicity through the delivery of iron, possibly unregulated by the lack of Fur, into the mutant may not be a factor affecting acid tolerance in V. vulnificus. The tolerance endurance was abolished by introduction of a sodA mutation in HLM101 (see FSA1 in Fig. 8B1). Thus, it is the derepressed MnSOD expression of the fur mutant that is related to acid tolerance.
FIG. 9.
Acid tolerance of fur mutant in the presence of FeCl3. The wild type (⋄) and HLM101 grown in LBS (pH 7.5) were transited to PBS (pH 7.5) (A) and SCBN (pH 5.0) (B). FeCl3 was added to the buffer; none (□), 20 (▵), and 100 μM (○). Survival was expressed as percentages of the initial numbers of CFU ml−1, which were approximately 105. Data shown are representative of triplicate experiments.
Cellular level of cytosolic SODs is important for cell survival at low pH.
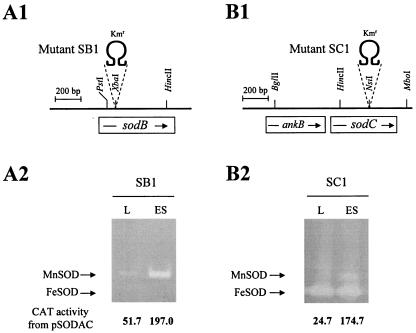
sodB and sodC, coding for FeSOD and CuZnSOD, respectively, of V. vulnificus, were interrupted to generate mutants SB1 and SC1 (Fig. 10). MnSOD of SB1 is derepressed from the exponential growth phase (Fig. 10A2). The expression of MnSOD and FeSOD was not changed by the mutation in sodC (Fig. 10B2). Total cytosolic SOD activities in cell extracts from SC1, SB1, and SA1 grown to logarithmic phase were measured in the presence of KCN. The cytosolic SOD activity of SC1 is similar to that of the wild type, whereas those of SA1 and SB1 amounted to 85 and 25% of the wild-type activity, respectively, illustrating that the total cytosolic activity decreased in the order of SC1, SA1, and SB1. Acid survival of sod mutants also decreased in the order of SC1, SA1, and SB1 compared with the wild type (Fig. 8B2). The mutational effects were significant at acid pH (compare Fig. 8B2 with Fig. 8A2) and were complemented with corresponding sod genes in trans (Fig. 8A3 and B3). Thus, the higher level of cytosolic SOD activities appears to support the better tolerance to acid pH. The contribution of CuZnSOD to acid tolerance was not significant compared with those of cytosolic SODs.
FIG. 10.
Chromosomal structures of sodB and sodC mutants and their expression of cytosolic SODs. (A1 and B1) sodB and sodC were interrupted with Ω DNA (Kmr) to generate mutants SB1 (A1) and SC1 (B1), respectively. ankB coding for an ankyrin-like protein is shown (B1). (A2 and B2) Expression of cytosolic SODs and CAT activity from sodA::cat fusion in SB1 (A2) and SC1 (B2). L and ES stand for the growth phases, as described in the Fig. 1 legend.
Taken together, when V. vulnificus is exposed to low pH, superoxide is accumulated in cells. MnSOD expression is then induced, which results in an increase of cytosolic SOD activity. Superoxide removal by the cytosolic SODs is essential for acid tolerance of V. vulnificus.
DISCUSSION
In this work, acid-specific stress could be separated from oxidative stress by TEMPO, a scavenger for superoxide. Since the scavenger abolishes MnSOD induction at low pH, the stress responsible for sodA transcription is not pH but superoxide. Fe2+ of heme in acid pH may undergo spontaneous oxidation to Fe3+ with concomitant generation of superoxide (33). Acid also could affect all the cell components from the membrane to the cytosol, and the proteins therein could be partly unfolded but still work to generate reactive oxygen species including superoxide under aerobic conditions. Interestingly, there have been reports of increased expression of both DnaK and GroEL/ES classes of chaperones in response to growth at low pH (15, 36). By the same token, the experimental results shown in this work can also suggest that a lack of either MnSOD or FeSOD of V. vulnificus may result in intracellular buildup of superoxide, which causes cellular damage that renders the cell more sensitive to the acid stress.
E. coli MnSOD is also induced by MV (13), as in V. vulnificus. However, unlike the case with V. vulnificus, a substantial level of MnSOD activity is detected in E. coli during exponential growth. Neither derepressed MnSOD activity nor a growth lag was observed after transition of E. coli to LB acidified to pH 4.0 or 5.0 (J.-S. Kim and J. K. Lee, unpublished results). The results suggest that there are intrinsic differences in the acid tolerance response between E. coli and V. vulnificus. Superoxide may not be generated in E. coli under acidic conditions, or the superoxide level, if generated, may be too low to induce MnSOD.
V. vulnificus SoxR (17 kDa on a sodium dodecyl sulfate-polyacrylamide gel) was purified after tag removal from the fusion protein MBP-SoxR, which had been overexpressed in E. coli. The purified SoxR protein displayed binding affinity for E. coli soxS regulatory DNA (from −116 to +64; +1, 5′ end of the soxS transcript) in a gel mobility shift. However, the mobility of V. vulnificus sodA regulatory DNA (from −87 to +51; +1, 5′ end of the sodA transcript) was not affected by SoxR (J.-S. Kim and J. K. Lee, unpublished results). Thus, the SoxR-mediated sodA expression of V. vulnificus appears to be exerted indirectly, possibly via another regulator, such as SoxS, as observed with E. coli (1). In V. vulnificus, however, no SoxS homolog has been found to date.
SoxR regulates MnSOD induction at acid pH, which is required for an acid tolerance response (Fig. 8). rpoS and cadC mutants of V. vulnificus also revealed higher levels of acid killing than the wild type (37, 39). For both rpoS and cadC mutants, however, the acid pH-dependent MnSOD inductions are the same as those for the wild type (J.-S. Kim and J. K. Lee, unpublished results). Thus, rpoS and cadC mutants are acid sensitive for reasons other than defects in acid pH-dependent MnSOD induction. Therefore, acid resistance of V. vulnificus appears to be a multifactorial phenomenon that includes stress responses to acidity as well as superoxide accumulated under acidic conditions.
From the survival of sod mutants, it was concluded that the higher SOD level in the cytosol supports better survival at acid pH. The same was true for a lethality assay following intraperitoneal injection of the cells into mouse (J.-S. Kim and J. K. Lee, unpublished results), reflecting that superoxide is one of the major stresses that V. vulnificus should overcome in vivo.
Acknowledgments
We thank K.-H. Lee for providing V. vulnificus strains HLM101 and KPR101, S. H. Choi for strain JR203, K. S. Kim for the cosmid libraries of V. vulnificus genomic DNA, and Y.-H. Cho for helpful discussions.
This work was supported by the 21C Frontier Microbial Genomics and Applications Center Program from the Ministry of Science and Technology (MG02-0201-003-2-2-0), Korea, and also supported by a grant (2000-2-20200-001-3) from the Basic Research Program of KOSEF and by a special research grant from Sogang University in 2002.
REFERENCES
- 1.Amabile-Cuevas, C. F., and B. Demple. 1991. Molecular characterization of the soxRS genes of Escherichia coli: two genes control a superoxide stress regulon. Nucleic Acids Res. 19:4479-4484. [DOI] [PMC free article] [PubMed] [Google Scholar]
- 2.Beauchamp, C., and I. Fridovich. 1971. Superoxide dismutase: improved assays and an assay applicable to acrylamide gels. Anal. Biochem. 44:276-287. [DOI] [PubMed] [Google Scholar]
- 3.Blake, P. A., R. E. Weaver, and D. G. Hollis. 1980. Diseases of humans (other than cholera) caused by vibrios. Annu. Rev. Microbiol. 34:341-367. [DOI] [PubMed] [Google Scholar]
- 4.Boot, I. R., P. Cash, and C. O'Byrne. 2002. Sensing and adapting to acid stress. Antonie Leeuwenhoek 81:33-42. [DOI] [PubMed] [Google Scholar]
- 5.Brayton, P. R., P. A. West, E. Russek, and R. R. Colwell. 1983. New selective plating medium for isolation of Vibrio vulnificus biogroup 1. J. Clin. Microbiol. 17:1039-1044. [DOI] [PMC free article] [PubMed] [Google Scholar]
- 6.Cannio, R., G. Fiorentino, A. Morana, M. Rossi, and S. Bartolucci. 2000. Oxygen: friend or foe? Archaeal superoxide dismutases in the protection of intra- and extracellular oxidative stress. Front. Biosci. 5:768-779. [DOI] [PubMed] [Google Scholar]
- 7.Clements, M. O., S. P. Watson, and S. J. Foster. 1999. Characterization of the major superoxide dismutase of Staphylococcus aureus and its role in starvation survival, stress resistance, and pathogenicity. J. Bacteriol. 181:3898-3903. [DOI] [PMC free article] [PubMed] [Google Scholar]
- 8.Fellay, R., H. M. Krisch, P. Prentki, and J. Frey. 1989. Omegon-Km: a transposable element designed for in vivo insertional mutagenesis and cloning of genes in gram-negative bacteria. Gene 76:215-226. [DOI] [PubMed] [Google Scholar]
- 9.Flitter, W., D. A. Rowley, and B. Halliwell. 1983. Superoxide-dependent formation of hydroxyl radicals in the presence of iron salts: what is the physiological iron chelator? FEBS Lett. 158:310-312. [Google Scholar]
- 10.Foster, J. W. 1991. Salmonella acid shock proteins are required for the adaptive acid tolerance response. J. Bacteriol. 173:6896-6902. [DOI] [PMC free article] [PubMed] [Google Scholar]
- 11.Hall, H. K., and J. W. Foster. 1996. The role of fur in the acid tolerance response of Salmonella typhimurium is physiologically and genetically separable from its role in iron acquisition. J. Bacteriol. 178:5683-5691. [DOI] [PMC free article] [PubMed] [Google Scholar]
- 12.Hanahan, D. 1983. Studies on transformation of Escherichia coli with plasmids. J. Mol. Biol. 166:557-580. [DOI] [PubMed] [Google Scholar]
- 13.Hassan, H. M., and I. Fridovich. 1979. Intracellular production of superoxide radical and of hydrogen peroxide by redox active compounds. Arch. Biochem. Biophys. 196:385-395. [DOI] [PubMed] [Google Scholar]
- 14.Imlay, K. R., and J. A. Imlay. 1996. Cloning and analysis of sodC, encoding the copper-zinc superoxide dismutase of Escherichia coli. J. Bacteriol. 178:2564-2571. [DOI] [PMC free article] [PubMed] [Google Scholar]
- 15.Jan, G., P. Leverrier, V. Pichereau, and P. Boyaval. 2001. Changes in protein synthesis and morphology during acid adaptation of Propionibacterium freudenreichii. Appl. Environ. Microbiol. 67:2029-2036. [DOI] [PMC free article] [PubMed] [Google Scholar]
- 16.Keen, N. T., S. Tamaki, D. Kobayashi, and D. Trollinger. 1988. Improved broad-host-range plasmid for DNA cloning in gram-negative bacteria. Gene 70:191-197. [DOI] [PubMed] [Google Scholar]
- 17.Kim, J.-S., J.-H. Jang, J.-W. Lee, S.-O. Kang, K.-S. Kim, and J. K. Lee. 2000. Identification of cis site involved in nickel-responsive transcriptional repression of sodF gene coding for Fe- and Zn-containing superoxide dismutase of Streptomyces griseus. Biochim. Biophys. Acta 1493:200-207. [DOI] [PubMed] [Google Scholar]
- 18.Kim, J.-S., S.-O. Kang, and J. K. Lee. 2003. The protein complex composed of nickel-binding SrnQ and DNA binding motif-bearing SrnR of Streptomyces griseus represses sodF transcription in the presence of nickel. J. Biol. Chem. 278:18455-18463. [DOI] [PubMed] [Google Scholar]
- 19.Kimoto, R., T. Funahashi, N. Yamamoto, S. Miyoshi, S. Narimatsu, and S. Yamamoto. 2001. Identification and characterization of the sodA genes encoding manganese superoxide dismutases in Vibrio parahaemolyticus, Vibrio mimicus, and Vibrio vulnificus. Microbiol. Immunol. 45:135-142. [DOI] [PubMed] [Google Scholar]
- 20.Kolter, R., D. A. Siegele, and A. Tormo. 1993. The stationary phase of the bacterial life cycle. Annu. Rev. Microbiol. 47:855-874. [DOI] [PubMed] [Google Scholar]
- 21.Kwang, C. J., H. S. Jeong, J. H. Rhee, S. E. Lee, S. S. Chung, A. M. Starks, G. M. Escudero, P. A. Gulig, and S. H. Choi. 2000. Construction and phenotypic evaluation of a Vibrio vulnificus vvpE mutant for elastolytic protease. Infect. Immun. 68:5096-5106. [DOI] [PMC free article] [PubMed] [Google Scholar]
- 22.Kwon, K.-B., J.-Y. Yang, D.-G. Ryu, H.-W. Rho, J.-S. Kim, J.-W. Park, H.-R. Kim, and B.-H. Park. 2001. Vibrio vulnificus cytolysin induces superoxide anion-initiated apoptotic signaling pathway in human ECV304 cells. J. Biol. Chem. 276:47518-47523. [DOI] [PubMed] [Google Scholar]
- 23.Lee, H.-J., K.-J. Park, A. Y. Lee, S. G. Park, B. C. Park, K.-H. Lee, and S.-J. Park. 2003. Regulation of fur expression by RpoS and Fur in Vibrio vulnificus. J. Bacteriol. 185:5891-5896. [DOI] [PMC free article] [PubMed] [Google Scholar]
- 24.Lee, I. S., J. Lin, H. K. Hall, B. Bearson, and J. W. Foster. 1995. The stationary-phase sigma factor sigma S (RpoS) is required for a sustained acid tolerance response in virulent Salmonella typhimurium. Mol. Microbiol. 17:155-167. [DOI] [PubMed] [Google Scholar]
- 25.Lemonnier, M., and L. David. 1998. Expression of the second lysine decarboxylase gene of Escherichia coli. Microbiology 144:751-760. [DOI] [PubMed] [Google Scholar]
- 26.Lin, J., M. P. Smith, K. C. Chapin, H. S. Baik, G. N. Bennett, and J. W. Foster. 1996. Mechanisms of acid resistance in enterohemorrhagic Escherichia coli. Appl. Environ. Microbiol. 62:3094-3100. [DOI] [PMC free article] [PubMed] [Google Scholar]
- 27.Liochev, S. I., and I. Fridovich. 1997. Lucigenin as mediator of superoxide production: revisited. Free Radic. Biol. Med. 25:926-928. [DOI] [PubMed] [Google Scholar]
- 28.Markwell, M. A., S. M. Haas, L. L. Bieber, and N. E. Tolbert. 1978. A modification of the Lowry procedure to simplify protein determination in membrane and lipoprotein samples. Anal. Biochem. 87:206-210. [DOI] [PubMed] [Google Scholar]
- 29.McCord, J. M., and I. Fridovich. 1969. Superoxide dismutase. An enzymic function for erythrocuprein (hemocuprein). J. Biol. Chem. 244:6049-6055. [PubMed] [Google Scholar]
- 30.Merrell, D. S., and A. Camilli. 1999. The cadA gene of Vibrio cholerae is induced during infection and plays a role in acid tolerance. Mol. Microbiol. 34:836-849. [DOI] [PubMed] [Google Scholar]
- 31.Merrell, D. S., and A. Camilli. 2000. Regulation of Vibrio cholerae genes required for acid tolerance by a member of the “ToxR-like” family of transcriptional regulators. J. Bacteriol. 182:5342-5350. [DOI] [PMC free article] [PubMed] [Google Scholar]
- 32.Milton, D. L., R. O'Toole, O. Horstedt, and H. Wolf-Watz. 1996. Flagellin A is essential for the virulence of Vibrio anguillarum. J. Bacteriol. 178:1310-1319. [DOI] [PMC free article] [PubMed] [Google Scholar]
- 33.Muller, S. 2004. Redox and antioxidant systems of the malaria parasite Plasmodium falciparum. Mol. Microbiol. 53:1291-1305. [DOI] [PubMed] [Google Scholar]
- 34.Neely, M. N., and E. R. Olson. 1996. Kinetics of expression of the Escherichia coli cad operon as a function of pH and lysine. J. Bacteriol. 178:5522-5528. [DOI] [PMC free article] [PubMed] [Google Scholar]
- 35.Niederhoffer, E. C., C. M. Naranjo, K. L. Bradley, and J. A. Fee. 1990. Control of Escherichia coli superoxide dismutase (sodA and sodB) genes by the ferric uptake regulation (fur) locus. J. Bacteriol. 172:1930-1938. [DOI] [PMC free article] [PubMed] [Google Scholar]
- 36.Olson, E. R. 1993. Influence of pH on bacterial gene expression. Mol. Microbiol. 8:5-14. [DOI] [PubMed] [Google Scholar]
- 37.Park, K.-J., M.-J. Kang, S. H. Kim, H.-J. Lee, J.-K. Lim, S. H. Choi, S.-J. Park, and K.-H. Lee. 2004. Isolation and characterization of rpoS from a pathogenic bacterium, Vibrio vulnificus: Role of σS in survival of exponential-phase cells under oxidative stress. J. Bacteriol. 186:3304-3312. [DOI] [PMC free article] [PubMed] [Google Scholar]
- 38.Park, Y. K., B. Bearson, S. H. Bang, I. S. Bang, and J. W. Foster. 1996. Internal pH crisis, lysine decarboxylase and the acid tolerance response of Salmonella typhimurium. Mol. Microbiol. 20:605-611. [DOI] [PubMed] [Google Scholar]
- 39.Rhee, J. E., H.-M. Ju, U. Park, B. C. Park, and S. H. Choi. 2004. Identification of the Vibrio vulnificus cadC and evaluation of its role in acid tolerance. J. Microbiol. Biotechnol. 14:1093-1098. [Google Scholar]
- 40.Rhee, J. E., J. H. Rhee, P. Y. Ryu, and S. H. Choi. 2002. Identification of the cadBA operon from Vibrio vulnificus and its influence on survival to acid stress. FEMS Microbiol. Lett. 208:245-251. [DOI] [PubMed] [Google Scholar]
- 41.Samartzidou, H., and A. H. Delcour. 1999. Excretion of endogenous cadaverine leads to a decrease in porin-mediated outer membrane permeability. J. Bacteriol. 181:791-798. [DOI] [PMC free article] [PubMed] [Google Scholar]
- 42.Samartzidou, H., M. Mehrazin, Z. Xu, M. J. Benedik, and A. H. Delcour. 2003. Cadaverine inhibition of porin plays a role in cell survival at acidic pH. J. Bacteriol. 185:13-19. [DOI] [PMC free article] [PubMed] [Google Scholar]
- 43.Sambrook, J., E. F. Fritsch, and T. Maniatis. 1989. Molecular cloning: a laboratory manual. Cold Spring Harbor Laboratory Press, Cold Spring Harbor, N.Y.
- 44.Shaw, W. V. 1975. Chloramphenicol acetyltransferase from chloramphenicol-resistant bacteria. Methods Enzymol. 43:737-755. [DOI] [PubMed] [Google Scholar]
- 45.Shin, S., M. P. Castanie-Cornet, J. W. Foster, J. A. Crawford, C. Brinkley, and J. B. Kaper. 2001. An activator of glutamate decarboxylase genes regulates the expression of enteropathogenic Escherichia coli virulence genes through control of the plasmid-encoded regulator, Per. Mol. Microbiol. 41:1133-1150. [DOI] [PubMed] [Google Scholar]
- 46.Simon, R., U. Priefer, and A. Puhler. 1983. A broad host mobilization system for in vivo genetic engineering: transposon mutagenesis in gram-negative bacteria. Bio/Technology 1:37-45. [Google Scholar]
- 47.Slater, A. F., C. S. Nobel, E. Maellaro, J. Bustamante, M. Kimland, and S. Orrenius. 1995. Nitrone spin traps and a nitroxide antioxidant inhibit a common pathway of thymocyte apoptosis. Biochem. J. 306:771-778. [DOI] [PMC free article] [PubMed] [Google Scholar]
- 48.Soksawatmaekhin, W., A. Kuraishi, K. Sakata, K. Kashiwagi, and K. Igarashi. 2004. Excretion and uptake of cadaverine by CadB and its physiological functions in Escherichia coli. Mol. Microbiol. 51:1401-1412. [DOI] [PubMed] [Google Scholar]
- 49.Storz, G., L. A. Tartaglia, S. B. Farr, and B. N. Ames. 1990. Bacterial defenses against oxidative stress. Trends Genet. 6:363-368. [DOI] [PubMed] [Google Scholar]
- 50.Wilkins, J. C., D. Beighton, and K. A. Homer. 2003. Effect of acidic pH on expression of surface-associated proteins of Streptococcus oralis. Appl. Environ. Microbiol. 69:5290-5296. [DOI] [PMC free article] [PubMed] [Google Scholar]
- 51.Wilkins, J. C., K. A. Homer, and D. Beighton. 2002. Analysis of Streptococcus mutans proteins modulated by culture under acidic conditions. Appl. Environ. Microbiol. 68:2382-2390. [DOI] [PMC free article] [PubMed] [Google Scholar]
- 52.Wu, J., and B. Weiss. 1992. Two-stage induction of the soxRS (superoxide response) regulon of Escherichia coli. J. Bacteriol. 174:3915-3920. [DOI] [PMC free article] [PubMed] [Google Scholar]
- 53.Zaino, E. C., and R. H. Roberts (ed.) 1997. CIBA Medical Horizons Symposium on chelation therapy in chronic iron overload. CIBA, Symposia Specialist, Inc., New York, N.Y.


