Abstract
The influence of renal function on tenofovir pharmacokinetics was investigated in 193 human immunodeficiency virus (HIV)-infected patients by the use of a population approach performed with the nonlinear mixed effects modeling program NONMEM. Tenofovir pharmacokinetics was well described by a two-compartment open model in which the absorption and the distribution rate constants are equal. Typical population estimates of apparent central distribution volume (Vc/F), peripheral distribution volume (Vp/F), intercompartmental clearance (Q/F), and plasma clearance (CL/F) were 534 liters, 1,530 liters, 144 liters/h and 90.9 liters/h, respectively. Apparent plasma clearance was related to body weight/serum creatinine ratio (BW/SCR) and to the existence of a tubular dysfunction. Concomitant treatment with lopinavir/ritonavir was found to decrease tenofovir clearance. Individual Bayesian estimates of CL/F were used to calculate the tenofovir area under the concentration-time curve from time zero to 24 h (AUC0-24). In patients without tubular dysfunction, AUC0-24 values markedly decreased from 6.7 to 1.4 mg · h/liter for BW/SCR increasing from 0.44 to 1.73. The relevance of a dosage adjustment based on BW/SCR should be further evaluated.
Tenofovir is a nucleotide analogue used as a combination therapy with other antiretrovirals for the treatment of human immunodeficiency virus type 1 (HIV-1) infection. To be active, tenofovir needs to be converted at the intracellular level to tenofovir diphosphate, which inhibits the viral reverse transcriptase (10). A pharmacokinetic study performed after intravenous administrations of tenofovir in HIV-infected adults (5) has shown that 70 to 80% of the dose was recovered unchanged in urine and that tubular secretion was an important pathway for tenofovir clearance. A significant increase in tenofovir exposure was also demonstrated in adult patients with creatinine clearance (CLCR) less than 50 ml/min, which required a decrease in tenofovir dosage regimen for this subpopulation (10). For adult patients with CLCR greater than 50 ml/min, the same dosage regimen of 300 mg once a day (QD) of tenofovir disoproxil fumarate (TDF), an oral prodrug of tenofovir, is recommended. However, the influence of renal function on tenofovir exposure has still not been studied in patients with CLCR greater than 50 ml/min.
Thus, in order to evaluate whether a dose adjustment based on renal function could be considered for tenofovir therapy, even in patients receiving the recommended 300-mg QD dose, the influence of the renal function on tenofovir pharmacokinetics was investigated using a population approach performed retrospectively on routine therapeutic drug monitoring data.
MATERIALS AND METHODS
Patients and treatment.
The population comprised adult patients receiving TDF, as 300-mg tablets equivalent to 245 mg of tenofovir, at its recommended 300-mg QD dose for the treatment of HIV infection and monitored according to the plasma concentrations of antiretroviral drugs on a routine basis. For each patient, time elapsed between administration and sampling times, gender, body weight (BW), and age were carefully recorded, as well as combined treatments, particularly antiretroviral drugs. Corresponding serum creatinine (SCR), phosphorus concentration, and viral load were obtained from routine monitoring data performed in Cochin-Saint-Vincent-de-Paul Hospital Biochemistry and Virology Departments respectively. Creatinine clearance was calculated for each sample according to the Cockroft-Gault formula (3) and the Jelliffe formula (8).
Analytical methods.
The tenofovir assay was performed according to a previously published method (9) with a quantification limit, interassay precision, and bias of 0.005 mg/liter, 9.6%, and 11.4%, respectively.
Population pharmacokinetic modeling.
Concentration-time data were analyzed using the first-order conditional estimation (FOCE) method of the nonlinear mixed effects modeling program NONMEM (2) (version V, level 1.1, double precision). Several structural pharmacokinetic models were investigated. Classical one, two, and three-compartment models were first evaluated. A two-compartment pharmacokinetic model in which the absorption (ka) and distribution rate (α) constants are equal was also tried (14). The explicit solutions for this pharmacokinetic model were coded in the $PRED section of the control stream, and its parameters were tenofovir apparent total and intercompartmental clearance (CL/F and Q/F) and central and peripheral distribution volume (Vc/F and Vp/F), respectively.
Several error models were also investigated (i.e., proportional, exponential, and additive random effects model) to describe interpatient and residual variability.
The influence of continuous covariates on pharmacokinetic parameters was systematically tested via a generalized modeling according to the following equation, using CL/F and BW for example:
 |
where TV(CL/F) is the typical value of apparent clearance for a patient with the median covariate value and θBW is the influential factor for body weight. Binary covariates (gender, combined treatment, and tubular dysfunction) were investigated as follows:
 |
The effect of a covariate was assessed by the chi-square test of the difference between the objective functions of the basic model (without covariate) and the model including the covariate. A covariate was retained in the model if it produced a minimum decrease in the objective function of 4 units (P < 0.05, 1 degree of freedom) and if one of the following criteria was satisfied: (i) it led to a reduction of the interindividual variability (η) of the associated pharmacokinetic parameter or (ii) its effect was biologically plausible. An intermediate multivariate model was then obtained, including all selected covariates. A covariate was retained in the final multivariate model if its deletion from the intermediate model led to a 7-point increase in the objective function (P < 0.01, 1 degree of freedom). At each step, the goodness of fit was evaluated by the weighted residuals (WRES) versus predicted concentrations (PRED) or time-after-dose graphs.
The accuracy and robustness of the final population model were assessed using a bootstrap method, consisting of repeated random sampling with replacement from the original data set. This resampling was repeated 1,000 times, and the values of the parameters estimated from the bootstrap set were compared to the estimates obtained from the original data set. The entire procedure was performed in an automated fashion using Wings for NONMEM (12).
Individual Bayesian estimates of the pharmacokinetic parameters were used to calculate individual AUC0-24 and minimal concentration (Cmin).
Relationship between tenofovir exposure and phosphatemia/viral load.
Possible relationship between AUC0-24 and phosphatemia was evaluated by linear regression. Patients for whom the viral load at sampling time was known were also divided into four increasing AUC0-24 range groups. The limits of these groups were the 25th, 50th, and 75th percentiles of the calculated AUC0-24 values in the entire population of the study. The percentage of patients with a viral load lower than the reference cutoff value (i.e., 400 copies/ml) was calculated, and a chi-square test for trend was used to investigate a possible effect of tenofovir AUC0-24 on this percentage.
RESULTS
Demographic data.
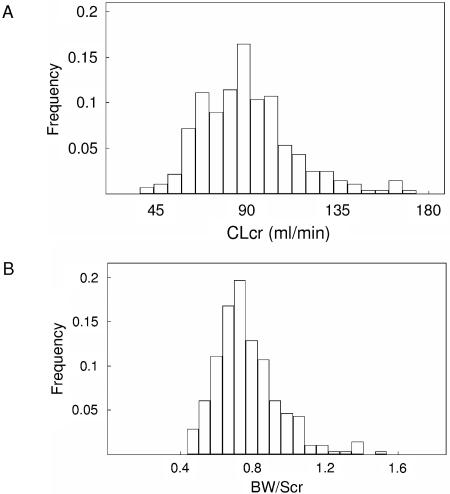
One hundred ninety-three patients, ranging in age from 16.1 to 70.9 years, were available for pharmacokinetic evaluation. All adult patients received TDF at the recommended 300-mg once-daily dose. Their characteristics are listed in Table 1. Viral load at sampling time was available for 79 patients, and a viral load of <400 copies/ml was observed for 50 of these patients. Figure 1 represents the distributions of CLCR (calculated according to the Cockroft-Gault formula) and BW/SCR ratio in the population study. Only four patients had a CLCR slightly less than 50 ml/min (37, 42, 47, and 48 ml/min). They were nonetheless kept in the database as they received the TDF 300-mg QD regimen recommended for patients with CLCR greater than 50 ml/min. TDF was combined with at least one nucleoside reverse transcriptase inhibitor, one protease inhibitor (PI), and a nonnucleoside reverse transcriptase inhibitor in 98, 77, and 22% of the samples, respectively. Lopinavir/ritonavir was the most frequently PI combined with tenofovir as this concomitant treatment involved 53% of the samples. Hypophosphatemia (i.e., phosphorus <0.8 mmol/liter) was observed in 17% (n = 33) of the patients. A tubular dysfunction induced by tenofovir was observed in four patients. The diagnosis was based on clinical (renal failure, bodyweight loss) as well as biological signs (normoglycemic glycosuria, proteinuria, phosphate wasting, and increase in serum creatinine concentration). The CLCRs of these four patients were 65, 59, 72.5, and 52.6 ml/min and were associated with phosphorus concentrations of 0.43, 0.46, 0.79, and 0.35 mmol/liter, respectively.
TABLE 1.
Characteristics of adult patients in this studya
| Characteristic | Mean | SD | Median | Range |
|---|---|---|---|---|
| Age (yr) | 39.9 | 11.2 | 39.4 | 16.1-70.9 |
| BW (kg) | 67.3 | 12.4 | 65 | 35-100 |
| SCR (μmol/liter) | 88.9 | 18.9 | 90 | 41-168 |
| CLCR (ml/min) | 89.8 | 23.6 | 87 | 37-174 |
| BW/SCR | 0.77 | 0.18 | 0.74 | 0.43-1.73 |
| Phosphatemia (mmol/liter) | 1.09 | 0.32 | 1.06 | 0.35-3.75 |
| Viral load (copies/ml)b | 100 | <50-488,000 | ||
| TDF dose (mg) | 300 | 0 | 300 | |
| No. of samples | 290 | |||
| No. of samples/patient | 1.5 | 1-10 |
A total of 130 men and 63 women were examined.
n=79 patients.
FIG. 1.
CLCR (A) and BW/SCR (B) distributions in the population of the study.
Population pharmacokinetics.
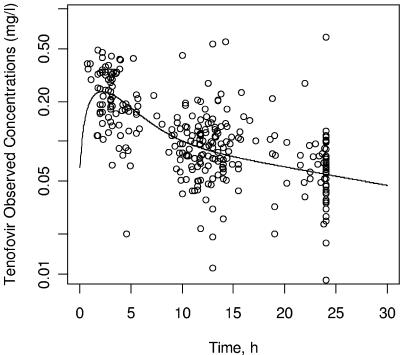
The best fit was obtained with the two-compartment model in which ka and α are equal. This model provided a further 73-point decrease in the objective function compared to the one-compartment model. The classical two-compartment model (subroutines ADVAN4 TRANS4) was first tried, but no value could be estimated for ka. As no previously published value was available for ka, several attempts to fix this parameter to arbitrary values were made. The pharmacokinetic parameter estimates obtained were then characterized by important standard errors or by typical values in disagreement with published data (not shown). The three-compartment model seemed to be overparameterized for our data as it systematically led to convergence failure. The graph of observed concentrations as a function of time after dosing with the typical pharmacokinetic curve is displayed in Fig. 2. Interpatient variability was described by an exponential error model, whereas residual variability was described by an additive error model. Interindividual variability of Vp/F and Q/F could not be estimated, and no covariate was tested on these parameters. A significant covariance was found between CL/F and Vc/F.
FIG. 2.
Observed tenofovir concentrations (OBS) versus time after dose and typical pharmacokinetic curve.
Three different markers of the renal function, SCR, CLCR, and the BW/SCR ratio were found to improve the fit. The relationship between CL/F and CLCR was independent in the calculation formula used for CLCR (i.e., Cockroft-Gault or Jelliffe), but only the deletion of BW/SCR from the intermediate model significantly increased the objective function. Among the concomitant antiretroviral agents, a significant interaction was found only with lopinavir/ritonavir, which decreased tenofovir CL/F. Though only four patients were involved, the presence of a tubular dysfunction explained 37% of CL/F interindividual variability. The effects of the different tested covariates on the objective function and the interindividual variability of the pharmacokinetic parameters are summarized in Table 2.
TABLE 2.
Effect of the tested covariates on the objective functiona
| Tested covariate | Pharmacokinetic parameter | ΔFobj1 | Δη1 | ΔFobj2 | Δη2 |
|---|---|---|---|---|---|
| Age | CL/F | ↔ | |||
| Body weight | CL/F | ↔ | |||
| V/F | ↔ | ||||
| Scr | CL/F | −33 | −16% | +3 | +1% |
| BW/SCR | CL/F | −55 | −39% | +48 | +31% |
| CLcr | CL/F | −44 | −29% | +0.2 | −1% |
| Gender | CL/F | ↔ | |||
| Tubulopathy | CL/F | −39 | −37% | +25 | +36% |
| Lopinavir | CL/F | −7 | +11% | +7 | −0% |
ΔFobj, observed change in the objective function induced by the corresponding covariate after its addition to the base model, 1, or its deletion from the intermediate model, 2. Δη, relative change in the interindividual variability of the corresponding pharmacokinetic parameter provided by the addition of the tested covariate in the base model, 1, or by its deletion from the intermediate model, 2. ↔, no significant change in the objective function.
The final covariate submodel was then
 |
with L = 0.86 if lopinavir/ritonavir were combined with tenofovir and T = 2.3 if a tubulopathy was observed.
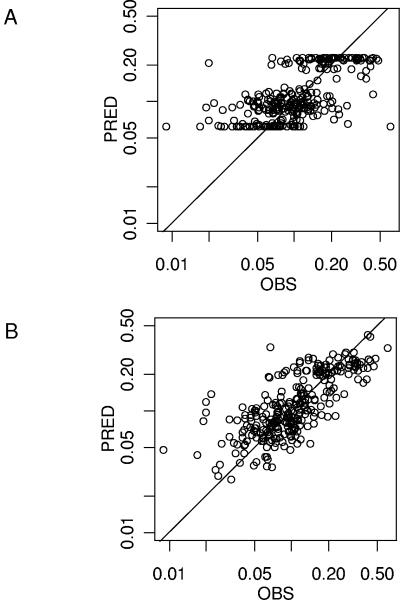
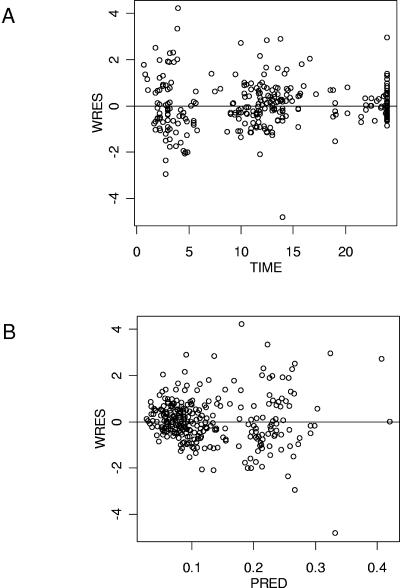
Table 3 summarizes the population parameter estimates. The improvement of the fit provided by the covariates is visually evaluated by the PRED versus observed (OBS) concentration plots obtained with the covariate-free and the final model (Fig. 3A and B). The goodness-of-fit was also evaluated graphically by the good distribution of the points on the weighted residuals (WRES) versus PRED and time plots (Fig. 4A and 4B). A correlation coefficient of 0.764 was obtained between observed and model-predicted concentrations.
TABLE 3.
Population pharmacokinetic parameters of tenofovir in 193 adult patients and bootstrap validationa
| Parameter | Final model with original dataset
|
Bootstrapb
|
||
|---|---|---|---|---|
| Mean | SE | Mean | SE | |
| TV (CL/F) (liters/h) | 90.9 | 5.5 | 91.5 | 8.5 |
| CL/F, θBW/SCR | 0.83 | 0.13 | 0.81 | 0.16 |
| CL/F, θTUBULOPATHY | 2.34 | 0.42 | 2.47 | 0.62 |
| CL/F, θLOPINAVIR | 0.86 | 0.08 | 0.85 | 0.08 |
| TV(Vc/F) (liters) | 534 | 52 | 499 | 149 |
| TV (Q/F) (liters/h) | 144 | 28 | 159 | 72 |
| TV(Vp/F) (liters) | 1530 | 377 | 1536 | 715 |
| Residual variability, σ2 | 0.0017 | 0.00037 | 0.0016 | 0.00044 |
| ω2CL/F | 0.0654 | 0.0117 | 0.0660 | 0.0283 |
| ω2Vc/F | 0.370 | 0.119 | 0.435 | 0.192 |
| covCL,V | 0.110 | 0.033 | 0.132 | 0.065 |
SE, standard error of the estimate; TV, typical value of the corresponding PK parameter; θCOVARIATE, influential factor for covariate; ω2, interindividual variability; covCL,V, covariance between η's of CL/F and V/F.
Mean of 1,000 bootstrap analyses.
FIG. 3.
Improvement of the fit from the covariate-free model (A) to the final model (B) visualized on the observed (OBS) versus model-predicted (PRED) concentrations (log-log scale).
FIG. 4.
Goodness of fit evaluated by weighted residuals (WRES) versus time after dose (A) and WRES versus model predicted (PRED) tenofovir plasma concentrations (B).
Bootstrap validation.
The final model obtained with the original data set was subjected to a bootstrap analysis. As shown in Table 3, the mean parameter estimates obtained from the bootstrap process, 1,000 runs, were not statistically different from the estimates previously obtained with the original data set.
Individual exposure to tenofovir.
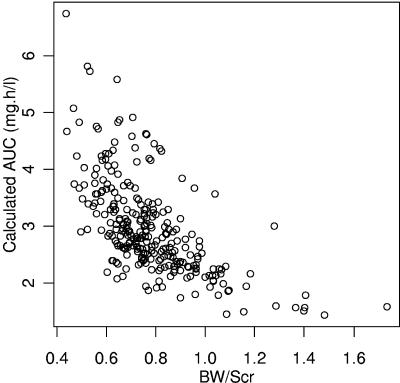
Individual Bayesian clearances were used to calculate individual AUC0-24 and Cmin values in adult patients. For the 189 patients with no tubular dysfunction at sampling time, overall mean ± standard deviation (SD) AUC0-24 was 3.0 ± 0.8 mg · h/liter. Calculated AUC0-24 and Cmin values markedly decreased from 6.7 to 1.4 mg · h/liter (Fig. 5) and from 0.198 to 0.020 mg/liter, respectively, when BW/SCR increased from 0.44 to 1.73.
FIG. 5.
Tenofovir AUC0-24 achieved for a 300-mg TDF once-a-day dose in the 189 adult patients with no tubular dysfunction versus BW/SCR.
Relationship between tenofovir pharmacokinetics and phosphatemia.
No relationship was found between tenofovir AUC0-24 and phosphatemia. The mean ± SD CLCR and CL/F of patients with hypophosphatemia (n = 33) were 90 ± 27 ml/min and 89 ± 39 liters/h, respectively, whereas the mean ± SD CLCR and CL/F were 89 ± 23 ml/min and 88 ± 26 liters/h for the other patients (n = 160). No significant difference was found between the CLCR (P = 0.8, Mann-Whitney test) or the CL/F (P = 0.6, Mann-Whitney test) of these two groups.
Four patients with hypophosphatemia presented a tenofovir-induced tubular dysfunction. Their phosphorus concentration, CLCR, CL/F, and Cmin are displayed in Table 4. Their CLCR comprised between 52.6 and 72.5 ml/min. Forty-nine patients without tubulopathy had a CLCR value comprised in this range, and their mean ± SD AUC0-24 was 3.7 ± 0.8 mg · h/liter. The Cmin values of these four patients were superior to 0.2 mg/liter. No patient with no tubular dysfunction had a Cmin value higher than 0.2 mg/liter.
TABLE 4.
Biologic and pharmacokinetic parameters of the four patients suffering from a tubular dysfunction at sampling time
| Patient | Phosphorus concn (mmol/liter) | CLCR (ml/min) | AUC0-24 (mg · h/liter) | Cmin (mg/liter) | Lopinavir/ritonavir treatmenta |
|---|---|---|---|---|---|
| 1 | 0.43 | 65 | 7.5 | 0.23 | Yes |
| 2 | 0.46 | 59 | 8.3 | 0.28 | No |
| 3 | 0.79 | 72.5 | 8.5 | 0.28 | No |
| 4 | 0.35 | 52.6 | 15.8 | 0.61 | Yes |
Concomitant treatment with lopinavir/ritonavir.
Relationship between tenofovir pharmacokinetics and viral load.
The mean ± SD tenofovir AUC0-24s were 3.0 ± 1.5 mg · h/liter for patients with a viral load of >400 copies/ml and 3.0 ± 1.1 mg · h/liter for patients with a viral load of <400 copies/ml. No significant increase in the percentage of patients achieving a viral load of <400 copies/ml (Table 5) was observed as a function of tenofovir AUC0-24 (P = 0.35, chi-square test for trend).
TABLE 5.
Percentage of patients with viral load of <400 copies/ml as a function of tenofovir AUC0-24h
| AUC0-24 range (mg · h/liter) | No. of patients (%) | |
|---|---|---|
| 1.25-2.35 | 26 (46) | |
| 2.36-2.80 | 16 (88) | |
| 2.90-3.45 | 19 (68) | |
| 3.46-8.00 | 18 (61) |
DISCUSSION
Tenofovir plasma pharmacokinetics were well described by a two-compartment model. However, the lack of points in the absorption phase did not allow us to estimate a value for ka. As fixing this parameter was not possible, an alternative model in which a common value was estimated for ka and α was preferred. Our mean CL/F estimate (90.9 liters/h) was nevertheless close to the previously reported value in healthy volunteers (88.1 liters/h) (6). Furthermore, a pharmacokinetic study performed after intravenous administrations of tenofovir in HIV patients (5) reported CL and Vss values of approximately 18 liters/h and 800 liters, respectively. As tenofovir bioavailability is thought to be about 25 to 30% (1), these results are also in agreement with our own data (i.e., 90.9 liters/h for CL/F and 2,064 liters for Vss). The mean calculated AUC0-24 obtained in the present study (3.0 mg · h/liter) was also similar to the previously described values (3.6 mg · h/liter) (6), 2.94 mg · h/liter (1). Our results also confirmed the increase in tenofovir AUC0-24 induced by concomitant treatment with lopinavir/ritonavir that has been reported previously (10). A possible explanation for this pharmacokinetic interaction is the inhibition of the Mrp-2-mediated transport of tenofovir outside renal tubules (13). Our data did not allow us to identify the similar interaction with atazanavir (10) as this association involved only two patients. Didanosine was combined with tenofovir for 60 patients. If this association is known to increase didanosine exposure (10), an effect of didanosine on tenofovir pharmacokinetics was not found in the present study.
As expected, the four patients with tubular dysfunction had markedly reduced concomitant CL/F compared to patients with equivalent CLCR values but without tubulopathy. This discrepancy between CLCR and tenofovir CL/F can be explained by the importance of tubular secretion in the renal elimination of tenofovir. For these patients, tubular dysfunction was imputed to tenofovir therapy as the renal function normalized after the tenofovir treatment was stopped.
Tenofovir is indeed known to induce tubular dysfunction that can lead to renal impairment in a limited number of patients (13). Hypophosphatemia is a biological sign that is thought to occur in 100% of tenofovir-induced tubular dysfunction (7). No relationship was found between phosphatemia and tenofovir CL/F in the present study. However, this result can be explained by the fact that hypophosphatemia is a parameter of poor specificity (4) and does not mean that this relationship does not exist in patients with tenofovir-induced tubular dysfunction. However, one interesting point that remains to be assessed is the possible relationship between a high tenofovir exposure at the beginning of tenofovir therapy and the incidence of tenofovir-induced tubulopathy.
A strong relationship was found between tenofovir CL/F and BW/SCR. Serum creatinine alone did not provide such an improvement of the fit, probably because it is not an accurate marker of the renal function as it does not take into account creatinine production from muscle mass, a parameter that can be reflected by body weight. The effect of CLCR was also less pronounced, maybe because the Cockroft-Gault and Jelliffe formulas also take gender and age into account, two covariates that showed no significant effect on CL/F. Thus, and as it was previously suggested (11), BW/SCR could appear as a surrogate marker of the renal function, which explains its significant effect on tenofovir CL/F.
Tenofovir exposure decreased when BW/SCR increased, the highest BW/SCR values corresponding to an AUC0-24 markedly lower than the mean AUC0-24 reported for the recommended 300-mg TDF dose (i.e., 2.94 mg · h/liter) (1). This decrease in tenofovir AUC0-24 could have consequences upon treatment efficacy. Indeed, the phase II study cited above (1) demonstrated that mean viral load decrease and AUC0-24 were −1.2 log10 copies/ml and 2.94 mg · h/liter, respectively, for the 300-mg dose, whereas the mean viral load decrease and AUC0-24 were −0.44 log10 copies/ml and 1.6 mg · h/liter, respectively, for a 150-mg dose. Furthermore, another phase II study showed the existence of a correlation between tenofovir AUC0-∞ at the first day of treatment and the antiviral response at the 14th day (5). Thus, though tenofovir is an inactive prodrug, these two studies strongly suggested the existence of a relationship between tenofovir exposure and the treatment efficacy.
Our results did not allow us to identify such a relationship. However, this does not mean that such a relationship does not exist as our study was not designed for this virological endpoint. A rigorous methodology would have necessitated virological as well as pharmacological selection criteria. Because of the lack of such criteria, many biases (i.e., unknown viral load for 114 patients, viral load at the beginning of tenofovir therapy, tenofovir therapy duration at sampling time, combined antiretroviral drugs, treatment history, compliance, etc.) can explain the lack of correlation between viral load and tenofovir AUC0-24 that we observed. In consequence, it seems important to investigate the possible influence of the renal function of patients receiving TDF at 300 mg QD on treatment efficacy in a prospective trial.
In conclusion, this study showed that tenofovir plasma clearance was related to the body weight/serum creatinine ratio and that high ratio values corresponded to an important decrease in tenofovir AUC0-24. The virological consequence of this decrease in tenofovir exposure should be prospectively investigated, and the usefulness of a dosage adjustment based on body weight/serum creatinine ratio should be evaluated in further studies.
Acknowledgments
This work was supported by l'Institut National de la Santé et de la Recherche Médicale (Contrat de recherche stratégique 2002).
REFERENCES
- 1.Barditch-Crovo, P., S. G. Deeks, A. Collier, S. Safrin, D. F. Coakley, M. Miller, B. P. Kearney, R. L. Coleman, P. D. Lamy, J. O. Khan, I. McGowan, and P. S. Lietman. 2001. Phase I/II trial of the pharmacokinetics, safety, and antiretroviral activity of tenofovir disoproxil fumarate in human immunodeficiency virus-infected adults. Antimicrob. Agents Chemother. 45:2733-2739. [DOI] [PMC free article] [PubMed] [Google Scholar]
- 2.Beal, S. L., and L. B. Sheiner. 1991. NONMEM user's guide. San Francisco: NONMEM Project Group, University of California at San Francisco.
- 3.Cockroft, D. W., and M. H. Gault. 1976. Prediction of creatinine-clearance from plasma creatinine. Nephron 16:31-47. [DOI] [PubMed] [Google Scholar]
- 4.Day, S. L., H. A. Leake Date, A. Bannister, M. Hankins, and M. Fisher. 2005. Serum hypophosphatemia in tenofovir disoproxil fumarate recipients is multifactorial in origin, questioning the utility of its monitoring in clinical practice. J. Acquir. Immune Defic. Syndr. 38:301-304. [PubMed] [Google Scholar]
- 5.Deeks, S. G., P. Barditch-Crovo, P. S. Lietman, F. Hwang, K. C. Cundy, J. F. Rooney, N. S. Hellmann, S. Safrin, and J. O. Kahn. 1998. Safety, pharmacokinetics, and antiretroviral activity of intravenous 9-[2-(R)-(phosphonomethoxy)propyl]adenine, a novel anti-human immunodeficiency virus (HIV) therapy, in HIV-infected adults. Antimicrob. Agents Chemother. 42:2380-2384. [DOI] [PMC free article] [PubMed] [Google Scholar]
- 6.Droste, J. A. H., C. P. W. G. M. Verweij-van Wissen, B. P. Kearney, R. Buffels, P. J. vanHorssen, Y. A. Hekster, and D. M. Burger. 2005. Pharmacokinetic study of tenofovir disoproxil fumarate combined with rifampin in healthy volunteers. Antimicrob. Agents Chemother. 49:680-684. [DOI] [PMC free article] [PubMed] [Google Scholar]
- 7.Izzedine, H., C. Isnard-Bagnis, J. S. Hulot, D. Vittecoq, A. Cheng, C. Kreft Jais, V. Launay-Vacher, and G. Deray. 2004. Renal safety of tenofovir in HIV treatment-experienced patients. AIDS 18:1074-1075. [DOI] [PubMed] [Google Scholar]
- 8.Jelliffe, R. W. 1973. Creatinine clearance: bedside estimate. Ann. Intern. Med. 79:604-607. [DOI] [PubMed] [Google Scholar]
- 9.Jullien, V., J. M. Tréluyer, G. Pons, and E. Rey. 2003. Determination of tenofovir in human plasma by high-performance liquid chromatography with spectrofluorimetric detection. J. Chromatogr. B Anal. Technol. Biomed. Life Sci. 785:377-381. [DOI] [PubMed] [Google Scholar]
- 10.Kearney, B. P., J. F. Flaherty, and J. Shah. 2004. Tenofovir disoproxyl fumarate: clinical pharmacology and pharmacokinetics. Clin. Pharmacokinet. 43:595-612. [DOI] [PubMed] [Google Scholar]
- 11.Nguyen, L., B. Tranchand, C. Puozzo, and P. Variol. 2002. Population pharmacokinetics model and limited sampling strategy for intravenous vinorelbine derived from phase I clinical trials. Br. J. Clin. Pharmacol. 53:459-468. [DOI] [PMC free article] [PubMed] [Google Scholar]
- 12.Parke, J., N. H. Holford, and B. G. Charles. 1999. A procedure for generating bootstrap samples for the validation of nonlinear mixed-effects population models. Comput. Methods Programs Biomed. 59:19-29. [DOI] [PubMed] [Google Scholar]
- 13.Peyrière, H., J. Reynes, I. Rouanet, N. Daniel, C. Merle de Boever, J. M. Mauboussin, H. Leray, L. Moachon, D. Vincent, and D. Salmon-Céron. 2004. Renal tubular dysfunction associated with tenofovir therapy. J. Acquir. Immune Defic. Syndr. 35:269-273. [DOI] [PubMed] [Google Scholar]
- 14.Wijnand, H. P. 1988. Pharmacokinetic model equations for the one- and two-compartment models with first order processes in which the absorption and exponential elimination or distribution rate constants are equal. J. Pharmacokinet. Biopharm. 16:109-128. [DOI] [PubMed] [Google Scholar]


