

ABSTRACT
Neuropsychiatric disorders are associated with altered functional connectivity (FC); however, the reported regional patterns of functional alterations suffered from low replicability and high variability. This is partly because of differences in the atlas and delineation techniques used to measure FC‐related deficits within/across disorders. We systematically investigated the impact of the brain parcellation approach on the FC‐based brain network analysis. We focused on identifying the replicable FCs using three structural brain atlases, including Automated Anatomical Labeling (AAL), Brainnetome atlas (BNA) and HCP_MMP_1.0, and four functional brain parcellation approaches: Yeo‐Networks (Yeo), Gordon parcel (Gordon) and two Schaefer parcelletions, among correlation, group difference, and classification tasks in six neuropsychiatric disorders: attention deficit and hyperactivity disorder (ADHD, n = 340), autism spectrum disorder (ASD, n = 513), schizophrenia (SZ, n = 200), schizoaffective disorder (SAD, n = 142), bipolar disorder (BP, n = 172), and major depression disorder (MDD, n = 282). Our cross‐atlas/disorder analyses demonstrated that frontal‐related FC deficits were reproducible in all disorders, independent of the atlasing approach; however, replicable FC extraction in other areas and the classification accuracy were affected by the parcellation schema. Overall, functional atlases with finer granularity performed better in classification tasks. Specifically, the Schaefer atlases generated the most repeatable FC deficit patterns across six illnesses. These results indicate that frontal‐related FCs may serve as potential common and robust neuro‐abnormalities across 6 psychiatric disorders. Furthermore, in order to improve the replicability of rsfMRI‐based FC analyses, this study suggests the use of functional templates at larger granularity.
Keywords: brain atlases, brain network analysis, functional connectivity, psychiatry, replicability
In this study, 7 brain atlases, 6 brain disorders, and 3 analysis methods were systematically compared and analyzed. Our cross‐atlas/disorder analyses indicate that frontal‐related FCs may serve as potential common and robust neuro‐abnormalities across 6 psychiatric disorders. Furthermore, in order to improve the replicability of rsfMRI‐based FC analyses, this study suggests the use of functional templates at larger granularity.

1. Introduction
Functional magnetic resonance imaging (fMRI) is an important clinical and research tool in neuropsychiatric disorders (Raimondo et al. 2021). FMRI detects the coupling of periodic/spontaneous neural activity between proximal and distant brain areas termed functional connectivity (FC) (Noble et al. 2019; Sheline and Raichle 2013). FMRI studies on neuropsychiatric disorders showed significant alterations in the strength and the regional pattern of FC in cases vs. controls and linked them to symptom severity. Meta‐analyses of neuropsychiatric findings reported significant FC alterations in attention deficit and hyperactivity disorder (ADHD), autism spectrum disorder (ASD), schizophrenia (SZ), schizoaffective (SAD), bipolar disorder (BP) and major depression disorder (MDD) (Birur et al. 2017; Liu et al. 2023; Vissers et al. 2012; Wang et al. 2012). However, determining the consistency, disorder‐characteristic meta‐analytical FC patterns has been complicated because of the differences in the approaches used for parcellation of the cerebral landscape. For example, Yerys et al. used the Brodmann/Gordon atlas to report a link between the FC strength within the ventral attention (vATN) and retro‐splenial networks and symptom severity in ASD (Yerys et al. 2017). Whereas, another study used the Schaefer parcellation to suggest that ASD symptoms were linked to FC deficits between the salience network and executive control networks (Voldsbekk et al. 2024). A previous study using the Anatomical Automatic Labeling (AAL) atlas to construct FC reported a reduction in FC strength within the frontal and parietal lobes in SZ (Lynall et al. 2010). Conversely, another study using the Yeo‐Network (Yeo) atlas has failed to replicate SZ‐related deficits in FC (Dong et al. 2018). An ADHD study showed that the most diagnostic FCs were between the left middle occipital gyrus, left and right lingual gyrus (LNG) (Gao et al. 2020) based on AAL, while another study based on the Brainnetome atlas (BNA) reported dysfunction associated with the left inferior frontal gyrus (IFG), left middle temporal gyrus (MTG), and left insular gyrus instead (Hong et al. 2017). Heterogeneity of findings is common in neuropsychiatric research on FC and can partly be attributed to the diversity of brain parcellation approaches (Arslan et al. 2018; Moghimi et al. 2022), leading to the lack of reliable FC biomarkers (Elliott et al. 2021).
Commonly used FC‐based analyses are correlation between FC and symptom scores, group difference between patients and HCs, and classification analyses. Using different brain atlases under different analysis tasks yields inconsistent aberrant FC outcomes. Take SZ as an example: a previous research using the Schaefer atlas to construct FC reported a significant correlation between Positive and Negative Syndrome Scale (PANSS) scores and FC between the default mode and fronto‐parietal network (DMN‐FPN), and dysfunction between primary somatomotor network and visual network in group difference analysis (Ding et al. 2024). However, another study using the AAL atlas did not replicate the same changes in the two analyses (Lynall et al. 2010). An SZ classification study found the most discriminating FCs in DMN‐FPN using the Yeo atlas (Zeng et al. 2018), while another study reported FCs in limbic networks using the AAL and BNA atlases (Jain et al. 2021).
Most FC‐based studies focused on identifying potential FC biomarkers for a specific brain disorder under a single analysis framework based on a single brain atlas. Few studies contribute to identifying the reproducible FCs across multiple atlases, different analytical methods, and several brain disorders. In this study, 7 brain atlases, 6 brain disorders, and 3 analysis methods were systematically compared and analyzed. We aim to: (1) identify significant FCs for each disorder, each atlas, and each analysis method; (2) identify cross‐atlases replicable FCs in correlation, group difference, and classification analyses for each specific brain disorder; (3) identify cross‐atlases and cross‐analytical methods replicable FCs for each specific brain disorder; (4) identify cross‐atlases, cross‐analytical methods, and cross‐disorders replicable FCs; (5) summarize the effect of atlas selection on FC‐based brain network analyses.
2. Methods and Materials
2.1. Participants
Resting‐state fMRI (rs‐fMRI) data were selected from several disorder vs. HC's studies: ADHDs (n = 340) and HCs (n = 570) data were obtained from ADHD‐200 project (http://fcon_1000.projects.nitrc.org/indi/adhd200/index.html) (Milham et al. 2012). ASDs (n = 513) and HCs (n = 592) were collected from the Autism Brain Imaging Data Exchange (ABIDE II, https://fcon_1000.projects.nitrc.org/indi/abide/abide_II.html) (Di Martino et al. 2014; Di Martino et al. 2017). SZs (n = 200), SADs (n = 142), BPs (n = 172) and HCs (n = 247) were recruited from Bipolar and Schizophrenia Network of Intermediate Phenotypes (BSNIP) (Tamminga et al. 2013). Finally, MDDs (n = 282) and HCs (n = 316) were obtained from the West China Hospital of Sichuan, Henan Mental Hospital of Xinxiang, Beijing Anding Hospital and First Affiliated Hospital of Zhejiang (Qi et al. 2018; Zhi et al. 2018). The diagnosis of ADHD, ASD, SZ, SAD, BP and MDD were based on Structured Clinical Interview for DSM‐IV. ADHD Rating Scale IV (ADHD‐RS) (Pappas 2006) (measures of inattentive/impulsive behaviors) was used as symptom scores for ADHD. Autism Diagnostic Observation Schedule (ADOS) (ADOS 2013) was used for ASD. The Positive and Negative Syndrome Scale (PANSS) (Kay et al. 1987) was assessed for SZ and SAD. The Montgomery‐Asberg Depression Rating Scale (MADRS) (Montgomery and Asberg 1979) was used for BP and the Hamilton Depression Rating Scale (HDRS) (Snaith 1977) for MDD. The research program was approved by the institution review board at each local site. Written informed consents were obtained after providing a complete description of the research process to each participant. Detailed demographic and symptom scores can be found in Table 1. Rs‐fMRI data were collected for all participants. Detailed imaging parameters and preprocessing of rs‐fMRI can be found in Supporting Information “Imaging parameters” and “preprocessing” sections (Tables S1–S4). To further explore the effect of with and without global signal regression (GSR) in preprocessing (Hahamy et al. 2014; Li, Bolt, et al. 2019; Li, Kong, et al. 2019; Yang et al. 2014), we compared the results with and without GSR in two disorders (SZ and BP), using one atlas (Gordon) and one analysis method (group difference) (Supporting Information “Global signal regression”).
TABLE 1.
The demographic and clinical information of participants.
| Group | Number | Age (mean/SD) | Gender (M/F) | Symptom (mean/SD) |
|
|
|||
|---|---|---|---|---|---|---|---|---|---|
| Developmental disorders | ADHD | n = 340 | 11.4/2.8 | 267/73 | 112.1/45.1 | 5.0E−4 | 2.9e−17 | ||
| HC | n = 570 | 12.1/3.4 | 297/273 | NA | |||||
| ASD | n = 513 | 14.8/9.0 | 438/75 | 12.1/4.4 | 0.8 | 1.8e−10 | |||
| HC | n = 592 | 14.9/9.3 | 412/180 | NA | |||||
| Major psychiatric disorders | SZ | n = 200 | 34.6/12.0 | 138/62 | 16.6/5.5 | 1.5e−3 | 3.9e−09 | ||
| SAD | n = 142 | 36.5/12.1 | 61/81 | 18.3/5.1 | 0.1 | 0.8 | |||
| BP | n = 172 | 36.3/12.9 | 55/117 | 10.6/9.2 | 0.1 | 4.1e−2 | |||
| HC | n = 247 | 38.3/12.5 | 103/144 | NA | |||||
| MDD | n = 282 | 33.2/11.1 | 110/172 | 19.2/7.3 | 2.0E−2 | 0.8 | |||
| HC | n = 316 | 31.1/10.4 | 120/196 | NA |
Note: The symptom column means the mean and the standard deviation specific of symptom scores (inattentive and hyper/impulsivity for ADHD, ADOS for ASD, PANSS positive for SZ and SAD, MADRS for BP and HDRS for MDD, respectively). means group difference in age. means group difference in gender.
2.2. Brain Atlases
Both structural and functional brain atlases were systematically compared, including 3 structural atlases: (1) Automated Anatomical Labeling (AAL, 90 ROIs, excluding the cerebellum) (Tzourio‐Mazoyer et al. 2002); (2) Brainnetome atlas (BNA, 246 ROIs) (Fan et al. 2016); (3) HCP_MMP_1.0 (Glasser et al. 2016) (a multimodel atlas, the structural descriptions for its ROIs were used here, 360 ROIs), 4 functional atlases: (1) Yeo‐Networks (Yeo et al. 2011) (Yeo, 17‐network parcellation); (2) Gordon parcel (Gordon et al. 2016) (Gordon, 333 ROIs); (3) Schaefer (Schaefer et al. 2018) with multiple scales, ranging from 100 to 1000 ROIs, and 100/300 ROIs were used in this study. Note that subcortical regions were not included in the HCP_MMP_1.0 and these 4 functional atlases. To address this, the Tian subcortex parcellation, a subcortical atlas containing 16 ROIs (Tian et al. 2020), was added to the HCP_MMP_1.0 and 4 functional atlases. To figure out the impact of incorporating a subcortex atlas into 5 brain atlases devoid of subcortex on the reproducibility outcomes, we conducted comparison analysis pertaining to a specific disorder (SZ), three atlases (BNA, Gordon and Schaefer100), and one analysis method (group difference) (Supporting Information “Comparison between with and without subcortex”).
To facilitate the subsequent replicable FCs identification, the brain network definition of the 7 atlases were appropriately adjusted and the network‐level FC homogeneity of each atlas between SZs and HCs was illustrated (Supporting Information “Network adjustments”, Figures S1–S8 and Tables S5–S12). For the 3 structural atlases, seven brain regions were defined: frontal lobe (FL), temporal lobe (TL), parietal lobe (PL), occipital lobe (OL), insula (INS), limbic lobe (LL), and subcortex. For the 4 functional atlases, seven brain networks were prescribed: somatomotor network (SMN), executive control network (ECN), attention network (AN), limbic system (LS), default mode network (DMN), visual network (VIN), and subcortex.
2.3. Study Design
Based on the analytic plan pointed out in the introduction, we conducted the following procedures: (1) 7 brain atlases were compared (Figure 1a) on (2) rs‐fMRI of 6 different brain disorders (Figure 1b) by (3) FC analysis including correlation between FC and symptom scores, group difference between patients and HCs, and classification between patients and HCs (Figure 1c); (4) Replicable FCs were identified not only in the three FC analysis methods, but also across atlases, further across atlases across analytic approaches at the specific disorder and cross‐disorder levels, respectively (Figure 1d).
FIGURE 1.
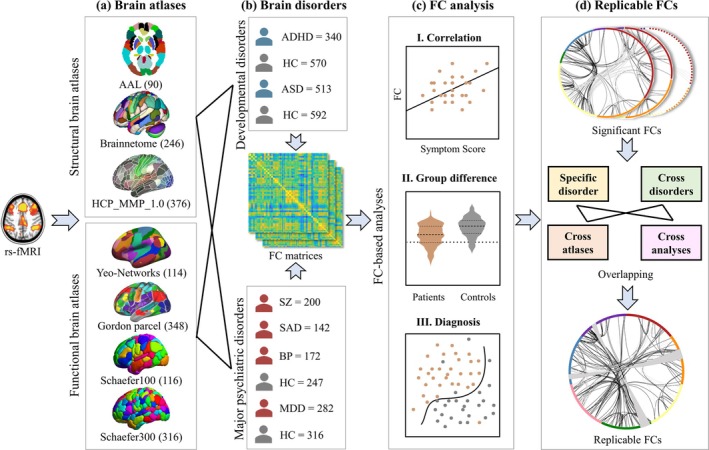
Analysis framework of this study. (a) Brain atlases compared, including 3 structural and 4 functional atlases. (b) 6 brain disorders studied, including ADHD (n = 340), ASD (n = 513), SZ (n = 200), SAD (n = 142), BP (n = 172) and MDD (n = 282). (c) FC analysis, including I. correlation between FC and symptom scores, II. group difference between patients and HCs, and III. classification between patients and HCs. (d) Replicable FCs identification in correlation, group difference, diagnosis, as well as across atlases, disorders, and analysis methods.
Specifically, averaged time course was extracted from each brain region generating a m T matrix for each subject (m represents number of ROIs, T represents time points). The FC matrix (m m) was constructed by calculating the Pearson's correlation between the time courses of each pair of brain regions for specific group. The lower triangular of FC matrices were used as features for the following analysis. Note that age, gender and data acquisition sites were regressed out prior to FC analysis to minimize the impact of potential confounding factors. Then, the correlations between each FC and symptom scores were evaluated. A two‐sample t‐test was performed on each FC to calculate the group difference between patients and HCs. The brain features selected by SelectFromModel were used to distinguish between patients and HCs based on logistics regression with regularization (details can be found in Supporting Information “Classification pipeline and Parameter settings”). Finally, the replicable FCs were identified by overlapping the FCs in correlation, group difference, diagnosis as well as across atlases, disorders and analysis methods. In order to elucidate the effect of calculating FC with or without the Fisher Z transformation, an additional group difference analysis between SZs and HCs was performed based on the BNA atlas, where Fisher Z transformation was used in FC construction (Supporting Information “Fisher Z transformation”).
3. Results
3.1. FC‐Based Correlation Analysis for Each Disorder Cross Atlases
Due to the different atlases with varying granularity and node description, replicable FCs were defined as the overlap of brain networks across atlases at a significant level or as top‐ranking contributors. Pearson correlation was performed between FC matrices constructed by different atlases and symptom scores for each specific disorder (Figure 2).
FIGURE 2.
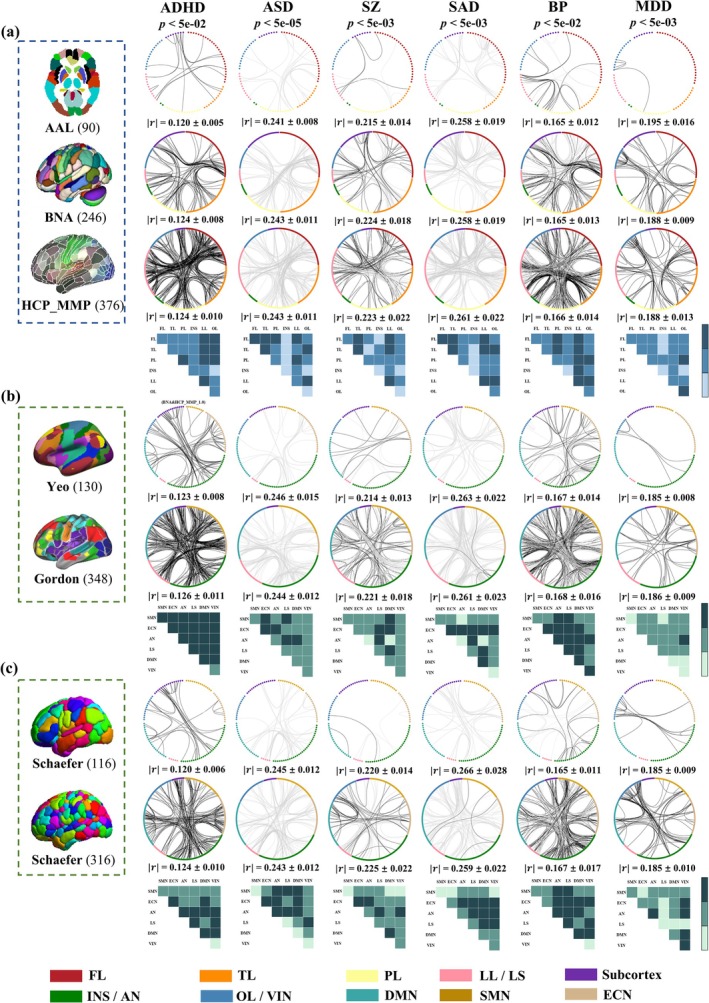
FC‐based correlations with symptom scores. Significant FCs correlated with symptoms in 3 structural atlases (a) and 2 functional atlases (b and c). Black/gray lines represent positive/negative correlations with symptom scores (FDR corrected, Supporting Information “FDR correction and permutation test”). Statistical significance that passed the FDR correction was denoted with an asterisk (*). Blue/green blocks represent replicable FCs of the structural/functional atlases. Deep‐colored blocks represent replicable FCs across all atlases, medium‐colored blocks represent across at least two atlases and light‐colored blocks represent absence of significant FCs. represents the mean of the absolute value of the correlation of significant FCs associated with symptom scores.
For ADHD, inattentive/impulsive scores were positively associated with FCs mainly in LL‐LL/FL/TL/PL in structural atlases (AAL, BNA and HCP_MMP_1.0). For functional atlases, FC results using the correlation analyses were inconsistent. The positive FCs in LS‐SMN/ECN and SMN‐DMN in Yeo; LS‐LS/ECN/AN in Gordon; LS‐LS/AN in Schaefer100; and AN‐AN/LS and ECN‐DMN in Schaefer300 were significant.
For ASD, ADOS scores were negatively correlated with FCs mainly in FL‐FL/TL/PL in structural atlases (AAL, BNA and HCP_MMP_1.0). For functional atlases, FCs using correlation analyses were inconsistent. The negative FCs in AN‐LS/ECN in Yeo; LS‐LS/DMN/SMN in Gordon; LS‐AN under Schaefer100; and LS‐AN/SMN and ECN‐AN in Schaefer300 were significant.
For SZ, PANSS positive scores were positively correlated with FCs primarily in LL‐LL with negative FCs in TL‐LL in AAL. Positive FCs in FL‐FL/LL with negative ones in FL‐TL in BNA and positive FCs in FL‐LL and negative ones in FL‐TL and TL‐LL in HCP_MMP_1.0 were significant. For functional atlases, positive FCs in ECN‐DMN/LS with negative FCs in AN‐LS in Yeo; positive FCs in LS‐ECN/LS and negative FCs in LS‐VIN/LS in Gordon; positive FCs in DMN‐DMN and VIN‐AN with negative FCs in AN‐LS in Schaefer100; and positive FCs in DMN‐VIN and negative FCs in AN‐LS in Schaefer300 were significant.
For SAD, PANSS positive scores were negatively correlated with FCs mainly in FL‐FL/TL and LL‐LL in AAL; LL‐LL/FL in BNA; and LL‐FL/TL/LL and FL‐TL in HCP_MMP_1.0. For functional atlases, the negative FCs in LS‐ECN/DMN in Yeo; LS‐LS/SMN/ECN/VIN in Gordon; LS‐ECN/AN in Schaefer100; and LS‐ECN/AN/DMN/VIN in Schaefer300 were significant.
For BP, MADRS scores were positively correlated with FCs primarily in PL‐LL, with negative FCs in TL‐LL in AAL. Positive FCs in FL‐TL/LL, with negative ones in FL‐LL in BNA, and positive FCs in LL‐TL/FL/OL and TL‐PL, with negative ones in FL‐TL and LL‐LL in HCP_MMP_1.0, were significant. For functional atlases, positive FCs in AN‐AN, with negative FCs in AN‐AN/ECN in Yeo; positive FCs in LS‐LS/DMN and negative FCs in LS‐LS/ECN in Gordon; positive FCs in AN‐AN and SMN‐LS, with negative FCs in AN‐DMN in Schaefer100; and positive FCs in AN‐AN, with negative FCs in AN‐ECN in Schaefer300, were significant.
For MDD, HDRS scores were positively associated with FCs mainly in OL‐OL in AAL, OL‐OL/PL in BNA, and FL‐TL/PL, OL‐OL/LL/PL in HCP_MMP_1.0. For functional atlases, the positive FCs primarily in VIN‐VIN/AN in Yeo; ECN‐ECN/AN and AN‐LS in Gordon; and VIN‐VIN/AN in Schaefer100 and Schaefer300 were significant.
3.2. FC‐Based Group Difference Analysis for Each Disorder Cross Atlases
Two sample t‐test was used to identify group different FCs between patients and HCs (Figure 3). For ADHD, increased FCs in PL‐PL and decreased FCs in FL‐LL were consistently identified across structural atlases (AAL, BNA and HCP_MMP_1.0). Similar to correlation analyses, FC results in group difference analyses were inconsistent across functional atlases for ADHD. Increased FCs in AN‐ECN/LS/DMN and SMN‐DMN with reduced FCs in DMN‐DMN in Yeo; increased FCs in AN‐AN and decreased LS‐AN FCs in Gordon; increased FCs in SMN‐ECN with reduced FCs in DMN‐DMN in Schaefer100; and increased ECN‐AN FCs and decreased DMN‐DMN and LS‐DMN FCs in Schaefer300 were significant.
FIGURE 3.
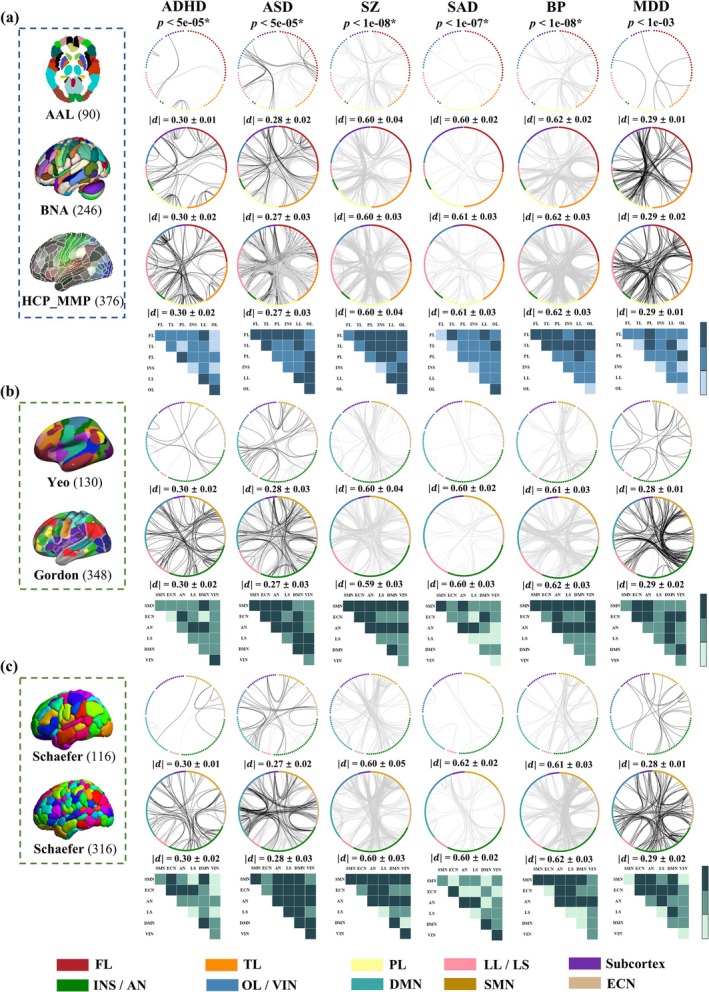
FC‐based group difference between patients and controls. Significant FCs in group difference in 3 structural atlases (a) and 2 functional atlases (b and c). Black/gray lines represent significant hyper−/hypo‐connectivity in patients compared with HCs (FDR corrected). Blue/green blocks represent replicable FCs of the structural/functional atlases. Deep‐colored blocks represent replicable FCs across all atlases, medium‐colored blocks represent across at least two atlases and light‐colored blocks represent absence of significant FCs. represents the mean of the absolute Cohen's d values for significant FC with group differences.
For ASD, enhanced FCs were primarily in FL‐FL and OL‐PL/LL, and the diminished FCs were in FL‐TL in AAL. Hyper‐connected FCs were in FL‐FL and TL‐LL, and hypo‐connected ones were in FL‐TL/LL in BNA. The majority of increased and reduced FCs in HCP_MMP_1.0 belonged to LL‐PL/LL, respectively. For functional atlases, increased FCs in AN‐DMN with reduced FCs in DMN‐DMN in Yeo; enhanced LS‐ECN/LS FCs and diminished SMN‐AN and SMN‐DMN FCs in Gordon; increased FCs in VIN‐ECN/DMN with decreased FCs in DMN‐DMN in Schaefer100; and hyper‐connected FCs in DMN‐VIN and hypo‐connected FCs in DMN‐DMN in Schaefer300 were significant.
For SZ, strength‐reduced FCs were primarily in PL‐TL/LL in AAL. Decreased FCs were in LL‐FL/PL in BNA (the same results were obtained between with and without Fisher Z transformation, Figure S9). The majority of reduced FCs in HCP_MMP_1.0 belonged to TL‐PL and OL‐PL/LL. For functional atlases, hypo‐connected FCs in AN‐LS in Yeo; SMN‐DMN in Gordon (the overlap between with and without GSR was 95.24%, Figure S10a); AN‐LL in Schaefer100; and SMN‐SMN/AN in Schaefer300 were significant.
For SAD, in structural atlases, strength‐reduced significant FCs primarily in FL‐LL in AAL; FL‐TL in BNA; and TL‐OL and LL‐LL in HCP_MMP_1.0. For functional atlases, decreased FCs in AN‐LS in Yeo; SMN‐SMN in Gordon; AN‐LL in Schaefer100; and AN‐VIN in Schaefer300 were significant.
For BP, in structural atlases, significant and diminished FCs were primarily in PL‐TL and FL‐TL/PL/OL in AAL; TL‐PL in BNA; and TL‐PL and FL‐PL/TL in HCP_MMP_1.0. For functional atlases, decreased FCs in AN‐AN/SMN in Yeo; AN‐DMN/SMN and SMN‐DMN in Gordon (the overlap between with and without GSR was 100%, Figure S10b); AN‐SMN/AN in Schaefer100; and SMN‐AN/SMN in Schaefer300 were significant.
For MDD, in structural atlases, strength‐enhanced significant FCs were in PL‐FL/TL/OL and TL‐LL in AAL; LL‐PL in BNA; and PL‐LL/FL and FL‐FL/LL in HCP_MMP_1.0. For functional atlases, hyper‐connected FCs in ECN‐AN/SMN in Yeo; AN‐SMN/DMN in Gordon; AN‐ECN in Schaefer100; and AN‐ECN/DMN/AN/SMN in Schaefer300 were significant. The significant FCs included in repeatability analysis (Figures 2 and 3) were still significant after permutation test (Figures S11–S12).
3.3. FC‐Based Classification Analysis for Each Disorder Cross Atlases
The top 0.5% contributing FCs are presented in Figure 4 as in the classification analysis for all atlases. In the diagnosis of ADHD, FCs in FL‐PL in AAL; FL‐FL and TL‐FL/LL in BNA; FL‐FL/TL/LL in HCP_MMP_1.0; AN‐AN/LS/DMN in Yeo; LS‐LS/DMN/VIN/AN in Gordon; LS‐ECN/DMN in Schaefer100; and AN‐SMN/ECN/DMN in Schaefer300 were mainly the most contributed features in classification.
FIGURE 4.
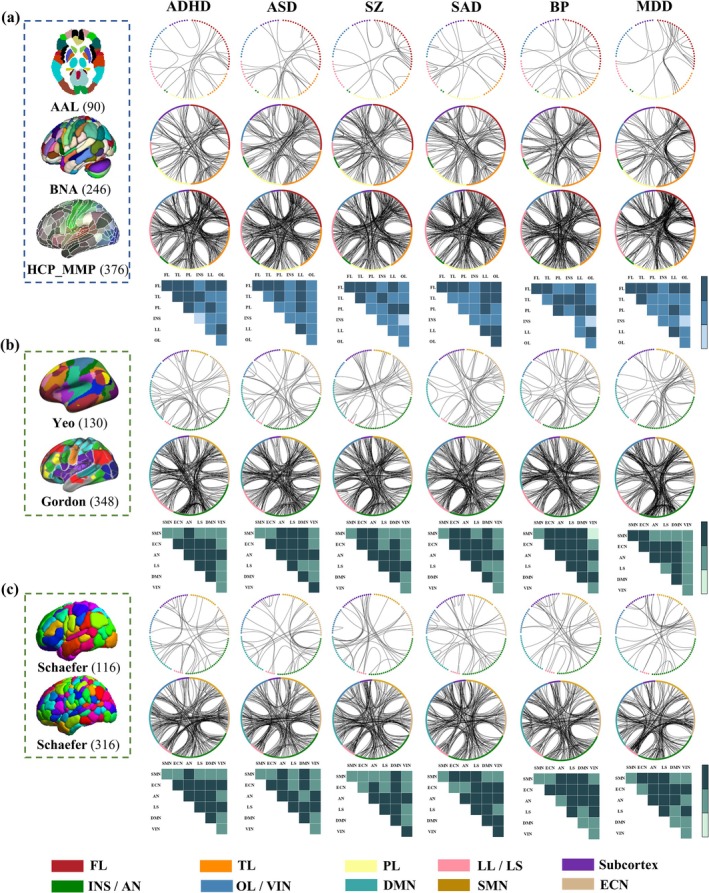
FC‐based classification. The top 0.5% contributing FCs in classification tasks in 3 structural atlases (a) and 2 functional atlases (b and c). Blue/green blocks represent replicable FCs of the structural/functional atlases. Deep‐colored blocks represent replicable FCs across all atlases, medium‐colored blocks represent across at least two atlases and light‐colored blocks represent absence of significant FCs.
In the diagnosis of ASD, FCs in FL‐PL in AAL; FL‐TL/PL/LL/FL in BNA; FL‐FL/LL in HCP_MMP_1.0; AN‐AN/ECN in Yeo; LS‐LS/ECN in Gordon; AN‐AN/SMN/ECN and ECN‐DMN in Schaefer100; and DMN‐ECN/AN and AN‐ECN in Schaefer300 were mainly the highest discriminative factors in classification.
In the diagnosis of SZ, FCs in FL‐FL in AAL; LL‐FL/TL and FL‐FL in BNA; FL‐LL/FL in HCP_MMP_1.0; DMN‐ECN in Yeo; LS‐LS/ECN in Gordon; LS‐AN/DMN and ECN‐DMN in Schaefer100; and DMN‐AN/ECN and AN‐LS in Schaefer300 were primarily the most contributed features in classification. Note that all the identified replicable FCs in classifying SZs and HCs (Figure 4) remained significant after the permutation test (Figure S13).
In the diagnosis of SAD, FCs in FL‐FL and LL‐LL/FL in AAL; TL–FL/LL in BNA; FL‐LL/TL/PL/FL and TL‐LL in HCP_MMP_1.0; AN‐ECN/LS in Yeo; LS‐LS/DMN/SMN in Gordon; LS‐AN and ECN‐VIN in Schaefer100; and SMN‐AN in Schaefer300 were mainly the highest discriminative in classification.
In the diagnosis of BP, FCs in FL‐TL/LL in AAL; FL‐FL/PL in BNA; PL‐LL/FL and FL‐LL in HCP_MMP_1.0; AN‐ECN/DMN in Yeo; LS‐LS/ECN/VIN in Gordon; LS‐AN in Schaefer100; and AN‐ECN/DMN/AN in Schaefer300 were primarily the most contributed features in classification.
In the diagnosis of MDD, FCs in FL‐FL/TL in AAL; TL‐FL/LL/TL and FL‐FL in BNA; FL‐LL/TL/FL in HCP_MMP_1.0; AN‐ECN in Yeo; LS‐LS/ECN/VIN in Gordon; LS‐ECN in Schaefer100; and ECN‐AN/LS and AN‐DMN in Schaefer300 were primarily the highest discriminative in classification.
FC‐based classification accuracy and AUC scores for each disorder by using different atlases are displayed in Figure S14. The functional atlas Gordon demonstrated the highest accuracy for classification across six disorders, with the highest classification accuracies observed for ADHD (92.14%), ASD (92.9%), SZ (95.58%), SAD (93.72%), BP (95.72%) and MDD (95.72%). Note that 1000 permutation tests were conducted on classification between SZs and HCs across 7 atlases. p‐value of 0.001 was obtained across 7 atlases, indicating that the observed accuracy was not obtained by random chance (Supporting Information “FDR correction and permutation test”).
To evaluate the robustness of our results, we applied the standard 10‐fold cross‐validation for 10 times to all classification tasks and compared the outcomes with the original results. The overlap between the top 0.5% contributed features from the standard 10‐fold cross‐validation for 10 times and our approach (Figure 4) exceeded 80% (Table S13), and the overlapping networks were consistent with the identified networks. The functional atlas Gordon still demonstrated the highest accuracy for classification in six disorders (Figure S15). To test whether atlases with finer resolution are associated with better classification performance due to overfitting (Zalesky et al. 2010), and to evaluate the generalizability of our results, we applied external validation in COBRE (Table S14), then compared the outcomes (Figure S16) with the original results. Functional atlases with finer granularity still showed superior performance. We also used the top 2% and 5% of FCs in the classification task for one disorder (SAD) using two atlases representing different ranges of granularities (AAL and BNA) to show the impact of different thresholds. Results (Figure S17) show that, among the top 2% and 5% contributing FCs, 80% and 85% of the FCs resulting from threshold expansion are located within the networks containing the top 0.5% contributing FCs in the coarse‐grained AAL (90 ROIs). In the fine‐grained BNA (246 ROIs), 99.33% and 98.74% of the FCs are situated within the network containing the top 0.5% of FCs. These results indicate that the identified replicable FCs are consistently robust across different thresholds.
The locations of the significant/top contributing FCs in the brain are shown in the Figures S18–S20. No notable laterality effects were observed in our analysis of neurobehavioral relationships, case–control differences, and classification performance.
3.4. Cross‐Atlases Replicable FCs in Correlation Analysis for 6 Disorders
The replicable FCs that were positively or negatively associated with symptom scores across 3 structural and 4 functional atlases for each specific disorder are presented in Table 2. For ADHD, replicable FCs associated with inattentive and hyper/impulsivity scores were primarily within LL and between LL and 3 other networks (FL, TL and PL) across 3 structural atlases, and within DMN and between DMN and 2 other networks (AN and ECN) and within AN and between AN and 3 other networks (LS, DMN and VIN) across 4 functional parcellations. For ASD, replicable FCs negatively correlated with ADOS scores were generally located within FL and between FL and 3 other networks (TL, PL and LL) across structural atlases, and between AN and 3 other networks (ECN, LS and DMN) across functional atlases. For SZ, overlapping FCs correlated with PANSS scores were mainly located within LL and between LL and 2 other networks (FL and TL), and within TL and between TL and 2 other networks (FL and LL) across 3 structural atlases, and between AN and LS across functional parcellations. For SAD, reproducible FCs associated with PANSS scores were predominately located within TL and between TL and 3 other networks (FL, LL and OL), and within LL and between LL and 3 other networks (FL, OL and TL) across structural atlases, and between ECN and 4 other networks (AN, LS, DMN and VIN) across 4 functional atlases. For BP, the majority of replicable FCs negatively correlated with MADRS scores were located within LL and between LL and 5 other networks (FL, TL, PL, INS and OL) across structural atlases, and within AN and between AN and 4 other networks (SMN, ECN, LS and DMN) and within LS and between LS and 3 other networks (SMN, ECN and AN) across 4 functional atlases. For MDD, reproducible FCs associated with HDRS scores were within the OL and between OL and PL in structural atlases, and the AN‐VIN in functional atlases. Details about reproducible FCs cross‐structural/functional/Schaefer atlases were displayed in the Figures S21–S26 and Tables S15–S38.
TABLE 2.
Replicable FCs across structural and functional atlases for each disorder in the correlation analysis with symptoms.
| Group | Replicable FCs | |
|---|---|---|
| Structural atlases | Functional atlases | |
| ADHD |
LL‐FL/TL/PL/LL OL‐FL/TL/PL PL‐PL |
AN‐AN/LS/DMN/VIN DMN‐DMN/VIN/ECN LS‐LS/VIN ECN‐ECN |
| ASD |
FL‐FL/TL/PL/LL TL‐TL/OL LL‐OL/PL |
AN‐ECN/LS/DMN LS‐SMN ECN‐ECN |
| SZ |
TL‐FL/TL LL‐FL/TL/LL |
AN‐LS |
| SAD |
FL‐FL TL‐FL/TL/LL/OL LL‐FL/LL/OL |
ECN‐AN/LS/DMN/VIN LS‐DMN/AN |
| BP |
PL‐FL/TL/OL LL‐FL/TL/PL/LL/INS/OL |
AN‐SMN/ECN/AN/LS/DMN LS‐SMN/ECN/LS DMN‐ECN/DMN |
| MDD | OL‐PL/OL | AN‐VIN |
3.5. Cross‐Atlases Replicable FCs in Group Difference Analysis for 6 Disorders
In group difference analysis, the replicable FCs increasing or decreasing for each disorder comparing with HCs across 3 structural and 4 functional atlases are displayed in Table 3. For ADHD, overlapping hyper‐connectivity was predominately within LL and between LL and FL across structural parcellations, and restricted to SMN‐DMN and ECN‐AN across functional atlases. For ASD, replicable FCs concentrated within FL and between FL and 4 other networks (TL, PL, INS and LL) in structural atlases, and within DMN and between DMN and 4 other networks (ECN, SMN, AN and VIN) and within AN and between AN and 4 other networks (SMN, ECN, LS and DMN) in 4 functional atlases. For SZ, reproducible hyper‐connectivity was predominately between FL, TL, LL, and OL and 2 other networks (PL and INS) in structural atlases, within SMN and between SMN and 5 other networks (AN, ECN, LS, DMN and VIN) and within AN and between AN and 4 other networks (ECN, LS, DMN and VIN) in functional atlases, and the same results were also observed comparing with and without subcortex (Figure S27 and Table S39). Although the exclusion of subcortex atlases impacts the number of FCs between the other brain regions, it does not affect the final identified reproducible FCs, proving that appending the same subcortical atlas to 5 of the 7 atlases used in the paper did not inflate the generalizability of FC alterations in the subcortical and limbic network across atlases and disorders. For SAD, replicable strength‐reduced FCs were predominately between FL and 2 other networks (LL and TL) and within OL and between OL and TL in structural atlases and AN‐AN/LS across 4 functional atlases. For BP, overlapping hypo‐connectivity was predominately within TL and between TL and 5 other networks (FL, PL, INS, LL and OL) in structural atlases, and within AN and between AN and 5 other networks (SMN, ECN, LS, DMN and VIN) in functional atlases. For MDD, replicable strength‐enhanced FCs were predominantly located between PL and 3 other networks (FL, TL and OL) across structural atlases, and within ECN and between ECN and 3 other networks (SMN, ECN, AN and DMN) across functional atlases. Details about reproducible FCs of cross‐structural/functional/Schaefer atlases are displayed in the Figures S21–S26 and Tables S15–S38.
TABLE 3.
Replicable FCs across structural and functional atlases for each disorder in group difference analysis.
| Group | Replicable FCs | |
|---|---|---|
| Structural atlases | Functional atlases | |
| ADHD |
LL‐FL/LL PL‐PL OL‐OL |
SMN‐DMN ECN‐AN |
| ASD |
FL‐FL/TL/PL/INS/LL TL‐TL/LL OL‐PL/INS/LL/OL LL‐LL |
DMN‐ECN/AN/LS/DMN/VIN AN‐SMN/ECN/AN/LS SMN‐SMN/LS |
| SZ |
FL‐TL/PL/INS/LL/OL TL‐PL/INS/LL/OL LL‐PL/LL/OL OL‐INS/OL PL‐INS |
SMN‐SMN/ECN/AN/LS/DMN/VIN AN‐ECN/AN/LS/DMN/VIN DMN‐DMN |
| SAD |
FL‐LL/TL OL‐TL/OL |
AN‐AN/LS |
| BP |
TL‐FL/TL/PL/INS/LL/OL FL‐FL/PL/LL/OL PL‐LL |
AN‐SMN/ECN/AN/LS/DMN/VIN SMN‐SMN/ECN/LS/DMN |
| MDD |
PL‐FL/TL/OL TL‐LL |
ECN‐SMN/ECN/AN/DMN AN‐SMN LS‐DMN |
3.6. Cross‐Atlases Replicable FCs in Classification Analysis for 6 Disorders
For each specific disorder, there was notable overlap within the top 0.5% contributing FCs extracted from 3 structural and 4 functional atlases, respectively (Table 4). For ADHD, a significant portion of the top contributed FCs overlapped predominantly within FL and between FL and 4 other networks (TL, PL, LL and OL) in structural atlases, and within AN and between AN and 4 other networks (SMN, ECN, LS and DMN) in functional parcellations. For ASD, the most discriminative FCs mainly overlapped within FL and between FL and 3 other networks (TL, PL and LL) and within LL and between LL and 3 other networks (FL, TL and PL) across 3 structural atlases, and within AN and between AN and 4 other networks (SMN, ECN, LS and VIN) across 4 functional atlases. For SZ, the top contributing replicable FCs were primarily located within FL and between FL and 3 other networks (TL, PL and LL) across structural atlases, and within AN and between AN and 3 other networks (ECN, LS and DMN) and within DMN and 3 other networks (ECN, LS and AN) across functional atlases. For SAD, the most discriminative FCs primarily overlapped within FL and between FL and 4 other networks (TL, PL, LL and OL) and within LL and between LL and 4 other networks (TL, PL, FL and OL) across structural parcellations, and between AN and 5 other networks (SMN, ECN, LS, DMN and VIN) across functional atlases. For BP, the top contributing replicable FCs were primarily located between TL and 4 other networks (FL, PL, INS and LL), within PL and between PL and 2 other networks (LL and OL), and between LL and 2 other networks (FL and OL) across structural parcellations, and between AN and 5 other networks (SMN, ECN, LS, DMN and VIN) across functional atlases. For MDD, the majority of top key FCs were extracted from FCs within FL and between FL and 4 other networks (TL, PL, LL and OL) from structural atlases, and between ECN and 4 other networks (SMN, AN, LS and DMN) and within AN and between AN and 3 other networks (ECN, LS and DMN) from functional atlases. Details about reproducible features of cross‐structural/functional/Schaefer atlases are displayed in the Figures S21–S26 and Tables S15–S38.
TABLE 4.
Replicable FCs across structural and functional atlases for each disorder in classification analysis.
| Group | Replicable FCs | |
|---|---|---|
| Structural atlases | Functional atlases | |
| ADHD |
FL‐FL/TL/PL/LL/OL TL‐TL/PL/INS PL‐PL/LL LL‐OL |
AN‐SMN/ECN/AN/LS/DMN ECN‐ECN/LS/DMN LS‐LS/DMN DMN‐DMN |
| ASD |
FL‐FL/TL/PL/LL LL‐TL/PL/LL TL‐PL |
AN‐SMN/ECN/AN/LS/VIN DMN‐SMN/ECN/DMN ECN‐ECN LS‐LS |
| SZ |
FL‐FL/TL/PL/LL TL‐TL/INS PL‐LL/OL |
AN‐ECN/AN/LS/DMN DMN‐ECN/LS/DMN LS‐LS |
| SAD |
FL‐FL/TL/PL/LL/OL LL‐TL/PL/LL/OL OL‐TL/OL |
AN‐SMN/AN/LS/DMN/VIN ECN‐SMN/LS/DMN LS‐LS DMN‐DMN |
| BP |
TL‐FL/PL/INS/LL PL‐PL/LL/OL LL‐FL/OL FL‐FL |
AN‐SMN/ECN/LS/DMN/VIN ECN‐ECN/LS/DMN LS‐SMN/LS DMN‐SMN |
| MDD |
FL‐FL/TL/PL/LL/OL LL‐PL/LL TL‐TL |
ECN‐SMN/AN/LS/DMN AN‐AN/LS/DMN |
3.7. Cross‐Atlases Replicable FCs Over 3 Analysis Methods for 6 Disorders
Based on the reproducibility across atlases within each analysis method for each disorder, we additionally identified their overlap across three analysis methods. Apart from MDD, we observed shared abnormalities in frontal‐related (FL‐related) FCs across the other five disorders (Table 5).
TABLE 5.
Replicable FCs across structural and functional atlases and across three brain analysis methods for each disorder.
| Group | Replicable FCs | ||
|---|---|---|---|
| Structural atlases | Functional atlases | ||
| ADHD |
FL‐LL PL‐PL |
AN‐LS/ECN/DMN | (Yeo & Gordon) |
| ECN‐ECN DMN‐DMN | (Schaefer) | ||
| ASD | FL‐FL/TL/PL/LL | AN‐LS/ECN | |
| SZ | FL‐TL | AN‐LS | |
| SAD |
FL‐TL/LL TL‐OL |
AN‐LS | |
| BP |
TL‐PL/LL FL‐LL PL‐LL |
AN‐LS/ECN/SMN/DMN SMN‐LS |
|
| MDD | \ | \ | |
3.8. Cross‐Atlases Replicable FCs Over 6 Disorders and 3 Analysis Methods
We finally evaluated the reproducible FCs across disorders, atlases, and analysis methods. However, in the analysis concerning correlation with symptom scores and group difference, no overlapping FC was identified across disorders and atlases. Conversely, in the diagnosis analysis, overlapped FCs fell within six well‐characterized large‐scale network interactions: FL‐FL, FL‐TL, FL‐LL, and PL‐LL across three structural atlases, and ECN‐DMN and AN‐LS across four functional parcellations.
4. Discussion
This study investigated the reproducibility of FC features using seven brain parcellation and three analytical approaches across six neuropsychiatric disorders. We evaluated the impact of the choice in the parcellation approach and showed that frontal‐related FC deficits were the most robust categorical features amongst the six brain disorders and across the 3 analytical methods. Parcellation based on functional atlases with finer granularity was associated with a better classification performance. Furthermore, the parcellation using Schaefer atlases yielded the most reproducible FC findings across the three analytical methods. Frontal lobe FC deficits are the most common and replicable finding across the six illnesses.
In developmental disorders (including ADHD and ASD), the symptom‐associated networks involving the FL‐LL, PL‐LL, and TL‐OL were replicable across the 3 structural atlases. Likewise, in these disorders, symptom‐associated networks involving ECN‐ECN, AN‐LS, and AN‐DMN were replicable across 4 functional atlases. Independent lines of studies supported our results that the symptom severity of ADHD and ASD was associated with altered intrinsic connectivity networks interrelationships, for example, a significant positive correlation between vATN‐DMN (AN‐DMN) and total scores of ADHD symptoms (Guo et al. 2020) and a correlation between social functioning ADOS scores and posterior cingulate cortex (PCC) with superior frontal gyrus (SFG) FCs (FL‐LL) (Monk et al. 2009). Also in ASD, ADOS was negatively associated with PCC, insula, and superior temporal gyrus (STG) (LL‐, AN‐ and TL‐related) FCs (Li, Becker, et al. 2019). Another correlation analysis (Assaf et al. 2010) showed significant negative correlations between the precuneus (ECN) and ADOS. A previous study also found the anterior cingulate cortex (ACC, LL‐related) to have a stronger correlation with symptoms in the developmental disorder group (Qiu et al. 2024). The symptom‐associated replicable FL‐LL, LL‐LL, and TL‐LL across 3 structural atlases, as well as replicable AN‐LS across 4 functional atlases were identified in schizophrenia spectrum disorders (including SZ, SAD and BP). These results are consistent with previous studies. A study showed FCs in postcentral (POG)‐frontal gyri (AN‐related) were significantly negatively correlated with PANSS positive/negative scores in schizophrenia spectrum disorders (Du et al. 2017). There were also correlations between PANSS positive scores and the anterior medial prefrontal cortex (PFC) with the PCC (LL‐FL) in SZ (Whitfield‐Gabrieli et al. 2009) and between MADRS and amygdala with hippocampus (LL‐LL) in BP (Krystal et al. 2024). The symptom‐associated replicable PL‐OL and OL‐OL across 3 structural atlases, as well as replicable AN‐VIN across 4 functional atlases were identified in MDD. Previous studies showed that HDRS was significantly correlated with the FC values of the cingulo‐opercular network (AN‐related) (Wu et al. 2016) and FC between medial PFC and left angular gyrus (PL‐related) (Wang et al. 2019).
The replicable group different FCs for developmental disorders mainly located in FL‐LL, LL‐LL, and OL‐OL across 3 structural atlases, and in ECN‐AN and SMN‐DMN across 4 functional atlases. This is consistent with previous studies examining differences between developmental disorders and HCs, especially precuneus (ECN), POG (AN), PCC, LNG, and parahippocampal gyrus (PHG) (LL) (Di Martino et al. 2013; Lee et al. 2016). FCs which were replicable in FL‐TL, FL‐LL, and TL‐OL across 3 structural atlases, and in AN‐LS and AN‐AN across 4 functional atlases were identified in schizophrenia spectrum disorders, which were widely reported in schizophrenia spectrum disorders, such as IFG‐STG (FL‐TL), PFC (FL), INS (AN), POG (AN) and thalamus (LL) (Du et al. 2017; Liang et al. 2023; Roberts et al. 2017). FCs which were replicable in PL‐TL, PL‐FL, PL‐OL, and TL‐LL across 3 structural atlases, and in ECN‐SMN, ECN‐ECN, ECN‐AN, ECN‐DMN, AN‐SMN, and LS‐DMN across 4 functional atlases were identified for MDD group, which were similar to previous MDD study, especially abnormal hypo‐connectivity in FPN (PL‐FL), FPN‐DAN (ECN‐AN), SMN‐DAN (AN) and precuneus‐median cingulate cortex (ECN‐ECN) and hyper‐connectivity in DMN (mPFC and PCC) and DMN‐FPN (ECN) (Chai et al. 2016; Ho et al. 2015; Kaiser et al. 2015; Wise et al. 2017; Yan et al. 2019; Zhang et al. 2023).
The top diagnostic replicable FL‐FL, FL‐TL, FL‐PL, FL‐LL, TL‐PL, and PL‐LL across 3 structural atlases, as well as replicable AN‐SMN, AN‐ECN, AN‐AN, AN‐LS, ECN‐ECN, ECN‐DMN, LS‐LS, and DMN‐DMN across 4 functional atlases were identified in developmental disorders, which were consistent with previous work, such as anatomical regions LL (cingulate)‐, PL (supramarginal Gyrus)‐ and TL (MTG)‐ related FCs and functional networks SMN (postcentral gyri bilaterally)‐, DMN (right precuneus)‐, ECN (FPN)‐ and AN‐related FCs in ASD (Chen et al. 2015; Heinsfeld et al. 2018; Jiao et al. 2020). Other studies on classification between ADHD and HC also showed MFG‐IPL (FL‐PL), DMN‐, and LS (inferior orbitofrontal cortex)‐related FCs as highly contributing features (Chen et al. 2019; Luo et al. 2020; Wang et al. 2023). The top contributing replicable FL‐FL, FL‐TL, FL‐LL, and PL‐LL across 3 structural atlases, as well as replicable AN‐LS, AN‐DMN, ECN‐DMN, and LS‐LS across 4 functional atlases were identified in schizophrenia spectrum disorders, which were widely reported in the diagnosis of schizophrenia spectrum disorders, especially functional network DMN (Sendi et al. 2022) and anatomical regions FL, TL, and PL, relating to hearing, cognition, and motion functions (Du et al. 2020). The top contributing replicable FL‐FL, FL‐TL, FL‐LL, FL‐PL, FL‐OL, LL‐PL, LL‐LL, and TL‐TL across 3 structural atlases, as well as replicable ECN‐SMN, ECN‐AN, ECN‐LS, ECN‐DMN, AN‐AN, AN‐LS, and AN‐DMN across 4 functional atlases were identified in MDD, which were widely reported, especially FCs in DMN, VIN (OL), AN (left and right medial frontal cortex), LS, and LL (amygdala, hippocampus, thalamus and ACC), FL (the ventrolateral and ventromedial PFC) and TL (STG) (Gallo et al. 2023; Zeng et al. 2014, 2012; Zhang, Liu, Liu, et al. 2022).
It is worth noting that reproducible FCs related to the frontal lobe were consistently identified across 3 analysis methods for developmental disorders and psychosis spectrum disorders. The frontal lobe is a critical functional area, occupying approximately one‐third of the cerebral hemisphere surface, and has been implicated in a variety of social, cognitive, and affective functions that are commonly disrupted in psychiatric disorders (Hiser and Koenigs 2018). Cognitive deficits, in particular, are a hallmark of numerous neuropsychiatric and neurodevelopmental disorders with shared frontal‐FC alterations. IFG has been frequently implicated in ADHD and is a key region involved in cognitive and behavioral control (Aron and Poldrack 2005). Abnormal connections related to symptom severity in ASD were associated with the right medial SFG (Chen et al. 2017). Reduced functional connectivity between the striatum and the PFC has been reported as playing a key role in positive symptoms of SZ, particularly in hallucinations and bizarre behavior (Fusar‐Poli et al. 2010; Howes and Kapur 2009). Abnormal functional activation in the frontal‐limbic system was widely reported in both BP and MDD (Chen et al. 2018; Rive et al. 2013; Stalnaker et al. 2015). Previous diagnosis analysis of the 6 psychiatric disorders also supports our findings. A classification study on ASD has found discriminative components located in the frontal region correlated with neuro‐circuits involved in autism‐related impairments in ADOS (Dekhil et al. 2018). Specific subnetworks centered on SFG and IFG have been identified exhibiting significantly high classification accuracies for SZ (Chen et al. 2024; Du et al. 2015; Luo et al. 2020; Roberts et al. 2017; Zhang, Liu, Chen, et al. 2022). A polygenic risk study also elucidated frontotemporal abnormalities in SZ (Qi et al. 2022). These results further support the importance of the frontal region in psychiatric neurobiology.
Our results demonstrate that the difference in type, granularity, and criteria for delimitation and naming for brain atlases may affect the results of FC analysis. Variability in the granularity of atlases has a significant impact on the extraction of overlapping FCs and diagnostic accuracy. Coarser granularity of atlases indicates a greater number of voxels encompassed within the same node. When computing FC, atlases with coarser granularity may lack specific disorder‐related information essential for FC analysis when averaging voxel BOLD signals within a node, compared with finer‐grained atlases. This may render it challenging to identify replicable biomarkers across atlases and more difficult to discern subtle distinctions that may exist between patients and healthy individuals. Secondly, utilizing fine‐grained functional atlases in brain network analysis can yield superior classification outcomes. After using the same parameter set for all diagnostic tasks, the findings suggest that functional atlases tend to outperform structural atlases with similar segmentation granularity. This trend may be attributed to the intricate and diverse nature of human mental processes and cognitive behaviors (Buckner et al. 2008; Langs et al. 2011). Prior neuroimaging studies have demonstrated that complex cognitive tasks engage spatially distributed, large‐scale association networks (Fair et al. 2007; Keller et al. 2023). Furthermore, cognitive impairments are prevalent in psychiatric disorders. Hence, functional atlases may provide more precise information pertaining to brain disorders during brain network analysis. Thirdly, employing different granularity levels of the same atlases facilitates the extraction of reproducible features. When comparing the reproducible features of various disorders using two functional atlases, Yeo and Gordon, and two different granularity versions of the Schaefer parcellations, it becomes evident that it is simpler to discern replicable features in the latter case. This phenomenon can be attributed to the fact that refining granularity on the basis of the same atlas implies a more profound subdivision of existing nodes, and the principles and processes of division remain grounded in the same set of criteria (Doucet et al. 2019; Levi et al. 2023). Utilizing different granularity levels of the same atlases may offer more advantages in identifying reproducibility compared to atlases characterized by varying delineation criteria.
Several limitations should be considered when interpreting our findings. First, the current datasets were collected with different MRI scanners. To address this, site co‐variance was regressed out from FC matrices prior to FC‐based brain network analysis. Second, clinical subjects were mostly treated based on standard of care (eg: antipsychotic medications for SZ and antidepressants for MDD). Psychotropic medications can affect FC (Gao et al. 2012; Linke et al. 2017). However, the lack of medication information at the time of the scan would bias the identified FCs. Third, network demarcation plays a major role in the overlapping FC across atlases. The construction of atlases lacks a standardized division or naming of networks (e.g., for the structural atlases, AAL incorporates the insula into the limbic cortex, whereas HCP_MMP_1.0 does not list the limbic cortex separately; for the functional atlases Gordon uses different criteria of networks delineation than the other three, and names the limbic system as “None”), some results may be disregarded by direct cross‐atlas reproducibility analyses. This issue is especially prominent when conducting direct reproducibility analysis between structural and functional atlases. However, we circumvented this problem to some extent by redefining all atlases into brain regions before cross‐atlas reproducibility analysis. Furthermore, we employed different network categories for structural and functional atlases, as there are no standardized criteria to map two types of atlases (Fan 2021; Moghimi et al. 2022). However, the atlases adjustment process may have introduced some human factors, such as determining the correspondence between brain regions or networks in different atlases, which may have a degree of subjectivity. Moreover, this study focused on the reproducibility of cortical FCs, and therefore, the reproducibility of subcortical FCs was not analyzed separately but was incorporated into the limbic cortex as Supporting Information. Results showed that the exclusion of subcortex atlases does not affect the final identified reproducible FCs (Figure S27 and Table S39). Collapsing all subcortical ROIs into a single network may be inappropriate, as substantial evidence shows distinct circuits for sensory, motor, limbic, and associative processing across the subcortex (Ji et al. 2019).
In conclusion, to the best of our knowledge, this is the first study to identify reproducible FCs cross atlas, cross disorders, and cross analytical approach with a large sample size of rs‐fMRI data. We found that there were replicable FCs across atlases for each disorder in each analytical method, in which frontal‐related FCs were the shared dysfunction across all pipelines. The selection of atlases influenced replicable FC extraction and classification accuracy. Functional atlases with finer granularity outperformed anatomic atlases for classification. Schaefer atlases, in particular, generated repeatable FCs for the 3 analytical approaches in replicable FC extraction. These findings indicate that the frontal‐related FCs may be strong neuro‐abnormalities that are common for 6 psychiatric disorders. Furthermore, the difficulty of obtaining replicable FC features is increased by the variability in granularity, types, and network delineation methods as well as the disparities in spatial locations of homonymous networks throughout brain atlases. In order to improve the replicability of FC‐based brain network analysis, we suggest the use of functional parcellations at large granularity.
Author Contributions
Xiaoya Wu performed the data analysis and wrote the initial draft. Shile Qi conceptualized the study and wrote the paper. Chuang Liang wrote the paper. Juan Bustillo, Peter Kochunov, Xuyun Wen, Jing Sui, Rongtao Jiang, Xiao Yang, Daoqiang Zhang, and Vince D. Calhoun revised the paper. Zening Fu preprocessed the fMRI data.
Conflicts of Interest
The authors declare no conflicts of interest.
Supporting information
Data S1. Supporting Information.
Acknowledgments
This work was supported by grants from the Key Research and Development Plan of Jiangsu Province (BE2023668), the Natural Science Foundation of Jiangsu Province, China (BK20220889) and the National Natural Science Foundation of China (62376124).
Funding: This work was supported by Jiangsu Provincial Key Research and Development Program, BE2023668. Natural Science Foundation of Jiangsu Province, BK20220889. National Natural Science Foundation of China, 62376124.
Xiaoya Wu and Chuang Liang contributed equally to this work.
Contributor Information
Vince D. Calhoun, Email: vcalhoun@gsu.edu.
Shile Qi, Email: shile.qi@nuaa.edu.cn.
Data Availability Statement
The MDD data can be accessed upon reasonable request to Dr. Sui (jsui@bnu.edu.cn). The BSNIP, ASD, and ADHD data and clinical information can be accessed upon reasonable request to Dr. Calhoun (vcalhoun@gsu.edu).
References
- ADOS . 2013. Encyclopedia of Autism Spectrum Disorders, edited by Volkmar F. R., 60. Springer. [Google Scholar]
- Aron, A. R. , and Poldrack R. A.. 2005. “The Cognitive Neuroscience of Response Inhibition: Relevance for Genetic Research in Attention‐Deficit/Hyperactivity Disorder.” Biological Psychiatry 57, no. 11: 1285–1292. 10.1016/j.biopsych.2004.10.026. [DOI] [PubMed] [Google Scholar]
- Arslan, S. , Ktena S. I., Makropoulos A., Robinson E. C., Rueckert D., and Parisot S.. 2018. “Human Brain Mapping: A Systematic Comparison of Parcellation Methods for the Human Cerebral Cortex.” NeuroImage 170: 5–30. 10.1016/j.neuroimage.2017.04.014. [DOI] [PubMed] [Google Scholar]
- Assaf, M. , Jagannathan K., Calhoun V. D., et al. 2010. “Abnormal Functional Connectivity of Default Mode Sub‐Networks in Autism Spectrum Disorder Patients.” NeuroImage 53, no. 1: 247–256. 10.1016/j.neuroimage.2010.05.067. [DOI] [PMC free article] [PubMed] [Google Scholar]
- Birur, B. , Kraguljac N. V., Shelton R. C., and Lahti A. C.. 2017. “Brain Structure, Function, and Neurochemistry in Schizophrenia and Bipolar Disorder—A Systematic Review of the Magnetic Resonance Neuroimaging Literature.” NPJ Schizophrenia 3, no. 1: 15. 10.1038/s41537-017-0013-9. [DOI] [PMC free article] [PubMed] [Google Scholar]
- Buckner, R. L. , Andrews‐Hanna J. R., and Schacter D. L.. 2008. “The Brain's Default Network.” Annals of the New York Academy of Sciences 1124, no. 1: 1–38. 10.1196/annals.1440.011. [DOI] [PubMed] [Google Scholar]
- Chai, X. J. , Hirshfeld‐Becker D., Biederman J., et al. 2016. “Altered Intrinsic Functional Brain Architecture in Children at Familial Risk of Major Depression.” Biological Psychiatry 80, no. 11: 849–858. 10.1016/j.biopsych.2015.12.003. [DOI] [PMC free article] [PubMed] [Google Scholar]
- Chen, C. P. , Keown C. L., Jahedi A., et al. 2015. “Diagnostic Classification of Intrinsic Functional Connectivity Highlights Somatosensory, Default Mode, and Visual Regions in Autism.” NeuroImage: Clinical 8: 238–245. 10.1016/j.nicl.2015.04.002. [DOI] [PMC free article] [PubMed] [Google Scholar]
- Chen, H. , Nomi J. S., Uddin L. Q., Duan X., and Chen H.. 2017. “Intrinsic Functional Connectivity Variance and State‐Specific Under‐Connectivity in Autism.” Human Brain Mapping 38, no. 11: 5740–5755. 10.1002/hbm.23764. [DOI] [PMC free article] [PubMed] [Google Scholar]
- Chen, L. , Wang Y., Niu C., et al. 2018. “Common and Distinct Abnormal Frontal‐Limbic System Structural and Functional Patterns in Patients With Major Depression and Bipolar Disorder.” NeuroImage: Clinical 20: 42–50. 10.1016/j.nicl.2018.07.002. [DOI] [PMC free article] [PubMed] [Google Scholar]
- Chen, M. , Li H., Wang J., Dillman J. R., Parikh N. A., and He L.. 2019. “A Multichannel Deep Neural Network Model Analyzing Multiscale Functional Brain Connectome Data for Attention Deficit Hyperactivity Disorder Detection.” Radiology: Artificial Intelligence 2, no. 1: e190012. 10.1148/ryai.2019190012. [DOI] [PMC free article] [PubMed] [Google Scholar]
- Chen, Y. , Wang S., Zhang X., et al. 2024. “Functional Connectivity‐Based Searchlight Multivariate Pattern Analysis for Discriminating Schizophrenia Patients and Predicting Clinical Variables.” Schizophrenia Bulletin 51, no. 1: sbae084. 10.1093/schbul/sbae084. [DOI] [PMC free article] [PubMed] [Google Scholar]
- Dekhil, O. , Ali M., Shalaby A., et al. 2018. “Identifying Personalized Autism Related Impairments Using Resting Functional MRI and ADOS Reports.” In Paper Presented at the Medical Image Computing and Computer Assisted Intervention – MICCAI 2018. Springer International Publishing. [Google Scholar]
- Di Martino, A. , O'Connor D., Chen B., et al. 2017. “Enhancing Studies of the Connectome in Autism Using the Autism Brain Imaging Data Exchange II.” Scientific Data 4, no. 1: 170010. 10.1038/sdata.2017.10. [DOI] [PMC free article] [PubMed] [Google Scholar]
- Di Martino, A. , Yan C. G., Li Q., et al. 2014. “The Autism Brain Imaging Data Exchange: Towards a Large‐Scale Evaluation of the Intrinsic Brain Architecture in Autism.” Molecular Psychiatry 19, no. 6: 659–667. 10.1038/mp.2013.78. [DOI] [PMC free article] [PubMed] [Google Scholar]
- Di Martino, A. , Zuo X. N., Kelly C., et al. 2013. “Shared and Distinct Intrinsic Functional Network Centrality in Autism and Attention‐Deficit/Hyperactivity Disorder.” Biological Psychiatry 74, no. 8: 623–632. 10.1016/j.biopsych.2013.02.011. [DOI] [PMC free article] [PubMed] [Google Scholar]
- Ding, C. , Li A., Xie S., et al. 2024. “Mapping Brain Synergy Dysfunction in Schizophrenia: Understanding Individual Differences and Underlying Molecular Mechanisms.” Advanced Science n/a(n/a), 11, no. 32: 2400929. 10.1002/advs.202400929. [DOI] [PMC free article] [PubMed] [Google Scholar]
- Dong, D. , Wang Y., Chang X., Luo C., and Yao D.. 2018. “Dysfunction of Large‐Scale Brain Networks in Schizophrenia: A Meta‐Analysis of Resting‐State Functional Connectivity.” Schizophrenia Bulletin 44, no. 1: 168–181. 10.1093/schbul/sbx034. [DOI] [PMC free article] [PubMed] [Google Scholar]
- Doucet, G. E. , Lee W. H., and Frangou S.. 2019. “Evaluation of the Spatial Variability in the Major Resting‐State Networks Across Human Brain Functional Atlases.” Human Brain Mapping 40, no. 15: 4577–4587. 10.1002/hbm.24722. [DOI] [PMC free article] [PubMed] [Google Scholar]
- Du, Y. , Hao H., Wang S., Pearlson G. D., and Calhoun V. D.. 2020. “Identifying Commonality and Specificity Across Psychosis Sub‐Groups via Classification Based on Features From Dynamic Connectivity Analysis.” NeuroImage: Clinical 27: 102284. 10.1016/j.nicl.2020.102284. [DOI] [PMC free article] [PubMed] [Google Scholar]
- Du, Y. , Pearlson G. D., Lin D., et al. 2017. “Identifying Dynamic Functional Connectivity Biomarkers Using GIG‐ICA: Application to Schizophrenia, Schizoaffective Disorder, and Psychotic Bipolar Disorder.” Human Brain Mapping 38, no. 5: 2683–2708. 10.1002/hbm.23553. [DOI] [PMC free article] [PubMed] [Google Scholar]
- Du, Y. , Pearlson G. D., Liu J., et al. 2015. “A Group ICA Based Framework for Evaluating Resting fMRI Markers When Disease Categories Are Unclear: Application to Schizophrenia, Bipolar, and Schizoaffective Disorders.” NeuroImage 122: 272–280. 10.1016/j.neuroimage.2015.07.054. [DOI] [PMC free article] [PubMed] [Google Scholar]
- Elliott, M. L. , Knodt A. R., and Hariri A. R.. 2021. “Striving Toward Translation: Strategies for Reliable fMRI Measurement.” Trends in Cognitive Sciences 25, no. 9: 776–787. 10.1016/j.tics.2021.05.008. [DOI] [PMC free article] [PubMed] [Google Scholar]
- Fair, D. A. , Dosenbach N. U., Church J. A., et al. 2007. “Development of Distinct Control Networks Through Segregation and Integration.” Proceedings of the National Academy of Sciences 104, no. 33: 13507–13512. 10.1073/pnas.0705843104. [DOI] [PMC free article] [PubMed] [Google Scholar]
- Fan, L. 2021. “Mapping the Human Brain: What Is the Next Frontier?” Innovation (Camb) 2, no. 1: 100073. 10.1016/j.xinn.2020.100073. [DOI] [PMC free article] [PubMed] [Google Scholar]
- Fan, L. , Li H., Zhuo J., et al. 2016. “The Human Brainnetome Atlas: A New Brain Atlas Based on Connectional Architecture.” Cerebral Cortex 26, no. 8: 3508–3526. 10.1093/cercor/bhw157. [DOI] [PMC free article] [PubMed] [Google Scholar]
- Fusar‐Poli, P. , Howes O. D., Allen P., et al. 2010. “Abnormal Frontostriatal Interactions in People With Prodromal Signs of Psychosis: A Multimodal Imaging Study.” Archives of General Psychiatry 67, no. 7: 683–691. 10.1001/archgenpsychiatry.2010.77. [DOI] [PubMed] [Google Scholar]
- Gallo, S. , El‐Gazzar A., Zhutovsky P., et al. 2023. “Functional Connectivity Signatures of Major Depressive Disorder: Machine Learning Analysis of Two Multicenter Neuroimaging Studies.” Molecular Psychiatry 28, no. 7: 3013–3022. 10.1038/s41380-023-01977-5. [DOI] [PMC free article] [PubMed] [Google Scholar]
- Gao, M. S. , Tsai F. S., and Lee C. C.. 2020. “Learning a Phenotypic‐Attribute Attentional Brain Connectivity Embedding for ADHD Classification Using rs‐fMRI.” Paper presented at the 2020 42nd Annual International Conference of the IEEE Engineering in Medicine & Biology Society (EMBC). [DOI] [PubMed]
- Gao, W. Y. , Zeng L. L., Shen H., and Hu D. W.. 2012. “Estimating Medication Status via Resting‐State Functional Connectivity in Major Depression.” Paper Presented at the Intelligent Science and Intelligent Data Engineering, Iscide 2011.
- Glasser, M. F. , Coalson T. S., Robinson E. C., et al. 2016. “A Multi‐Modal Parcellation of Human Cerebral Cortex.” Nature 536, no. 7615: 171–178. 10.1038/nature18933. [DOI] [PMC free article] [PubMed] [Google Scholar]
- Gordon, E. M. , Laumann T. O., Adeyemo B., Huckins J. F., Kelley W. M., and Petersen S. E.. 2016. “Generation and Evaluation of a Cortical Area Parcellation From Resting‐State Correlations.” Cerebral Cortex 26, no. 1: 288–303. 10.1093/cercor/bhu239. [DOI] [PMC free article] [PubMed] [Google Scholar]
- Guo, X. , Yao D., Cao Q., et al. 2020. “Shared and Distinct Resting Functional Connectivity in Children and Adults With Attention‐Deficit/Hyperactivity Disorder.” Translational Psychiatry 10, no. 1: 65. 10.1038/s41398-020-0740-y. [DOI] [PMC free article] [PubMed] [Google Scholar]
- Hahamy, A. , Calhoun V., Pearlson G., et al. 2014. “Save the Global: Global Signal Connectivity as a Tool for Studying Clinical Populations With Functional Magnetic Resonance Imaging.” Brain Connectivity 4, no. 6: 395–403. 10.1089/brain.2014.0244. [DOI] [PMC free article] [PubMed] [Google Scholar]
- Heinsfeld, A. S. , Franco A. R., Craddock R. C., Buchweitz A., and Meneguzzi F.. 2018. “Identification of Autism Spectrum Disorder Using Deep Learning and the ABIDE Dataset.” NeuroImage: Clinical 17: 16–23. 10.1016/j.nicl.2017.08.017. [DOI] [PMC free article] [PubMed] [Google Scholar]
- Hiser, J. , and Koenigs M.. 2018. “The Multifaceted Role of the Ventromedial Prefrontal Cortex in Emotion, Decision Making, Social Cognition, and Psychopathology.” Biological Psychiatry 83, no. 8: 638–647. 10.1016/j.biopsych.2017.10.030. [DOI] [PMC free article] [PubMed] [Google Scholar]
- Ho, T. C. , Connolly C. G., Henje Blom E., et al. 2015. “Emotion‐Dependent Functional Connectivity of the Default Mode Network in Adolescent Depression.” Biological Psychiatry 78, no. 9: 635–646. 10.1016/j.biopsych.2014.09.002. [DOI] [PMC free article] [PubMed] [Google Scholar]
- Hong, J. , Park B.‐Y., Cho H.‐H., and Park H.. 2017. “Age‐Related Connectivity Differences Between Attention Deficit and Hyperactivity Disorder Patients and Typically Developing Subjects: A Resting‐State Functional MRI Study.” Neural Regeneration Research 12, no. 10: 1640–1647. 10.4103/1673-5374.217339. [DOI] [PMC free article] [PubMed] [Google Scholar]
- Howes, O. D. , and Kapur S.. 2009. “The Dopamine Hypothesis of Schizophrenia: Version III—The Final Common Pathway.” Schizophrenia Bulletin 35, no. 3: 549–562. 10.1093/schbul/sbp006. [DOI] [PMC free article] [PubMed] [Google Scholar]
- Jain, P. , Sao A. K., and Minhas A. S.. 2021. “Analyzing the Effect of Resolution of Network Nodes on the Resting State Functional Connectivity Maps of Schizophrenic Human Brains.” Paper presented at the 2021 43rd Annual International Conference of the IEEE Engineering in Medicine & Biology Society (EMBC). [DOI] [PubMed]
- Ji, J. L. , Spronk M., Kulkarni K., Repovš G., Anticevic A., and Cole M. W.. 2019. “Mapping the Human Brain's Cortical‐Subcortical Functional Network Organization.” NeuroImage 185: 35–57. 10.1016/j.neuroimage.2018.10.006. [DOI] [PMC free article] [PubMed] [Google Scholar]
- Jiao, Z. , Li H., and Fan Y.. 2020. “Improving Diagnosis of Autism Spectrum Disorder and Disentangling its Heterogeneous Functional Connectivity Patterns Using Capsule Networks.” Paper Presented at the 2020 IEEE 17th International Symposium on Biomedical Imaging (ISBI). [DOI] [PMC free article] [PubMed]
- Kaiser, R. H. , Andrews‐Hanna J. R., Wager T. D., and Pizzagalli D. A.. 2015. “Large‐Scale Network Dysfunction in Major Depressive Disorder: A Meta‐Analysis of Resting‐State Functional Connectivity.” JAMA Psychiatry 72, no. 6: 603–611. 10.1001/jamapsychiatry.2015.0071. [DOI] [PMC free article] [PubMed] [Google Scholar]
- Kay, S. R. , Fiszbein A., and Opler L. A.. 1987. “The Positive and Negative Syndrome Scale (PANSS) for Schizophrenia.” Schizophrenia Bulletin 13, no. 2: 261–276. 10.1093/schbul/13.2.261. [DOI] [PubMed] [Google Scholar]
- Keller, A. S. , Pines A. R., Shanmugan S., et al. 2023. “Personalized Functional Brain Network Topography Is Associated With Individual Differences in Youth Cognition.” Nature Communications 14, no. 1: 8411. 10.1038/s41467-023-44087-0. [DOI] [PMC free article] [PubMed] [Google Scholar]
- Krystal, S. , Gracia L., Piguet C., et al. 2024. “Functional Connectivity of the Amygdala Subnuclei in Various Mood States of Bipolar Disorder.” Molecular Psychiatry 29, no. 11: 3344–3355. 10.1038/s41380-024-02580-y. [DOI] [PubMed] [Google Scholar]
- Langs, G. , Lashkari D., Sweet A., et al. 2011. “Learning an Atlas of a Cognitive Process in Its Functional Geometry.” Inf Process Med Imaging 22: 135–146. 10.1007/978-3-642-22092-0_12. [DOI] [PMC free article] [PubMed] [Google Scholar]
- Lee, J. M. , Kyeong S., Kim E., and Cheon K. A.. 2016. “Abnormalities of Inter‐ and Intra‐Hemispheric Functional Connectivity in Autism Spectrum Disorders: A Study Using the Autism Brain Imaging Data Exchange Database.” Frontiers in Neuroscience 10: 191. 10.3389/fnins.2016.00191. [DOI] [PMC free article] [PubMed] [Google Scholar]
- Levi, P. T. , Chopra S., Pang J. C., et al. 2023. “The Effect of Using Group‐Averaged or Individualized Brain Parcellations When Investigating Connectome Dysfunction in Psychosis.” Network Neuroscience 7, no. 4: 1228–1247. 10.1162/netn_a_00329. [DOI] [PMC free article] [PubMed] [Google Scholar]
- Li, J. , Bolt T., Bzdok D., et al. 2019. “Topography and Behavioral Relevance of the Global Signal in the Human Brain.” Scientific Reports 9, no. 1: 14286. 10.1038/s41598-019-50750-8. [DOI] [PMC free article] [PubMed] [Google Scholar]
- Li, J. , Kong R., Liégeois R., et al. 2019. “Global Signal Regression Strengthens Association Between Resting‐State Functional Connectivity and Behavior.” NeuroImage 196: 126–141. 10.1016/j.neuroimage.2019.04.016. [DOI] [PMC free article] [PubMed] [Google Scholar]
- Li, Q. , Becker B., Jiang X., et al. 2019. “Decreased Interhemispheric Functional Connectivity Rather Than Corpus Callosum Volume as a Potential Biomarker for Autism Spectrum Disorder.” Cortex 119: 258–266. 10.1016/j.cortex.2019.05.003. [DOI] [PubMed] [Google Scholar]
- Liang, C. , Pearlson G., Bustillo J., et al. 2023. “Psychotic Symptom, Mood, and Cognition‐Associated Multimodal MRI Reveal Shared Links to the Salience Network Within the Psychosis Spectrum Disorders.” Schizophrenia Bulletin 49, no. 1: 172–184. 10.1093/schbul/sbac158. [DOI] [PMC free article] [PubMed] [Google Scholar]
- Linke, A. C. , Olson L., Gao Y. F. F., Fishman I., and Müller R. A.. 2017. “Psychotropic Medication Use in Autism Spectrum Disorders May Affect Functional Brain Connectivity.” Biological Psychiatry: Cognitive Neuroscience and Neuroimaging 2, no. 6: 518–527. 10.1016/j.bpsc.2017.06.008. [DOI] [PMC free article] [PubMed] [Google Scholar]
- Liu, N. , Liu Q., Yang Z., et al. 2023. “Different Functional Alteration in Attention‐Deficit/Hyperactivity Disorder Across Developmental Age Groups: A Meta‐Analysis and an Independent Validation of Resting‐State Functional Connectivity Studies.” CNS Neuroscience & Therapeutics 29, no. 1: 60–69. 10.1111/cns.14032. [DOI] [PMC free article] [PubMed] [Google Scholar]
- Luo, Y. , Alvarez T. L., Halperin J. M., and Li X.. 2020. “Multimodal Neuroimaging‐Based Prediction of Adult Outcomes in Childhood‐Onset ADHD Using Ensemble Learning Techniques.” NeuroImage: Clinical 26: 102238. 10.1016/j.nicl.2020.102238. [DOI] [PMC free article] [PubMed] [Google Scholar]
- Lynall, M. E. , Bassett D. S., Kerwin R., et al. 2010. “Functional Connectivity and Brain Networks in Schizophrenia.” Journal of Neuroscience 30, no. 28: 9477–9487. 10.1523/JNEUROSCI.0333-10.2010. [DOI] [PMC free article] [PubMed] [Google Scholar]
- Milham, M. , Fair D., Mennes M., and Mostofsky S.. 2012. “The Adhd‐200 Consortium: A Model to Advance the Translational Potential of Neuroimaging in Clinical Neuroscience.” Frontiers in Systems Neuroscience 6: 62. 10.3389/fnsys.2012.00062. [DOI] [PMC free article] [PubMed] [Google Scholar]
- Moghimi, P. , Dang A. T., Do Q., Netoff T. I., Lim K. O., and Atluri G.. 2022. “Evaluation of Functional MRI‐Based Human Brain Parcellation: A Review.” Journal of Neurophysiology 128, no. 1: 197–217. 10.1152/jn.00411.2021. [DOI] [PMC free article] [PubMed] [Google Scholar]
- Monk, C. S. , Peltier S. J., Wiggins J. L., et al. 2009. “Abnormalities of Intrinsic Functional Connectivity in Autism Spectrum Disorders.” NeuroImage 47, no. 2: 764–772. 10.1016/j.neuroimage.2009.04.069. [DOI] [PMC free article] [PubMed] [Google Scholar]
- Montgomery, S. A. , and Asberg M.. 1979. “A New Depression Scale Designed to Be Sensitive to Change.” British Journal of Psychiatry 134: 382–389. 10.1192/bjp.134.4.382. [DOI] [PubMed] [Google Scholar]
- Noble, S. , Scheinost D., and Constable R. T.. 2019. “A Decade of Test‐Retest Reliability of Functional Connectivity: A Systematic Review and Meta‐Analysis.” NeuroImage 203: 116157. 10.1016/j.neuroimage.2019.116157. [DOI] [PMC free article] [PubMed] [Google Scholar]
- Pappas, D. 2006. “ADHD Rating Scale‐IV: Checklists, Norms, and Clinical Interpretation.” Journal of Psychoeducational Assessment 24, no. 2: 172–178. 10.1177/0734282905285792. [DOI] [Google Scholar]
- Qi, S. , Sui J., Pearlson G., et al. 2022. “Derivation and Utility of Schizophrenia Polygenic Risk Associated Multimodal MRI Frontotemporal Network.” Nature Communications 13, no. 1: 4929. 10.1038/s41467-022-32513-8. [DOI] [PMC free article] [PubMed] [Google Scholar]
- Qi, S. L. , Yang X., Zhao L. S., et al. 2018. “MicroRNA132 Associated Multimodal Neuroimaging Patterns in Unmedicated Major Depressive Disorder.” Brain 141, no. 3: 916–926. 10.1093/brain/awx366. [DOI] [PMC free article] [PubMed] [Google Scholar]
- Qiu, L. , Liang C., Kochunov P., et al. 2024. “Associations of Alcohol and Tobacco Use With Psychotic, Depressive and Developmental Disorders Revealed via Multimodal Neuroimaging.” Translational Psychiatry 14, no. 1: 326. 10.1038/s41398-024-03035-2. [DOI] [PMC free article] [PubMed] [Google Scholar]
- Raimondo, L. , Oliveira ĺ. A. F., Heij J., et al. 2021. “Advances in Resting State fMRI Acquisitions for Functional Connectomics.” NeuroImage 243: 118503. 10.1016/j.neuroimage.2021.118503. [DOI] [PubMed] [Google Scholar]
- Rive, M. M. , van Rooijen G., Veltman D. J., Phillips M. L., Schene A. H., and Ruhé H. G.. 2013. “Neural Correlates of Dysfunctional Emotion Regulation in Major Depressive Disorder. A Systematic Review of Neuroimaging Studies.” Neuroscience and Biobehavioral Reviews 37, no. 10 Pt 2: 2529–2553. 10.1016/j.neubiorev.2013.07.018. [DOI] [PubMed] [Google Scholar]
- Roberts, G. , Lord A., Frankland A., et al. 2017. “Functional Dysconnection of the Inferior Frontal Gyrus in Young People With Bipolar Disorder or at Genetic High Risk.” Biological Psychiatry 81, no. 8: 718–727. 10.1016/j.biopsych.2016.08.018. [DOI] [PubMed] [Google Scholar]
- Schaefer, A. , Kong R., Gordon E. M., et al. 2018. “Local‐Global Parcellation of the Human Cerebral Cortex From Intrinsic Functional Connectivity MRI.” Cerebral Cortex 28, no. 9: 3095–3114. 10.1093/cercor/bhx179. [DOI] [PMC free article] [PubMed] [Google Scholar]
- Sendi, M. S. E. , Dini H., Bruni L. E., and Calhoun V. D.. 2022. “Default Mode Network Dynamic Functional Network Connectivity Predicts Psychotic Symptom Severity,” Annual International Conference of the IEEE Engineering in Medicine and Biology Society. IEEE Engineering in Medicine and Biology Society. Annual International Conference, 2022, 247–250. 10.1109/EMBC48229.2022.9871542. [DOI] [PubMed]
- Sheline, Y. I. , and Raichle M. E.. 2013. “Resting State Functional Connectivity in Preclinical Alzheimer's Disease.” Biological Psychiatry 74, no. 5: 340–347. 10.1016/j.biopsych.2012.11.028. [DOI] [PMC free article] [PubMed] [Google Scholar]
- Snaith, R. P. 1977. “Hamilton Rating Scale for Depression.” British Journal of Psychiatry 131, no. 4: 431–432. 10.1192/bjp.131.4.431. [DOI] [PubMed] [Google Scholar]
- Stalnaker, T. A. , Cooch N. K., and Schoenbaum G.. 2015. “What the Orbitofrontal Cortex Does Not Do.” Nature Neuroscience 18, no. 5: 620–627. 10.1038/nn.3982. [DOI] [PMC free article] [PubMed] [Google Scholar]
- Tamminga, C. A. , Ivleva E. I., Keshavan M. S., et al. 2013. “Clinical Phenotypes of Psychosis in the Bipolar‐Schizophrenia Network on Intermediate Phenotypes (B‐SNIP).” American Journal of Psychiatry 170, no. 11: 1263–1274. 10.1176/appi.ajp.2013.12101339. [DOI] [PubMed] [Google Scholar]
- Tian, Y. , Margulies D. S., Breakspear M., and Zalesky A.. 2020. “Topographic Organization of the Human Subcortex Unveiled With Functional Connectivity Gradients.” Nature Neuroscience 23, no. 11: 1421–1432. 10.1038/s41593-020-00711-6. [DOI] [PubMed] [Google Scholar]
- Tzourio‐Mazoyer, N. , Landeau B., Papathanassiou D., et al. 2002. “Automated Anatomical Labeling of Activations in SPM Using a Macroscopic Anatomical Parcellation of the MNI MRI Single‐Subject Brain.” NeuroImage 15, no. 1: 273–289. 10.1006/nimg.2001.0978. [DOI] [PubMed] [Google Scholar]
- Vissers, M. E. , Cohen X., and Geurts H. M.. 2012. “Brain Connectivity and High Functioning Autism: A Promising Path of Research That Needs Refined Models, Methodological Convergence, and Stronger Behavioral Links.” Neuroscience & Biobehavioral Reviews 36, no. 1: 604–625. 10.1016/j.neubiorev.2011.09.003. [DOI] [PubMed] [Google Scholar]
- Voldsbekk, I. , Kjelkenes R., Frogner E. R., Westlye L. T., and Alnæs D.. 2024. “Testing the Sensitivity of Diagnosis‐Derived Patterns in Functional Brain Networks to Symptom Burden in a Norwegian Youth Sample.” Human Brain Mapping 45, no. 3: e26631. 10.1002/hbm.26631. [DOI] [PMC free article] [PubMed] [Google Scholar]
- Wang, L. , Hermens D. F., Hickie I. B., and Lagopoulos J.. 2012. “A Systematic Review of Resting‐State Functional‐MRI Studies in Major Depression.” Journal of Affective Disorders 142, no. 1: 6–12. 10.1016/j.jad.2012.04.013. [DOI] [PubMed] [Google Scholar]
- Wang, L. , Yu L., Wu F., Wu H., and Wang J.. 2019. “Altered Whole Brain Functional Connectivity Pattern Homogeneity in Medication‐Free Major Depressive Disorder.” Journal of Affective Disorders 253: 18–25. 10.1016/j.jad.2019.04.040. [DOI] [PubMed] [Google Scholar]
- Wang, Z. , Zhou X., Gui Y., Liu M., and Lu H.. 2023. “Multiple Measurement Analysis of Resting‐State fMRI for ADHD Classification in Adolescent Brain From the ABCD Study.” Translational Psychiatry 13, no. 1: 45. 10.1038/s41398-023-02309-5. [DOI] [PMC free article] [PubMed] [Google Scholar]
- Whitfield‐Gabrieli, S. , Thermenos H. W., Milanovic S., et al. 2009. “Hyperactivity and Hyperconnectivity of the Default Network in Schizophrenia and in First‐Degree Relatives of Persons With Schizophrenia.” Proceedings of the National Academy of Sciences 106, no. 4: 1279–1284. 10.1073/pnas.0809141106. [DOI] [PMC free article] [PubMed] [Google Scholar]
- Wise, T. , Marwood L., Perkins A. M., et al. 2017. “Instability of Default Mode Network Connectivity in Major Depression: A Two‐Sample Confirmation Study.” Translational Psychiatry 7, no. 4: e1105. 10.1038/tp.2017.40. [DOI] [PMC free article] [PubMed] [Google Scholar]
- Wu, X. , Lin P., Yang J., Song H., Yang R., and Yang J.. 2016. “Dysfunction of the Cingulo‐Opercular Network in First‐Episode Medication‐Naive Patients With Major Depressive Disorder.” Journal of Affective Disorders 200: 275–283. 10.1016/j.jad.2016.04.046. [DOI] [PubMed] [Google Scholar]
- Yan, C.‐G. , Chen X., Li L., et al. 2019. “Reduced Default Mode Network Functional Connectivity in Patients With Recurrent Major Depressive Disorder.” Proceedings of the National Academy of Sciences 116, no. 18: 9078–9083. 10.1073/pnas.1900390116. [DOI] [PMC free article] [PubMed] [Google Scholar]
- Yang, G. J. , Murray J. D., Repovs G., et al. 2014. “Altered Global Brain Signal in Schizophrenia.” Proceedings of the National Academy of Sciences 111, no. 20: 7438–7443. 10.1073/pnas.1405289111. [DOI] [PMC free article] [PubMed] [Google Scholar]
- Yeo, B. T. , Krienen F. M., Sepulcre J., et al. 2011. “The Organization of the Human Cerebral Cortex Estimated by Intrinsic Functional Connectivity.” Journal of Neurophysiology 106, no. 3: 1125–1165. 10.1152/jn.00338.2011. [DOI] [PMC free article] [PubMed] [Google Scholar]
- Yerys, B. E. , Herrington J. D., Satterthwaite T. D., Guy L., Schultz R. T., and Bassett D. S.. 2017. “Globally Weaker and Topologically Different: Resting‐State Connectivity in Youth With Autism.” Molecular Autism 8: 39. 10.1186/s13229-017-0156-6. [DOI] [PMC free article] [PubMed] [Google Scholar]
- Zalesky, A. , Fornito A., and Bullmore E. T.. 2010. “Network‐Based Statistic: Identifying Differences in Brain Networks.” NeuroImage 53, no. 4: 1197–1207. 10.1016/j.neuroimage.2010.06.041. [DOI] [PubMed] [Google Scholar]
- Zeng, L.‐L. , Shen H., Liu L., and Hu D.. 2014. “Unsupervised Classification of Major Depression Using Functional Connectivity MRI.” Human Brain Mapping 35, no. 4: 1630–1641. 10.1002/hbm.22278. [DOI] [PMC free article] [PubMed] [Google Scholar]
- Zeng, L.‐L. , Shen H., Liu L., et al. 2012. “Identifying Major Depression Using Whole‐Brain Functional Connectivity: A Multivariate Pattern Analysis.” Brain 135, no. 5: 1498–1507. 10.1093/brain/aws059. [DOI] [PubMed] [Google Scholar]
- Zeng, L.‐L. , Wang H., Hu P., et al. 2018. “Multi‐Site Diagnostic Classification of Schizophrenia Using Discriminant Deep Learning With Functional Connectivity MRI.” eBioMedicine 30: 74–85. 10.1016/j.ebiom.2018.03.017. [DOI] [PMC free article] [PubMed] [Google Scholar]
- Zhang, B. , Liu S., Chen S., et al. 2022. “Common and Unique Neural Activities in Subclinical Depression and Major Depressive Disorder Indicate the Development of Brain Impairments in Different Depressive Stages.” Journal of Affective Disorders 317: 278–286. 10.1016/j.jad.2022.08.128. [DOI] [PubMed] [Google Scholar]
- Zhang, B. , Liu S., Liu X., et al. 2022. “Discriminating Subclinical Depression From Major Depression Using Multi‐Scale Brain Functional Features: A Radiomics Analysis.” Journal of Affective Disorders 297: 542–552. 10.1016/j.jad.2021.10.122. [DOI] [PubMed] [Google Scholar]
- Zhang, Y. , Huang C.‐C., Zhao J., et al. 2023. “Resting‐State Functional Connectivity of the Raphe Nuclei in Major Depressive Disorder: A Multi‐Site Study.” NeuroImage: Clinical 37: 103359. 10.1016/j.nicl.2023.103359. [DOI] [PMC free article] [PubMed] [Google Scholar]
- Zhi, D. M. , Calhoun V. D., Lv L. X., et al. 2018. “Aberrant Dynamic Functional Network Connectivity and Graph Properties in Major Depressive Disorder.” Frontiers in Psychiatry 9: 339. 10.3389/fpsyt.2018.00339. [DOI] [PMC free article] [PubMed] [Google Scholar]
Associated Data
This section collects any data citations, data availability statements, or supplementary materials included in this article.
Supplementary Materials
Data S1. Supporting Information.
Data Availability Statement
The MDD data can be accessed upon reasonable request to Dr. Sui (jsui@bnu.edu.cn). The BSNIP, ASD, and ADHD data and clinical information can be accessed upon reasonable request to Dr. Calhoun (vcalhoun@gsu.edu).