Abstract
Many investigators are now using haplotype-tagging single-nucleotide polymorphism (htSNPs) as a way of screening regions of the genome for association with disease. A common approach is to genotype htSNPs in a study population and to use this information to draw inferences about each individual’s haplotypic makeup, including SNPs that were not directly genotyped. To test the validity of this approach, we simulated the exercise of typing htSNPs in a large sample of individuals and compared the true and inferred haplotypes. The accuracy of haplotype inference varied, depending on the method of selecting htSNPs, the linkage-disequilibrium structure of the region, and the amount of missing data. At the stage of selection of htSNPs, haplotype-block–based methods required a larger number of htSNPs than did unstructured methods but gave lower levels of error in haplotype inference, particularly when there was a significant amount of missing data. We present a Web-based utility that allows investigators to compare the likely error rates of different sets of htSNPs and to arrive at an economical set of htSNPs that provides acceptable levels of accuracy in haplotype inference.
Introduction
A critical roadblock in complex-disease genetics is to identify the most-informative markers to use in large-scale association analysis, out of ∼10 million SNPs that exist in the human genome. The problem can be broken down into two distinct stages. The first stage is to identify the SNPs that are most informative about common haplotypes in the population of interest. The second stage is to type the selected SNPs in epidemiological samples (e.g., disease cases and controls) and, by reconstruction of haplotypes, to make inferences about SNPs that have not been directly typed.
The first stage, identification of informative SNPs, has received considerable attention over the past 3 years, and several different methods have been described (Johnson et al. 2001; Patil et al. 2001; Cardon and Abecasis 2003; Stram et al. 2003; Weale et al. 2003). All SNPs of interest are genotyped in a random sample of the population, and haplotype frequencies are estimated, often by use of expectation-maximization or Bayesian methods (Fallin and Schork 2000). Haplotype-tagging SNPs (htSNPs) can then be identified in two different ways. One approach is to represent the haplotypic structure of the region as discrete blocks, each of which can then be tagged independently (Daly et al. 2001; Johnson et al. 2001; Patil et al. 2001; Gabriel et al. 2002; Zhang and Jin 2003); in the present study, we used a greedy algorithm implemented by HaploBlockFinder (Zhang and Jin 2003) as a simple example of the block approach. An alternative approach is to ignore block structure and to identify the markers that are most informative across the whole region (Ackerman et al. 2003; Ke and Cardon 2003; Sebastiani et al. 2003; Halldorsson et al. 2004); in the present study, we used the Entropy algorithm (Ackerman et al. 2003; R. Mott's Web site) as a simple example of the unstructured approach.
The second stage, typing htSNPs and reconstructing haplotypes in epidemiological samples, has received much less attention and is the focus of the present study. The approach is particularly problematic when the investigator wishes to use htSNPs to infer haplotypes for an individual rather than simple estimation of population frequencies. In this situation, expectation-maximization or Bayesian theory is used to estimate the most probable pair of haplotypes possessed by an individual. These haplotypes contain only the htSNPs (we will call them “htSNP haplotypes”), but they can be used to reconstruct the full haplotypes that were observed in the first stage of analysis; this allows us to infer genotypes for SNPs that were not physically genotyped.
Here, we use simulations to evaluate the accuracy of reconstructing individual haplotypes and inferring untyped SNPs from htSNP data. We explore how accuracy is affected by the method used to select htSNPs, by the linkage disequilibrium (LD) structure of the region, and by the amount of missing data. We present a Web-based tool that allows investigators to combine algorithmic and manual methods to identify a set of htSNPs that will give low error rates when haplotypes are reconstructed.
Material and Methods
Marker Selection and Genotyping
Family trios (32 European and 32 West African) were genotyped for 122 SNPs across 654 kb of the 5q31 cytokine gene cluster and for 55 SNPs across 550 kb in the IL-8 region on chromosome 4, as described elsewhere (Hull et al. 2004). Mean inter-SNP distance was 12 kb.
In brief, genomic DNA samples were subjected to whole-genome preamplification by use of primer extension amplification prior to genotyping (Hull et al. 2000). MassArray (Sequenom) was used to genotype all markers by use of allele-specific MALDITOF mass spectrometry (Jurinke et al. 2001). Multiplexes were designed using the dedicated software SpectroDESIGNER (Sequenom).
All SNPs at frequency >5% and in Hardy-Weinberg equilibrium were included for analysis. The 5q31 region was characterized with 99 SNPs in the European population and with 89 SNPs in the West African population. The IL-8 region was characterized using 55 SNPs in the European and 52 SNPs in the West African population.
Population haplotypes and their frequencies were inferred using Phamily and PHASE (Stephens et al. 2001) software.
LD structure for each region and each population was interrogated, using HaploXT (Abecasis et al. 2000) and MARKER, to chart pairwise D′ and r2 statistics derived from haplotype data.
Simulations
Model populations
Model populations were created using haplotype data for the two gene regions in the two ethnic groups discussed above. Initially, 100,000 “individuals” were created by assigning two haplotypes at random to each individual, while ensuring that the overall frequencies of the haplotypes were correct. Two “parents” were chosen at random and one “transmitted” haplotype from each parent was chosen at random to create the “child.” Populations of 380 families were created to be used, as either 380 family trios or 760 unrelated individuals (parents only), in models of haplotype inference for pedigree data sets and unrelated individuals, respectively.
Haplotype-tagging strategies
Two htSNP sets were generated for each model population by use of two fundamentally different methods. The first used a structured approach in which the region was first divided into contiguous haplotype blocks, by use of HaploBlockFinder, with the chromosomal coverage algorithm at 90% (Zhang and Jin 2003). Consequent haplotype blocks were small and tagged by eye. The second tagging strategy used an unstructured approach using Entropy (Ackerman et al. 2003), with the greedy algorithm approximation and 100% haplotype description, on the whole region as one block.
Missing data
In each of the eight simulations (in two populations, for two regions, by use of two tagging approaches), genotype data for the htSNPs were taken from the model population and were used to represent genotyping results that might be acquired in an association study. Six levels of missing data were introduced into this simulated genotype data: 0%, 1%, 2%, 5%, 10%, and 20%. Levels of missing data for each htSNP were derived at random but were maintained below the defined threshold for that simulation. Missing data were distributed in this manner at each htSNP locus. Five genotype sets were created for each category of missing data. A total of 240 simulated genotype sets were created.
Each simulated genotype set was used to infer haplotypes from the htSNPs. htSNP haplotypes were extrapolated to the full haplotypes and were compared with the starting haplotypes. Each incorrectly inferred haplotype was interrogated, and the position of each error on the haplotype was recorded. For all simulations, outcome measures for accuracy of haplotype inference were recorded as “percent incorrect haplotype assignment” and “percent incorrect allele assignment” at each locus on the inferred haplotype. To assess how well haplotypes could be used to infer genotypes at each untyped observed SNP on the haplotype, we also recorded percent genotype error at each untyped locus.
Simulation was used to address the effect of the following variables on outcome measures: (1) LD architecture, (2) unstructured versus contiguous-block–structure tagging approach, (3) level of missing data, and (4) family data versus unrelated individuals. In simulation category (4), Phamily and PHASE were used to infer htSNP haplotypes from pedigree data, and SNPHAP was used for unrelated individuals. All other parameters were modeled using unrelated individuals, by use of SNPHAP to infer the htSNP haplotypes.
Results
Comparison of Haplotype-Block and Unstructured Methods of Selecting htSNPs
We began by comparing a haplotype-block approach and an unstructured approach to identify htSNPs, using four different sets of population genetic data. The IL-8 region in Europeans has extended haplotype blocks, with little LD across block boundaries (Hull et al. 2004). In contrast, the 5q31 region in West Africans has short haplotype blocks, with extensive LD across block boundaries (G. Luoni J. Forton, M. Jallow, A. E. Sadighi, F. Sisay-Joof, M. Pinder, N. Hanchard, M. Herbert, M. Kimber, R. Mott, J. Hull, K. Rockett, and D. Kwiatkowski, unpublished material). The haplotype structures of the IL-8 region in West Africans and of the 5q31 region in Europeans lie between these two extremes.
Population-haplotype frequencies were determined for each of these data sets, as described in the “Material and Methods” section. To illustrate the haplotype-block approach for selection of htSNPs, we used the greedy algorithm provided by HaploBlockFinder (Zhang and Jin 2003). To illustrate an unstructured method of selecting htSNPs, we used Entropy, which determines the information content of each SNP without consideration of block structure (Ackerman et al. 2003; R. Mott's Web site). As noted by other authors (Halldorsson et al. 2004), the unstructured approach consistently generated a smaller set of htSNPs than did the block approach (table 1).
Table 1.
Haplotype-Tagging Sets Derived for European and West African Data Sets for 5q31 and IL-8 Regions[Note]
|
Tagging Approachfor htSNPs |
|||
| Region andPopulation | No. of SNPs | Contiguous Block | Unstructured |
| 5q31: | |||
| European | 99 | 46 | 22 |
| West African | 89 | 56 | 16 |
| IL-8: | |||
| European | 55 | 17 | 16 |
| West African | 52 | 21 | 21 |
Note.— Contiguous-block–structure tagging sets were derived using HaploBlockFinder to partition the haplotype into blocks, each of which was then tagged by eye. The unstructured tagging sets were derived using Entropy to analyze the whole region as a single unit.
Accuracy of Reconstructing Individual Haplotypes from htSNP Data
To model the process of reconstructing haplotypes from htSNP data in a population-based study, we simulated a random sample of 760 unrelated individuals whose genotypes and haplotypes were based on real population-haplotype frequencies. As in the previous section, European or West African data for the IL-8 and 5q31 regions were used to represent a range of different patterns of population-haplotype structure.
We supposed that htSNP genotypes were known for each individual within the sample and used the SNPHAP algorithm to estimate the most probable htSNP haplotypes for each individual. From the htSNP haplotypes, we then inferred the full haplotypes comprising all SNPs. After the simulation was repeated for five random samples of the population, inferred full haplotypes were compared with true haplotypes to determine the average error rate at each SNP locus.
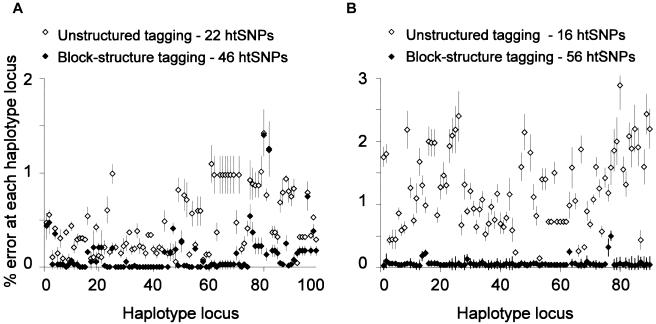
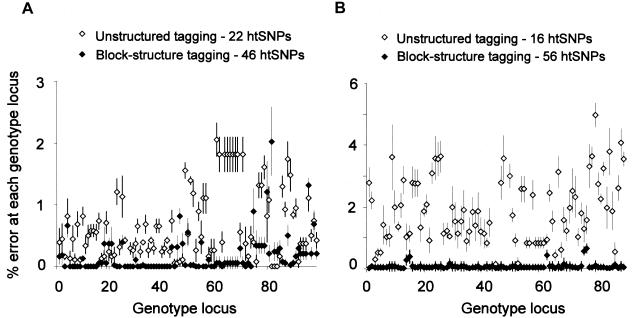
The results are shown in figure 1. By use of the htSNPs generated by the haplotype-block approach, the error rate in estimation of individual SNP alleles was generally in the range of 0%–0.2%, but, in a few cases, it was as high as 1.5%. By use of the smaller sets of htSNPs generated by the unstructured approach, the error rate was generally in the range of 1%–2.5% and reached a maximum of 3%. The difference between the two htSNP-selection methods was most marked in simulations of the 5q31 region, where the unstructured approach gave a 2-fold increase in the number of incorrect haplotypes in Europeans (which resulted in 5% vs. 1.5% incorrect SNP alleles) and a 10-fold increase in West Africans (which resulted in 7% vs. 1.7% incorrect SNP alleles).
Figure 1.
Simulations for European (A) and West African (B) data sets for the 5q31 region, which demonstrate increased error in haplotype inference using an unstructured tagging approach compared with a contiguous-block–structure tagging approach. All data sets shown carry <20% missing data assigned at random to each SNP. Percentage error is shown for each SNP locus on the haplotype.
Effect of Missing Data on Haplotype Reconstruction from htSNP Data
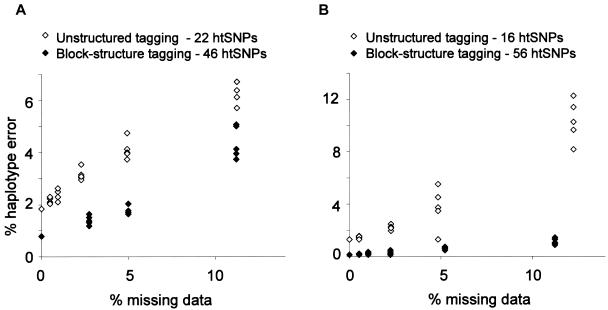
To understand how genotype failure might affect the accuracy of haplotype inference from htSNP data, we incorporated missing data into the simulated data sets outlined in the previous section. Simulations incorporating missing data demonstrate a linear relationship between level of missing data and incorrect haplotype inference, for all regions used and with both block-based and unstructured tagging approaches. With the level of missing data set below a threshold of 20%, haplotype error ranged from 5% to 14%. The impact of missing data on haplotype error was greatly enhanced in simulations performed with the more economical unstructured tagging sets, compared with the block-based tagging sets. This is most marked in the West African 5q31 region, where populations with missing data set below a threshold of 20% had 10% error in haplotype inference for the unstructured tagging set, compared with 1% for the block-based approach (fig. 2). These findings suggest that the most economically efficient tagging set may not always be the most effective for poor-quality data sets with missing data.
Figure 2.
Simulations with increasing missing data for European (A) and West African (B) data sets for the 5q31 region, which show the economical tagging strategy to be more susceptible to missing data.
Effect of Local Pattern of LD on Haplotype Reconstruction from htSNP Data
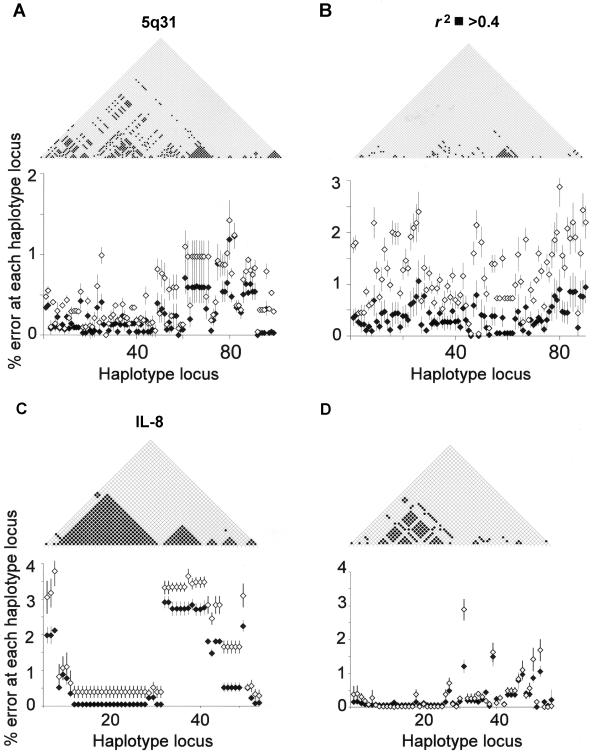
When we inspected the pairwise LD statistics for the four regions used in simulation, we noticed great variation in pairwise LD within these regions and between regions and populations. A remarkable similarity in pattern can be seen between the distribution of pairwise LD (parameter r2>0.4) for a given region and the position of errors on inferred haplotypes (fig. 3). Segments within a region in which LD is low or in which LD drops rapidly at a potential recombination hotspot show increased error rates. In each of the four models, repeated simulations with increasing missing data reveal a conserved yet exaggerated pattern in error position (fig. 3). This implies that missing data enhances the pattern of errors in haplotype inference determined by the underlying LD architecture.
Figure 3.
In all four models, there is strong inverse correlation between pairwise r2>0.4 and percentage inference error for each SNP locus on the inferred haplotype. Data shown for European (A and C) and West African (B and D) data sets for 5q31 and IL-8 regions, with <10% missing data (blackened diamond) and <20% missing data (unblackened diamond) assigned at random to each SNP. The unstructured tagging approach was used in all simulations.
Effect of Haplotype-Estimation Methods on Accuracy of Reconstruction from htSNP Data
The above findings suggest that use of an unstructured tagging approach may lead to problems when applied to a region of low LD or when data sets with missing data are used. These findings are based on simulations in which the EM algorithm (SNPHAP) is used to infer haplotypes for a population-based study. We next attempted to extrapolate these findings to an alternative, more sophisticated method of haplotype inference by using Phamily and PHASE to infer haplotypes, as might be used in a pedigree-based study.
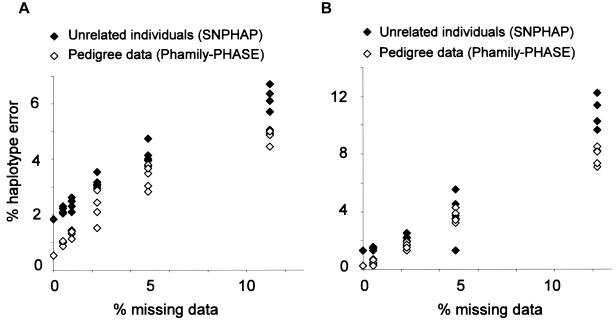
Phamily contributes phase-known sites from family-trio pedigree data. The PHASE algorithm infers haplotypes by use of coalescent theory within a Bayesian framework. As might be expected, we found that, for simulations without missing data, haplotype inference by use of Phamily and PHASE showed an advantage over SNPHAP (fig. 4). In the 5q31 region for Europeans, error rates in haplotype inference were 1/190 with Phamily and PHASE and were 1/54 with SNPHAP. In the 5q31 region for West Africans, the trend was similar, with error rates in haplotype inference at 1/380 for Phamily and PHASE and 1/75 for SNPHAP. However, with missing data set below a threshold of 20%, error rates in the European 5q31 data set increased to 1/21 haplotypes with Phamily and PHASE and to 1/16 haplotypes with SNPHAP. Error rates in the West African data set similarly increased to 1/13 for Phamily and PHASE and to 1/10 for SNPHAP.
Figure 4.
Simulations with increasing missing data for European (A) and West African (B) data sets for the 5q31 region, by use of Phamily and PHASE to infer haplotypes for pedigree data and by use of SNPHAP to infer haplotypes for unrelated data. Both methods demonstrate a linear relationship between missing data and error in haplotype inference from htSNPs. The unstructured tagging approach was used in all simulations.
These findings are of interest, since they suggest that the susceptibility of a highly economical tagging strategy to missing data is independent of the haplotype-inference algorithm used and that these findings are likely to be relevant to both pedigree and case-control study designs.
Effect of Considering Probabilities of Haplotype Assignment When Reconstructing Haplotypes from htSNP Data
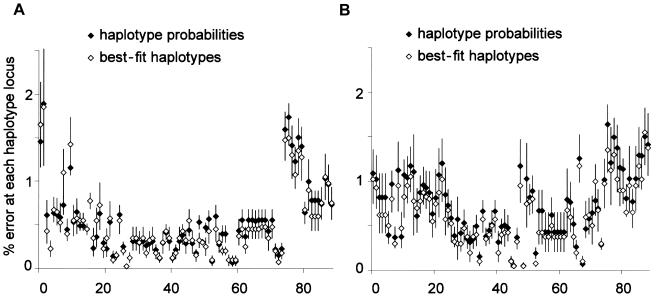
When confronted with phase-ambiguous sites, haplotype-inference algorithms may assign more than one pair of haplotypes to a given individual with different levels of certainty. We next considered whether taking the probabilities of haplotype assignment into account when reconstructing haplotypes from htSNP genotype data—rather than assigning the best-fit pair of haplotypes for each individual—altered the profile or pattern of errors seen. Using the SNPHAP algorithm, we set the posterior probability threshold for inclusion of a pair of haplotypes at 0.0001× the most likely posterior assignment (-th option) and thus collected multiple haplotype assignments together with corresponding probabilities for each individual. Simulations were repeated for the 5q31 region for both West African and European populations by use of both tagging approaches, with no missing data and with missing data set below a threshold of 20%. Error profiles appeared to be similar when the results of simulations were analyzed using best-fit haplotypes or probabilities (fig. 5).
Figure 5.
Simulations for the 5q31 region in European (A) and West African (B) data sets, comparing error profiles generated using haplotype probabilities versus best-fit haplotypes. Data shown use an unstructured tagging strategy with <20% missing data assigned at random to each SNP.
Use of Inferred Haplotypes to Predict Genotypes for Untyped SNPs
We next considered the problem of analyzing disease association with a SNP that has not been physically genotyped but whose genotype can be inferred from the haplotypic information obtained by genotyping htSNPs. The error rate for a SNP genotype is lower than that for the corresponding locus on the haplotype, because the phase information is irrelevant if disease association is analyzed with a single SNP in isolation.
When we performed this operation using haplotypes reconstructed from htSNPs in the 5q31 region with no missing data, we found that genotypes assigned to untyped SNPs had <1% error for both block and unstructured tagging approaches. When the amount of missing data was increased to a threshold of 20%, inferred genotypes had up to 5% error with the unstructured tagging approach but still <1% errors with a block-tagging approach (fig. 6).
Figure 6.
Genotypes were derived from inferred htSNP haplotypes for all untyped observed markers on the full haplotype, for European (A) and West African (B) data sets for the 5q31 region. Data sets shown carry <20% missing data assigned at random to each SNP.
Use of Error Profiles to Optimize htSNP Selection
The above results show that when an unstructured tagging method is compared with a block-tagging method, a smaller set of htSNPs is defined, but there is greater error in haplotype reconstruction from htSNP data, particularly in regions that have low LD or missing data. We asked whether it was possible to establish a set of htSNPs that does not have the high redundancy (and therefore the high genotyping cost) of a block-based approach but is more robust than a totally unstructured approach.
We explored an iterative approach to this problem: (1) a totally unstructured tagging method was used to generate a minimal set of htSNPs across a specified chromosomal region, (2) simulations were used to identify loci that were most prone to error in haplotype reconstruction from htSNP data, (3) additional tagging SNPs were selected at error-prone loci, and (4) the process of error profiling and adding SNPs was repeated until the error rate across the chromosomal region had fallen to an acceptable level.
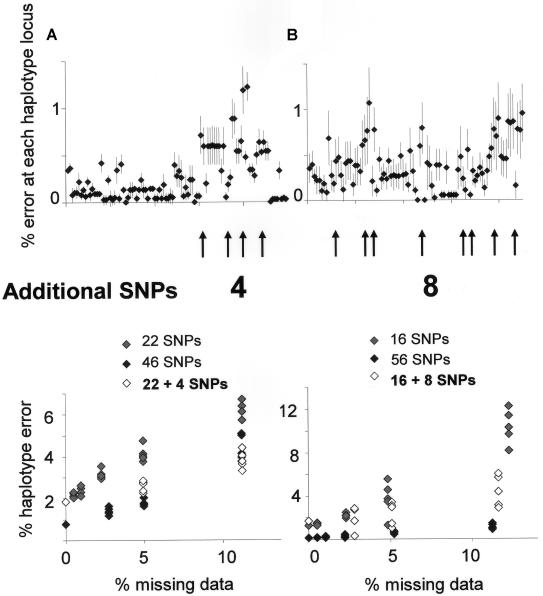
To illustrate this process, when an unstructured tagging method is used on the 5q31 data set of Europeans, the highest error rates in haplotype reconstruction occur between SNP 62 and SNP 92 (fig. 1a). We therefore complemented the original set of 22 htSNPs with four additional tagging SNPs at positions 65, 72, 81, and 87. This greatly reduced the error rate in haplotype reconstruction for the 20% missing data set to levels that were comparable to those achieved with 46 markers derived by a block-tagging method (fig. 7). When the same approach was applied to the West African 5q31 data set, it was found that the addition of 8 SNPs to a set of 16 htSNPs brought error rates toward the level achieved by 56 htSNPs selected by a block-tagging method (fig. 6). Error profiles for all data sets and tagging strategies can be actively interrogated and modified at the authors' Web site.
Figure 7.
Using pairwise LD statistics and simulated error profiles, we highlighted potential sites of increased inference error and explored the effect of introducing additional SNPs in a focused manner at these sites. Data for the European (A) and West African (B) 5q31 region show a dramatic improvement in haplotype inference with incorporation of additional SNPs, particularly for simulations with high levels of missing data.
Discussion
Many investigators are using htSNPs to screen regions of the genome for association with disease by genotyping htSNPs in a study population and then using this information to draw inferences about each individual’s haplotypic makeup, including SNPs that were not directly genotyped. Haplotype assignment by use of phase-inference algorithms is imperfect. Stram et al. (2003) have developed the Rh2 statistic, a useful single measure of certainty with which full haplotypes can be inferred from a given set of tagging SNPs. In this article, we explore a similar problem using simulation and define outcomes of accuracy that are geographically specific across the haplotype. This enables localization of susceptible regions and insight into the limits of accurate haplotype inference across heterogeneous regions of LD.
Using simulations that are based on four different sets of haplotypic data—two regions of the genome analyzed in two distinct populations—we have identified some of the factors that determine the accuracy of this process. Errors in haplotype inference are most likely to occur in regions of low LD or when there is a significant amount of missing data.
When we compared a block-based method with an unstructured method of htSNP selection, we found that the block-based method tended to yield a larger set of htSNPs but resulted in fewer errors of haplotype inference, particularly in regions of low LD and with missing data. This is not surprising, given how the two approaches work. Block-based methods define the best htSNPs for each haplotype block independently, whereas unstructured methods attempt to define the most economical set of htSNPs for the genomic region as a whole. The different results obtained by the two methods are largely related to long-range patterns of LD that cross haplotype-block boundaries, which are taken into account by the unstructured approach but are ignored by the block-based method. In regions of perfect haplotype-block structure, where there are few occurrences of high LD that cross block boundaries, the two methods may give similar results; this is exemplified by the IL-8 region in Europeans, for which we found that block-based and unstructured methods yielded similar numbers of htSNP sets and similar error rates. The other genomic regions that we studied had a more patchy haplotype-block structure, and the set of htSNPs selected by a block-based method produced a lower error rate in haplotype inference. The advantage of the block-based approach is twofold; first, it preferentially selects a high density of htSNPs when haplotype blocks are very short (i.e., in regions of low LD), and, second, it is better able to cope with missing data because more htSNPs are typed, so there is greater redundancy of information. The disadvantage of the block-based approach is that, in a region of the genome that has strong patterns of LD that are not compartmentalized in haplotype blocks, the selected set of htSNPs may have an excessive level of redundancy, and this may unnecessarily inflate genotyping costs.
The cost of genotyping is a major limiting factor in large-scale disease-association studies, so how can investigators studying specific genomic regions define sets of htSNPs that are economical but do not result in a high error rate in haplotype inference? Although there may be analytical approaches to this problem, they have yet to be defined.
Here, we suggest an iterative approach based on simulated genotyping of different combinations of htSNPs, and assessment of the error rates of each different combination. The first stage is to use a method such as the Entropy algorithm to generate a minimal set of htSNPs and (1) to run simulations to identify the loci at which errors in haplotype inference are most likely to occur and (2) to assess how this inference is affected by different levels of missing data. The next stage is to introduce additional markers and to repeat the simulations to see how this addition affects error rates. This process is repeated until the error rate is considered to be acceptable across the region as a whole. Different strategies may be employed for adding htSNPs. One approach is to saturate loci where error rates are highest; another is to saturate loci that are considered to be critical (e.g., those that are thought to be of greatest functional importance). We find that, even when haplotype inference is imperfect, minimal htSNP sets are often accurate in predicting the unphased genotypes of markers that have not been physically genotyped; this process can be optimized using the same iterative process.
A demonstration of this iterative process of selecting htSNPs is available at the MARKER Web site. The application randomly assigns haplotypes to a population of 500 individuals on the basis of population-haplotype frequencies provided by the user. The default htSNP selection is derived using Entropy (R. Mott's Web site) but can be modified by the user. htSNP-genotype data is generated for each individual in the population. SNPHAP is used to infer haplotypes from the htSNP-genotype data, and the inferred full haplotypes are then compared with the starting haplotypes assigned for each individual. Simulations are repeated five times without missing data and five times with up to 20% missing data at each htSNP locus. An overall error rate for each locus on the haplotype can therefore be calculated and the resultant errors (mean ± SEM for each locus) are displayed as a haplotype-error profile, with juxtaposed pairwise r2 statistics for the region shown graphically. htSNP selection can be modified to incorporate redundancy and the process repeated until predicted error rates are acceptable. A complete simulation for a given htSNP set of 25 SNPs takes ∼1 min.
Acknowledgments
This work was funded by a Wellcome Trust Clinical Research Training Fellowship (to J.F.), a Marie Curie Fellowship (to G.L.), and the Medical Research Council.
Electronic-Database Information
The URLs for data presented herein are as follows:
- Authors' Web site, http://www.gmap.net/pub/001
- MARKER, http://www.gmap.net/marker/
- Phamily, http://archimedes.well.ox.ac.uk/pise/
- R. Mott's Web site, http://www.well.ox.ac.uk/~rmott/SNPS/(for Entropy algorithm)
References
- Abecasis GR, Cookson WO, Cardon LR (2000) Pedigree tests of transmission disequilibrium. Eur J Hum Genet 8:545–551 10.1038/sj.ejhg.5200494 [DOI] [PubMed] [Google Scholar]
- Ackerman H, Usen S, Mott R, Richardson A, Sisay-Joof F, Katundu P, Taylor T, Ward R, Molyneux M, Pinder M, Kwiatkowski DP (2003) Haplotypic analysis of the TNF locus by association efficiency and entropy. Genome Biol 4:R24 10.1186/gb-2003-4-4-r24 [DOI] [PMC free article] [PubMed] [Google Scholar]
- Cardon LR, Abecasis GR (2003) Using haplotype blocks to map human complex trait loci. Trends Genet 19:135–140 10.1016/S0168-9525(03)00022-2 [DOI] [PubMed] [Google Scholar]
- Daly MJ, Rioux JD, Schaffner SF, Hudson TJ, Lander ES (2001) High-resolution haplotype structure in the human genome. Nat Genet 29:229–232 10.1038/ng1001-229 [DOI] [PubMed] [Google Scholar]
- Fallin D, Schork NJ (2000) Accuracy of haplotype frequency estimation for biallelic loci, via the expectation-maximization algorithm for unphased diploid genotype data. Am J Hum Genet 67:947–959 [DOI] [PMC free article] [PubMed] [Google Scholar]
- Gabriel SB, Schaffner SF, Nguyen H, Moore JM, Roy J, Blumenstiel B, Higgins J, DeFelice M, Lochner A, Faggart M, Liu-Cordero SN, Rotimi C, Adeyemo A, Cooper R, Ward R, Lander ES, Daly MJ, Altshuler D (2002) The structure of haplotype blocks in the human genome. Science 296:2225–2229 10.1126/science.1069424 [DOI] [PubMed] [Google Scholar]
- Halldorsson BV, Bafna V, Lippert R, Schwartz R, De La Vega FM, Clark AG, Istrail S (2004) Optimal haplotype block-free selection of tagging SNPs for genome-wide association studies. Genome Res 14:1633–1640 10.1101/gr.2570004 [DOI] [PMC free article] [PubMed] [Google Scholar]
- Hull J, Rowlands K, Lockhart E, Sharland M, Moore C, Hanchard N, Kwiatkowski DP (2004) Haplotype mapping of the bronchiolitis susceptibility locus near IL8. Hum Genet 114:272–279 10.1007/s00439-003-1038-x [DOI] [PubMed] [Google Scholar]
- Hull J, Thomson A, Kwiatkowski D (2000) Association of respiratory syncytial virus bronchiolitis with the interleukin 8 gene region in UK families. Thorax 55:1023–1027 10.1136/thorax.55.12.1023 [DOI] [PMC free article] [PubMed] [Google Scholar]
- Johnson GC, Esposito L, Barratt BJ, Smith AN, Heward J, Di Genova G, Ueda H, Cordell HJ, Eaves IA, Dudbridge F, Twells RC, Payne F, Hughes W, Nutland S, Stevens H, Carr P, Tuomilehto-Wolf E, Tuomilehto J, Gough SC, Clayton DG, Todd JA (2001) Haplotype tagging for the identification of common disease genes. Nat Genet 29:233–237 10.1038/ng1001-233 [DOI] [PubMed] [Google Scholar]
- Jurinke C, van den Boom D, Cantor CR, Koster H (2001) Automated genotyping using the DNA MassArray technology. Methods Mol Biol 170:103–116 [DOI] [PubMed] [Google Scholar]
- Ke X, Cardon LR (2003) Efficient selective screening of haplotype tag SNPs. Bioinformatics 19:287–288 10.1093/bioinformatics/19.2.287 [DOI] [PubMed] [Google Scholar]
- Patil N, Berno AJ, Hinds DA, Barrett WA, Doshi JM, Hacker CR, Kautzer CR, Lee DH, Marjoribanks C, McDonough DP, Nguyen BT, Norris MC, Sheehan JB, Shen N, Stern D, Stokowski RP, Thomas DJ, Trulson MO, Vyas KR, Frazer KA, Fodor SP, Cox DR (2001) Blocks of limited haplotype diversity revealed by high-resolution scanning of human chromosome 21. Science 294:1719–1723 10.1126/science.1065573 [DOI] [PubMed] [Google Scholar]
- Sebastiani P, Lazarus R, Weiss ST, Kunkel LM, Kohane IS, Ramoni MF (2003) Minimal haplotype tagging. Proc Natl Acad Sci USA 100:9900–9905 10.1073/pnas.1633613100 [DOI] [PMC free article] [PubMed] [Google Scholar]
- Stephens M, Smith NJ, Donnelly P (2001) A new statistical method for haplotype reconstruction from population data. Am J Hum Genet 68:978–989 [DOI] [PMC free article] [PubMed] [Google Scholar]
- Stram DO, Haiman CA, Hirschhorn JN, Altshuler D, Kolonel LN, Henderson BE, Pike MC (2003) Choosing haplotype-tagging SNPs based on unphased genotype data using a preliminary sample of unrelated subjects with an example from the Multiethnic Cohort Study. Hum Hered 55:27–36 10.1159/000071807 [DOI] [PubMed] [Google Scholar]
- Weale ME, Depondt C, Macdonald SJ, Smith A, Lai PS, Shorvon SD, Wood NW, Goldstein DB (2003) Selection and evaluation of tagging SNPs in the neuronal-sodium-channel gene SCN1A: implications for linkage-disequilibrium gene mapping. Am J Hum Genet 73:551–565 [DOI] [PMC free article] [PubMed] [Google Scholar]
- Zhang K, Jin L (2003) HaploBlockFinder: haplotype block analyses. Bioinformatics 19:1300–1301 10.1093/bioinformatics/btg142 [DOI] [PubMed] [Google Scholar]


