

Abstract
This report describes computer implementation of a scheme for joint linkage and association analysis. The model implemented in the computer package Mendel estimates both recombination and linkage-disequilibrium parameters and conducts likelihood-ratio tests for (1) linkage alone, (2) linkage and association simultaneously, and (3) association in the presence of linkage. Application of the method to data from Finnish pedigrees with familial combined hyperlipidemia illustrates its potential for identification of associated SNP haplotypes in the presence of linkage. For the test results to be valid, good estimates of haplotype frequencies must be used in the analysis.
Despite the growing popularity of whole-genome association studies, linkage scans involving large pedigrees are apt to remain part of the research landscape for some time to come. “First linkage and then association” is still the most cost-effective mapping strategy, particularly when it is practiced in a population isolate. Accordingly, statistical geneticists have devoted considerable thought to the problem of how to detect association in the presence of linkage. Most of the current efforts are being directed toward quantitative traits and the fine tuning of variance-components methods for QTL mapping (Fulker et al. 1999; Fan and Xiong 2003; Almasy and Blangero 2004; Posthuma et al. 2004; Fan et al. 2005), but the same conceptual problems exist for binary disease traits. Unfortunately, with binary traits gathered on extended pedigrees, the statistical analysis options are rather limited. Although the transmission/disequilibrium test (TDT) (Terwilliger and Ott 1992; Spielman et al. 1993; Sham and Curtis 1995) and related parametric tests, such as the gamete-competition model (Sinsheimer et al. 2000, 2001), provide solutions, these tests detect transmission distortion and confound linkage and association in large pedigrees. Monks et al. (1998) and Martin et al. (2003) summarize relevant linkage-disequilibrium extensions of the TDT for sibling and nuclear-family data.
The pseudomarker test of Göring and Terwilliger (2000a, 2000b) does take joint analysis seriously, but it relies on joint estimation of disease-gene penetrances and association parameters, not linkage and association parameters. The same can be said for the commercial software package GAP (Epicenter Software 1996). This package and less flexible programs for the analysis of sibling and nuclear-family data typically assume, in testing for association, that recombination is absent. The supposition that recombination and association are incompatible is surely false in young population isolates. In our view, a focus on the secondary phenomenon of reduced penetrance is less desirable than a focus on the primary phenomenon of recombination. But it is also true that reduced penetrance is apt to be confounded with recombination, so we do not completely rule out penetrance estimation as a useful analysis option.
The present report announces the implementation of a maximum-likelihood method for joint analysis, as advocated by Xiong and Jin (2000), on the basis of earlier hints in the literature (MacLean et al. 1984; Tienari et al. 1992; Zhao et al. 1998). To our knowledge, no one, including Xiong and Jin, has implemented it for general pedigrees. The method allows one to test for (1) linkage alone, (2) linkage and association simultaneously, and (3) association in the presence of linkage. As explained below, our version differs from that of Xiong and Jin (2000) in how linkage disequilibrium is parameterized. One obvious advantage of working in a parametric framework is that the corresponding likelihood-ratio tests allow formal assessment of the relative importance of linkage and association in explaining a mapping signal. The estimation procedures and tests described here are implemented in the freeware program Mendel (Lange et al. 2001).
So how does one proceed? In addition to the estimation of the recombination fraction θ, separating the trait locus and the marker, we propose the estimation of the conditional frequency of the disease allele, given each marker allele. To elaborate, we denote the normal and disease alleles at the disease locus as n and d, respectively; we number the marker alleles from 1 to m; and we fix the marginal frequency pi of marker allele i at its observed value. With this notation in mind, we advocate estimation of the conditional frequency q(d|i)=1-q(n|i) of the disease-marker haplotype d-i, given marker allele i. The parameters q(d|i) quantify the extent of linkage disequilibrium between the marker and the trait. In the parametric framework of maximum-likelihood estimation, one can test null hypotheses, such as no linkage and no association,
 |
by a likelihood-ratio test, where q is the frequency of the disease allele. Xiong and Jin (2000) parameterize linkage disequilibrium by setting
and
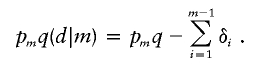 |
In our opinion, the conditional haplotype frequencies q(d|i) furnish a more natural parameterization than the additive deviations δi. Obviously, one could reverse our parameterization and condition on the presence of the disease allele on a chromosome, rather than condition on the presence of the marker allele (Zhao et al. 1998).
Maximum-likelihood estimation of the model parameters relies on the likelihood representation
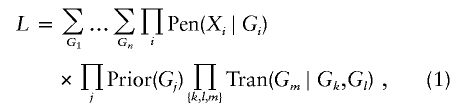 |
of a pedigree with n members (Ott 1974). Here, the ith person has phenotype Xi and possible genotype Gi, the product on j is taken over all founders, and the product on {k,l,m} is taken over all parent-offspring triplets. The abbreviations Pen, Prior, and Tran in equation (1) refer to the penetrance, prior, and transmission functions of the model. The recombination fraction θ enters the likelihood through the array Tran, whereas the conditional haplotype probabilities q(d|i) enter through the array Prior.
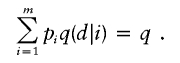
In practice, we recommend fixing the frequency q of the disease allele d during maximum-likelihood estimation of θ and q(d|i). One can estimate q beforehand from disease-prevalence data or from ascertained pedigrees via segregation analysis. During joint linkage and association analysis, Mendel imposes the linear constraint
 |
To circumvent failures in large-sample approximations, we urge the lumping of infrequent marker alleles prior to analysis. Mendel has the capacity to lump alleles.
It is imperative to use good marker-allele frequencies. In a large-scale study, it is reasonable to estimate them from the data collected, and Mendel’s allele-frequency estimation option can assist in this. In a small-scale study, it is preferable to estimate them from another data set—for example, a large random sample whose ethnicity matches that of the study sample. Of course, the study data should be ethnically homogeneous to prevent population stratification.
In the presence of reduced penetrance or phenocopies at the trait locus, it is also prudent to incorporate a penetrance model in linkage and association calculations. For a binary trait, penetrance parameters should be consistent with the population prevalence r of the disease. Thus, if someone with trait genotype i/j has the probability fi/j of displaying the disease, then the equation
should hold, connecting the disease-allele frequency q to r and the fi/j terms. If the underlying trait is quantitative, then the means and variances of the genotype-specific penetrance densities should be chosen to match the population mean and variance of the trait.
To gain experience with the method, we tested it on an ideal data set of large Finnish pedigrees ascertained for familial combined hyperlipidemia (FCHL [MIM 144250]), a common dyslipidemia characterized by elevated levels of both serum total cholesterol and triglycerides in multiple family members. An affecteds-only analysis of these pedigrees showed linkage of FCHL, especially its triglyceride component, to chromosome 1q21 (Pajukanta et al. 1998). These and additional Finnish pedigrees also support association of elevated male triglyceride levels with several SNPs in the noncoding regions of the upstream transcription factor 1 gene (USF1) in the same chromosome region (Pajukanta et al. 2004). Two of these—SNPs 2 and 3 in table 1—are in tight linkage disequilibrium and provide the strongest evidence of association. In the analysis of Pajukanta et al. (2004), a man is designated as “affected” if his triglyceride level exceeds the 90th percentile for his age and sex. Application of the gamete-competition test (Sinsheimer et al. 2000) to the combination of SNPs 2 and 3 gives an approximate P value of .00001 under simulation. Unfortunately, the gamete-competition test assesses linkage and association simultaneously and does not evaluate association given linkage. The family-based association test (FBAT) (Horvath et al. 2001) permits one to assess association, taking into account linkage in nuclear families. The FBAT’s slightly less impressive P value of .009 for SNPs 1, 2, and 3 partially reflects the fact that it operates on a subset of the data. SNP 1 shows evidence of linkage but no evidence of association by itself.
Table 1.
Maximum LOD Scores and χ2 Tests for Elevated Triglycerides
| LOD Score for |
||||
| SNP(s)a | Linkage | Associationand Linkage | χ2df TestStatistic | χ2P Value |
| 1 | 1.34 | 1.90 | χ21=2.58 | .108 |
| 2 | 1.97 | 3.46 | χ21=6.86 | .010 |
| 3 | 1.82 | 2.90 | χ21=4.97 | .026 |
| 1, 2 | 1.57 | 3.42 | χ23=8.52 | .036 |
| 2, 3 | 2.24 | 4.02 | χ23=8.20 | .042 |
| 1, 3 | 1.32 | 2.74 | χ23=6.54 | .088 |
| 1, 2, 3 | 1.83 | 3.84 | χ27=9.26 | .235 |
SNP 1 is marker rs2516839, SNP 2 is rs3737787, and SNP 3 is rs2073658.
The method proposed here helps disentangle the linkage and association results from these Finnish pedigrees. Following the lead of Pajukanta et al. (1998), we model elevated triglyceride levels in men as a dominant binary trait with allele frequency q=0.006. Table 1 reports maximum LOD scores (base 10) for the three USF1 SNPs individually and in combination. Linkage LOD scores are strongest for SNPs 2 and 3 and their haplotype; estimated recombination fractions in each case fall on Mendel’s lower bound of 0.0001. Joint linkage and association LOD scores are also highest for SNPs 2 and 3 and their haplotype, consistent with the findings of the gamete-competition test. Table 1 also provides likelihood-ratio tests of association, given linkage. The χ2 statistic in each case is twice the difference in maximum log likelihoods (base e); the indicated degrees of freedom is the number of alleles or haplotypes minus 1. The test for SNP 2 verifies that it is associated with elevated triglyceride levels in men, even when the effects of linkage are removed. The tests for associated haplotypes are less significant because of the inflated degrees of freedom caused by retained haplotypes with low frequencies. Table 2 shows our reanalysis of these data after binning the haplotypes with a frequency ⩽0.05. Although binning decreases the maximum LOD score for linkage with the triple haplotypes, it yields the strongest evidence (P=.003) for association in the presence of linkage. We conclude that USF1 SNPs 2 and 3 are associated with increased triglyceride levels in men from the pedigrees with FCHL.
Table 2.
LOD Scores and χ2 Tests with Lumped Alleles
| LOD Score for |
||||
| SNP(s)a | Linkage | Associationand Linkage | χ2df TestStatistic | χ2P Value |
| 1 | 1.34 | 1.90 | χ21=2.58 | .108 |
| 2 | 1.97 | 3.46 | χ21=6.86 | .010 |
| 3 | 1.82 | 2.90 | χ21=4.97 | .026 |
| 1, 2 | 1.94 | 3.73 | χ22=8.24 | .016 |
| 2, 3 | 1.02 | 1.91 | χ21=4.10 | .043 |
| 1, 3 | 1.75 | 3.32 | χ22=7.23 | .027 |
| 1, 2, 3 | .88 | 3.36 | χ22=11.42 | .003 |
SNP 1 is marker rs2516839, SNP 2 is rs3737787, and SNP 3 is rs2073658.
These analyses also serve as a reminder of the dangers of misspecification of allele and SNP haplotype frequencies. Maximum LOD scores for association and for association and linkage simultaneously are grossly inflated in these pedigrees when erroneous haplotype frequencies are used. The assumption of linkage equilibrium for haplotypes constructed from closely spaced SNPs is an especially bad idea. We recommend that haplotype frequencies be estimated from the data or from a large random sample prior to association analysis. Mendel has the capability to estimate the haplotype frequencies from pedigree data, and it is prudent to use this capability. Failure to do so causes maximum-likelihood estimation of the q(d|i) parameters to overcompensate for misspecification of SNP haplotype frequencies.
The proposed model of Xiong and Jin (2000) as parameterized in Mendel has four virtues: (1) as a realistic parametric model, it has good power, as demonstrated by Xiong and Lin, to detect linkage and association; (2) it applies to extended pedigrees; (3) it permits inclusion of reduced penetrance, even if it avoids estimation of penetrance parameters; and (4) it is capable of dealing with multiple linked SNPs, provided that these show no recombination and can be combined into a single supermarker. Balanced against these positive features is the model’s difficulty in handling more-widely spaced markers simultaneously. We know of no method to extend the model to a panel of such markers without vastly increasing its complexity and the number of parameters. For one thing, there is simply no obvious parsimonious parameterization of haplotype frequencies in the absence of linkage equilibrium. Computation times are also bound to increase in multimarker analysis. Other drawbacks to the current implementation of the model derive from its rigid assumptions. We can at least contemplate the relaxation of the assumption of disease homogeneity by postulating a fraction of unlinked pedigrees. Although Mendel has the capability to estimate an admixture parameter in linkage analysis, this feature has not yet been added to the current options. Ethnic stratification may also be an issue if data from different populations are combined. Here, there is no obvious mitigating tactic.
The reluctance of statistical geneticists to model association and linkage jointly in full pedigrees is partially a consequence of the lack of an appropriate software environment. All programs that depend on the Lander-Green-Kruglyak algorithm (Lander and Green 1987; Kruglyak and Lander 1998) assume linkage equilibrium. However, the Elston-Stewart algorithm (Elston and Stewart 1971) is not bound by this constraint when all loci are considered jointly. Fortunately, Mendel incorporates both likelihood algorithms and a flexible optimization engine. The analysis option discussed here appears in Mendel release 5.7, which can downloaded at no cost from the UCLA Human Genetics Software Web site.
Acknowledgments
This research was supported in part by United States Public Health Service grants HL28418 and HL70150 to R.M.C. and P.P., grant T32 HG02536 to G.K.C., and grants GM53275 and MH59490 to K.L. and by American Heart Association grant 0430180N to P.P. We thank the Finnish families, for their participation in the FCHL study, and Leena Peltonen and Marja-Riitta Taskinen, for their contributions to the FCHL study.
Electronic-Database Information
The URLs for data presented herein are as follows:
- Online Mendelian Inheritance in Man (OMIM), http://www.ncbi.nlm.nih.gov/Omim/ (for FCHL) [PubMed]
- UCLA Human Genetics Software, http://www.genetics.ucla.edu/home/software.htm (for Mendel release 5.7)
References
- Almasy L, Blangero J (2004) Exploring positional candidate genes: linkage conditional on measured genotype. Behav Genet 34:173–177 10.1023/B:BEGE.0000013731.03827.69 [DOI] [PubMed] [Google Scholar]
- Elston RC, Stewart J (1971) A general model for the genetic analysis of pedigree data. Hum Hered 21:523–542 [DOI] [PubMed] [Google Scholar]
- Fan R, Spinka C, Jin L, Sun Jung J (2005) Pedigree linkage disequilibrium mapping of quantitative trait loci. Eur J Hum Genet 13:216–231 10.1038/sj.ejhg.5201301 [DOI] [PubMed] [Google Scholar]
- Fan R, Xiong M (2003) Combined high resolution linkage and association mapping of quantitative trait loci. Eur J Hum Genet 11:125–137 10.1038/sj.ejhg.5200941 [DOI] [PubMed] [Google Scholar]
- Fulker DW, Cherny SS, Sham PC, Hewitt JK (1999) Combined linkage and association sib-pair analysis for quantitative traits. Am J Hum Genet 64:259–267 [DOI] [PMC free article] [PubMed] [Google Scholar]
- Epicenter Software (1996) Genetic Analysis Package (GAP) release 1.0, Pasadena, California [Google Scholar]
- Göring HHH, Terwilliger JD (2000a) Linkage analysis in the presence of errors III: marker loci and their map as nuisance parameters. Am J Hum Genet 66:1298–1309 [DOI] [PMC free article] [PubMed] [Google Scholar]
- ——— (2000b) Linkage analysis in the presence of errors IV: joint pseudomarker analysis of linkage and/or linkage disequilibrium on a mixture of pedigrees and singletons when the mode of inheritance cannot be accurately specified. Am J Hum Genet 66:1310–1327 [DOI] [PMC free article] [PubMed] [Google Scholar]
- Horvath S, Xu X, Laird NM (2001) The family based association test method: strategies for studying general genotype–phenotype associations. Eur J Hum Genet 9:301–306 10.1038/sj.ejhg.5200625 [DOI] [PubMed] [Google Scholar]
- Kruglyak L, Lander ES (1998) Faster multipoint linkage analysis using Fourier transforms. J Comput Biol 5:1–7 [DOI] [PubMed] [Google Scholar]
- Lander ES, Green P (1987) Construction of multilocus genetic linkage maps in humans. Proc Natl Acad Sci USA 84:2363–2367 [DOI] [PMC free article] [PubMed] [Google Scholar]
- Lange K, Cantor R, Horvath S, Perola M, Sabatti C, Sinsheimer J, Sobel E (2001) Mendel version 4.0: a complete package for the exact genetic analysis of discrete traits in pedigree and population data sets. Am J Hum Genet Suppl 69:504 10.1086/322739 [DOI] [Google Scholar]
- MacLean CJ, Morton NE, Yee S (1984) Combined analysis of genetic segregation and linkage under an oligogenic model. Comput Biomed Res 17:471–480 10.1016/0010-4809(84)90013-2 [DOI] [PubMed] [Google Scholar]
- Martin ER, Bass MP, Hauser ER, Kaplan NL (2003) Accounting for linkage in family-based tests of association with missing parental genotypes. Am J Hum Genet 73:1016–1026 [DOI] [PMC free article] [PubMed] [Google Scholar]
- Monks SA, Kaplan NL, Weir BS (1998) A comparative study of sibship tests of linkage and/or association. Am J Hum Genet 63:1507–1516 [DOI] [PMC free article] [PubMed] [Google Scholar]
- Ott J (1974) Estimation of the recombination fraction in human pedigrees: efficient computation of the likelihood for human linkage studies. Am J Hum Genet 26:588–597 [PMC free article] [PubMed] [Google Scholar]
- Pajukanta P, Lilja HE, Sinsheimer JS, Cantor RM, Lusis AJ, Gentile M, Duan XJ, Soro-Paavonen A, Naukkarinen J, Saarela J, Laakso M, Ehnholm C, Taskinen MR, Peltonen L (2004) Familial combined hyperlipidemia is associated with upstream transcription factor 1 (USF1). Nat Genet 36:371–376 10.1038/ng1320 [DOI] [PubMed] [Google Scholar]
- Pajukanta P, Nuotio I, Terwilliger JD, Porkka KV, Ylitalo K, Pihlajamaki J, Suomalainen AJ, Syvanen AC, Lehtimaki T, Viikari JS, Laakso M, Taskinen MR, Ehnholm C, Peltonen L (1998) Linkage of familial combined hyperlipidaemia to chromosome 1q21-q23. Nat Genet 18:369–373 10.1038/ng0498-369 [DOI] [PubMed] [Google Scholar]
- Posthuma D, de Geus EJ, Boomsma DI, Neale MC (2004) Combined linkage and association tests in MX. Behav Genet 34:179–196 10.1023/B:BEGE.0000013732.19486.74 [DOI] [PubMed] [Google Scholar]
- Sinsheimer JS, Blangero J, Lange K (2000) Gamete-competition models. Am J Hum Genet 66:1168–1172 [DOI] [PMC free article] [PubMed] [Google Scholar]
- Sinsheimer JS, McKenzie CA, Keavney B, Lange K (2001) SNPs and snails and puppy dogs’ tails: analysis of SNP data using the gamete competition model. Ann Hum Genet 65:483–490 10.1046/j.1469-1809.2001.6550483.x [DOI] [PubMed] [Google Scholar]
- Sham PC, Curtis D (1995) An extended transmission/disequilibrium test (TDT) for multi-allelic marker loci. Ann Hum Genet 59:323–336 [DOI] [PubMed] [Google Scholar]
- Spielman RS, McGinnis RE, Ewens WJ (1993) Transmission test for linkage disequilibrium: the insulin gene region and insulin-dependent diabetes mellitus (IDDM). Am J Hum Genet 52:506–516 [PMC free article] [PubMed] [Google Scholar]
- Terwilliger JD, Ott J (1992) A haplotype-based “haplotype relative risk” approach to detecting allelic associations. Hum Hered 42:337–346 [DOI] [PubMed] [Google Scholar]
- Tienari PJ, Wikstrom J, Sajantila A, Palo J, Peltonen L (1992) Genetic susceptibility to multiple sclerosis linked to myelin basic protein gene. Lancet 340:987–991 10.1016/0140-6736(92)93007-A [DOI] [PubMed] [Google Scholar]
- Xiong M, Jin L (2000) Combined linkage and linkage disequilibrium mapping for genome screens. Genet Epidemiol 19:211–234 [DOI] [PubMed] [Google Scholar]
- Zhao LP, Aragaki C, Hsu L, Quiaoit F (1998) Mapping of complex traits by single-nucleotide polymorphisms. Am J Hum Genet 63:225–240 [DOI] [PMC free article] [PubMed] [Google Scholar]