

Abstract
Autism is a severe developmental disorder of unknown etiology but with evidence for genetic influences. Here, we provide evidence for a genetic basis of several quantitative traits that are related to autism. These traits, from the Broader Phenotype Autism Symptom Scale (BPASS), were measured in nuclear families, each ascertained through two probands affected by autism spectrum disorder. The BPASS traits capture the continuum of severity of impairments and may be more informative for genetic studies than are the discrete diagnoses of autism that have been used by others. Using a sample of 201 nuclear families consisting of a total of 694 individuals, we implemented multivariate polygenic models with ascertainment adjustment to estimate heritabilities and genetic and environmental correlations between these traits. Our ascertainment adjustment uses conditioning on the phenotypes of probands, requires no modeling of the ascertainment process, and is applicable to multiplex ascertainment and multivariate traits. This appears to be the first such implementation for multivariate quantitative traits. The marked difference between heritability estimates of the trait for language onset with and without an ascertainment adjustment (0.08 and 0.22, respectively) shows that conclusions are sensitive to whether or not an ascertainment adjustment is used. Among the five BPASS traits that were analyzed, the traits for social motivation and range of interest/flexibility show the highest heritability (0.19 and 0.16, respectively) and also have the highest genetic correlation (0.92). This finding suggests a shared genetic basis of these two traits and that they may be most promising for future gene mapping and for extending pedigrees by phenotyping additional relatives.
Introduction
Autism is a severe developmental disorder of unknown etiology. It is recognized in early childhood and persists throughout life. Characteristic impairments include difficulty processing social and emotional information, language abnormalities, and repetitive or stereotyped behavior (American Psychiatric Association 1994). Diagnosis involves impairments in all three domains, but causal relationships among the domains and their underlying neurophysiological mechanisms are unclear.
Even though the etiology of this disorder is unknown, evidence for genetic influence is strong. Multiple studies report that MZ twins are 60%–95% concordant for autism (Folstein and Rutter 1977a; Ritvo et al. 1985; Steffenburg et al. 1989; Bailey et al. 1995). DZ twins and siblings have much lower concordance rates: estimates range from 0% to 24%, with most between 5% and 10% (August et al. 1981; Smalley et al. 1988; Bolton et al. 1994; Bailey et al. 1995). Together, these MZ and DZ sib concordance rates indicate that both genetic and environmental factors contribute to disease risk. The marked difference between the two concordance rates suggests that the genetic basis is complex and that multiple genes contribute to autism susceptibility in an interactive manner. Estimates of the number of genes range from 2 to 10 (Pickles et al. 1995) to ⩾15 (Risch et al. 1999), but the exact number of contributing genes and their modes of inheritance are unknown. Several linkage-analysis studies of autism (Barrett et al. 1999; Philippe et al. 1999; Risch et al. 1999; Buxbaum et al. 2001; Liu et al. 2001) report moderate positive signals on several chromosomes, but the regions reported are not consistent across studies.
To date, most genetic research on autism has been based on discrete diagnoses. Through use of measures based on the three relevant domains, linkage analyses and other genetic analyses have used either a dichotomy (affected vs. unaffected) or three to four clinical categories versus unaffected as the phenotype. There has been little development of measures for or use of quantitative traits that capture the continuum of severity of impairments. However, there is circumstantial evidence to suggest that there may, indeed, be a more continuous underlying phenotype: the relatives of autistic probands show familial aggregation of types of behavior that are milder than but qualitatively similar to the defining features of autism (Folstein and Rutter 1977b; August et al. 1981; Wolff et al. 1988; Landa et al. 1992; Bolton et al. 1994; Bailey et al. 1995; Piven et al. 1997; Murphy et al. 2000). Even though one continuous trait that combines information from all three domains has been developed (Constantino et al. 2000, 2003a), evidence for the genetic basis of this trait has been investigated only through twin studies (Constantino and Todd 2000, 2003; Constantino et al. 2003b). Furthermore, a single continuous trait cannot capture the relationship among the three domains, since separate traits from each of the three domains are needed to disentangle the unknown nature of the multivariate correlation structure of the three domains.
For four reasons, quantitative traits may be more useful than dichotomous traits (e.g., affected vs. unaffected) for dissecting the genetic basis of autism. First, quantitative traits contain more information than traits based on dichotomization of such quantitative traits (Graham et al. 1997). If several very high values of quantitative traits in multiple domains lead to diagnosis of a disease, affection status contains less information than the values of the corresponding quantitative traits. Dichotomization of quantitative data is well known to be inefficient in statistical analysis. Second, once a subset of quantitative traits is shown to have a strong genetic basis, then it is feasible to extend pedigrees from nuclear families, since quantitative traits may be measured in family members of autistic probands. Third, using extended, as opposed to nuclear, pedigrees is also more powerful for the gene-mapping phase of a genetic study (Wijsman and Amos 1997). Fourth, quantitative traits can be used for stratifying families to identify relatively more homogeneous subsets of families, thereby increasing the power of gene mapping (Folstein and Mankoski 2000; Bradford et al. 2001; Buxbaum et al. 2001; Shao et al. 2002). However, quantitative traits are often multivariate, especially for a disorder such as autism, which is defined by multiple domains. This raises a difficulty, since few methods are available for multivariate linkage analysis (Jiang and Zeng 1995; Kao et al. 1999). One approach is to focus on a univariate quantitative trait and to adjust for other correlated quantitative traits as covariate effects (Goddard et al. 1995; Wijsman and Amos 1997; Hokanson et al. 1999; Shao et al. 2003). Adjustment of one trait for others may help or hinder gene mapping, depending on the genetic correlation structure of traits (Allison et al. 1998; Hokanson et al. 1999), so determining the genetic correlation structure is crucial for multivariate traits.
One challenge in determining the genetic correlation structure of quantitative traits related to autism is pedigree ascertainment. Ascertainment of families through two probands is a common practice in the study of genetic diseases, particularly when a disorder is rare and eventual linkage analysis is the primary goal. Treating data as if pedigrees were randomly sampled typically introduces bias in parameter estimation. The bias tends to be large when the ratio of the number of probands to the number of remaining individuals is relatively large, as is the case in data consisting of nuclear families, each ascertained through multiple probands (Elston 1979). A common approach to adjusting for ascertainment is to carefully model the ascertainment process—that is, to model how probands (and thus pedigrees) are selected (Morton 1959; Cannings and Thompson 1977; Elston 1979; Elston and Sobel 1979; Thompson and Cannings 1979). This is possible in the simple case in which single probands are involved and the trait is univariate. Adjusting for multiplex ascertainment (ascertaining through multiple probands in each family, for example, requiring at least two affected children) requires knowledge of the population sibship size distribution (Vieland and Hodge 1995). In addition, multivariate traits add difficulty, since the multivariate distribution needed for adjustment is rarely available. Also, additional parameters for the ascertainment process need to be introduced and estimated. This is undesirable, since not only are we uninterested in these parameters, but any misspecification of the ascertainment process also causes bias in estimation of the genetic parameters (Ewens and Shute 1986; Ewens and Green 1988).
An alternative approach to adjusting for ascertainment uses the conditional distribution of the phenotypes of nonprobands, given the phenotypes of probands (Simpson et al. 1981; Hopper and Mathews 1982; Boehnke and Lange 1984). Estimates of variance components thus obtained can be used to determine the trait multivariate correlation structure. This approach has been shown to be appropriate only for the single-ascertainment case (Ewens and Green 1988). Multiplex ascertainment is a special case of the single ascertainment. This approach is similar to the so-called “ascertainment-assumption-free” method (Ewens and Shute 1986; Ewens and Green 1988), in the sense that it uses part of the data, but it uses more data than the ascertainment-assumption-free method and, therefore, is more efficient. This may not be as efficient as modeling the ascertainment process, since it does not use all the information available in the data. However, since it is extremely challenging to correctly model the ascertainment process for multiplex ascertainment and multivariate traits, this alternative method that does not require modeling of the ascertainment is attractive.
Here, we provide evidence for a genetic basis of several quantitative traits that are related to autism symptoms. Using a large sample of families, each ascertained through two probands affected by autism spectrum disorder (ASD), we provide a multivariate genetic covariance analysis of these quantitative traits. We believe that this is the first attempt to estimate genetic correlations of multivariate quantitative traits related to autism and to determine this correlation structure in families of probands affected with ASD. We use multivariate polygenic models and adjust for ascertainment by conditioning on the phenotypes of probands. We estimate heritabilities and genetic covariances of five correlated quantitative traits and show that the two traits for social motivation and range of interest/flexibility have high heritability and high genetic correlation. We also compare estimates produced with and without use of an ascertainment adjustment. The estimates are considerably different, indicating that unadjusted estimates appear to be biased.
Material and Methods
Subjects, Pedigrees, and Phenotypic Traits
A sample of 201 nuclear families, consisting of a total of 694 individuals, was used in the analysis. Two pairs of two nuclear families in the sample were further related, such that there were two three-generation pedigrees consisting of two sets of first cousins. This information was used in the analysis. Nuclear families were ascertained through the existence of at least two children affected with ASD (autistic disorder or pervasive developmental disorder, not otherwise specified). Approximately one-half of the families were from the Puget Sound region. The remainder lived throughout the United States, with the exception of 11 families from Canada and 1 each from Britain and New Zealand. Teams of clinical examiners traveled to evaluate multiplex families at local universities and other community agencies that assisted in this study by providing space for testing. Families were recruited via newspaper articles, parent organizations, National Institutes of Health announcements, the University of Washington Autism Center Web site, and a network of community service providers. Approximately 550 families were self-identified as having more than one child with ASD. The 201 families are the subset of these 550 that have (1) a high probability of affected siblings meeting criteria for idiopathic ASD; (2) an ability/willingness to participate in comprehensive diagnostic evaluations; (3) no medical etiology of a neurological disorder among the affected children, such as fragile X syndrome, Norrie syndrome, neurofibromatosis, phenylketonuria, or tuberous sclerosis; and (4) English as the primary language. Absence of fragile X was confirmed through genetic testing of all participants. Comorbid medical conditions were assessed via review of medical records, parent interview, and medical questionnaire. When families included more than one unaffected child, the child deemed to be least affected by any type of learning, language, or social problem was evaluated. The participants in this study were 82% white, 1.4% African American, 2.7% Asian, 4.1% Hispanic/Latino, 1.9% Native American/Native Alaskan, 5.8% biracial, and 2.1% other ethnicities. The study was approved by the University of Washington Institutional Review Board.
The affection status and sex of the probands in these families is shown in table 1. As can be seen in the table, the majority of sibling pairs met strict criteria for autism (AUT), pervasive developmental disorder (PDD), or AUS, as defined below (183 pairs). However, since we sought to examine children with the full continuum of autism symptoms, a minority of siblings who displayed autism symptoms but did not meet the full criteria for ASD (18 pairs) were also included. AUT was defined as a condition meeting either of the following two definitions. The first included both the criteria for autism on the Autism Diagnostic Interview–Revised (ADI-R) (Lord et al. 1994) and the criteria for ASD on the Autism Diagnostic Observation Schedule–Generic (ADOS-G) (Lord et al. 2000). The second was met if the child came within 2 points of meeting the criteria for autism on the ADI-R and met criteria for autism on the ADOS-G. The second definition relaxes the criteria for the ADI-R while requiring more-stringent criteria on the ADOS-G. PDD was defined as a condition meeting criteria for the social or communication domain on the ADI-R, being within 2 points on the other domain, and meeting criteria for ASD on the ADOS-G. AUS was defined as a condition meeting criteria for the social or communication domain on the ADI-R and being within 2 points on the other domain or meeting criteria for ASD on the ADOS-G. PD2 was defined as a condition not meeting the criteria for AUT, PDD, or AUS but having been judged by an expert clinician as meeting DSM-IV clinical criteria for a pervasive developmental disorder. “Broader phenotype” (BPH) was defined as a condition not meeting criteria for any of the above categories, but exhibiting symptoms, on the ADI-R or ADOS, in at least one of the three domains (social, communicative, or repetitive behavior).
Table 1.
Affection Status and Sex of Probands[Note]
|
No. of Proband Pairs |
||||
| Diagnoses | M/M | M/F | F/F | Total |
| AUT and AUT | 89 | 47 | 4 | 140 |
| AUT and PDD | 9 | 2 | 1 | 12 |
| AUT and AUS | 14 | 8 | 5 | 27 |
| AUT and PD2 | 2 | 1 | 0 | 3 |
| AUT and BPH | 5 | 7 | 0 | 12 |
| PDD and AUS | 3 | 0 | 0 | 3 |
| AUS and AUS | 1 | 0 | 0 | 1 |
| AUS and BPH | 1 | 0 | 0 | 1 |
| BPH and BPH | 2 |
0 |
0 |
2 |
| Total | 126 | 65 | 10 | 201 |
Note.— The order of severity of affection status, from most severe to least severe, is as follows: AUT, PDD, AUS, PD2, and BPH.
Quantitative traits related to autism characteristics were measured using the Broader Phenotype Autism Symptom Scale (BPASS) (G. Dawson, A. Estes, J. Munson, G. Schellenberg, R. Bernier, R. Abbott, and E. Wijsman, unpublished data). The BPASS measures several traits related to autism symptoms among all family members, both children and adults, with and without ASD. The range of each trait is between 1 and 5. Higher values of each trait are more indicative of autistic characteristics. The BPASS has two sections. The first section consists of seven items that are scored by a semistructured interview rating parents’ responses to questions about their own functioning or their children’s functioning. The second section consists of six items that are scored by direct observation of the parent, affected child, or unaffected child while interacting with the examiner. The BPASS traits and their contributing characteristics are listed in table 2; we refer to these traits by the abbreviated labels given in the table. The BPASS has been shown to have satisfactory interrater reliability, as well as convergent validity with the Family History Interview (Bolton et al. 1994), a categorical assessment of the broader phenotype used in assessing relatives of probands with autism. The BPASS was administered only by highly trained clinical examiners (doctoral-level clinical psychology graduate students, postdoctoral fellows, and Ph.D.-level licensed clinical psychologists). Clinical examiners also had previously attained research reliability on the ADI-R and the ADOS-G and were highly familiar with general research methods and ASDs. Two additional quantitative traits, for social anxiety and social communication, were measured on the basis of questionnaires completed by parents who provided responses about themselves and their children. We refer to these two traits by the abbreviated labels “SocAnx” and “SocDis.” The SocAnx trait measures distress, discomfort, and anxiety in social situations, as well as the deliberate avoidance of social situations (Watson and Friend 1969). The SocDis trait measures the degree of discomfort in social situations (Sarason et al. 1985).
Table 2.
BPASS Traits
| Label | Trait | Characteristic(s) Measured |
| Expr | Expressiveness | Communicative eye gaze, social smiling, facial expressions, prosody |
| Conv | Conversational skills | Excessive detail in conversation, sensitivity to listener |
| Lang | Language onset | Age at language onset |
| Socl | Social motivation | Sociability with peers, sociability in groups |
| Flex | Range of interest/flexibility | Interests, flexibility in schedule and routine, flexibility in physical environment |
Sex and age (in years) were included as covariates in the analysis. Sex of probands, shown in table 1, is skewed toward males. The mean±SD age was 10.0±5.1 years for children and 39.5±6.4 years for parents. The effect of age on the traits is modeled as piecewise linear, having a (possibly) different slope before and after age 18 years (illustrated in fig. 1), which is appropriate for developmental traits. This is a more flexible model than is a linear function of age. The use of age 18 years as the knot is somewhat arbitrary; however, because there were very few individuals with ages close to 18 years, results are insensitive to the details of this choice.
Figure 1.

Covariate effects (age and sex) for social motivation when estimates with ascertainment adjustment are used. Solid and dashed lines represent males and females, respectively. The vertical dotted line indicates age 18 years.
IQ assessments were conducted using a short form of the Wechsler intelligence scales appropriate to the individual’s age: for ages 5–6 years, the Wechsler Preschool and Primary Scale of Intelligence–Revised (WPPSI-R [Wechsler 1989]); for ages 7–15 years, the Wechsler Intelligence Scale for Children (WISC-III [Wechsler 1991]); and for ages 16 years and older, the Wechsler Adult Intelligence Scale (WAIS-III [Wechsler 1997]). The short form consisted of two verbal subtests (vocabulary and verbal comprehension) and two visual-spatial subtests (block design and object assembly). Full-scale IQ estimates were calculated as described by Sattler (1992). Children aged <5 years were administered the Mullen Scales of Early Learning (Mullen 1995). In addition to the standardized composite IQ score, a ratio IQ score was calculated for the Mullen by dividing the average age equivalence score for the four subscales (visual reception, fine motor, receptive language, and expressive language) by the child’s chronological age.
The Multivariate Polygenic Model
The data, Y, are phenotypes of quantitative traits measured in observed individuals. The Y are ordered in a vector such that the first trait of all individuals precedes the second trait of all individuals, and so forth. The length of Y is k×n, for k traits measured on n individuals. The model we use is the classical polygenic model (Lange and Boehnke 1983):
where X is a design matrix, β is the vector of fixed effects, which may include effects of any observable covariates, such as sex or age, as well as an overall mean; and Z and E are Gaussian random effects (Z is the polygenic value, and E is an environmental effect). The polygenic value Z is normally distributed with mean 0 and variance Σa⊗G, where G is twice the kinship matrix (Lange 2002, pp. 81–84), and E is normally distributed with mean 0 and variance Σe⊗I, where I is the identity matrix. For k traits measured on n individuals, Σa and Σe are k×k nonnegative-definite matrices, and G and I are n×n matrices. Here, ⊗ denotes the Kronecker product of two matrices (Lange 2002, p. 148). Thus, the distribution of the data is
where  denotes the normal distribution with mean μ and variance Σ. The parameters that need to be estimated are the fixed effect vector β, the additive genetic variance matrix Σa, and the environmental variance matrix Σe.
Ascertainment Adjustment in General
Let f(y) be the distribution for phenotypes Y of quantitative traits measured on individuals. To see the effect of ascertainment, let us divide the data into two parts: the phenotypes of the probands, denoted by Y1, and the phenotypes of the nonprobands, denoted by Y2. The distribution f(y) of the data can be then split into the (marginal) distribution of Y1 and the conditional distribution of Y2 given Y1,
Let g(y) be the distribution of the data if the families included in the data were randomly selected. Then,
Note that f(y) describes the distribution of the actual data. What makes f(y) differ from g(y) is the ascertainment process.
In particular, if pedigrees are ascertained through multiplex probands, the only difference between f(y) and g(y) is f(y1) and g(y1)—that is, f(y1)≠g(y1), but f(y2|y1)=g(y2|y1). The conditional distribution f(y2|y1) would remain the same whether the probands are randomly selected or not. Hence, ascertainment through probands can distort the distribution of the phenotypes of probands but not the conditional distribution of the phenotypes of nonprobands given the phenotypes of probands. Therefore, for parameter estimation, it is appropriate to use the conditional distribution of the phenotypes of nonprobands, given the phenotypes of probands.
Ascertainment Adjustment for the Polygenic Model
To get the conditional distribution of the phenotypes of nonprobands (Y2), given the phenotypes of probands (Y1), Y1 and Y2 are ordered in the same way as the Y were ordered. This is necessary to the use of Kronecker product notation below. Then, from equation (2), the joint distribution of Y1 and Y2 is
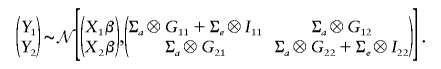 |
The conditional distribution of Y2 given Y1 is then
where
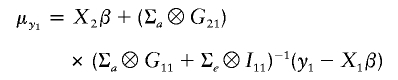 |
and
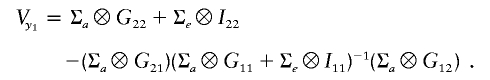 |
Parameter Estimation and SEs
To estimate the parameters β, Σa, and Σe, we use maximum likelihood. Among all possible values of the parameters, we find the maximum-likelihood estimate (MLE), the value that maximizes the log-likelihood for the model. The log-likelihood and its gradient for the model are given in the appendix. We used the nlm function in R (Ihaka and Gentleman 1996) that implements a quasi-Newton method with trust regions (Dennis and Schnabel 1983; Schnabel et al. 1985) for parameter estimation.
Both matrices Σa and Σe must be symmetric and nonnegative definite. To make them so, we reparameterize them through use of Cholesky decomposition, writing them in the form LLt, where L is a lower triangular matrix. We consider the lower triangular entries of the Cholesky decompositions of Σa and Σe as the parameters. This insures that Σa and Σe are symmetric and nonnegative definite.
Asymptotic SEs can be obtained by using maximum-likelihood theory for the possibly misspecified model (White 1982). This gives correct SEs when the model is correctly specified and also when the model is misspecified, as in the case of the polygenic model without ascertainment adjustment.
Statistical Analysis
The goal of this study is to investigate evidence for a genetic basis of several correlated quantitative traits that are related to autism. Within each family, the two most seriously affected children were considered as probands, with ties broken by choosing the elder child. Individuals with missing data were dropped from the analysis. The multivariate polygenic model with ascertainment adjustment (eq. [3]) was implemented to estimate the genetic and environmental covariances among the traits. Age and sex were included as covariates. At the beginning of the analysis, all seven traits (the five traits in table 2 and the two additional social traits) were considered. However, the multivariate polygenic model for the seven traits led to a genetic variance matrix that was highly correlated. This high correlation resulted partly from the strong correlations among the three social traits: the correlation between Socl and SocAnx is 0.49, that between Socl and SocDis is 0.54, and that between SocAnx and SocDis is 0.81. This suggests that the Socl, SocAnx, and SocDis traits are almost the same. Therefore, SocAnx and SocDis were dropped from the multivariate analysis, and the five BPASS traits in table 2 were analyzed. By dropping these two traits from analysis, the number of parameters to be estimated was reduced from 84 to 50, and more data were available for the analysis, which improves the stability of the estimators. To evaluate the effect of the ascertainment adjustment, the multivariate polygenic model without ascertainment adjustment (eq. [2]) was also fitted.
Results
The multivariate polygenic model fit reasonably well for the five traits, whether it was adjusted for ascertainment or not. The goodness of fit of the model was assessed by quantile-quantile plots (not shown). We also fit the environmental model, which is equation (1) without the polygenic value, both with and without ascertainment adjustment. The likelihood-ratio statistics were 45.43 and 76.06, respectively. Their P values were <.001 in both cases, when a χ2 distribution with 15 df was used (this is conservative, because of the constraint mentioned below). Thus, the environmental model with no polygenic value clearly does not fit the data. SEs for estimates of the polygenic model were computed, although they are not shown in tables 3–6. Instead, an estimate is shown in boldface italic type if 0 is not within two SEs of the estimate, so the numbers in boldface italics are statistically significantly different from 0 at a significance level of .05. Both matrices Σa and Σe must be nonnegative definite. Because of this, the estimates are highly constrained, but the SEs do not incorporate these constraints and hence, in this respect, are very conservative. However, no correction is made for multiple testing and hence, in this respect, the SEs are liberal. Thus, the boldface italic type gives only a rough indication of statistical significance.
Table 3.
Estimates of the Covariate Effects[Note]
|
Ascertainment-Adjusted Estimate |
Ascertainment-Unadjusted Estimate |
|||||||||
| Covariate | Expr | Lang | Conv | Socl | Flex | Expr | Lang | Conv | Socl | Flex |
| Constant | 1.71 | 1.85 | .91 | 2.43 | 2.40 | 2.38 | 2.36 | 1.56 | 3.10 | 2.96 |
| Sex | −.26 | −.05 | −.13 | −.07 | −.08 | −.36 | −.08 | −.25 | −.22 | −.19 |
| Age (<18 years) | .00 | −.03 | −.09 | .03 | −.00 | −.03 | −.10 | −.12 | −.02 | −.02 |
| Age (⩾18) | −.00 | .01 | .02 | .01 | −.00 | −.03 | −.01 | −.00 | −.02 | −.02 |
Note.— Estimates in boldface italic type are statistically significant (see text).
Table 4.
Estimates of the Genetic and Environmental Variance Matrices[Note]
|
Ascertainment Adjusted |
Ascertainment Unadjusted |
|||||||||
| Expr | Lang | Conv | Socl | Flex | Expr | Lang | Conv | Socl | Flex | |
| Genetic: | ||||||||||
| Expr | .01 | −.01 | −.00 | −.01 | −.01 | .04 | −.01 | .02 | .00 | −.03 |
| Lang | .02 | −.01 | −.01 | −.01 | .19 | .03 | .00 | −.03 | ||
| Conv | .01 | .01 | .01 | .04 | .02 | −.02 | ||||
| Socl | .12 | .07 | .17 | .08 | ||||||
| Flex | .06 | .08 | ||||||||
| Environmental: | ||||||||||
| Expr | .20 | .06 | .08 | .15 | .09 | .43 | .31 | .33 | .34 | .20 |
| Lang | .23 | .05 | .09 | .06 | .67 | .37 | .33 | .20 | ||
| Conv | .29 | .07 | .07 | .66 | .29 | .20 | ||||
| Socl | .49 | .17 | .66 | .24 | ||||||
| Flex | .30 | .42 | ||||||||
Note.— The genetic variance matrix is in the upper block, and the environmental variance matrix is in the lower block. Diagonal elements are variances, and off-diagonal elements are covariances. Estimates in boldface italic type are statistically significant.
Table 5.
Estimates of Narrow-Sense Heritabilities
|
Heritability Estimatea |
||
| Trait | Adjusted | Unadjusted |
| Expr | .05 | .08 |
| Lang | .08 | .22 |
| Conv | .02 | .05 |
| Socl | .19 | .21 |
| Flex | .16 | .16 |
Estimates in boldface italic type are statistically significant.
Table 6.
Estimates of the Genetic and Environmental Correlation Matrices[Note]
|
Ascertainment Adjusted |
Ascertainment Unadjusted |
|||||||||
| Expr | Lang | Conv | Socl | Flex | Expr | Lang | Conv | Socl | Flex | |
| Genetic: | ||||||||||
| Expr | … | −.66 | −.09 | −.17 | −.21 | … | −.12 | .46 | .01 | −.60 |
| Lang | … | −.57 | −.12 | −.17 | … | .35 | .03 | −.25 | ||
| Conv | … | .43 | .30 | … | .30 | −.36 | ||||
| Socl | … | .92 | … | .68 | ||||||
| Flex | … | … | ||||||||
| Environmental: | ||||||||||
| Expr | … | .30 | .35 | .49 | .36 | … | .59 | .61 | .64 | .48 |
| Lang | … | .19 | .26 | .23 | … | .56 | .50 | .37 | ||
| Conv | … | .17 | .24 | … | .45 | .38 | ||||
| Socl | … | .44 | … | .45 | ||||||
| Flex | … | … | ||||||||
Note.— The genetic correlation matrix is in the upper block, and the environmental correlation matrix is in the lower block. Estimates in boldface italic type are statistically significant.
The covariate effects for the five traits are shown in table 3. The effect of sex on every trait is negative, whether it is adjusted for ascertainment or not, meaning that a female tends to have a lower value than a male. The slope before age 18 years is typically higher than that after age 18 years, meaning that the value of a trait tends to be more sensitive to age before age 18 years than after age 18 years. As an example using the estimates with ascertainment adjustment, the covariate effects on the social motivation trait are plotted in figure 1. The estimate for the constant—for example, 2.43 for Socl—can be interpreted as an average trait value for a male of age 18 years. Note that the estimated constants are lower when adjusted for ascertainment for all the traits. Because of the ascertainment process, the sample contains a higher proportion of affected individuals than the population. Ignoring ascertainment then leads to upward bias of the constants. Therefore, it makes sense that the estimated constants are lower when adjusted for ascertainment.
Box plots for IQ and the five traits are shown in figure 2, in which the five traits are adjusted by age and sex. The box plot for IQ shows that both parents and unaffected children in the sample tend to be above average in this trait, with some regression toward the mean in the unaffected children. This indicates that parents in the sample may be unintentionally selected for high IQ and suggests that the sample may not represent the general population of families with autistic children. For all five traits, the median value in the affected children is highest, and the median value of the parents is between that of the autistic children and the unaffected children. The unaffected children typically have the lowest median values; this probably reflects the ascertainment of such children, who were the most “normal” in the sibships. The box plot for Lang shows the discrete nature of the BPASS trait for language onset, with five ordered categorical levels ranging from exceptionally advanced verbal development through very little language development, as measured by use of multiple word phrases combined with gestures and other communication strategies. Kendall’s tau statistic, a nonparametric measure of correlation (Hollander and Wolfe 1999, chapter 8), was 0.55 when computed from Lang and age at first phrase (item 13 of the ADI-R) in the affected children. This correlation is statistically significantly different from zero (P<.005). The parents’ scores are almost all 2, and there was also little variation in the scores of the unaffected children. We suspect that parents’ recollection of their own language onset was unreliable in many cases.
Figure 2.

Box plots for IQ and age-and-sex–adjusted BPASS traits. A = 297 affected children; U = 54 unaffected children; P = 343 parents. Each box shows lower quartile, median, and upper quartile. The whiskers extend to the most extreme data point that is no more than 1.5 times the interquartile range from the box.
The genetic and environmental variance matrices among the five traits are shown in table 4. Diagonal elements are variances, and off-diagonal elements are covariances. Environmental covariances among the traits are all positive and significant, whereas some genetic covariances are negative. The absolute value of the environmental covariance is much larger than that of the genetic covariance, for every trait. Note that both the genetic and environmental variances have estimates lower in absolute value when the model is adjusted for ascertainment. Since affected individuals have extremely high values for each trait, increasing the number of affected individuals increases the variances of traits. Therefore, it also makes sense that the estimated variances are lower when adjusted for ascertainment. Covariance structures are more difficult to compare, so covariances were converted into correlations, which will be discussed below.
The heritability estimates based on the genetic and environmental variances are shown in table 5. In the presence of an ascertainment adjustment, heritability is highest for the Socl and Flex traits. These two traits show high heritabilities, whether they are adjusted for ascertainment or not. The heritability estimates are lower overall when adjusted for ascertainment, but the ascertainment appears to have little effect on estimates of heritability for Socl and Flex. Without ascertainment adjustment, Lang shows the highest heritability. However, the estimate of heritability for this trait is very sensitive to the ascertainment adjustment and shows evidence for both positive and negative genetic correlations among the traits analyzed. We suspect that this is partly because the distribution of this trait does not satisfy assumptions of the polygenic model. In particular, the variance of this trait among parents is very different from that among children, as can be seen in figure 2. We also analyzed the data without Lang; the resulting estimates for heritability and genetic and environmental correlations (discussed below) were very similar to those we report for analysis of all five traits, differing only in the second decimal place (results not shown). This shows that Lang has little influence on the parameter estimates for the other traits.
The genetic correlation matrix among the five traits is shown in table 6. Socl and Flex show the highest genetic correlation: 0.92 and 0.68 under the ascertainment-adjusted and -unadjusted models, respectively. Genetic correlation estimates with the ascertainment adjustment are very different from those without the ascertainment adjustment. However, because most of these genetic variances and covariances are small (table 4), the genetic correlation estimates are typically unstable. Earlier analysis based on a subset of data (results not shown) confirmed this instability of most of the genetic correlation estimates but still identified a strong genetic correlation between Socl and Flex (0.95 and 0.77 under the ascertainment-adjusted and -unadjusted models, respectively).
The environmental correlation matrix among the five traits, also shown in table 6, shows strong positive correlations among all of the traits. Expr and Socl show the highest environmental correlation: 0.64 and 0.49 under the ascertainment-adjusted and -unadjusted models, respectively. With the ascertainment adjustment, Socl and Flex also show a high environmental correlation (0.45). Without the ascertainment adjustment, Lang and every other trait show high environmental correlations. We suspect that this is also because of the distributional issue of Lang that was mentioned above. Note that each environmental correlation estimate with the ascertainment adjustment is much lower than that without the ascertainment adjustment. In contrast to the genetic correlation estimates, the environmental correlation estimates are quite stable (earlier analysis based on a subset of data confirms this stability).
Discussion
We have examined evidence for a genetic basis of the five quantitative traits related to autism characteristics—the BPASS traits—through use of 201 nuclear families, each ascertained through two probands affected by ASD. Multivariate polygenic models with ascertainment adjustment that was achieved by conditioning on the phenotypes of probands were implemented to estimate heritabilities and genetic and environmental correlations of these traits. Heritability estimates range from 0.02 to 0.19, and genetic correlations range from −0.66 to 0.92. Environmental correlations are all positive, ranging from 0.17 to 0.49. The traits for social motivation and range of interest/flexibility have the highest heritabilities (0.19 and 0.16, respectively) and the highest genetic correlation (0.92).
Our results demonstrate the importance of using an ascertainment adjustment for the analysis of multivariate traits in pedigrees selected through affected probands. Use of an ascertainment adjustment gives considerably different inferences for heritabilities, genetic and environmental correlation structures, and covariate effects for some of the quantitative traits related to autism, in pedigrees ascertained through probands affected by ASD. For families with more than two affected children, we conditioned on probands and did not condition on nonproband affected children. This is a proper adjustment, given the criteria for inclusion of families into the study. In theory, an appropriate ascertainment adjustment would give unbiased estimates. Thus, any difference between results with and without ascertainment adjustment indicates the sensitivity of estimates to the ascertainment procedure. With ascertainment adjustment, the traits for social motivation and range of interest/flexibility show the highest heritabilities. Without ascertainment adjustment, the trait for language onset shows the highest heritability, and the traits for social motivation and range of interest/flexibility are the next highest. In particular, the marked sensitivity of the heritability estimates of the trait for language onset to this ascertainment adjustment shows that analyses with and without ascertainment adjustment can yield different conclusions about heritability. The traits for social motivation and range of interest/flexibility show the highest genetic correlation under both the adjusted and unadjusted models. This relative stability to the ascertainment adjustment may indicate that this finding is less sensitive to assumptions and models. Environmental correlation estimates with the ascertainment adjustment are much lower than those without, indicating that predictions about the effect of manipulating the environment could also be affected by the accuracy of the ascertainment adjustment.
On the basis of our analysis, the traits for social motivation and range of interest/flexibility both seem to have a strong genetic basis. Three other studies have investigated evidence for familiality of subdomains of autistic characteristics, all using ADI-R scores of affected sibships. MacLean et al. (1999) found that nonverbal communication and verbal/nonverbal status are familial; Silverman et al. (2002) found that repetitive behavior, nonverbal communication, useful phrase speech, and age at phrase speech are familial; and Kolevzon et al. (2004) found that impairments in communication and social interaction are familial. Our analysis raises three points of discussion, with regard to these previous studies. First, our analysis confirms evidence for familiality of traits of social interaction (Kolevzon et al. 2004) and repetitive behavior (Silverman et al. 2002). Second, since a familial trait need not be genetic (a trait can be familial as a result of environmental as well as genetic influences), it is not surprising that we did not find evidence, in our analysis, for a genetic basis of all the traits previously reported to be familial. Third, we speculate that previous conclusions may be sensitive to ascertainment, since, in our analysis without an ascertainment adjustment, we found language onset to be highly heritable.
Several studies have investigated the multivariate nature of the three domains of autism. Both Spiker et al. (2002) and Constantino et al. (2004) found no evidence of the three domains being independent. On the other hand, both Silverman et al. (2002) and Kolevzon et al. (2004) speculated that the familial traits that they found were independent, although Kolevzon et al. (2004) found a negative association (pairwise correlation −0.53) between the social and repetitive behavior domains. However, these studies do not reveal reasons for dependence or independence of the three domains. Our multivariate polygenic analysis has shown that all three domains are significantly correlated, mostly because of environmental influences. Also, there is evidence for a significant positive genetic influence on the correlation of social interaction and repetitive behavior.
A multivariate polygenic model provides genetic and environmental correlation structures. This information, in turn, can be useful for the design of gene mapping studies. In particular, the magnitude of genetic correlations can guide the use of the other traits, when one trait at a time is being analyzed. Analysis of single traits, adjusted for covariates, is often preferred in genome scans, for a number of practical reasons. A strong genetic correlation may indicate shared genes for two traits, and a weak or negligible genetic correlation implies that gene sharing is unlikely. For example, when the trait for social motivation is analyzed, adjusting for the trait for range of interest/flexibility may be harmful, since this might eliminate the effect of shared genes, which could, in turn, reduce power in a linkage analysis. On the other hand, adjusting for the trait for expressiveness may be useful, since that could increase the genetic signal by reducing the error variance.
The strong genetic basis of the traits for social motivation and range of interest/flexibility indicates that they are most promising for future gene mapping of individual traits. Since the diagnosis of autism puts more weight on the social domain, the high heritability of the trait for social motivation suggests a strong genetic basis of autism. Also, since it is more feasible to measure a subset of autism characteristics than to get a complete diagnosis of autism, it is easier to extend pedigrees by measuring these two traits in relatives of the individuals in the current sample, thereby increasing the usefulness of the pedigrees for the mapping of genes contributing to these two traits.
To our knowledge, this is the first attempt to evaluate the genetic basis of multivariate quantitative traits related to autism. The five BPASS traits measure the three domains of autism characteristics: expressiveness and social motivation, for impaired social interactions; conversational skills and language onset, for language abnormalities; and range of interest/flexibility, for repetitive or stereotyped behavior. It is highly encouraging to find high heritabilities for the traits for social motivation and range of interest/flexibility. The genetic correlation between the traits for social motivation and range of interest/flexibility appears to be strong, and this may suggest a genetic basis that is shared between these two traits. Because of instabilities of other genetic correlation estimates, it is not clear whether there is any other shared genetic basis. Positive environmental correlations indicate that clear separation of the three domains could be difficult. From a treatment point of view, however, these positive environmental correlations suggest that specific environmental factors may affect multiple domains related to autism.
Acknowledgments
Y.J.S. thanks Elizabeth A. Thompson and Charles J. Geyer, for useful discussions. This work was funded by grant U19HD35465, from the National Institute of Child Health and Human Development (NICHD) and the National Institute of Deafness and Communication Disorders (NIDCD), which is part of the NICHD/NIDCD Collaborative Program of Excellence in Autism, as well as by National Institutes of Health grant R01GM46255. We gratefully acknowledge the contributions of the University of Washington Department of Psychiatry and Behavioral Sciences, the National Institutes of Health, the Clinical and Statistical Cores, and the individuals who participated in this study.
Appendix : Log-Likelihood and Its Derivatives
The log-likelihood for the model in equation (3) is
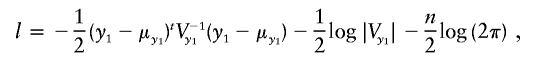 |
where
and
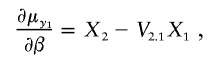
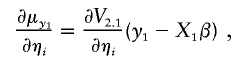
The gradient of the log-likelihood is
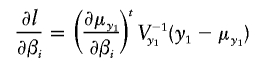 |
and
 |
where ηa and ηe denote the entries of La (the Cholesky decomposition of Σa) and Le (the Cholesky decomposition of Σe),
 |
 |
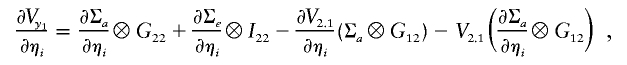 |
 |
and
 |
The calculation of (∂Σe)/(∂ηe) is analogous.
References
- Allison DB, Thiel B, St Jean P, Elston RC, Infante MC, Schork NJ (1998) Multiple phenotype modeling in gene-mapping studies of quantitative traits: power advantages. Am J Hum Genet 63:1190–1201 [DOI] [PMC free article] [PubMed] [Google Scholar]
- American Psychiatric Association (1994) Diagnostic and statistical manual of mental disorders, 4th ed. American Psychatric Association, Washington, DC [Google Scholar]
- August GJ, Stewart MA, Tsai L (1981) The incidence of cognitive disabilities in the siblings of autistic children. Br J Psychiatry 138:416–422 [DOI] [PubMed] [Google Scholar]
- Bailey A, Le Couteur A, Gottesman I, Bolton P, Simonoff E, Yuzda E, Rutter M (1995) Autism as a strongly genetic disorder: evidence from a British twin study. Psychol Med 25:63–77 [DOI] [PubMed] [Google Scholar]
- Barrett S, Beck JC, Bernier R, Bisson E, Braun TA, Casavant TL, Childress D, et al (1999) An autosomal genomic screen for autism. Am J Med Genet 88:609–615 [DOI] [PubMed] [Google Scholar]
- Boehnke M, Lange K (1984) Ascertainment and goodness of fit of variance component models for pedigree data. Prog Clin Biol Res 147:173–192 [PubMed] [Google Scholar]
- Bolton P, Macdonald H, Pickles A, Rios P, Goode S, Crowson M, Bailey A, Rutter M (1994) A case-control family history study of autism. J Child Psychol Psychiatry 35:877–900 [DOI] [PubMed] [Google Scholar]
- Bradford Y, Haines J, Hutcheson H, Gardiner M, Braun T, Sheffield V, Cassavant T, Huang W, Wang K, Vieland V, Folstein S, Santangelo S, Piven J (2001) Incorporating language phenotypes strengthens evidence of linkage to autism. Am J Med Genet 105:539–547 10.1002/ajmg.1497 [DOI] [PubMed] [Google Scholar]
- Buxbaum JD, Silverman JM, Smith CJ, Kilifarski M, Reichert J, Hollander E, Lawlor BA, Fitzgerald M, Greenberg DA, Davis KL (2001) Evidence for a susceptibility gene for autism on chromosome 2 and for genetic heterogeneity. Am J Hum Genet 68:1514–1520 [DOI] [PMC free article] [PubMed] [Google Scholar]
- Cannings C, Thompson EA (1977) Ascertainment in the sequential sampling of pedigrees. Clin Genet 12:208–212 [DOI] [PubMed] [Google Scholar]
- Constantino JN, Davis SA, Todd RD, Schindler MK, Gross MM, Brophy SL, Metzger LM, Shoushtari CS, Splinter R, Reich W (2003a) Validation of a brief quantitative measure of autistic traits: comparison of the social responsiveness scale with the Autism Diagnostic Interview–Revised. J Autism Dev Disord 33:427–433 10.1023/A:1025014929212 [DOI] [PubMed] [Google Scholar]
- Constantino JN, Gruber CP, Davis S, Hayes S, Passanante N, Przybeck T (2004) The factor structure of autistic traits. J Child Psychol Psychiatry 45:719–726 10.1111/j.1469-7610.2004.00266.x [DOI] [PubMed] [Google Scholar]
- Constantino JN, Hudziak JJ, Todd RD (2003b) Deficits in reciprocal social behavior in male twins: evidence for a genetically independent domain of psychopathology. J Am Acad Child Adolesc Psychiatry 42:458–467 [DOI] [PubMed] [Google Scholar]
- Constantino JN, Przybeck T, Friesen D, Todd RD (2000) Reciprocal social behavior in children with and without pervasive developmental disorders. J Dev Behav Pediatr 21:2–11 [DOI] [PubMed] [Google Scholar]
- Constantino JN, Todd RD (2000) Genetic structure of reciprocal social behavior. Am J Psychiatry 157:2043–2045 10.1176/appi.ajp.157.12.2043 [DOI] [PubMed] [Google Scholar]
- ——— (2003) Autistic traits in the general population: a twin study. Arch Gen Psychiatry 60:524–530 10.1001/archpsyc.60.5.524 [DOI] [PubMed] [Google Scholar]
- Dennis JE, Schnabel RB (1983) Numerical methods for unconstrained optimization and nonlinear equations. Prentice-Hall, Englewood Cliffs, NJ [Google Scholar]
- Elston RC (1979) Likelihood models in human quantitative genetics. Prog Clin Biol Res 32:391–405 [PubMed] [Google Scholar]
- Elston RC, Sobel E (1979) Sampling considerations in the gathering and analysis of pedigree data. Am J Hum Genet 31:62–69 [PMC free article] [PubMed] [Google Scholar]
- Ewens WJ, Green RM (1988) A resolution of the ascertainment sampling problem. IV. Continuous phenotypes. Genet Epidemiol 5:433–444 [DOI] [PubMed] [Google Scholar]
- Ewens WJ, Shute NC (1986) A resolution of the ascertainment sampling problem. I. Theory. Theor Popul Biol 30:388–412 [DOI] [PubMed] [Google Scholar]
- Folstein SE, Mankoski RE (2000) Chromosome 7q: where autism meets language disorder? Am J Hum Genet 67:278–281 [DOI] [PMC free article] [PubMed] [Google Scholar]
- Folstein S, Rutter M (1977a) Genetic influences and infantile autism. Nature 265:726–728 [DOI] [PubMed] [Google Scholar]
- ——— (1977b) Infantile autism: a genetic study of 21 twin pairs. J Child Psychol Psychiatry 18:297–321 [DOI] [PubMed] [Google Scholar]
- Goddard KA, Jarvik GP, Graham J, McNeney B, Hsu L, Siegmund K, Grosser S, Olson J, Wijsman EM (1995) Analysis of quantitative risk factors for a common oligogenic disease. Genet Epidemiol 12:759–764 [DOI] [PubMed] [Google Scholar]
- Graham J, Chapman NH, Goddard KA, Goode EL, Wijsman EM, Jarvik GP (1997) Segregation and linkage analysis of a quantitative versus a qualitative trait in large pedigrees. Genet Epidemiol 14:999–1004 [DOI] [PubMed] [Google Scholar]
- Hokanson JE, Brunzell JD, Jarvik GP, Wijsman EM, Austin MA (1999) Linkage of low-density lipoprotein size to the lipoprotein lipase gene in heterozygous lipoprotein lipase deficiency. Am J Hum Genet 64:608–618 [DOI] [PMC free article] [PubMed] [Google Scholar]
- Hollander M, Wolfe DA (1999) Nonparametric statistical methods, 2nd ed. Wiley, New York [Google Scholar]
- Hopper JL, Mathews JD (1982) Extensions to multivariate normal models for pedigree analysis. Ann Hum Genet 46:373–383 [DOI] [PubMed] [Google Scholar]
- Ihaka R, Gentleman R (1996) R: a language for data analysis and graphics. J Comput Graph Stat 5:299–314 [Google Scholar]
- Jiang C, Zeng Z-B (1995) Multiple trait analysis of genetic mapping for quantitative trait loci. Genetics 140:1111–1127 [DOI] [PMC free article] [PubMed] [Google Scholar]
- Kao C-H, Zeng Z-B, Teasdale RD (1999) Multiple interval mapping for quantitative trait loci. Genetics 152:1203–1216 [DOI] [PMC free article] [PubMed] [Google Scholar]
- Kolevzon A, Smith CJ, Schmeidler J, Buxbaum JD, Silverman JM (2004) Familial symptom domains in monozygotic siblings with autism. Am J Med Genet 129B:76–81 [DOI] [PubMed] [Google Scholar]
- Landa R, Piven J, Wzorek MM, Gayle JO, Chase GA, Folstein SE (1992) Social language use in parents of autistic individuals. Psychol Med 22:245–254 [DOI] [PubMed] [Google Scholar]
- Lange K (2002) Mathematical and statistical methods for genetic analysis, 2nd ed. Springer, New York [Google Scholar]
- Lange K, Boehnke M (1983) Extensions to pedigree analysis. IV. Covariance components models for multivariate traits. Am J Hum Genet 14:513–524 [DOI] [PubMed] [Google Scholar]
- Liu JJ, Nyholt DR, Magnussen P, Parano E, Pavone P, Geschwind D, Lord C, Iversen P, Hoh J, Ott J, Gilliam TC (2001) A genomewide screen for autism susceptibility loci. Am J Hum Genet 69:327–340 [DOI] [PMC free article] [PubMed] [Google Scholar]
- Lord C, Risi S, Lambrecht L, Cook E, Leventhal B, DiLavore P, Pickles A, Rutter M (2000) The Autism Diagnostic Observation Schedule–Generic: a standard measure of social and communication deficits associated with the spectrum of autism. J Autism Dev Disord 30:205–223 10.1023/A:1005592401947 [DOI] [PubMed] [Google Scholar]
- Lord C, Rutter M, LeCouteur A (1994) Autism Diagnostic Interview—Revised: a revised version of a diagnostic interview for caregivers of individuals with possible pervasive developmental disorder. J Autism Dev Disord 24:659–685 [DOI] [PubMed] [Google Scholar]
- MacLean JE, Szatmari P, Jones MB, Bryson SE, Mahoney WJ, Bartolucci G, Tuff L (1999) Familial factors influence level of functioning in pervasive developmental disorder. J Am Acad Child Adolesc Psychiatry 38:746–753 10.1097/00004583-199906000-00022 [DOI] [PubMed] [Google Scholar]
- Morton NE (1959) Genetic tests under incomplete ascertainment. Am J Hum Genet 11:1–16 [PMC free article] [PubMed] [Google Scholar]
- Mullen EM (1995) Mullen scales of early learning: AGS edition. American Guidance Service, Circle Pines, MN [Google Scholar]
- Murphy M, Bolton PF, Pickles A, Fombonne E, Piven J, Rutter M (2000) Personality traits of the relatives of autistic probands. Psychol Med 30:1411–1424 10.1017/S0033291799002949 [DOI] [PubMed] [Google Scholar]
- Philippe A, Martinez M, Guilloudbataille M, Gillberg C, Rastam M, Sponheim E, Coleman M, Zappella M, Aschauer H, Vanmalldergerme L, Penet C, Feingold J, Brice A, Leboyer M (1999) Genome-wide scan for autism susceptibility genes. Hum Mol Genet 8:805–812 10.1093/hmg/8.5.805 [DOI] [PubMed] [Google Scholar]
- Pickles A, Bolton P, Macdonald H, Bailey A, Le Couteur A, Sim CH, Rutter M (1995) Latent-class analysis of recurrence risks for complex phenotypes with selection and measurement error: a twin and family history study of autism. Am J Hum Genet 57:717–726 [PMC free article] [PubMed] [Google Scholar]
- Piven J, Palmer P, Jacobi D, Childress D, Arndt S (1997) Broader autism phenotype: evidence from a family history study of multiple-incidence autism families. Am J Psychiatry 154:185–190 [DOI] [PubMed] [Google Scholar]
- Risch N, Spiker D, Lotspeich L, Nouri N, Hinds D, Hallmayer J, Kalaydjieva L, et al (1999) A genomic screen of autism: evidence for a multilocus etiology. Am J Hum Genet 65:493–507 [DOI] [PMC free article] [PubMed] [Google Scholar]
- Ritvo ER, Freeman BJ, Mason-Brothers A, Mo A, Ritvo AM (1985) Concordance for the syndrome of autism in 40 pairs of afflicted twins. Am J Psychiatry 142:74–77 [DOI] [PubMed] [Google Scholar]
- Sarason B, Sarason I, Hacker A, Basham R (1985) Comcomitants of social support: social skills, physical attractiveness, and gender. J Pers Soc Psychol 49:469–480 10.1037//0022-3514.49.2.469 [DOI] [Google Scholar]
- Sattler JM (1992) Assessment of children, 3rd ed. Jerome M. Sattler, La Mesa, CA [Google Scholar]
- Schnabel RB, Koontz JE, Weiss BE (1985) A modular system of algorithms for unconstrained minimization. ACM Trans Math Software 11:419–440 10.1145/6187.6192 [DOI] [Google Scholar]
- Shao Y, Cuccaro ML, Hauser ER, Raiford KL, Menold MM, Wolpert CM, Ravan SA, Elston L, Decena K, Donnelly SL, Abramson RK, Wright HH, Delong GR, Gilbert JR, Pericak-Vance MA (2003) Fine mapping of autistic disorder to chromosome 15q11-q13 by use of phenotypic subtypes. Am J Hum Genet 72:539–548 [DOI] [PMC free article] [PubMed] [Google Scholar]
- Shao Y, Raiford KL, Wolpert CM, Cope HA, Ravan SA, Ashley-Koch AA, Abramson RK, Wright HH, DeLong RG, Gilbert JR, Cuccaro ML, Pericak-Vance MA (2002) Phenotypic homogeneity provides increased support for linkage on chromosome 2 in autistic disorder. Am J Hum Genet 70:1058–1061 [DOI] [PMC free article] [PubMed] [Google Scholar]
- Silverman JM, Smith CJ, Schmeidler J, Hollander E, Lawlor BA, Fitzgerald M, Buxbaum JD, Delaney K, Galvin P, Autism Genetic Research Exchange Consortium (2002) Symptom domains in autism and related conditions: evidence for familiality. Am J Med Genet 114:64–73 10.1002/ajmg.10048 [DOI] [PubMed] [Google Scholar]
- Simpson JM, Brennan PJ, McGilchrist CA, Blacket RB (1981) Estimation of environmental and genetic components of quantitative traits with application to serum cholesterol levels. Am J Hum Genet 33:293–299 [PMC free article] [PubMed] [Google Scholar]
- Smalley SL, Asarnow RF, Spence MA (1988) Autism and genetics: a decade of research. Arch Gen Psychiatry 45:953–961 [DOI] [PubMed] [Google Scholar]
- Spiker D, Lotspeich LJ, Dimiceli S, Myers RM, Risch N (2002) Behavioral phenotypic variation in autism multiplex families: evidence for a continuous severity gradient. Am J Med Genet 114:129–136 10.1002/ajmg.10188 [DOI] [PubMed] [Google Scholar]
- Steffenburg S, Gillberg C, Hellgren L, Andersson L, Gillberg IC, Jakobsson G, Bohman M (1989) A twin study of autism in Denmark, Finland, Iceland, Norway and Sweden. J Child Psychol Psychiatry 30:405–416 [DOI] [PubMed] [Google Scholar]
- Thompson EA, Cannings C (1979) Sampling schemes and ascertainment. Prog Clin Biol Res 32:363–382 [PubMed] [Google Scholar]
- Vieland VJ, Hodge SE (1995) Inherent intractability of the ascertainment problem for pedigree data: a general likelihood framework. Am J Hum Genet 56:33–43 [PMC free article] [PubMed] [Google Scholar]
- Watson D, Friend R (1969) Measurement of social-evaluation anxiety. J Consult Clin Psychol 33:448–457 [DOI] [PubMed] [Google Scholar]
- Wechsler D (1989) Manual for the Wechsler Preschool and Primary Scale of Intelligence–Revised. The Psychological Corporation, San Antonio, TX [Google Scholar]
- ——— (1991) Manual for the Wechsler Intelligence Scale for Children, 3rd ed. The Psychological Corporation, San Antonio, TX [Google Scholar]
- ——— (1997) Manual for the Wechsler Adult Intelligence Scale, 3rd ed. The Psychological Corporation, San Antonio, TX [Google Scholar]
- White HA (1982) Maximum likelihood estimation of misspecified models. Econometrica 50:1–26 [Google Scholar]
- Wijsman EM, Amos CI (1997) Genetic analysis of simulated oligogenic traits in nuclear and extended pedigrees: summary of GAW10 contributions. Genet Epidemiol 14:719–735 [DOI] [PubMed] [Google Scholar]
- Wolff S, Narayan S, Moyes B (1988) Personality characteristics of parents of autistic children: a controlled study. J Child Psychol Psychiatry 29:143–153 [DOI] [PubMed] [Google Scholar]