

Abstract
To treat chronic posterior eye diseases, frequent intravitreal injections or sustained-release drug implants are the current standard of care. Sustained-release drug implants often involve burst release of the drugs and the dosage from the implants cannot be controlled after implantation, which may lead to local side effects. The present study attempts to develop a dosage-controllable drug delivery implant that consists of a nanoporous biodegradable PLGA capsule and light-activated liposomes. Controllable drug release from the implant was achieved using a pulsed near-infrared (NIR) laser both in vitro and in vivo. The in vitro drug release kinetics from two different initial dose implants, 1000 and 500 μg, was analyzed by fitting zero-order and first-order kinetics, as well as the Korsmeyer–Peppas and Higuchi models. The 1000 and 500 μg implants fit the first-order and zero-order kinetics model, respectively, the best. The multiple drug releases in the vitreous were determined by an in vivo fluorimeter, which was consistent with the in vitro data. The dose released was also clinically relevant. Histology and optical and ultrasound imaging data showed no abnormality in the eyes received implant treatment, suggesting that the drug delivery system was safe to the retina. This on-demand dose-controllable drug delivery system could be potentially used for long-term posterior eye disease treatment to avoid frequent invasive injections.
Keywords: drug delivery, triggered drug release, multiple releases, long-term drug delivery, dose-controllable implant, laser-triggered drug delivery, posterior eye diseases
1. INTRODUCTION
Posterior segment eye diseases such as age-related macular degeneration (AMD), diabetic macular edema (DME), and proliferative vitreoretinopathy (PVR) are serious chronic diseases that may result in vision loss. More than 100 million people around the world are suffering from these chronic posterior eye diseases.1,2 The current standard of care for these posterior segment eye diseases involves frequent repetitive intravitreal injections or sustained-release drug implants.3 Typically, intravitreal injections are administered monthly or every other month depending on disease and response to treatment. This is partly because of a relatively short half-life of drugs delivered to the vitreous cavity (within hours–days).4 In addition, this is a significant burden to the patient, the patient’s family, and the health system because current intravitreal therapies require every 4–12 week administration over many years.3 Intravitreally injectable sustained-release implants are also clinically used to prolong therapeutic efficacy.5,6 For example, Ozurdex is a biodegradable implant made of poly lactide-co-glycolic acid (PLGA) and designed for 6 month sustained release. The drug release mechanism of the Ozurdex implant relies entirely on the degradation rate of a PLGA matrix where the drug is impregnated. However, most of the drug is released initially after treatment within 1 month due to polymer degradation,7 leading to high initial drug concentrations in the vitreous or the retina. This high initial dose or burst release of drug from the implant is considered to cause local side effects such as elevated intraocular pressure and cataract formation, etc.8
We previously developed a size-exclusive nanoporous biodegradable PLGA capsule as a dosage-controllable drug delivery implant, which was stable and safe in rabbit eyes for 6 months.3 In the present study, we combined the capsule with light-activatable drug-encapsulated liposomes to create a light-activated dose-controllable implant. Our hypothesis is that light-activatable drug-encapsulated liposomes inside the nanoporous PLGA capsule release drug when irradiated by near-infrared laser irradiation and the drug diffuses through the nanoporous structure to the surrounding media (Figure 1). We focused on drug release from the implant by laser irradiation both in vitro and in vivo to demonstrate the feasibility of using the implant as a dose-controllable drug delivery system to the posterior segment of the eye. Drug release kinetics in vitro were analyzed utilizing the implants with two different dosages.
Figure 1.

Schematic of light-activated drug implant under pulsed NIR laser irradiation. Drug and dye molecules are released from the nanopores of the implant.
The light-activatable liposomes coencapsulate methotrexate (MTX) and Cy5 fluorescent dye. MTX is an anti-inflammatory drug used to treat proliferative vitreoretinopathy (PVR) and noninfectious uveitis.9 Cy5 is used to quantitively analyze hydrophilic molecules released by laser trigger in vivo using fluorescence imaging.
2. MATERIALS AND METHODS
2.1. Materials.
The materials used for the study are described in the Materials and Methods section in our previous publication.3
2.2. Synthesis of MTX/Cy5 Encapsulated Liposomes.
MTX liposomes and MTX/Cy5 coencapsulated liposomes were synthesized by a modified reverse-phase evaporation (REV) method reported in our other study.3,10 MTX liposome was prepared for in vitro drug release test. MTX/Cy5 coencapsulated liposome was used for in vivo drug release test. The MTX or MTX/Cy5-loaded liposome was prepared following the methods in He et al.3 Briefly, liposomes synthesized by REV were mixed with gold nanorod suspension to attach the gold nanorods on the liposome surface electrostatically. The attached gold nanorod-coated liposome suspension was concentrated by centrifugation at 6000 rpm for 30 min to achieve a higher drug concentration. After centrifugation, the suspension of concentrated drug/dye loaded liposome (approximate 350 μL) was stored at −20 °C for 2 h and then transferred to −70 °C for another 2 h until completely frozen. Then, the frozen liposome suspension was lyophilized in a freeze dryer (FreeZone 2.5, LABCONCO, Kansas City, MO) for 4 h.
For 1000 and 500 μg dosage loading, 36.5 and 73 μL of a phosphate buffer saline (PBS) solution, respectively, was added into the lyophilized liposome samples. The rehydrated sample was incubated in room temperature overnight. After stirring the sample with a fine 30 gauge syringe needle was used to manually homogenize the sample for 5 min. Then, the gel-like high-concentration MTX liposome suspension was centrifuged at 3000 rpm for 3 min to remove any potential bubbles that may occur during the mixing. The mixed samples were injected into the PLGA implants.
2.3. Fabrication of Laser-Activated Drug Implant.
A laser-activated drug release PLGA implant was generated by loading concentrated MTX liposomes or MTX/Cy5 liposomes in a PLGA nanoporous tube. The PLGA tube was fabricated by mainly following our previous method.3 Briefly, PLGA (MW 200 000, L/G 90/10, PolySciTech) was mixed with poly(ethylene glycol) (PEG) (MW 3350, Fisher Chemical) as porogen at 0.1 PEG to PLGA weight ratio in DCM at 50 mg/mL PLGA in DCM. Eight hundred microliters of the mixture was transferred to a mold and bath-sonicated for 80 min at 10 °C. The PLGA/PEG solution was air-dried overnight in a chemical hood at room temperature and became a ~30 μm thickness sheet. The PLGA/PEG sheet was rolled using a 22 gauge needle as a template twice to create a double-layer tube. One end of the tube was sealed by a preheated iron at 60 °C. Four microliters of the MTX/Cy5 coencapsulated liposome suspension described above was then injected into the one-end sealed tube using a 30 gauge syringe blunt tip needle. The other end of the tube was sealed in the same manner after sample loading. After sealing, the implant was incubated in 1 mL of PBS at 35 °C for 24 h to remove the porogen PEG, resulting in the final product, a nanoporous PLGA capsule implant. For two different liposomal drug doses in the implant, 1000 and 500 μg implants, the same volume 4 μL but dilution was used. For characterization of the dimension of the PLGA/PEG tube, a digital microscope VHX-2000 (Keyence, IL) was used.
2.4. In Vitro NIR Laser Irradiation of Implant.
A laser-activated implant was placed in 1 mL of PBS at 35 °C in a 1.5 mL test tube. Each test tube was held horizontally on a Petri dish. A pulsed NIR (1064 nm) laser (BrightSolutions, Pavia, Italy) irradiated the implant for 15 min total, 5 s at four different spots (20 s) with 1 min cooling time between 20 s irradiations. The released MTX (drug) outside of the implant was quantitively analyzed using UV–vis spectrometry at absorption wavelength of 370 nm. A calibration curve was prepared for MTX concentration in PBS corresponding to its optical density (O.D.) (Supporting Information S1). PBS solution was replaced after every 24 h.
2.5. Modeling Analysis of Drug Release.
Drug release kinetics was analyzed by fitting the following models to cumulative drug release data.
2.5.1. Zero-Order Kinetics.
When cumulative drug release is linearly proportional to time, regardless of the initial dose in the implant, the cumulative total amount released follows
| (1) |
where is the cumulative total amount of drug released in the medium, is the initial drug amount in a surrounding medium, and is a zero-order release kinetic constant.
2.5.2. First-Order Kinetics.
When the drug release rate depends on drug concentration in the drug reservoir, it is called the first-order kinetics.
| (2) |
where is the amount of drug in the implant and is a first-order release constant. At time , which is the initial drug amount in the implant. Then,
| (3) |
and .
2.5.3. Korsmeyer–Peppas (KP) Model.
The generic equation for the Korsmeyer–Peppas model is
| (4) |
where is the fraction of drug released at time , is a Korsmeyer–Peppas kinetic constant, and is diffusion or release exponent, which will be determined by the fitting. suggests the type of drug release mechanism as shown in Table 1.
Table 1.
| indication | |
|---|---|
| <0.45 | quasi Fickian |
| 0.5 | Fickian diffusion |
| 0.55 < n < 1 | anomalous diffusion or non-Fickian diffusion |
| n = 1 | case II diffusion or zero-order release |
| n > 1 | non-Fickian super case II |
The KP model is applicable to assess the mechanism of the first 60% of drug release taking place from swellable polymeric devices.12
2.5.4. Higuchi Model.
The drug release mechanism primarily caused by the diffusion process can be anticipated by fitting Higuchi release equation as the following.13
| (5) |
where is Higuchi constant. The model describes that drug release follows the diffusion process based on Fick’s law.
2.5.5. Statistical Analysis of Drug Release Kinetics.
Statistical comparisons among the release kinetics () of 1000 μg implant and 500 μg implant for zero-order, first-order, KP and Higuchi models, respectively (with and without first 24 h data), were performed by single-factor ANOVA, and p-value <0.05 was considered statistically significantly different .
2.6. Fluorescence Calibration of Remaining MTX in Implants.
Implants loaded with 700, 800, 900, and 1000 μg liposomal MTX dosage were characterized using an in vivo fluorescent microscope (Micron IV, Phoenix Technology Group LLC., CA). The fluorescent intensity of Cy5 dye in the implant was quantified by a mean gray value utilizing ImageJ (NIH). A calibration curve was generated based on mean gray values in the implant versus the liposomal MTX dosage loaded.
2.7. In Vivo Drug Release from Implant.
All animal studies were performed at the Laboratory Animal Medical Services and approved by the IACUC at the University of Cincinnati. New Zealand White rabbits (~2 kg) were used to study drug release of our laser-activated implant in the vitreous. Before injection, the implant was sterilized by ultraviolet light (UV) for 30 min and inserted into a sterilized 17 gauge needle. The implant was injected into the vitreous at the pars plana through the sclera around 3–5 mm away from the limbus performed by a surgeon. Untreated eyes were served as a control group.
The implant in the rabbit eyes was examined by optical/fluorescence imaging (Micron IV), ultrasound imaging (Terason Ultrasound, Burlington, MA), and fundus imaging (28D fundus lens, Volk Optical, Mentor, OH). A guide beam was used to aim at the center of the injected implant. After alignment, a near-infrared pulsed laser (1064 nm, 1.1 W/cm2) was replaced with the guide beam. Then, the implant was irradiated for 20 s (5 s × 4 different spots along the implant) and irradiation was paused for 3 min for cool-down. After cooling, irradiation was performed again in the same manner for 10 min total. After the laser irradiation, optical imaging, ultrasound imaging, and fluorescence imaging were used to characterize the implant and surrounding area in the vitreous. The lens of the microscope was contacted on the cornea of the rabbit using an eye gel (Genteal Tears, Fort Worth, TX). The amount of drug released in vivo was quantified by fluorescent intensity of the implant and a mean gray value in ImageJ. Based on the calibration curve obtained in Section 2.6, drug concentration in the implant remained after irradiation was determined. The control eyes did not receive laser irradiation and were imaged in the same manner.
2.8. Tissue Processing and Histological Examination.
The detailed procedure for histological examination is described in He et al.3 Briefly, the eyes of the implant + laser group were dissected and the isolated segment was fixed using Davidson’s fixation solution following the methods in He et al.3 The control eye remained intact and was fixed as a whole eye.
3. RESULTS
3.1. Characterization of Laser-Activated Drug Implant.
Thickness () and inner radius () of the PLGA tube prepared from the PLGA/PEG sheet were 59.0 ± 7.2 and 293.2 ± 2.3 μm, respectively (Figure 2, middle). The implant where the lumen was filled with 4 μL of rehydrated MTX/Cy5 liposomes was inserted in a syringe needle for intravitreal injection (Figure 2, right). The detailed characterization of the MTX/Cy5 liposomes is given in our other study.10 Briefly, the liposomes have an average hydrodynamic diameter at 1524 ± 104 nm with two populations, one at ~5 μm and the other at <1 μm. Confocal images showed the coencapsulation of MTX and Cy5 in the core of the liposomes. Transmission electron microscopy (TEM) confirmed the attachment of AuNRs on the liposome surface. The concentrations of liposomal MTX in the implant for 1000 and 500 μg implants were 245 ± 9.9 and 119.5 ± 13.4 mg/mL, respectively, determined by UV–vis spectroscopy.
Figure 2.

Process of preparation of dye/drug coencapsulated liposome loaded in a two-layer PLGA implant.
The pore size of the PLGA tube was characterized in our previous study.3 The scanning electron microscopy (SEM) images did not show porous structure, indicating that the pore size was less than ~2 nm.3,14 In addition, the tube exclusively released small dye molecules, Cy5 (MW 761), through the polymer membrane within 24 h, keeping the MTX/Cy5 encapsulated liposomes inside the lumen.13 In contrast, a nonporous PLGA tube did not show any Cy5 release.
3.2. In Vitro Drug Release of Implant after Laser Irradiations.
Cumulative amounts of MTX released from the 1000 and 500 μg implants after the laser irradiation trigger are demonstrated in Figure 3. Implant initially loaded with 1000 μg implant showed a rapid release within the first 24 h. The release kinetics slope decreased after 24 h, and it reached almost a plateau after 168 h. For 500 μg implant, the profile was relatively linear with time. The plateau showed up at 192 h. Overall, ~50 and ~25 μg of MTX were released from the 1000 and 500 μg, respectively, per irradiation. The results may suggest that the “total” dose released by laser was proportional to the initial dose packed in the implant, in other words, the drug concentration. However, further studies with different initial doses will be necessary to confirm the correlation between the “total” dose released by laser and the initial dose.
Figure 3.

Cumulative amount of MTX released from implants after irradiation with two different total doses as in liposomal form packed in the implant: 1000 μg (blue circles) and 500 μg (orange triangles).
3.3. Drug Release Kinetics Models.
MTX release kinetics were analyzed by fitting four drug release kinetics models to the cumulative MTX release data, including zero-order, first-order, Korsmeyer–Peppas, and Higuchi models (Figure 4). For the zero-order fittings, the 500 μg implants showed a higher regression coefficient () than the 1000 μg (Figure 4A, Table 2). In fact, the 500 μg kinetic curve fitted the zero-order kinetics the best among the four models. The zero-order rate constants were and for 1000 and 500 μg, respectively, indicating that the 1000 μg implants released the drug through the capsule membrane faster than the 500 μg. Because of the fast increase of drug release within 24 h for the 1000 μg implants, we have fitted the models excluding data points before 24 h. Regardless, the values did not improve in the zero-order kinetics for the 1000 μg . The first-order model was fit the best to the 1000 μg drug release curve among the four models (), suggesting that the rate of drug release from 1000 μg implants was proportional to the drug concentration released by laser in the implant (Figure 4B, Table 2). The for the 500 μg implants in the first-order kinetic model was 0.95. The first-order kinetic rate constants for 1000 and 500 μg were were and , respectively, indicating that the drug release rate of the 1000 μg was much faster than the 500 μg.
Figure 4.

Fitting results of cumulative MTX release kinetics by laser irradiation according to (A) zero-order, (B) first-order, (C) Korsmeyer–Peppas, and (D) Higuchi models. Data: 1000 μg (blue circles) and 500 μg (orange triangles). Trend lines: 1 (blue): 1000 μg from 0 h, 2 (red): 1000 μg from 24 h, 3 (orange): 500 μg from 0 h, and 4 (green): 500 μg from 24 h.
Table 2.
p-Values of Drug Release Kinetics for 1000 and 500 μg Implants
| fitting models | (from 0 h) | (from 0 h) | (from 24 h) | (from 24 h) | p-values (from 0 h) | p-values (from 24 h) |
|---|---|---|---|---|---|---|
| zero order (1000 μg) | = 0.0044 | 0.90 | = 0.0017 | 0.82 | 0.32 | 0.048 |
| zero order (500 μg) | = 0.0036 | 0.99 | = 0.0031 | 0.98 | ||
| first order (1000 μg) | = −0.022 | 0.99 | = −0.023 | 0.97 | 0.00060 | 0.0016 |
| first order (500 μg) | = −0.0089 | 0.95 | = −0.011 | 0.91 | ||
| KP model (1000 μg) | = 0.47 | 0.88 | = 0.31 | 0.95 | 0.091 () | 0.045 () |
| = 0.085 | = 0.2019 | |||||
| KP model (500 μg) | = 0.78 | 0.97 | = 0.88 | 0.99 | 0.024 () | 0.0024 () |
| = 0.011 | = 0.0067 | |||||
| Higuchi (1000 μg) | = 0.072 | 0.98 | 0.046 | 0.91 | 0.0044 | 0.066 |
| Higuchi (500 μg) | = 0.052 | 0.98 | 0.072 | 0.97 |
For the KP model in Figure 4C, since at cannot be plotted, the data point at 12 h was used as the first data point. The values from KP model fittings for 1000 and 500 μg were 0.47 and 0.78, respectively, suggesting that they showed different diffusion mechanisms according to Table 1. for the 1000 μg suggested that the drug release from 1000 μg followed Fickian diffusion although the value was low for the 500 μg indicated that it followed non-Fickian diffusion ( and from 0 and 24 h, respectively). The KP model originally describes different diffusion mechanisms that stem from changes in the polymer state or morphology upon hydration.11 However, our implant was incubated and equilibrated in an aqueous solvent (PBS) before irradiation. It is unlikely polymer morphology changes from glass to rubber phase due to “swelling” during the drug release. The KP model also describes that diffusion in glassy polymers may be either Fickian or non-Fickian, depending on the relative rates of chain relaxation and diffusion and on the activity of water in the polymer. PLGA is glassy compared to the polymers that Korsmeyer and Peppas used, such as PVA hydrogel.
The Higuchi model fitting in Figure 4D resulted in high values for both 1000 and 500 μg at 0.98 and 0.98, respectively, indicative of Fickian diffusion-controlled release. The slopes from the Higuchi model suggest that that and for 1000 and 500 μg, respectively.
Overall, both 1000 and 500 μg followed the Higuchi model the best with high values () among the four models, indicating that drug release followed Fickian diffusion through a solid structure. Higuchi model describes pseudo-steady-state diffusion where drug concentration is constant with time throughout the polymer membrane. Pseudo-steady-state occurs when drug solubility in the membrane is lower than in the reservoir and the drug slowly dissolves in the membrane.
To confirm the differences in the release of MTX between the 1000 and 500 μg implants, statistical analysis by single-factor ANOVA was performed (Table 2). The p-values of most groups were less than 0.05 except zero-order from 0 h, KP model from 0 h, and Higuchi model from 24 h, indicating that the rate constants and n values were significantly different between the 1000 and 500 μg. The p-value for the zero-order rate constant from 0 h was 0.32. was sensitive to the final cumulative drug release amount. Relatively large variations in the 1000 μg group %cumulative release, from 37 to 62%, may have affected the large p-value. The p-value for the KP model from 0 h was 0.091. Big error bars in the initial data points of the 500 μg group could have caused the large p-values.
3.4. In Vivo Drug/Dye Release after Laser Irradiation.
The in vivo study involved intravitreal injection of the implant into the vitreous cavity of rabbits followed by weekly irradiation of the implant with pulsed laser. In Figure 5, the long cylindrical shape of the implant in the vitreous was observed by ultrasound and optical images for the implant + laser group, as opposed to the control group. The ultrasound images show sagittal views that include the lens on top of the image and the vitreous and the retina. The implant was positioned diagonally following the direction of injection, and the position or location did not change over 21 days. The optical (OP) and ultrasound (UL) images in Figure 5 were taken before laser irradiation. Except for the day 0 image, days 7, 14, and 21 images showed a smudge of dye near the implant, indicative of dye/drug released from the previous week.
Figure 5.
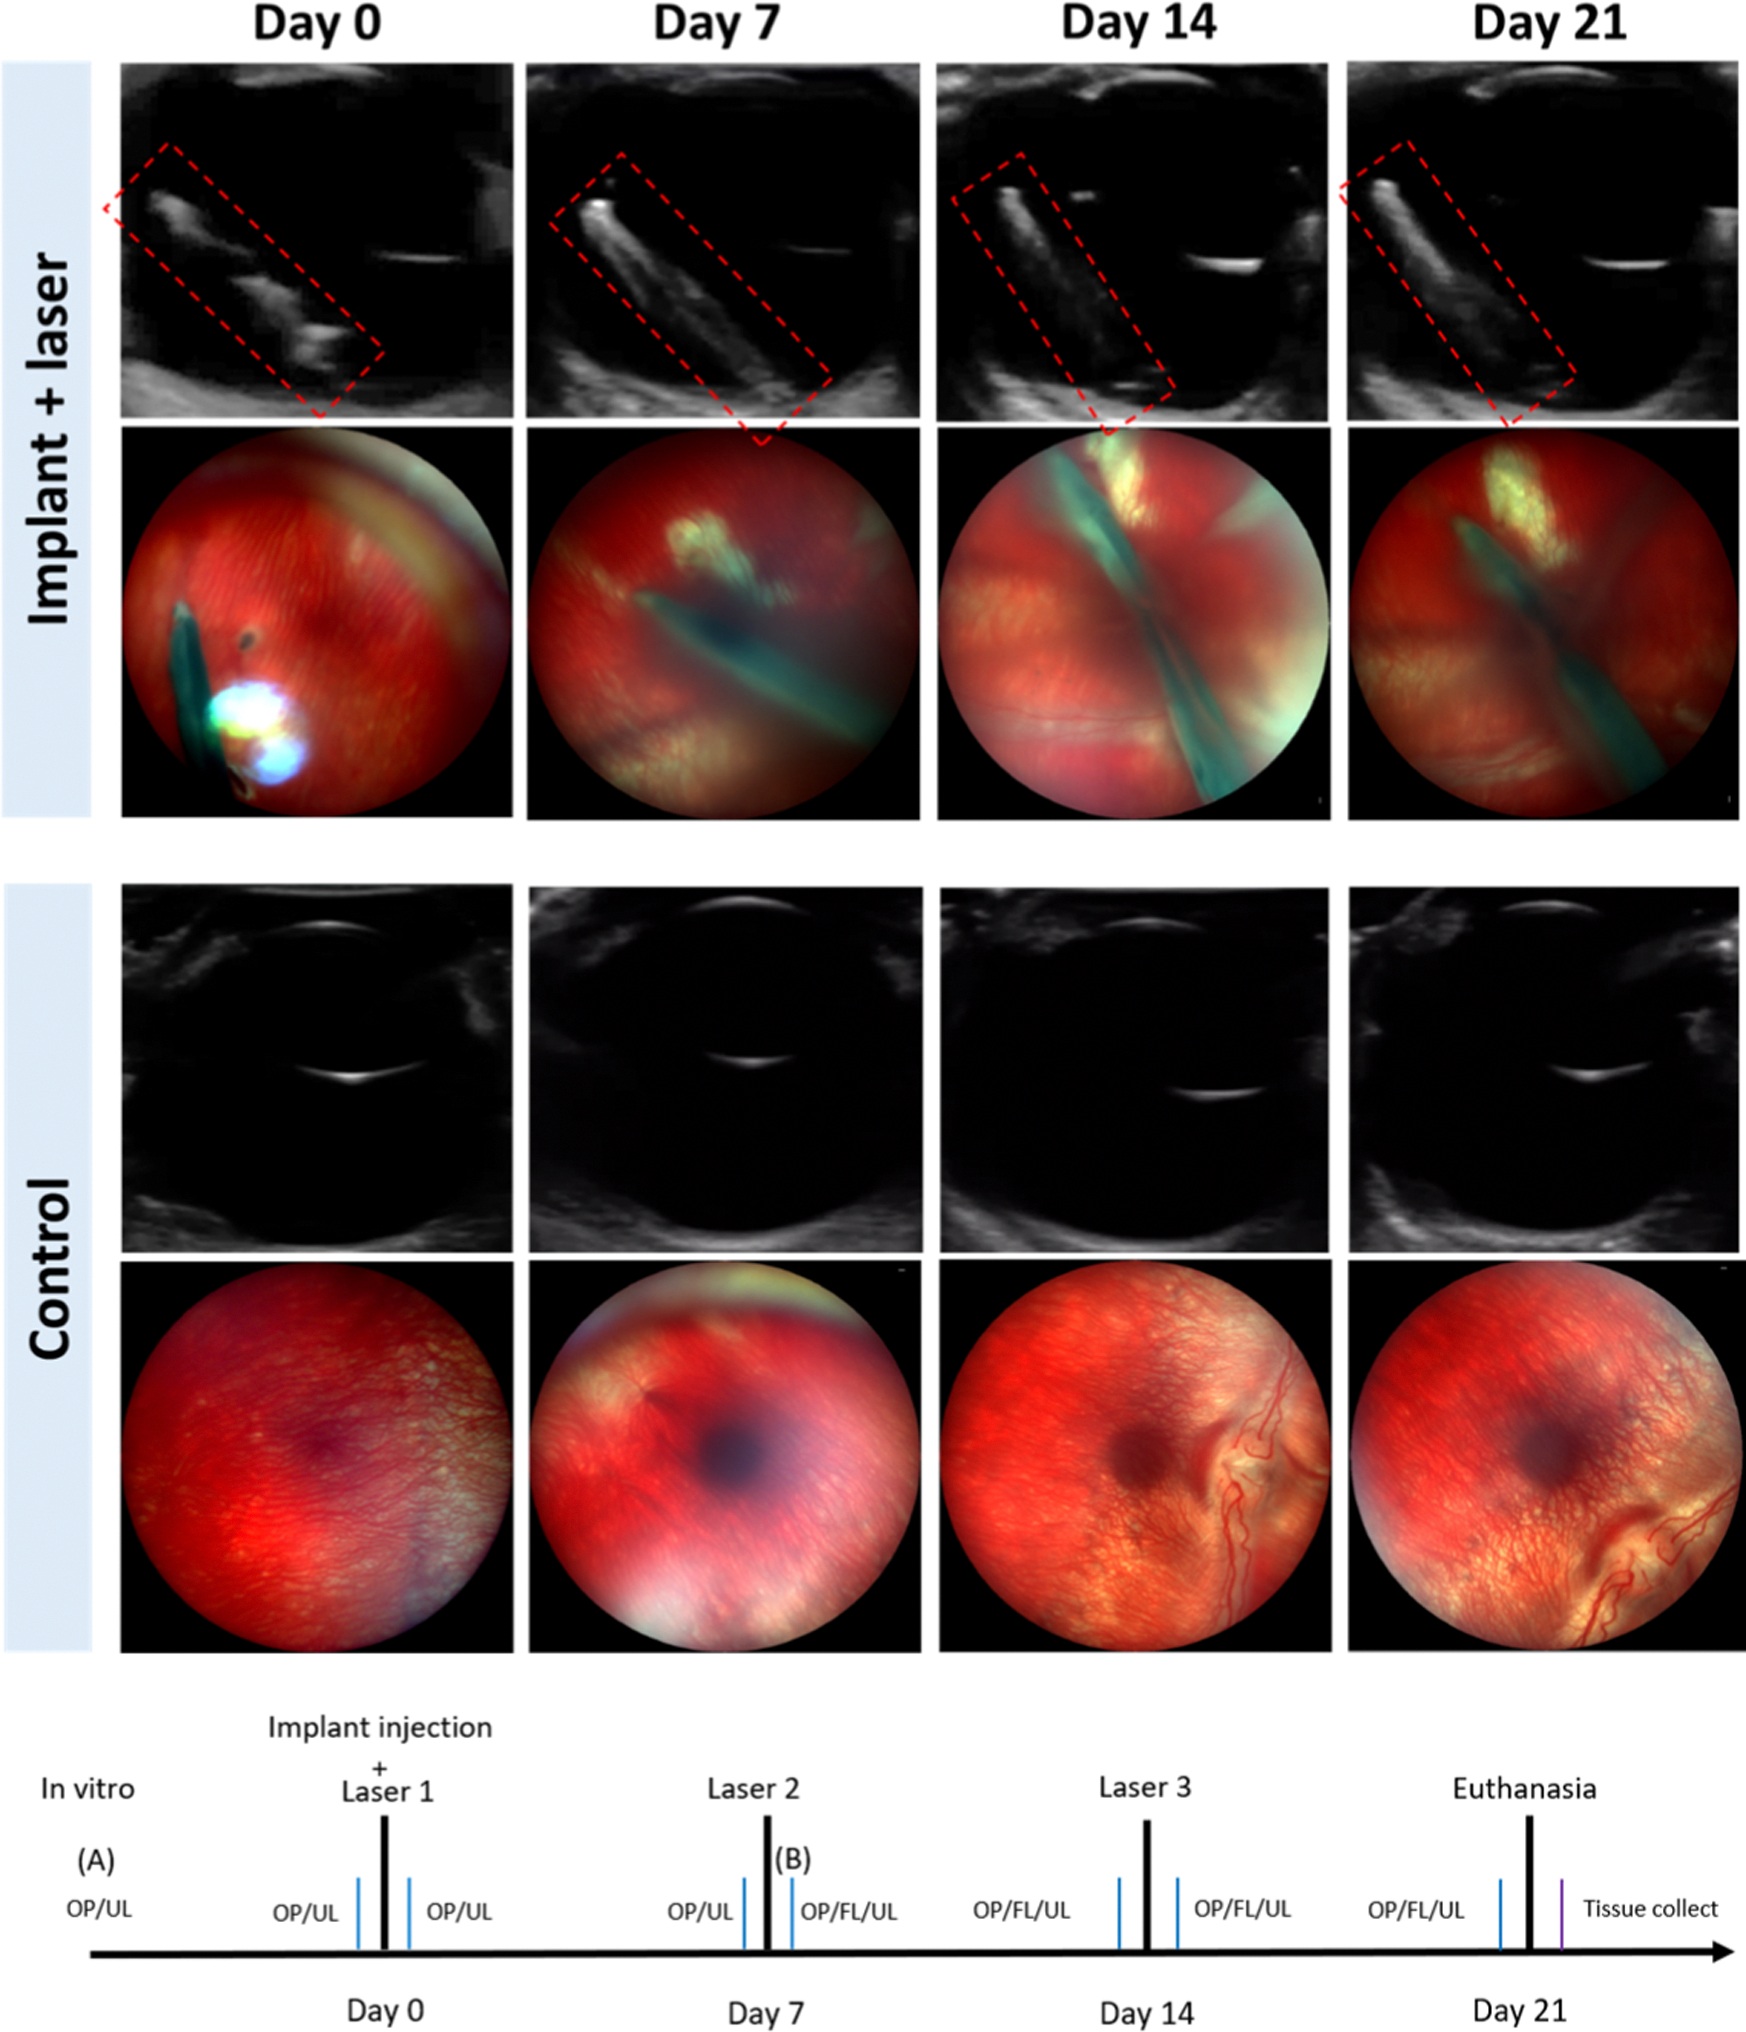
Ultrasound and optical images of the implant-injected eye showing the retina and the implant, and the control eye on day 0, day 7, day 14, and day 21, respectively. The laser was irradiated at days 0, 7, and 14 for the implant group.
Based on the in vivo fluorescence images (FL) in Figure 6, the amount of the drug/dye released by laser was estimated. The fluorescence images of the 1000 μg implant before first irradiation and after second irradiations are demonstrated in Figure 6A,B, respectively. The mean (average) gray values of the whole implant analyzed by ImageJ were 64.1 and 44.6 for (A) and (B), respectively, indicating that the dye/drug was released by laser irradiation in vivo. On the other hand, the mean gray values of the whole vitreous increased from 0 to 33.9. Based on the mean gray values in the implant and the calibration curve between the mean gray value in the implant and MTX drug amount in the implant (Supporting Information S2), the amounts of MTX in the implant for (A) and (B) were 1000 and 898.7 μg, respectively. This suggests that about 100 μg of MTX was released by two irradiations. The results match the in vitro results, where 1000 μg implants released ~50 μg per irradiation. The mean gray values in the center of implant significantly decreased from 84 to 42, indicating that the dye/drug was released from the area where laser irradiated.
Figure 6.

Mean gray values of fluorescent images of (A) before laser and (B) after two lasers in vivo.
3.5. In Vivo Safety of the Light-Activated Drug Delivery Implant.
Based upon the ultrasound and optical images in Figure 5, the implant + laser group did not show any adverse effect on the retina over the 21-day period. The retina margin looked clear and did not change over time in the ultrasound images. Also, in the optical images, abnormal vessels or structures in the retina were not observed. The location and the shape of the implant did not change according to the results of ultrasound and optical imaging.
Figure 7A presents the gross picture of the eye cup from the implant + laser group after 21 days and three irradiations, showing the intactness of the implant. No obvious damage was observed on the outer surface of the implant. The histological sections from the implant + laser group showed the retinal layers remained their integrity, including nerve fiber layer, inner nuclear layer, outer nuclear layer, retinal pigment epithelium (RPE), and choroid, suggesting minimal toxicity from the implant (Figure 7B). In addition, multinucleated giant cells, which are a typical indicator of foreign body response,15 were not found in the histological sections. The detachment observed of the retina in the implanted eye was due to the tissue preparation process, compared to the control eye which was fixed intact without a cut-open for tissue preparation (Figure 7C). Both the optical imaging and histology data showed no sign of laser damages, which are often characterized by RPE and choroidal circular pigmentation, and loss of nuclei in the outer nuclear layer (ONL).16,17
Figure 7.

(A) Gross picture of the implant + laser rabbit eye after removing the lens and cornea. Black ink was used to mark the location of the implant from outside the sclera. Representative histological images showing the retinal layers with H&E staining of (B) the implant + laser eye and (C) the control eye. GCL: ganglion cell layer; INL: inner nuclear layer; ONL: outer nuclear layer; and RPE: retinal pigment epithelium.
4. DISCUSSION
Previously, we have tested the long-term stability of the implant for 6 months in vivo and in vitro and the safety in the rabbit eyes.3 There were no signs of significant leakage of drug from the implant 4 months post injection. The implant slowly degraded in physiological condition, and the pore size increased to 50–500 nm on day 120.3 On day 180, the pore size became larger, showing ~1000 nm in diameter.3 Approximately a half of the implant remained in the rabbit eyes on day 180. We have not observed any sign of cytotoxicity, immune responses, or foreign body responses 180 days post implantation in vivo.
In this study, we focused on irradiation-induced drug release and achieved a clinically relevant vitreous dose in vivo and in vitro. First, we utilized a lyophilization technique to increase the initial dose of the liposomal drug in the implant compared to our previous study to make the dose relevant to clinical doses. One clinical study showed that 100–200 μg of MTX per injection biweekly was therapeutically effective to treat proliferative vitreoretinopathy.18 The treatment usually requires multiple repeated injections for months. We chose 1000 and 500 μg of MTX implants to include doses available for a long term (~6 months). The implants can be utilized as a noninvasive drug delivery system for the long term, avoiding frequent intravitreal injections. Second, the drug dose released per irradiation was also comparable to the clinical dose. Although the total dose of ~50 μg released from the implant after the laser irradiation trigger in this study does not reach the normal clinical dose of 100–200 μg MTX, the implant provides a higher drug concentration in the vitreous over several days than conventional intravitreal injections. This is because the amount of drug in the vitreous after intravitreal injection would significantly drop within a day because of the half-life of free MTX molecules in the vitreous, ~14.3 h.19 In other words, a half of 100, 50 μg, is cleared out from the vitreous in less than a day. On the other hand, the light-activated implant continuously released the 50 μg over 10 days after laser irradiation, keeping a dose of ~5 μg daily. This new delivery mechanism is beneficial for long-term drug delivery. We have also shown repetitive multiple laser-triggered releases in vivo. After two irradiations, 100 μg was released from the implant, and theoretically, the 1000 μg implant has the capacity for 20 times laser triggers.
The “total” drug release by one laser irradiation was proportional to the total dose packed in the implant at least for the two doses: ~50 μg from 1000 μg, and ~25 μg from 500 μg implants. The 1000 μg implant has double the concentration of liposomal drug compared to the 500 μg implant. Thus, it is likely the higher “total” drug release from the higher dose implants was because of the more liposomal drug hit by the laser.
One thousand and 500 μg implants followed the first-order kinetics and zero-order kinetics the best, respectively. The results imply that the “total” dose released by the laser inside the implant generated a concentration gradient across the membrane, which led to different diffusion rates and kinetics. In general, the rate constants of the 1000 μg implants were all higher than the 500 μg, including , , and .
Both 1000 and 500 μg followed the Higuchi model with high values (), indicating that drug release followed Fickian diffusion. The Higuchi model describes pseudo-steady-state diffusion where drug concentration is constant with time throughout the polymer membrane because drug solubility in the membrane is lower than in the reservoir and the drug slowly dissolves in the membrane.
Following the mathematical analysis of Fick’s law diffusion for a reservoir cylinder, where drug molecules diffuse from a lumen through a vessel wall,20
| (6) |
the diffusion coefficients of MTX through the membrane were and 1.9 × 10⁻¹⁰ cm2/s, for the 1000 and 500 μg, respectively, where is inner diameter, is outer diameter, is the length of the cylinder (implant), and is the partition coefficient of MTX between the membrane and the reservoir. We assume and MTX is penetrating through the pores. We found that the effective diffusion coefficient of MTX through the nanopores was approximately 1000 times less than the diffusion coefficient of MTX in water. In addition, the was proportional to the rate constant of the first-order kinetics , and the drug release rate of the 1000 μg was twice as fast as the 500 μg. These results were consistent with other studies, which described that increasing the loading of therapeutic particles in the matrix also increases the release rate of therapeutics.21–24 Also, the effective diffusion coefficients based on Fick’s law were in the same order at 10−10 cm2/s and the values were increasing with the loading capacity.
We expect that multiple/repeated exposure to the NIR laser would generate identical drug release kinetics per each irradiation. As shown in our other study, the amount of drug release from the MTX/Cy5 liposomes was linearly proportional to the number of laser irradiation cycles.10 When the degradation of the implant proceeds and the pore size of the polymer membrane increases, the drug release kinetics may change. In future studies, the effect of degradation on the drug release kinetics will be studied for long term (~6 months).
In vivo drug release was successfully shown via the implant’s fluorescence intensity changes (Figures 5 and 6). The mean gray values in the implant decreased, while the value in the vitreous increased after laser irradiation. The laser used in this study was a pulsed picosecond laser with 700 ps pulse duration, 10 kHz repetition frequency at 1064 nm wavelength at 1 W. Although our previous study has shown that drug was released by a single pulse of this laser,25 5 s was used per one spot to release physiologically relevant dose in this study. Our other previous study has also shown that in the longer laser duration, the more drug is released.26 For the safety of the retina, we calculated maximum permissible exposure based on the following equation.27
| (7) |
where for , is total irradiation duration, 0.385 cm2 is the area of 7 mm pupil, and is pulse repetition frequency. The calculation suggested that the laser intensity for 5 s at 1 W is 9 times higher than the maximum permissible exposure value with a focal length at 44 mm. Note that this power is calculated when the laser directly hits the retina, whereas the laser should be targeted to implants. In future studies, power as low as 100 mW will be used to avoid potential laser damage.
5. CONCLUSIONS
In this study, we successfully showed effective drug release from a nanoporous PLGA implant using pulsed NIR laser irradiation both in vitro and in vivo. We analyzed the drug release kinetics in vitro by fitting zero-order, first-order, KP, and Highchi models. We quantified multiple drug releases in the vitreous in vivo, which was consistent with the in vitro data. The dose released from the implant after the laser irradiation trigger was also clinically relevant. Histology and optical and ultrasound imaging data suggest that the drug delivery system was not toxic to the retina. This drug delivery system could be potentially used for long-term posterior eye disease treatment.
Supplementary Material
ACKNOWLEDGMENTS
This study was partially supported by Ohio Lions Eye Research Foundation, Office of Research at the University of Cincinnati, and NIH KL2 award (5KL2TR001426-04). The authors would like to thank Drs. Jonathon Nickels and Vesselin Shanov for equipment.
Footnotes
The authors declare no competing financial interest.
Complete contact information is available at: https://pubs.acs.org/10.1021/acsabm.0c01334
ASSOCIATED CONTENT
Supporting Information
The Supporting Information is available free of charge at https://pubs.acs.org/doi/10.1021/acsabm.0c01334.
Calibration curve of MTX concentration versus O.D. Fluorescent images of MTX/Cy5 coencapsulated implants and the calibration curve of the fluorescence intensity versus MTX dosage (PDF)
Contributor Information
Xingyu He, Department of Chemical & Environment Engineering, College of Engineering and Applied Science, University of Cincinnati, Cincinnati, Ohio 45221, United States.
Zheng Yuan, Department of Chemical & Environment Engineering, College of Engineering and Applied Science, University of Cincinnati, Cincinnati, Ohio 45221, United States.
Samantha Gaeke, Department of Chemical & Environment Engineering, College of Engineering and Applied Science, 45242, United States; University of Cincinnati, Cincinnati, Ohio 45221, United States.
Winston W.-Y. Kao, Department of Ophthalmology, College of Medicine, University of Cincinnati, Cincinnati, Ohio 45267, United States
S. Kevin Li, College of Pharmacy, University of Cincinnati, Cincinnati, Ohio 45229, United States.
Daniel Miller, Department of Ophthalmology, College of Medicine, University of Cincinnati, Cincinnati, Ohio 45267, United States; Cincinnati Eye Institute, Cincinnati, Ohio 45242, United States.
Basil Williams, Department of Ophthalmology, College of Medicine, University of Cincinnati, Cincinnati, Ohio 45267, United States; Cincinnati Children’s Hospital Medical Center, Cincinnati, Ohio 45229, United States.
Yoonjee C. Park, Department of Chemical & Environment Engineering, College of Engineering and Applied Science and Department of Ophthalmology, College of Medicine, University of Cincinnati, Cincinnati, Ohio 45221, United States
REFERENCES
- (1).Lee R; Wong TY; Sabanayagam C Epidemiology of diabetic retinopathy, diabetic macular edema and related vision loss. Eye Vision 2015, 2, No. 17. [DOI] [PMC free article] [PubMed] [Google Scholar]
- (2).Pennington KL; DeAngelis MM Epidemiology of age-related macular degeneration (AMD): associations with cardiovascular disease phenotypes and lipid factors. Eye Vision 2016, 3, No. 34. [DOI] [PMC free article] [PubMed] [Google Scholar]
- (3).He X; Yuan Z; Kao W; Miller D; Li SK; Park YC Size-Exclusive Nanoporous Biodegradable PLGA Capsules for Drug Delivery Implants and In Vivo Stability in the Posterior Segment. ACS Appl. Bio Mater. 2020, 3, 1722–1729. [DOI] [PubMed] [Google Scholar]
- (4).del Amo EM; Rimpelä A-K; Heikkinen E; Kari OK, Ramsay E; Lajunen T; Schmitt M; Pelkonen L; Bhattacharya M; Richardson D; Subrizi A; Turunen T; Reinisalo M; Itkonen J; Toropainen E; Casteleijn M; Kidron H; Antopolsky M; Vellonen K-S; Ruponen M; Urtti A Pharmacokinetic aspects of retinal drug delivery. Prog. Retinal Eye Res. 2017, 57, 134–185. [DOI] [PubMed] [Google Scholar]
- (5).Kane FE; Burdan J; Cutino A; Green KE Iluvien: a new sustained delivery technology for posterior eye disease. Expert Opin. Drug Delivery 2008, 5, 1039–1046. [DOI] [PubMed] [Google Scholar]
- (6).Bezatis A; Spital G; Höhn F; Maier M; Clemens CR; Wachtlin J; Lehmann F; Hattenbach LO; Feltgen N; Meyer CH Functional and anatomical results after a single intravitreal Ozurdex injection in retinal vein occlusion: a 6-month follow-up – The SOLO study. Acta Ophthalmol. 2013, 91, e340–e347. [DOI] [PubMed] [Google Scholar]
- (7).Haghjou N; Soheilian M; Abdekhodaie MJ Sustained release intraocular drug delivery devices for treatment of uveitis. J. Ophthalmic Vision Res. 2011, 6, 317–329. [PMC free article] [PubMed] [Google Scholar]
- (8).Allergan Inc., PrOzurdex (dexamethasone). 2019. https://allergan-web-cdn-prod.azureedge.net/allergancanadaspecialty/allergancanadaspecialty/media/actavis-canada-specialty/en/products/pms/9632x-2019aug21-en-ozurdex-0-7mg.pdf (accessed 2021-01-07).
- (9).Rathinam SR; Gonzales JA; Thundikandy R; Kanakath A; Murugan SB; Vedhanayaki R; Lim LL; Suhler EB; Al-Dhibi HA; Doan T; Keenan JD; Rao MM; Ebert CD; Nguyen HH; Kim E; Porco TC; Acharya NR Effect of Corticosteroid-Sparing Treatment With Mycophenolate Mofetil vs Methotrexate on Inflammation in Patients With Uveitis: A Randomized Clinical Trial. Jama 2019, 322, 936–945. [DOI] [PMC free article] [PubMed] [Google Scholar]
- (10).Zheng Y; Das S; Lazenby RA; White RJ; Park YC Repetitive Drug Releases from Light-Activatable Micron-sized Liposomes, 2020, submitted. [DOI] [PMC free article] [PubMed] [Google Scholar]
- (11).Korsmeyer RW; Peppas NA Effect of the morphology of hydrophilic polymeric matrices on the diffusion and release of water soluble drugs. J. Membr. Sci. 1981, 9, 211–227. [Google Scholar]
- (12).Peppas NA Analysis of Fickian and non-Fickian drug release from polymers. Pharm. Acta Helv. 1985, 60, 110–111. [PubMed] [Google Scholar]
- (13).Higuchi T Mechanism of sustained-action medication. Theoretical analysis of rate of release of solid drugs dispersed in solid matrices. J. Pharm. Sci. 1963, 52, 1145–1149. [DOI] [PubMed] [Google Scholar]
- (14).ThermoScientific, https://assets.thermofisher.com/TFS-Assets/MSD/Datasheets/Scios-2-Datasheet-Materials-Science.pdf (accessed Feb 18, 2020).
- (15).Thackaberry EA; Farman C; Zhong F; Lorget F; Staflin K; Cercillieux A; Miller PE; Schuetz C; Chang D; Famili A; et al. Evaluation of the toxicity of intravitreally injected PLGA microspheres and rods in monkeys and rabbits: effects of depot size on inflammatory response. Invest. Ophthalmol. Visual Sci. 2017, 58, 4274–4285. [DOI] [PubMed] [Google Scholar]
- (16).Schmitz-Valckenberg S; Guo L; Maass A; Cheung W; Vugler A; Moss SE; Munro PMG; Fitzke FW; Cordeiro MF Real-Time In Vivo Imaging of Retinal Cell Apoptosis after Laser Exposure. Invest. Ophthalmol. Visual Sci. 2008, 49, 2773–2780. [DOI] [PMC free article] [PubMed] [Google Scholar]
- (17).Shulman S; Belokopytov M; Dubinsky G; Belkin M; Rosner M Ameliorative effect of PN-277 on laser-induced retinal damage. Graefe’s Arch. Clin. Exp. Ophthalmol. 2009, 247, 343–348. [DOI] [PubMed] [Google Scholar]
- (18).Benner JD; Dao D; Butler JW; Hamill KI Intravitreal methotrexate for the treatment of proliferative vitreoretinopathy. BMJ Open Ophthalmol. 2019, 4, No. e000293. [DOI] [PMC free article] [PubMed] [Google Scholar]
- (19).Palakurthi NK; Krishnamoorthy M; Augsburger JJ; Correa ZM; Banerjee RK Investigation of kinetics of methotrexate for therapeutic treatment of intraocular lymphoma. Curr. Eye Res. 2010, 35, 1105–1115. [DOI] [PubMed] [Google Scholar]
- (20).Siepmann J; Siepmann F Modeling of diffusion controlled drug delivery. J. Controlled Release 2012, 161, 351–362. [DOI] [PubMed] [Google Scholar]
- (21).Saltzman WM; Langer R Transport rates of proteins in porous materials with known microgeometry. Biophys. J. 1989, 55, 163–171. [DOI] [PMC free article] [PubMed] [Google Scholar]
- (22).Siegel RA; Langer R Controlled release of polypeptides and other macromolecules. Pharm. Res. 1984, 1, 2–10. [DOI] [PubMed] [Google Scholar]
- (23).Miller ES; Peppas NA Diffusional Release of Water-Soluble Bioactive Agents from Ethylene-Vinyl Acetate Copolymers. Chem. Eng. Commun. 1983, 22, 303–315. [Google Scholar]
- (24).Rhine WD; Hsieh DST; Langer R Polymers for sustained macromolecule release: Procedures to fabricate reproducible delivery systems and control release kinetics. J. Pharm. Sci. 1980, 69, 265–270. [DOI] [PubMed] [Google Scholar]
- (25).Zhang Z; Taylor M; Kaval N; Park YC Phase-Transition Temperature of Gold-Nanorod-Coated Nanodroplets to Micro-bubbles by Pulsed Laser. J. Phys. Chem. A 2019, 123, 4844–4852. [DOI] [PubMed] [Google Scholar]
- (26).Das S; Lazenby RA; Yuan Z; White RJ; Park YC Effect of Laser Irradiation on Reversibility and Drug Release of Light-Activatable Drug-Encapsulated Liposomes. Langmuir 2020, 3573–3582. [DOI] [PubMed] [Google Scholar]
- (27).Delori FC; Webb RH; Sliney DH Maximum permissible exposures for ocular safety (ANSI 2000), with emphasis on ophthalmic devices. J. Opt. Soc. Am. A 2007, 24, 1250–1265. [DOI] [PubMed] [Google Scholar]
Associated Data
This section collects any data citations, data availability statements, or supplementary materials included in this article.