

Summary
Advanced prostate cancers are treated with therapies targeting the androgen receptor (AR) signaling pathway. While many tumors initially respond to AR inhibition, nearly all develop resistance. It is critical to understand how prostate tumor cells respond to AR inhibition in order to exploit therapy-induced phenotypes prior to the outgrowth of treatment-resistant disease. Here, we comprehensively characterize the effect of AR blockade on prostate cancer metabolism using transcriptomics, metabolomics and bioenergetics approaches. The metabolic response to AR inhibition is defined by reduced glycolysis, robust elongation of mitochondria, and increased reliance on mitochondrial oxidative metabolism. We establish DRP1 activity and MYC signaling as mediators of AR blockade-induced metabolic phenotypes. Rescuing DRP1 phosphorylation after AR inhibition restores mitochondrial fission, while rescuing MYC restores glycolytic activity and prevents sensitivity to complex I inhibition. Our study provides new insight into the regulation of treatment-induced metabolic phenotypes and vulnerabilities in prostate cancer.
Graphical Abstract

Introduction
Prostate cancer is the leading cause of cancer-related death in non-smoking males in the United States1. Prostate cancer progression from localized to advanced metastatic disease is driven by aberrant androgen receptor (AR) activity. Therefore, patients with metastatic prostate cancer are treated with androgen deprivation therapy (ADT) to dampen AR activity2. While many advanced tumors initially respond to ADT, nearly all tumors recur as castration-resistant prostate cancer (CRPC)3. CRPC is treated with androgen-receptor pathway inhibitors (ARPIs) including Enzalutamide4 because AR activation remains critical for tumor cell growth and survival. Enzalutamide treatment induces significant declines in prostate-specific antigen (PSA) levels and radiographic responses in the majority of CRPC patients5,6. Unfortunately, prolonged ARPI treatment invariably results in disease progression, ultimately causing lethality7. New approaches are needed to understand how prostate cancer cells initially respond to AR targeted therapies prior to relapse in order to exploit treatment-induced vulnerabilities and prevent or delay disease progression.
Metabolic requirements and vulnerabilities evolve during cancer progression8 and several studies suggest that metabolic pathways can be targeted in prostate cancer to impair tumor growth9–16. Short-term AR blockade (24–96 hours) increases reliance on electron transport chain complex I activity and glutaminase activity17. However, the mechanisms that govern AR inhibition-induced metabolic rewiring have not been clearly defined. In this study, we comprehensively characterize how prostate cancer cells that survive AR blockade reprogram their metabolism. We use in vitro and in vivo models as well as clinical datasets to demonstrate that cells surviving AR blockade maintain oxidative phosphorylation and exhibit reduced glycolysis, resulting in increased reliance on oxidative mitochondrial metabolism. We establish phosphorylation of DRP1-S616 as a key regulator of altered mitochondrial dynamics following AR blockade. Furthermore, MYC signaling is reduced following AR blockade and over expression of MYC restores glycolytic activity and glutamine metabolism. Finally, rescuing MYC is sufficient to reverse sensitivity to complex I inhibitors after AR inhibition. Taken together, our data suggest that AR blockade reprograms cellular metabolism and increases dependence on oxidative mitochondrial metabolism through reduced MYC.
Results
Transcriptomic and metabolomic profiling reveal AR inhibition-induced metabolic reprogramming
To gain insight into how prostate cancer cells survive AR inhibition, we evaluated which pathways are altered after clinical AR blockade using the Rajan et al. dataset18, which contains transcriptomics data from seven patient tumors collected prior to and after androgen deprivation therapy (ADT). 10 of the top 30 significantly altered pathways were metabolism-related (Figure 1A, Supplementary Table 1). To model transcriptional responses to AR inhibition in a system that is better suited for broad metabolic characterization, we treated the 16D CRPC cell line19 with 10μM Enzalutamide for 48 hours, termed STenza (Short-Term), or up to two months, termed LTenza (Long-Term Enzalutamide-treatment). Both STenza and LTenza 16D cells contained increased expression of genes upregulated post-ADT in the Rajan et al. clinical dataset, with LTenza cells containing the highest expression of such genes (Supplementary Figure 1A). Principal component projection analysis revealed that naïve (vehicle-treated) 16D cells cluster with pre-ADT clinical samples, whereas LTenza 16D cells cluster with post-ADT samples from the Rajan et al. dataset18 (Figure 1B). Gene Set Enrichment Analysis (GSEA) identified negative enrichment of Hallmark_androgen_response genes in LTenza 16D cells (Supplementary Figure 1B), validating AR inhibition. Furthermore, cell cycle analysis illustrated that LTenza 16D cells are still sensitive to Enzalutamide treatment (Supplementary Figure 1C). KEGG PATHWAY analysis on the differentially expressed genes (Supplementary Figure 1D) identified 12 metabolism-related pathways among the top 30 significantly altered pathways (Figure 1C, Supplementary Table 2). Taken together, these data provide strong evidence that (1) AR inhibition modulates metabolic gene expression, and (2) Enzalutamide treatment of 16D cells models transcriptional responses to clinical AR blockade.
Figure 1. Transcriptomic and metabolic profiling identify AR inhibition-induced metabolic reprogramming.

(A) Top 30 significantly enriched pathways identified by KEGG PATHWAY analysis on differentially expressed (fold change ≥ 2, FDR < 0.2) Rajan et al. pre-androgen deprivation therapy (Pre-ADT) and post-androgen deprivation therapy (Post-ADT) genes. Metabolism-related pathways highlighted in red. Also see Supplementary Table 1. (B) Naïve, 24hr Enzalutamide-treated (Enza), 48hr Enza, and LTenza 16D transcriptomics data projected onto principle component analysis (PCA) plot of pre-androgen deprivation therapy (pre-ADT) and post-ADT samples from Rajan et al. data. (C) Top 30 significantly enriched pathways identified by KEGG PATHWAY analysis on differentially expressed genes (fold change ≥ 2, FDR < 0.05) in naïve and LTenza 16D cells. Metabolism-related pathways highlighted in red. Also see Supplementary Table 2. (D) Heatmap of differentially abundant metabolites (fold change ≥ 1.25, FDR < 0.2) in 1-week enzalutamide-treated 16D tumors compared to vehicle-treated 16D tumors. (E-F) PCA of U13C-glucose (E) or U13C-glutamine (F) fractional contribution data from 16D cells treated with vehicle, 10μM Enzalutamide, 10μM Apalutamide, or 0.5μM ARCC-4 for nine days prior to addition of U13C-glucose or U13C-glutamine for 24 hours. (G) Venn diagram illustrating overlap in metabolites with increased abundance (fold change ≥ 1.5) in Enzalutamide-, Apalutamide-, or ARCC-4-treated 16D cells relative to vehicle-treated 16D cells. (H) Heatmap of metabolite abundances in 16D cells treated with vehicle, 10μM Enzalutamide, 10μM Apalutamide, or 0.5μM ARCC-4 for nine days.
Having identified transcriptional evidence of AR blockade-induced metabolic reprogramming, we asked whether Enzalutamide treatment of 16D cells alters the metabolome. NOD SCID IL2Rγnull (NSG) mice bearing subcutaneous 16D tumors were treated with vehicle or Enzalutamide for 10 days prior to tumor harvest, metabolite extraction, and metabolic profiling. Enzalutamide-treated tumors exhibited reduced protein expression of PSA, an AR target, and increased expression of NSE, which is repressed by AR, confirming AR inhibition in vivo (Supplementary Figure 1E). Metabolomic profiling of vehicle- and Enzalutamide-treated tumors identified 47 Enzalutamide-increased and 10 Enzalutamide-decreased metabolites (Figure 1D). After performing metabolic profiling on in vitro naïve and LTenza 16D cells, we found that metabolic profiles group based on treatment, as naïve 16D cells cluster with vehicle-treated 16D tumors, whereas LTenza 16D cells cluster with Enzalutamide-treated 16D tumors (Supplementary Figure 1F). In addition, we observed a higher abundance of in vivo Enzalutamide-enriched metabolites in LTenza 16D cells compared to naïve 16D cells (Supplementary Figure 1G).
To identify metabolic pathways commonly altered in vivo and in vitro, we performed Metabolite Set Enrichment Analysis (MSEA) on the Enzalutamide-increased metabolites from each dataset. Among the commonly enriched KEGG pathways were terms related to purine, lipid, and glutamine metabolism (Supplementary Figure 1H). We explored how Enzalutamide treatment alters lipid metabolism and found that there is a significant reduction in lipid droplet content within 96 hours of beginning Enzalutamide treatment (Supplementary Figures 1I–K). Furthermore, lipid droplets begin to accumulate upon removal of Enzalutamide (Supplementary Figure 1L).
To evaluate how various methods of AR inhibition alter metabolism, we performed U13C-glucose tracing, U13C-glutamine tracing, and metabolic profiling on 16D cells treated with two AR pathway inhibitors (10μM Enzalutamide and 10μM Apalutamide) and an AR degrader (0.5μM ARCC-4). Cells treated with Enzalutamide or Apalutamide exhibit decreased expression of PSA while cells treated with ARCC-4 have decreased expression of AR and PSA (Supplementary Figure 1M). Principal component analysis of fractional contribution illustrates that Enzalutamide, Apalutamide, and ARCC-4 similarly alter glucose and glutamine utilization (Figures 1E–F). Furthermore, changes to metabolite abundance were highly consistent across treatments (Figures 1G–H, Supplementary Figure 1N). MSEA revealed that commonly enriched pathways include aminoacyl-tRNA biosynthesis, pyrimidine/purine metabolism, and valine/leucine/isoleucine synthesis (Supplementary Figure 1O). Collectively, these data demonstrate that Enzalutamide, Apalutamide, and ARCC-4 have consistent effects on the metabolome.
AR blockade maintains oxidative phosphorylation and reduces glycolysis
Having identified AR inhibition-induced changes to the metabolome, we explored whether Enzalutamide treatment alters bioenergetics by measuring oxygen consumption rate (OCR) and extracellular acidification rate (ECAR) in naïve and Enzalutamide-maintained 16D cells20,21 (Figures 2A–B). Although Enzalutamide treatment did not significantly alter ATP-linked respiration (Figures 2A, 2C), carbonyl cyanide 4-(trifluoromethoxy)phenylhydrazone (FCCP)-stimulated respiration was increased in Enzalutamide-treated cells (Figures 2A, 2D), demonstrating an enhanced maximal capacity for oxidative mitochondrial metabolism. We then transformed rates of OCR and ECAR into rates of mitochondrial and glycolytic ATP production to quantify the redistribution between oxidative phosphorylation and glycolysis22. The mitochondrial ATP production rate was not altered in Enzalutamide-treated 16D cells (Figures 2A, 2E), whereas the glycolytic ATP production rate was reduced (Figures 2B, 2F). As such, the total ATP production rate in Enzalutamide-treated 16D cells was reduced (Figure 2G), and oxidative phosphorylation comprised a greater percentage of the overall ATP supply (Figure 2H). Consistent with dampened glycolysis, lower steady-state lactate was observed in Enzalutamide-treated 16D cells (Figure 2I). Our data support a model whereby AR inhibition leads to reduced glycolysis but maintenance of oxidative mitochondrial metabolism.
Figure 2. AR blockade maintains oxidative mitochondrial metabolism and reduces glycolysis.

(A and B) Representative kinetic trace plots of the Oxygen Consumption Rate (OCR) (A) and Extracellular Acidification Rate (ECAR) (B) of naïve and LTenza 16D cells. Treatment with Oligomycin (O), FCCP (F), Rotenone and Antimycin A (R/A) are indicated with arrows. Data represent mean +/− SEM. (C and D) ATP-linked respiration (C) and maximal respiration (D) of naïve and LTenza 16D cells from 10 biological replicate experiments. (E and F) Mitochondrial (Mito) ATP production (E) and glycolytic ATP production (F) of naïve and LTenza 16D cells from 10 biological replicate experiments. (G) Total ATP production as the sum of mitochondrial ATP production (Mito ATP) and glycolytic ATP production (Glyco ATP) of naïve and LTenza 16D cells from 10 biological replicate experiments. Statistics refer to comparison of total ATP levels. Data represent mean + SEM. (H) Percentage of total ATP production from mitochondrial ATP production (% ATP from Mito) of naïve and LTenza 16D cells from 10 biological replicate experiments. (I) Lactate abundance in naïve and LTenza 16D cells from 3 biological replicate experiments. P-values were calculated from a ratio paired t-test. *p < 0.05, **p < 0.01, ****p < 0.0001, n.s. = not significant, p ≥ 0.05.
AR inhibition enhances sensitivity to complex I inhibitors
As Enzalutamide-treated 16D cells generate a greater proportion of ATP from oxidative mitochondrial metabolism, we hypothesized that these cells may be increasingly sensitive to inhibition of oxidative phosphorylation. To test our hypothesis, we cultured naïve and Enzalutamide-treated 16D cells with the highly-specific complex I inhibitor IACS-01075923 (IACS). Respirometry and U13C-glucose tracer analysis were performed to validate the on-target effect of IACS. IACS reduced the ATP-linked respiration of naïve and Enzalutamide-treated 16D cells by roughly 95 percent (Figure 3A) and significantly reduced M+2 labeling of TCA cycle intermediates from U13C-glucose in both groups (Supplementary Figures 2A–B). Increased M+3-labeled lactate was observed in both naïve and Enzalutamide-treated 16D cells after IACS treatment indicating that both cell types compensate for reduced complex I activity by increasing glycolysis (Supplementary Figure 2C). Respirometry revealed that while both naïve and Enzalutamide-treated 16D cells increase glycolytic ATP production in response to IACS, naïve cells contain a 2-fold higher IACS-induced glycolytic ATP production rate compared to Enzalutamide-treated 16D cells (Supplementary Figure 2D). Accordingly, IACS treatment reduced the total ATP production of naïve cells by just 12% compared to a 29% reduction of total ATP production in Enzalutamide-treated 16D cells (Supplementary Figure 2E).
Figure 3. AR blockade enhances sensitivity to complex I inhibition.

(A) ATP-linked respiration of naïve and LTenza 16D cells treated with vehicle (DMSO) or 30nM IACS-010759 (IACS) for 24 hrs. Data represent the mean +/− SEM of 5 technical replicates. (B) Cell cycle analysis to quantify the relative sensitivity of naïve and LTenza 16D cells to 30nM IACS. Data represent the mean +/− SEM of 4 technical replicates from a representative experiment (n=3). (C) Apoptosis analysis to identify the percentage of Annexin V-positive cells (% Annexin V+) in naïve and LTenza 16D cells treated with DMSO or 30nM IACS for 48 hours. Data represent the mean +/− SEM of 8 technical replicates. (D) Cell cycle analysis to quantify the relative sensitivity of 16D cells treated with 10μM Enzalutamide, 10μM Apalutamide, or 0.1μM ARCC-4 to 30nM IACS. Data represent the mean +/− SEM of 3 technical replicates. (E) Waterfall plot indicating the ex vivo sensitivity of 180–30 PDX tumor tissue from veh- and 1w Enza-treated tumors to 30nM IACS. Data represent the percent change in EdU positivity (% change EdU+) relative to the respective vehicle. (F-G) Cell cycle analysis of the sensitivity of vehicle-treated (F) or Enza-treated (G) 180–30 PDX tumor tissue to ex vivo culture +/− 30nM IACS. Data represent the mean +/− SEM of 5 tumor samples per treatment group. (H) Immunohistochemical analysis of representative 173–2 PDX tumors grown in intact or castrated mice and treated −/+ 7.5 mg/kg/day IACS for five days stained for Ki67. Scale bars, 50 μm. (I) Quantification of Ki67 staining area from six representative images of 173–2 PDX tumors grown in intact or castrated mice and treated −/+ 7.5 mg/kg/day IACS for five days. P-values were calculated from an unpaired t-test with Welch’s correction (A-D) and a ratio paired t-test (F and G). *p < 0.05, **p < 0.01, ****p < 0.0001, n.s. = not significant, p ≥ 0.05.
We performed cell cycle analysis (Supplementary Figure 2F) to determine the effect of IACS on proliferation. Whereas IACS treatment did not reduce the proliferation of naïve cells, IACS reduced the proliferation of Enzalutamide-treated 16D cells by roughly 35 percent in just 72 hours (Figure 3B). IACS treatment significantly increased apoptosis in Enzalutamide-treated cells after 72 hours (Figure 3C). Furthermore, 16D cells treated with Apalutamide or ARCC-4 also exhibit enhanced sensitivity to IACS (Figure 3D). Since AR blockade increases sensitivity to complex I inhibition, we wondered if IACS treatment of naïve 16D cells might increase Enzalutamide sensitivity. IACS pretreatment significantly enhanced Enzalutamide sensitivity, effectively doubling the growth inhibition caused by Enzalutamide (Supplementary Figure 2G).
The clinically viable drug Metformin, which has complex I inhibitor activity in vitro24, reduced ATP-linked respiration in Metformin-treated 16D cells (Supplementary Figure 2H). Unlike IACS, Metformin alone was sufficient to impair the proliferation of naïve 16D cells (Supplementary Figure 2I). Reduced proliferation in metformin-treated 16D cells was likely caused by known off-target effects24 as IACS treatment reduced ATP-linked respiration by greater than 95% without altering EdU labeling. Consistent with IACS pretreatment increasing responsiveness to AR inhibition, Metformin pretreatment significantly enhanced the sensitivity of naïve 16D cells to Enzalutamide (Supplementary Figure 2J).
To better understand the interaction between AR inhibition and complex I inhibition across various disease states, we explored whether Metformin similarly enhances the sensitivity of LNCaP cells to deprivation of the AR ligand, dihydrotestosterone (DHT). We first confirmed that LNCaP cells grown without DHT transcriptionally resemble patient tumors post-ADT18 (Supplementary Figures 3A–C). Consistent with our findings in the 16D model, Metformin treatment reduced the growth of LNCaP cells and significantly increased DHT deprivation sensitivity, from roughly 45 percent to greater than 85 percent (Supplementary Figures 3D–E).
After showing that various complex I inhibitors can synergize with AR blockade in vitro, we explored whether Enzalutamide treatment of mice bearing PDX tumors enhances IACS sensitivity. We utilized an AR-positive patient-derived xenograft (PDX) model originating from a patient with localized CRPC, termed MDA-PCa 180–3025. Week-long Enzalutamide-treated 180–30 PDX tumors exhibited reduced protein expression of PSA (Supplementary Figures 3F–G). After treatment with vehicle or Enzalutamide in vivo, we evaluated the effect of Enzalutamide on proliferation and response to complex I inhibition. Cell cycle analysis after ex vivo culture of tumor tissue in prostate organoid conditions confirmed reduced proliferation in Enzalutamide-treated 180–30 PDX tumors (Supplementary Figure 3H). Analysis of IACS sensitivity revealed that Enzalutamide-treated samples accounted for 4 of the 5 most IACS-sensitive samples (Figure 3E). Furthermore, whereas IACS did not alter the growth of vehicle-treated tumor cells in a statistically significant manner (Figure 3F), IACS significantly reduced proliferation of Enzalutamide-treated cells (Figure 3G). In addition, we used the MDA-PCa 173–2 PDX model, which originates from a patient with localized treatment-naïve prostate cancer, to determine if complex I inhibition further decreases the growth of castrated tumors in vivo. Ki67 staining of tumor sections revealed that while IACS treatment decreases the growth of 173–2 PDX tumors in intact mice, the combination of castration and IACS treatment almost completely abolishes proliferation (Figures 3H–I). 173–2 PDX tumors grown in intact mice exhibit a 53% reduction in proliferation in response to IACS whereas 173–2 PDX tumors grown in castrated mice exhibit an 80% reduction in proliferation in response to IACS (Supplementary Figure 3I). Collectively, these data suggest that AR inhibition and complex I inhibition can cooperate to decrease growth across disease states.
Enzalutamide induces mitochondrial elongation via reduced DRP1 activity
As mitochondrial dynamics can change in response to cellular and environmental stresses26, we explored the effect of AR inhibition on mitochondrial morphology. Mitochondria were visualized by staining for the mitochondria-associated protein Tu Translation Elongation Factor (TUFM). Immunofluorescence identified robustly elongated mitochondria in Enzalutamide-treated 16D cells (Figure 4A). Quantification of mitochondrial elongation and branching was performed by calculating the mitochondrial aspect ratio, which is equal to the ratio of the major axis to the minor axis of an object, and form factor, a value that compensates for irregularity in the shape of an object, respectively27 (Figure 4B). Enzalutamide-treated 16D cell mitochondria exhibited a higher aspect ratio (Figure 4C) and lower form factor (Figure 4D) compared to naïve cell mitochondria, consistent with mitochondrial elongation and increased branching. Eccentricity, the ratio of the distance between the foci of an ellipse and its major axis length, was elevated in mitochondria from Enzalutamide-treated 16D cells, confirming mitochondrial elongation (Supplementary Figure 4A). Enzalutamide treatment did not alter mitochondrial size, subtly increased mitochondrial count, and did not alter mitochondrial volume (Supplementary Figures 4B–D).
Figure 4. AR blockade elongates mitochondria via reduced DRP1 activity.

(A) Representative immunofluorescent images of naïve and LTenza 16D cells stained for TUFM (green) and DAPI (blue). Scale bars, 5 μm. (B) Schematic illustrating calculation of aspect ratio and form factor. (C and D) Quantification of mitochondrial aspect ratio (C) and mitochondrial form factor (D) from TUFM stains from 20 images per treatment group. Data represent the mean +/− SEM. (E and F) Western blots detecting DRP1 phosphorylation at S616 (DRP1-P616), DRP1, PSA, and Actin (loading control) in 16D cells treated with vehicle, 10μM Enzalutamide, 10μM Apalutamide, or 0.5μM ARCC-4 for nine days (E), and 183-A PDX organoids treated with vehicle or 10μM Enzalutamide for one week (F). (G) Representative immunofluorescent images of RFP- and DRP1S616E-transduced LTenza 16D cells stained for TUFM (green) and DAPI (blue). Scale bars, 10μm. (H) Quantification of mitochondrial aspect ratio from TUFM stains from at least 28 cells per treatment group. Data represent the mean +/− SEM. (I) Western blot indicating expression of DRP1-P616, DRP1, NSE, PSA, and Actin (loading control) in RFP- and DRP1S616E-transduced 16D cells maintained +/− 10μM Enzalutamide for 1 week. (J) Cell cycle analysis to quantify the relative sensitivity of RFP- and DRP1S616E-transduced 16D cells maintained in 10μM Enzalutamide for 1 week to 30nM IACS. Data represent the mean +/− SEM of 4 technical replicates from a representative experiment (n=2). P-values were calculated from an unpaired t-test with Welch’s correction. *p < 0.05, **p < 0.01, ***p < 0.001, ****p < 0.0001, n.s. = not significant, p ≥ 0.05.
Mitochondrial morphology is determined by the relative amounts of mitochondrial fission and fusion28. Several reports provide evidence that AR may regulate expression of DRP129, encoded by the DNM1L gene, which mediates mitochondrial fission. Analysis of LNCaP and 16D AR ChIP-seq data30 revealed binding to the DNM1L locus (Supplementary Figure 4E). We therefore explored whether DRP1 levels are altered in 16D cells treated with various AR inhibitors. Surprisingly, DRP1 expression was only subtly reduced in Enzalutamide-, Apalutamide-, and ARCC-4-treated 16D cells (Figure 4E). We evaluated DRP1 phosphorylation at S616, which mediates DRP1 activity31, and found a dramatic reduction in Enzalutamide-, Apalutamide-, and ARCC-4-treated 16D cells (Figure 4E) and in Enzalutamide-treated LAPC4 cells (Supplementary Figure 4F). When Enzalutamide was removed from Enzalutamide-maintained 16D cells for ten days, DRP1-S616 phosphorylation returned to levels present in naïve cells (Supplementary Figure 4G). In addition, in organoids derived from the MDA-PCa 183-A PDX model, which originates from a patient with metastatic treatment-naïve prostate cancer, Enzalutamide treatment results in decreased DRP1-S616 expression (Figure 4F). Enzalutamide-treated 16D tumors (Supplementary Figures 4H–I), 180–30 PDX tumors (Supplementary Figure 4J), and 173–2 PDX tumors (Supplementary Figures 4K–L) contained both reduced total DRP1 expression and reduced DRP1-S616 phosphorylation, suggesting that the tumor microenvironment may influence the response of DRP1 expression to AR blockade. Interestingly, Enzalutamide-resistant AR+ 22Rv1 cells did not exhibit reduced DRP1-S616 expression in response to Enzalutamide treatment (Supplementary Figure 4M).
To evaluate the functional role of DRP1, we ectopically expressed RFP or a constitutively active DRP1 phosphomimetic31 DRP1S616E, in Enzalutamide-maintained 16D cells (Supplementary Figure 4M). Expression of DRP1S616E was sufficient to reduce mitochondrial elongation and increase mitochondrial fission (Figures 4G–H). We evaluated IACS sensitivity using cell cycle analysis and found that constitutive expression of DRP1 partially rescues Enzalutamide-induced IACS sensitivity (Figures 4I–J). These data suggest that changes in mitochondrial morphology following AR blockade functionally contribute to metabolic dependencies.
Reduced glycolytic enzyme expression in cells that survive AR inhibition
We wondered what mechanisms induced by AR blockade may contribute to the reduction in glycolysis. Transcriptomic analysis identified a trend toward downregulation of glycolytic genes in Enzalutamide-treated 16D cells, including Hexokinase 2 (HK2) and Lactate Dehydrogenase A (LDHA) (Figure 5A). Western blot analysis confirmed reduced protein expression of HK2 and LDHA in Enzalutamide-, Apalutamide-, and ARCC-4-treated 16D cells (Figure 5B) and LAPC4 cells (Supplementary Figure 4E), but not in Enzalutamide-resistant AR+ 22Rv1 cells (Supplementary Figure 4L). Upon removal of Enzalutamide, HK2 and LDHA abundance increased in 16D cells (Supplementary Figure 4G). In addition, HK2 and LDHA were reduced in Enzalutamide-treated 16D tumors, Enzalutamide-treated 180–30 PDX tumors, and 173–2 PDX tumors grown in castrated mice (Figures 5C–D, Supplementary Figures 4J–K, Supplementary Figure 5A). In LNCaP cells, glycolytic enzyme expression was similarly reduced as a result of Enzalutamide treatment or DHT deprivation (Figure 5E, Supplementary Figure 5B). We also analyzed glycolytic enzyme expression in four clinical transcriptomic datasets: the Rajan et al. dataset18 (seven locally advanced or metastatic prostate cancer tumors biopsied before and after ADT, Supplementary Figure 5C), the Reiter et al. dataset (seven tumor-rich prostatic biopsies collected prior to and after ADT and Enzalutamide treatment, Supplementary Figure 5D), the Long et al. dataset32 (six tumor-rich prostatic biopsies collected prior to and after ADT and Bicalutamide treatment, Supplementary Figure 5E), and the Wilkinson et al. dataset33 (36 prostatic biopsies collected prior to and after ADT and Enzalutamide treatment, Supplementary Figure 5F). We found that SLC16A1 was reduced in all datasets after AR inhibition, while ENO1 and TPI1 were reduced in three of the four datasets (Supplementary Figures 5C–F). In the Rajan et al. and Reiter et al. datasets18, HK2 mRNA expression was reduced after AR blockade in all patients (Figure 5F–G). These data suggest that AR inhibition lowers expression of key glycolytic enzymes across various AR inhibition-responsive disease states.
Figure 5. Downregulation of key glycolytic enzymes following AR inhibition.
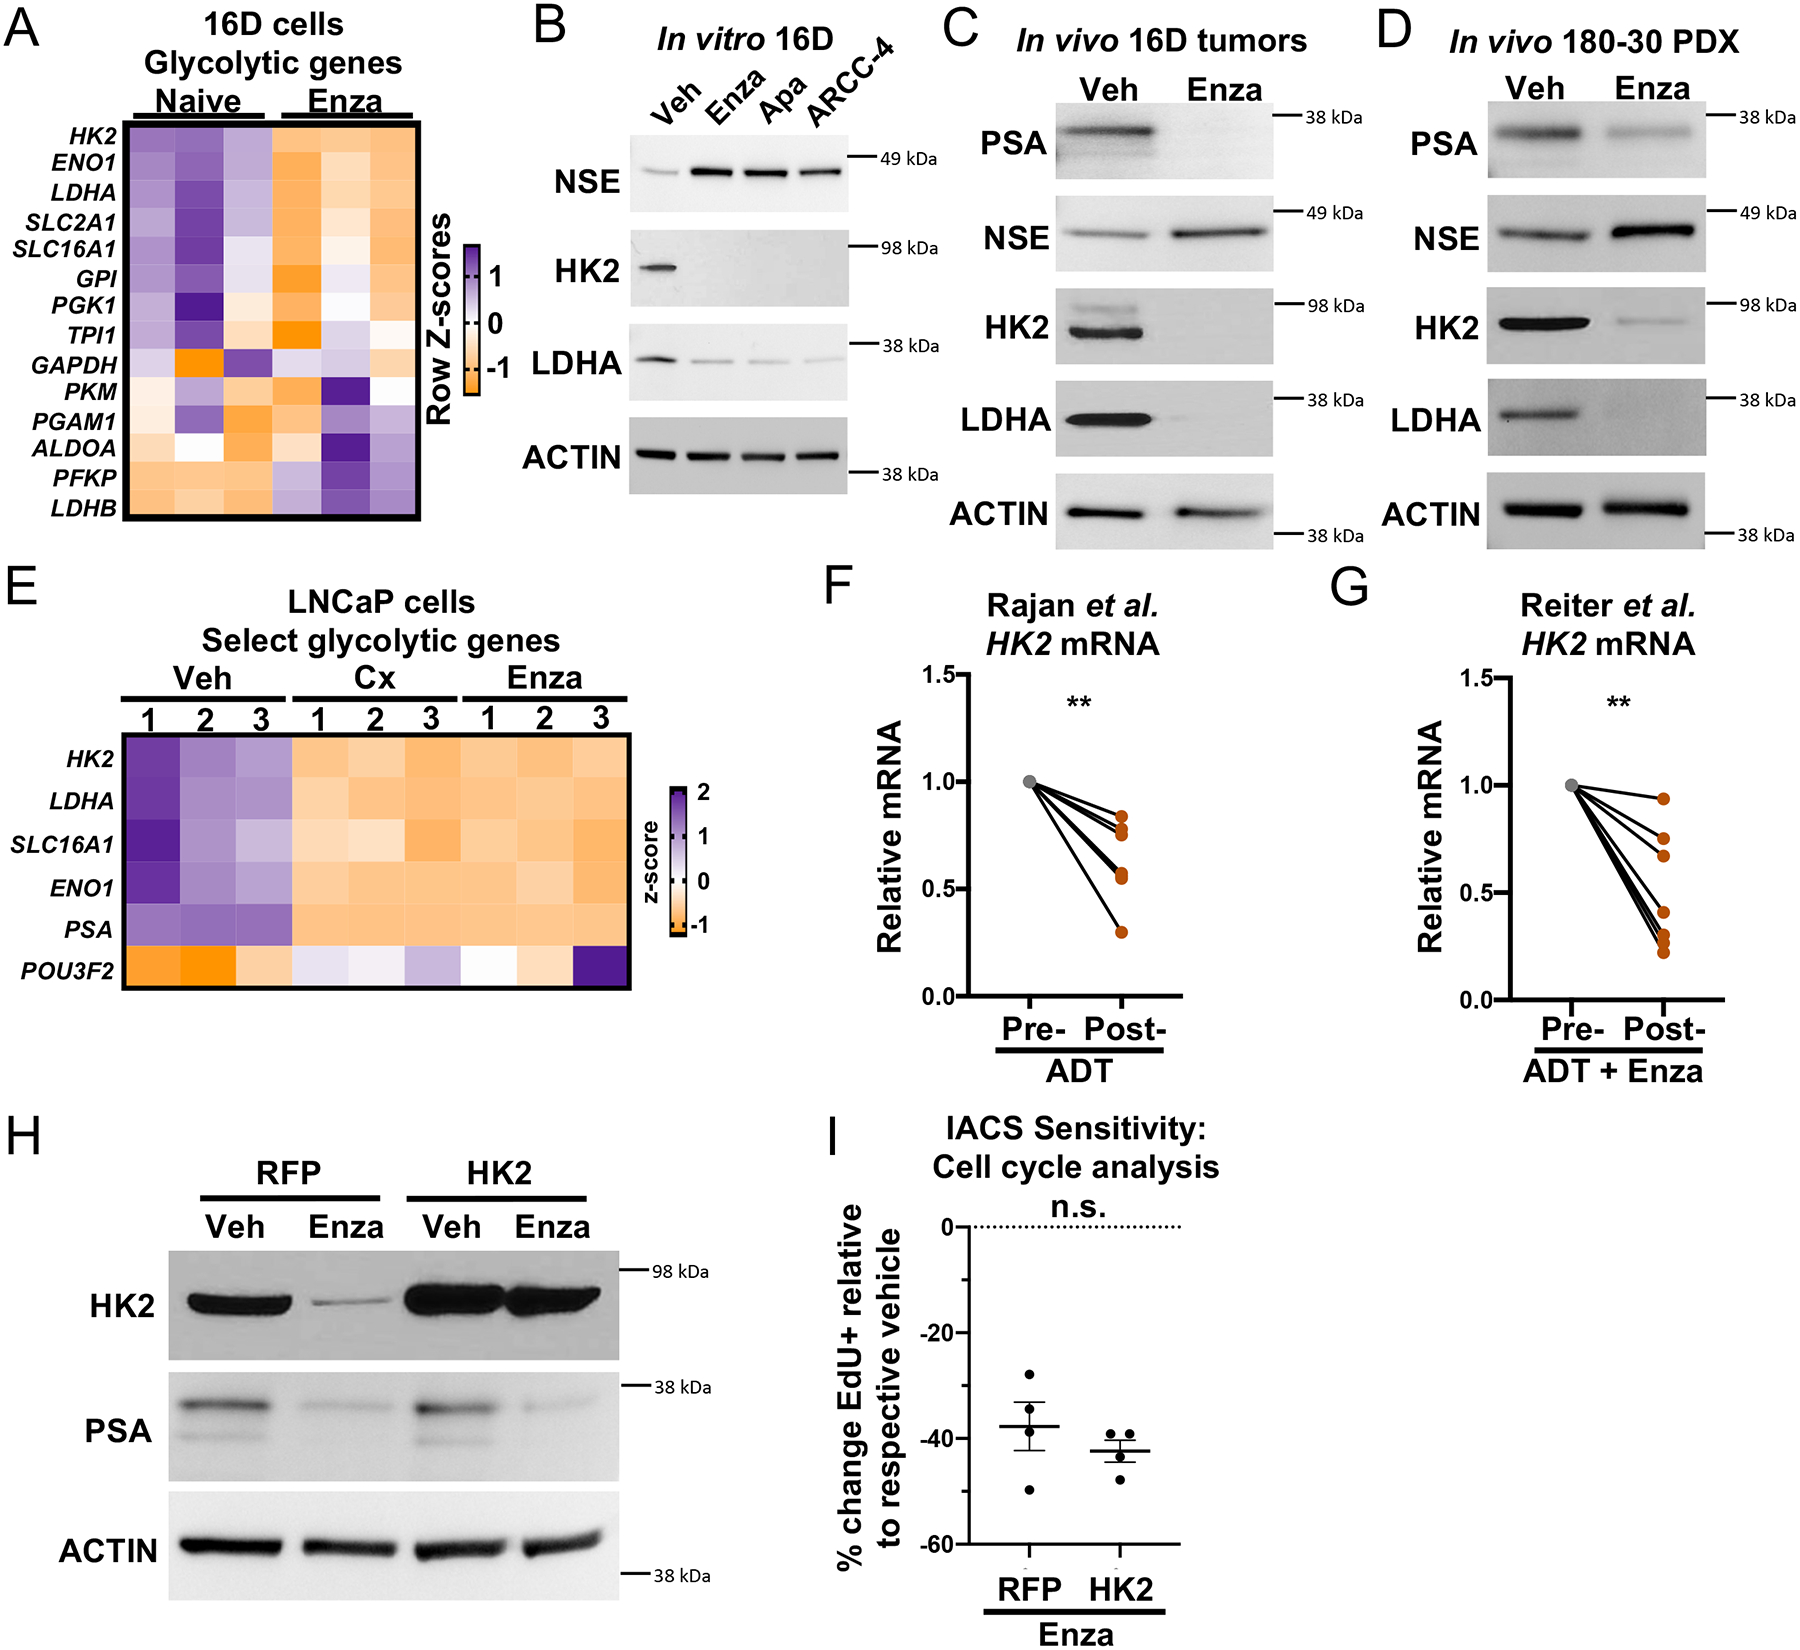
(A) Heatmap showing the mRNA expression of glycolytic genes from RNA sequencing of 3 technical replicates of naïve and LTenza 16D cells. (B-D) Western blots indicating the expression of PSA, NSE, HK2, LDHA, and Actin (loading control) in lysates from 16D cells treated with vehicle, 10μM Enzalutamide, 10μM Apalutamide, or 0.5μM ARCC-4 for nine days (B), 16D tumors treated with vehicle (veh) or Enzalutamide (Enza) for one week in vivo (C), and 180–30 PDX tumors treated with vehicle (veh) or Enzalutamide (Enza) for one week in vivo (D). (E) Heatmap showing the mRNA expression of select glycolytic genes from RNA sequencing of 3 technical replicates of veh, 72-hour castrated (Cx), and 72-hour Enzalutamide-treated (Enza) LNCaP cells. (F-G) HK2 mRNA expression in matched pre- and post-AR blockade biopsies from the Rajan et al. (F) and Reiter et al. (G) datasets. (H) Western blot indicating expression of HK2, PSA, and Actin (loading control) in RFP- and HK2-transduced 16D cells maintained +/− 10μM Enzalutamide for 1 week. (I) Cell cycle analysis to quantify the relative sensitivity of RFP- and HK2-transduced 16D cells maintained in 10μM Enzalutamide for 1 week to 30nM IACS. Data represent the mean +/− SEM of 4 technical replicates from a representative experiment (n=2). P-values were calculated from a ratio paired t-test (F and G) and an unpaired t-test with Welch’s correction (I). **p < 0.01, ***p < 0.001, n.s. = not significant, p ≥ 0.05.
Reduced MYC signaling regulates AR inhibition-induced metabolic phenotypes
We hypothesized that downregulation of HK2 following AR inhibition may mediate reduced glycolytic activity and sensitivity to complex I inhibition. Cells with HK2 overexpression maintained high levels of HK2 even in the presence of Enzalutamide (Figure 5H) but still exhibit significant sensitivity to complex I inhibition (Figure 5I). These data suggest that expression of HK2 does not mediate sensitivity to complex I inhibition following AR inhibition. Since several glycolytic enzymes and transporters are downregulated after AR inhibition, we investigated whether AR blockade alters transcriptional signatures of MYC, a key regulator of glycolysis34 and an AR target gene35. GSEA revealed negative enrichment of Hallmark_Myc_targets in the Rajan et al., Reiter et al., Long et al., and Wilkinson et al. patient samples after AR blockade (Figure 6A, Supplementary Figures 6A–C). In addition, negative enrichment of Hallmark_Myc_targets was observed after castration in the AR-positive LTL331 PDX model36 (Figure 6B). Consistent with these data, Hallmark_Myc_targets is negatively enriched in Enzalutamide-treated 16D cells (Figure 6C) and in LNCaP cells deprived of DHT (Supplementary Figure 6D).
Figure 6. Decreased Myc signaling following AR inhibition mediates complex I inhibition sensitivity.

(A-D) GSEA of Hallmark_Myc_targets in Rajan et al. pre-ADT and post-ADT samples (A), Akamatsu et al. pre-castration (pre-cx) and 12 weeks post castration (post-cx) (B), naïve and LTenza 16D cells (C), and RFP- and MYC-transduced LTenza cells (D) showing normalized enrichment scores (NES) and false discovery rates (FDR). (E) Western blot indicating expression of MYC, HK2, LDHA, PSA, and Actin (loading control) in naïve, RFP-transduced LTenza, and MYC-transduced LTenza 16D lysates. (F) Cell cycle analysis to quantify the relative sensitivity of naïve and RFP- and MYC-transduced LTenza 16D cells to 30nM IACS. Data represent the mean +/− SEM of 4 technical replicates from a representative experiment (n=3). (G) mRNA expression of RB1 and TP53 in naïve, shScr-transduced (shScr) LTenza, and shRB1_shTP53-transduced (DKD) LTenza 16D cells. Data represent the mean +/− SEM of 3 technical replicates. (H) GSEA of Hallmark_Myc_targets in naïve and DKD LTenza cells. (I) Cell cycle analysis to quantify the relative sensitivity of naïve and DKD LTenza 16D cells to 30nM IACS. Data represent the mean +/− SEM of 4 technical replicates from a representative experiment (n=2). P-values were calculated from an unpaired t-test with Welch’s correction. *p < 0.05, **p < 0.01, ****p < 0.0001, n.s. = not significant, p ≥ 0.05.
To determine whether reduced MYC activity mediates reduced glycolytic enzyme expression in AR-inhibited cells, we attempted to rescue MYC transcriptional activity via ectopic MYC expression. GSEA revealed positive enrichment of Hallmark_Myc_targets in MYC-transduced Enzalutamide-treated cells compared to RFP-transduced Enzalutamide-treated 16D cells (Figure 6D). Furthermore, there was no significant negative enrichment of Hallmark_Myc_targets in MYC-transduced Enzalutamide-treated cells relative to naïve 16D cells, indicating successful restoration of MYC transcriptional activity (Supplementary Figure 6E). Western blot analysis revealed increased expression of HK2 and LDHA in MYC-transduced Enzalutamide-treated cells compared to RFP-transduced Enzalutamide-treated 16D cells (Figure 6E). While ectopic MYC effectively rescued LDHA expression to levels observed in naïve 16D cells, HK2 expression remained roughly 50 percent lower in MYC-transduced Enzalutamide-treated cells than in naïve 16D cells (Figure 6E). Similarly, removal of Enzalutamide resulted in a complete rebound in LDHA but only a partial increase in HK2 expression (Supplementary Figure 4G). Targeted bisulfite sequencing identified a statistically significant increase in the mean percentage of methylated CpGs within the transcriptional start site of HK2 in Enzalutamide-treated 16D cells, suggesting that epigenetic alterations may cooperate with reduced MYC activity to antagonize HK2 expression (Supplementary Figure 6F). We used cell cycle analysis (Supplementary Figure 6G) to explore whether rescuing MYC activity influences the response to complex I inhibition and found that MYC restoration in Enzalutamide-treated cells eliminates sensitivity to IACS (Figure 6F). These results suggest that MYC activity regulates reliance on mitochondrial oxidative metabolism in cells that survive AR inhibition.
To evaluate whether genetic alterations associated with prostate cancer progression alter AR inhibition-induced metabolic phenotypes, we knocked down RB1 and TP53, two tumor suppressors that are commonly dysregulated in aggressive disease variants including neuroendocrine prostate cancer37. Knockdown of RB1 and TP53 in Enzalutamide-treated 16D cells (Figure 6G) increased neuroendocrine signatures38–40 (Supplementary Figures 6H–J) but did not rescue MYC transcriptional activity (Figure 6H, Supplementary Figure 6K), glycolytic enzyme expression (Supplementary Figure 6L), glycolysis (Supplementary Figures 6M–P), or sensitivity to complex I inhibition (Figure 6I). These data suggest that modulating lineage identity without restoring MYC activity is not sufficient to resolve AR inhibition-induced reliance on mitochondrial oxidative metabolism.
Sustained MYC expression promotes antiandrogen resistance
We hypothesized that maintenance of MYC activity during Enzalutamide treatment may enable cells to better survive AR inhibition due to maintenance of glycolysis. We found that ectopic MYC expression in 16D cells was sufficient to mitigate the Enzalutamide-mediated reduction in HK2, LDHA and DRP1-P616 expression (Figure 7A), restore glycolytic ATP production to levels observed in vehicle-treated cells (Figure 7B), and partially rescue the Enzalutamide-mediated increase in the percentage of ATP produced by mitochondrial oxidative metabolism (Figure 7C). We also performed U13C-glucose tracing, U13C-glutamine tracing, and metabolic profiling on RFP- and MYC-transduced 16D cells cultured −/+ Enzalutamide. Sustained MYC expression reverses Enzalutamide-induced changes to glucose and glutamine utilization (Figures 7D–H) but does not rescue Enzalutamide-mediated reduction in neutral lipid content (Supplementary Figure 7A).
Figure 7. Sustained MYC expression promotes antiandrogen resistance.

(A) Western blot indicating expression of MYC, HK2, LDHA, DRP1-P616, DRP1, and Actin (loading control) in RFP- and MYC-transduced 16D cells maintained +/− 10μM Enzalutamide for 1 week. (B-C) Glycolytic ATP production (B) and percentage of total ATP production from mitochondrial ATP production (% ATP from Mito) (C) of RFP- and MYC-transduced 16D cells maintained +/− 10μM Enzalutamide for 1 week. Data represent the mean +/− SEM of 4 technical replicates. (D-E) PCA of U13C-glucose (D) or U13C-glutamine (E) fractional contribution data from RFP- and MYC-transduced 16D cells maintained +/− 10μM Enzalutamide for six days prior to addition of U13C-glucose or U13C-glutamine for 24 hours. (F-G) Fractional contribution for M3 serine, M3 lactate, M2 citrate, and M2 malate from U13C-glucose (F) or M5 glutamate, M5 alpha-ketoglutarate, M4 succinate, and M4 malate (G) in RFP- and MYC-transduced 16D cells maintained +/− 10μM Enzalutamide for six days prior to addition of U13C-glucose or U13C-glutamine for 24 hours. (H) Heatmap of differentially abundant metabolites (fold change ≥ 1.5, p < 0.05) in RFP- and MYC-transduced 16D cells maintained +/− 10μM Enzalutamide for seven days. (I) Cell cycle analysis to quantify the relative sensitivity of RFP- and Myc-transduced 16D cells to 10μM Enzalutamide. Data represent the mean +/− SEM of 4 technical replicates from a representative experiment (n=2). (J) GSEA of Hallmark_Myc_targets in 21 mCRPC tumors before and after Enzalutamide treatment from Westbrook et al. dataset. P-values were calculated from an unpaired t-test with Welch’s correction. **p < 0.01, ***p < 0.001, ****p < 0.0001, n.s. = not significant, p ≥ 0.05.
Ectopic MYC expression significantly increased Enzalutamide resistance in 16D cells (Figure 7I). To investigate if there is evidence of MYC-associated resistance to AR blockade in clinical samples, we analyzed the Westbrook et al. dataset41 which contains RNA-sequencing data of 21 mCRPC tumors before and after Enzalutamide treatment. We found that seven patients have positive enrichment of Hallmark_Myc_targets with Enzalutamide treatment. Of these seven patients, three are characterized as nonresponders to Enzalutamide, three are characterized as having lineage plasticity with conversion to a double-negative phenotype, and one is characterized as having an unknown response to Enzalutamide (Figure 7J). In contrast, seven of the fourteen patients exhibiting negative enrichment of Hallmark_Myc_targets with Enzalutamide treatment exhibited a clinical response. These data correlate upregulation of MYC activity with clinical Enzalutamide resistance. In addition, in the LTL331 PDX model36, which relapses as terminally differentiated neuroendocrine prostate cancer after castration, relapsed tumors contain robust enrichment of Hallmark_Myc_targets compared to castrated tumors (Supplementary Figures 7B–C) despite maintenance of low AR activity (Supplementary Figures 7D–E). These data suggest that rescue of AR activity is not necessary to restore MYC signaling and support our hypothesis that MYC reactivation may promote resistance to AR blockade.
Discussion
Therapy-induced metabolic reprogramming has been reported in various cancers where standard of care therapy can synergize with targeting of reprogrammed metabolism to impair treatment-resistance42–44. In this study, we comprehensively characterized the effect of AR blockade on prostate cancer metabolism. Transcriptomic and metabolomic analyses revealed AR inhibition-induced changes to metabolic gene expression and metabolite abundance, respectively. Using bioenergetic assays, we identified sustained oxidative mitochondrial metabolism, including increased maximal respiration, and reduced basal and oligomycin-stimulated glycolysis, after AR inhibition. These AR blockade-induced metabolic alterations confer sensitivity to complex I inhibition. Mechanistically, reduced phosphorylation of DRP1-S616 and MYC signaling both play a key role in mediating AR inhibition-induced metabolic rewiring and dictating vulnerability to metabolic inhibitors.
Our study identifies altered mitochondrial dynamics following AR inhibition. Mitochondrial elongation has been shown to protect cells during nutrient starvation26,45 and enable survival after chemotherapy46,47. The functional impact of mitochondrial morphology on metabolic output has proven to be highly context dependent48–51. Future work is needed to understand how AR inhibition alters DRP1 phosphorylation and how the subsequent mitochondrial elongation influences other metabolic phenotypes.
Previous studies have demonstrated that MYC overexpression accelerates prostate cancer progression toward a metastatic, castration-resistant state by antagonizing the canonical AR transcriptional program52. MYC has also been shown to promote androgen-independent prostate cancer growth53. We illustrate that reactivation of MYC rescues AR inhibition-mediated reduction in glycolysis and phosphorylation of DRP1-S616. Future studies will be required to determine if MYCN (N-MYC) overexpression, which has been shown to promote lineage plasticity in prostate cancer54,55, has a similar effect on metabolism as MYC reactivation.
Consistent with prior studies, our results suggest that mitochondrial oxidative metabolism contributes to prostate cancer growth and survival. Our findings also suggest there may be a therapeutic window after AR inhibition to target mitochondrial metabolism. Tumor location must also be considered, as metabolic dependencies can differ based on site of implantation56. Trials to determine the efficacy of combined Metformin treatment and AR blockade have been inconclusive57,58. Importantly, the concentration of Metformin required to inhibit complex I activity in vitro (1mM) is more than 10 times higher than the maximally-achievable therapeutic concentration (70μM) found in patients24,59. Metformin has been shown to reduce AR and cyclin D1 levels60,61. These effects may explain why naïve 16D cells exhibit sensitivity to Metformin, despite lacking sensitivity to IACS, which reduces mitochondrial respiration by greater than 95 percent. In addition, Metformin has been shown to synergize with bicalutamide in mouse models by preventing AR blockade-induced hyperinsulinemia62. Furthermore, IACS-010759 has recently been shown to have dose-limiting toxicities in patients63. Therefore, it will be critical to identify tumor-specific regulators of mitochondrial metabolism in order to target cancer cell growth and limit toxicity in patients.
Limitations of the study
In the present study, we demonstrate that AR inhibition results in reduced glycolysis, reduced glutaminolysis, and increased reliance on mitochondrial oxidative metabolism. While metabolic profiling was performed both in vitro and in vivo, the technical challenges of performing in vivo metabolic assays limited our capacity to fully define the in vivo metabolic response to AR inhibition. While our findings were relatively consistent across a range of AR+ models, the heterogeneity of clinical prostate cancer is likely to increase the complexity of metabolic phenotypes and vulnerabilities. We evaluated metabolic gene expression before and after AR inhibition in four clinical datasets representative of localized and locally advanced metastatic prostate cancer, but we lack sufficient clinical data to define treatment-induced metabolic changes in a larger cohort of advanced metastatic prostate cancer. Finally, we showed that MYC activity regulates DRP1 phosphorylation, but we were not able to define the precise mechanism by which S616 is phosphorylated in prostate cancer cells.
RESOURCE AVAILABILITY
Lead contact
Further information and requests for resources and reagents should be directed to and will be fulfilled by the lead contact, Andrew Goldstein (agoldstein@mednet.ucla.edu).
Materials availability
This study did not generate new unique reagents.
Data and code availability
RNA sequencing data that support the findings of this study have been deposited in NCBI’s Gene Expression Omnibus and are accessible through GEO Series accession numbers GSE202885, GSE202755, and GSE202897. Metabolomics data that support the findings of this study have been deposited in the National Metabolomics Data Repository93 and are accessible through Study IDs ST002852, ST002859, ST002860, ST002856, ST002863, ST002864, and ST002865. Previously published ChIP sequencing data that was reanalyzed here is available under accession number GSE138460.
Code for generating PCA projection plots can be found at https://github.com/Nick-Nunley/PCA-for-AR-induced-metabolic-reprogramming-in-CRPCa
Any additional information required to reanalyze the data reported in this work paper is available from the lead contact upon request.
EXPERIMENTAL MODEL AND SUBJECT DETAILS
Animal work
All animal work was performed using IACUC approved protocols under the supervision of veterinarians from the Division of Laboratory Animal Medicine at UCLA.
7 million 16D cells were implanted subcutaneously with 100 μl Matrigel (Corning) into male NSG mice to form primary tumors. Primary tumors were harvested, minced, and re-implanted (20 – 80 mg of minced tumor tissue with 100 μl Matrigel per mouse) into NSG mice. 16D tumor-bearing mice were treated by oral gavage with 10 mg/kg/day of Enzalutamide in the vehicle (1% carboxymethyl cellulose, 0.5% Tween 80, and 5% dimethylsulfoxide) or the vehicle only, with a two-days-on/one-day-off schedule. Tumors were collected after 10 days of treatment and prepared for histology, protein extraction, and metabolite extraction.
MDA-PCa 180–30 PDX tumors were maintained by serial implantation of 20 – 80 mg of minced tumor tissue. Treatment with vehicle or Enzalutamide was initiated one week after implantation and performed using the approach described above. Tumors were collected after 7 days of treatment and prepared for protein extraction and ex vivo organoid culture.
MDA-PCa 173–2 PDX tumors were maintained by serial implantation of 20 – 80 mg of minced tumor tissue. Tumors pieces were implanted into intact or castrated mice. Nine days after implantation, tumors were treated by oral gavage with 7.5 mg/kg/day of IACS-010759 in the vehicle (10% dimethylsulfoxide, 0.5% methylcellulose) or the vehicle only for five days before collection for immunohistochemistry.
MDA-PCa 183-A PDX tumors were maintained by serial implantation of 20 – 80 mg of minced tumor tissue. Tumor tissue was harvested dissociated to plate into organoid culture as described in the “Organoid culture” section.
METHOD DETAILS
In vitro metabolic profiling and 13C isotope tracing for Figures 2I and Supplementary Figures 2a–c
Naïve and LTenza 16D cells were plated in 6-well dishes at 225,000 and 350,000 cells/well respectively. After 24 hours, cells were washed and cultured in a base RPMI supplemented with 10mM U13C-glucose (Cambridge Isotope Laboratories), 10% (v/v) FBS, 2mM glutamine, 100 units/mL penicillin, and 100 μg/mL streptomycin.
24 hours after the addition of U13C-glucose, cells were harvested and extracted for GC/MS analysis using established methods76. Briefly, cell plates were placed on ice and quickly washed with ice-cold 0.9% (w/v) NaCl. Cells were immediately treated with 500 μL of ice-cold MeOH and 200 μL water containing 1 μg of the internal standard norvaline. Cells were then scraped and placed in 1.5 mL centrifuge tubes kept on ice. Next, 500 μL of chloroform was added, after which samples were vortexed for 1 minute and then spun at 10,000g for 5 minutes at 4°C. The aqueous layer was transferred to a GC/MS sample vial and dried overnight using a refrigerated CentriVap.
Once dry, samples were resuspended in 20 μL of 2% (w/v) methoxyamine in pyridine and incubated at 37°C for 45 minutes. This was followed by addition of 20 μL of MTBSTFA + 1% TBDMSCl (Ntert-Butyldimethylsilyl-N-methyltrifluoroacetamide with 1% tertButyldimethylchlorosilane), mixing, and incubation for an additional 45 minutes at 37°C. Samples were run as previously described76, and analyzed using Agilent MassHunter software. Stable isotope tracing data was corrected for natural abundance of heavy isotopes with FluxFix software using a reference set of unlabeled metabolite standards77.
In vitro metabolic profiling and 13C isotope tracing for Figures 1e–h, 7d–h and Supplementary Figures 1f–h, Supplementary Figures 1n–o
Cells were seeded at 30 percent confluence and cultured in 6-well dishes for 48 hours. Cells were then washed and cultured in glucose-free RPMI 1640 plus 11mM U13C-glucose (Cambridge Isotope Laboratories), 10% (v/v) FBS, 100 units/mL penicillin, and 100 μg/mL streptomycin or glutamine-free RPMI 1640 plus 2mM U13C-glutamine (Cambridge Isotope Laboratories), 10% (v/v) FBS, 100 units/mL penicillin, and 100 μg/mL streptomycin for 24 hours prior to metabolite extraction.
For metabolite extraction, media was aspirated and cells were washed with cold 150mM ammonium acetate pH 7.3. Metabolite extractions were performed by adding 500μl of cold 80% methanol containing 2nM Norvaline (Sigma) as an internal standard per well. Cells were removed using a cell scraper before transferring cell suspensions to 1.5ml Eppendorf tubes. Samples were vortexed for 30 seconds and spun at 4°C for 5 minutes at maximum speed to pellet the insoluble fraction before 420 μl of the soluble fraction was transferred to ABC vials (Thermo Fisher Scientific). 80% MeOH was evaporated from the ABC vials using the EZ-2Elite evaporator (Genevac) and samples were stored at −80°C until analysis.
Dried metabolites were resuspended in 50% ACN:water and 1/10th was loaded onto a Luna 3um NH2 100A (150 × 2.0 mm) column (Phenomenex). The chromatographic separation was performed on a Vanquish Flex (Thermo Fisher Scientific) with mobile phases A (5 mM NH4AcO pH 9.9) and B (ACN) and a flow rate of 200 μl/minute. A linear gradient from 15% A to 95% A over 18 minutes was followed by 9 minutes isocratic flow at 95% A and reequilibration to 15% A. Metabolites were detection with a Thermo Fisher Scientific Q Exactive mass spectrometer run with polarity switching (+3.5 kV/− 3.5 kV) in full scan mode with an m/z range of 70–975 and 70.000 resolution. TraceFinder 4.1 (Thermo Fisher Scientific) was used to quantify the targeted metabolites by area under the curve using expected retention time and accurate mass measurements (< 5 ppm).
Normalization was performed by resuspending the insoluble fraction in 300 μl of lysis solution (0.1M NaCl, 20mM Tris-HCl, 0.1% SDS, 5mM EDTA in distilled water) and proceeding with DNA measurement. Samples were syringed with a 25G needle to reduce viscosity and 50 μl of each sample was transferred to a 96-well black wall clear bottom tissue culture plate (Corning). 50 μl lysis solution was added to one well for a blank reading. 100 μl of 5μg/ml Hoechst 33342 (Thermo Fisher Scientific) in distilled water was added to each well and 96-well plates were incubated for 30 minutes in the dark at 37°C before measurement of DNA-based florescence using a Tecan Infinite M1000 plate reader with 355nm excitation and 465nm emission. The blank reading was subtracted from each absorbance value to calculate relative cell amount.
Apoptosis analysis
Cells were seeded at 40 percent confluence and cultured in 6-well dishes for 48 hours prior to apoptosis analysis. No media changes were performed to preserve all material. Cell culture media and wash media were collected and pooled with quenched trypsin-containing media containing cells and apoptosis analysis was performed using an apoptosis detection kit (BioLegend, 640922) according to the provided protocol. Flow cytometry was performed to quantify the percentage of annexin V+ cells. In experiments using transduced lines, analysis was restricted to the transduced cells which were identified via flow cytometry by analyzing RFP florescence.
Bioenergetic assays
Oxygen consumption and extracellular acidification rates were measured using an Agilent Seahorse XF96 or XFe96 Analyzer. Briefly, 16D prostate cancer cells were plated at 40,000 cells/well in XF96 plates for 24 hours. At the time of experiment, tissue culture growth medium was replaced with assay medium consisting of unbuffered DMEM (Sigma, 5030) supplemented with 10mM glucose, 2mM pyruvate, 2mM glutamine, and 5mM HEPES. Respiration was measured at baseline and in response to acute treatment with 2μM oligomycin, FCCP (two sequential pulses of 500nM), and 0.2μM rotenone with 1μM antimycin A. All respiratory parameters were calculated as previously described in20.
Rates of ATP produced from oxidative phosphorylation and glycolysis were calculated as previously described78. Mitochondrial ATP production rates were determined by stoichiometric conversion of the ATP-linked respiration rate, and glycolytic ATP production rates were measured by correcting rates of extracellular acidification for the scaling factor of the microplate sensor coverage and confounding respiratory acidification. Where indicated, cells were treated with 2μM oligomycin 15 minutes prior to recording the initial measurements.
Cell cycle analysis
Cells were seeded at 30 percent confluence and cultured in 6-well dishes for 72 hours prior to cell cycle analysis. Media changes were performed 48 hours after plating. After 72 hours of culture, cell cycle analysis was performed using a 5-ethynyl-2’-deoxyuridine-based (EdU) kit (Thermo Fisher Scientific, C10635) according to the specified protocol. EdU labeling was performed for 2 hours in LNCaP and 16D cells, and for 5 hours in 180–30 PDX organoids. For experiments that contained small molecule inhibitors, fresh inhibitor(s) were adding during each media change. PDX 180–30 organoids were dissociated after EdU labeling prior to fixation for cell cycle analysis. In select experiments, the 1μg/ml Hoechst 33342 DNA stain (Thermo Fisher Scientific, 62249) was added prior to flow cytometry analysis to identify G2 and M phase cells. Flow cytometry analysis identified the percentage of EdU-positive and/or Hoechst-positive cells. For experiments with transduced lines, analysis was restricted to the RFP-positive transduced cells.
Cell lines, lentiviral transductions, and cloning of knockdown vectors
Cell lines were routinely tested for mycoplasma and authentication by short tandem repeat analysis (Laragen). Tissue culture plates were coated with 0.01% (v/v) Poly-L-Lysine (Sigma, P4832) diluted 1/20 in distilled water and washed with PBS to enhance cell attachment. 16D and LNCaP cells were cultured in RPMI base media (Gibco) + 10% FBS (v/v) + 100 units/mL penicillin, and 100μg/mL streptomycin. Enzalutamide treatment was performed by adding 10μM Enzalutamide (Selleck Chemicals, S1250) every 48 hours. For LNCaP castration experiments, LNCaP cells were grown in RPMI base media + 10% CSS (v/v) (Sigma, F6765) + 100 units/mL penicillin, and 100μg/mL streptomycin +/− 0.5nM DHT (Sigma) and fresh media was provided every 48 hours.
For lentiviral transductions, cells were seeded at 30–50% confluence. Transductions were performed 24–48 hours after seeding with 8μg/ml Polybrene (Thermo Fisher Scientific, NC0663391). Flow cytometry-based cell sorting was performed at least 72 hours after transduction to isolate color-tagged transduced cells.
MYC virus was produced using a plasmid vector FU-MYC-CRW64. Plasmid vectors for HK2-overexpression and DRP1-S616E were obtained from VectorBuilder. shScramble (FU-shScr-CRW) and shRB1-shTP53 (FU-shTP35-shRB1-CRW) vectors were cloned as follows. First, the pBSPacI shuttle vector was made by inserting an adaptor oligonucleotide AG220: 5’-AATTCTTTAATTAAAG-3’ at the EcoRI site of pBluescript II KS(+) (Stratagene). The pPass1 shuttle was cloned as follows. Annealed oligonucleotides AG232: 5’-CCTTAATTAAGCGATCGCACTGGGTACCTGGGCC-3’ and AG233: 5’-CAGGTACCCAGTGCGATCGCTTAATTAAGGGTAC-3’ were inserted between KpnI and ApaI sites of pBluescript II KS(+). Then, annealed oligonucleotides AG234: 5’-CTTAATTAAACTGGGGAGCTCCGC-3’ and AG235: 5’-GGAGCTCCCCAGTTTAATTAAGAGCT-3’ were inserted between SacI and SacII sites. This creates a PacI-AsiSI-[Multiple cloning sites]-PacI cassette. Annealed oligonucleotides AG218: 5’-GACGATGATTAATTAA-3’, and AG220 (above) were ligated with KflI-EcoRI fragment of shp53 pLO1 pure (Addgene) and inserted into PacI site in pBSPacI (pBSPacI-shTP53). PacI fragment of pBSPacI-shTP53 was then inserted into the AsiSI site in pPassI (pPass1-shTP53). The PacI-PacI fragment of FU-shRB1-AR-CGW was blunted and digested with HindIII creating a HindIII-blunt fragment of H1-shRB1 cassette. This cassette was inserted between HindIII and EcoRV sites in pPass1-shTP53 (pPass1-shTP53-shRB1). PacI fragment of pPass1-shTP53-shRB1 was then inserted into the PacI site of FU-CRW (FU-shTP53-shRB1-CRW). The U6-Scramble cassette was made by ligating annealed oligonucleotides AG227: 5’-CACCGAATTCTTCCATAGAGCTCGTCAAGAGCGAGCTCTATGGAAGAATTC-3’ and AG228: 5’-AAAAGAATTCTTCCATAGAGCTCGCTCTTGACGAGCTCTATGGAAGAATTC-3’ in pENTR/U6 vector (Thermo Fisher Scientific). Then, the BamHI-XbaI fragment was purified and inserted between BamHI and XbaI sites in pBSPacI (pBSPacI-shScr21A). The PacI fragment from pBSPacI-shScr21A was inserted at the PacI site in FU-CRW (FU-shScr-CRW). Concentrated viral aliquots were produced either by VectorBuilder or UCLA Integrated Molecular Technologies Core.
ChIP sequencing
AR ChIP-seq bigwig files were generated using DeepTools program suite67. AR binding profiles of LNCaP-Ctrl, LNCaP-R188179, 16D30 samples at genomic loci (namely LDHA, HK2 and DNM1L) were analyzed by visualizing AR ChIP-seq bigwig tracks using IGV80.
DNA methylation analysis
Bisulfite sequencing was carried out as described previously81. In brief, genomic DNA was bisulfite converted using the EZ DNA methylation kit (Zymo Research, Orange, CA, USA) and amplified using primers specific to the promoter of HK2 (F-5′- AGTTGAGTTTTAGTGATTTTGTGGT −3′, R-5′- AACTTACCTTCTACACTTAATCATAATTAA −3′). All PCR reactions were carried out in 40 μl volume containing 20 ng of bisulfite converted DNA, 1 × Platinum Taqbuffer (Thermo Fisher Scientific), 1.5 U Platinum Taq (Life Technologies), 250 μM each dNTPs, 1.5mM MgCl2, 0.25 μg/μl bovine serum albumin, 2 μl dimethyl sulfoxide, 400nM forward primer, and 400nM reverse primer. Cycling conditions were 95°C for 3 minutes, 36 cycles of 95°C for 30 seconds, 55°C for 30 seconds, and 72°C for 30 seconds, followed by a 7 min extension step at 72°C. PCR products were gel purified after electrophoresis on a 2% agarose gel. Amplicons were sequenced to an average coverage of 27,380x using established amplicon sequencing protocols (Azenta). Raw bisulfite amplicon sequencing fastq reads were first trimmed using Trim Galore version 0.6.6 and then aligned to UCSC hg19 reference genome using Bismark version 0.23.068. Bismark was further used to deduplicate the alignments and extract methylation call files which report the percentage of methylated cytosines for each CpG dinucleotide.
Immunohistochemistry
Tumor tissue was fixed with 4% paraformaldehyde in PBS for 6–8 hours and processed for paraffin sections. Tumor samples were color inked and formalin-fixed paraffin embedded. 3- to 4-μm thick sections were placed on charged slides for immunohistochemical staining that was carried out on Dako’s Automated AS48Link Autostainer in SPORE Pathology Core laboratory at UCLA. Positive and negative control slides were pretreated with Heat Induced Epitope Retrieval (HIER) in Dako PT Link using the Envision FLEX Target Retrieval solution at low pH (6.0), and incubated at 97°C for 15 minutes. Primary rabbit anti-Human HK2 monoclonal antibody (Cell Signaling, 2867; clone, C64G5) or primary mouse anti-Ki67 antibody (Dako, IR62661–2; clone, MIB-1) was added at a 1:600 or 1:100 dilution, respectively, and incubated for 60 minutes at room temperature. Sections were then incubated for 5 minutes with the EnVision Flex+ Rabbit linker (Agilent, SM805) prior to a 5-minute treatment with the Polymer Flex/HRP (Agilent, SM802) reagent. Negative control slides received the Flex Rabbit Negative Control Immunoglobulin fraction (Agilent, IR600) instead of primary antibody. Slides were developed in Envision Flex DAB+Chromogen and counterstained with Mayer’s hematoxylin.
In vivo metabolomics
After tumor dissection, a maximum of 30mg of tissue was weighed, snap frozen, and stored at −80°C until metabolite extraction. To extract metabolites, weighed tumor tissue was added to a bead tube (Thermo Fisher Scientific) containing 1ml 80% methanol plus 10mM potassium trifluoromethanesulfonate (TMSO) internal standard on ice. Samples were homogenized for 1 minute at max speed on a bead homogenizer (Thermo Fisher Scientific). Bead tubes were spun at 17000g at 4°C for 10 minutes. The supernatant was transferred to an Eppendorf tube and spun at 17000g at 4°C for 10 minutes. A volume of extraction equivalent to 3mg of tumor tissue was transferred to an ABC vial (Thermo Fisher Scientific). All volumes were normalized to 500 μl with 80% methanol containing TMSO internal standard. 80% MeOH was evaporated from the ABC vials using the EZ-2Elite evaporator (Genevac) and samples were stored at −80°C until analysis.
Dried metabolites were reconstituted in 100 μL of a 50% acetonitrile (ACN) 50% dH20 solution. Samples were vortexed and spun down for 10 minutes at 17,000g. 70 μL of the supernatant was then transferred to HPLC glass vials. 10 μL of these metabolite solutions were injected per analysis. Samples were run on a Vanquish (Thermo Fisher Scientific) UHPLC system with mobile phase A (20mM ammonium carbonate, pH 9.7) and mobile phase B (100% ACN) at a flow rate of 150 μL/min on a SeQuant ZIC-pHILIC Polymeric column (2.1 × 150 mm 5 μm, EMD Millipore) at 35°C. Separation was achieved with a linear gradient from 20% A to 80% A in 20 minutes followed by a linear gradient from 80% A to 20% A from 20 minutes to 20.5 minutes. 20% A was then held from 20.5 minutes to 28 minutes. The UHPLC was coupled to a Q-Exactive (Thermo Fisher Scientific) mass analyzer running in polarity switching mode with spray-voltage=3.2kV, sheath-gas=40, aux-gas=15, sweep-gas=1, aux-gas-temp=350°C, and capillary-temp=275°C. For both polarities mass scan settings were kept at full-scan-range=(70–1000), ms1-resolution=70,000, max-injection-time=250ms, and AGC-target=1E6. MS2 data was also collected from the top three most abundant singly-charged ions in each scan with normalized-collision-energy=35. Each of the resulting “.RAW” files was then centroided and converted into two “.mzXML” files (one for positive scans and one for negative scans) using msconvert from ProteoWizard82. These “.mzXML” files were imported into the MZmine 2 software package83. Ion chromatograms were generated from MS1 spectra via the built-in Automated Data Analysis Pipeline (ADAP) chromatogram module84 and peaks were detected via the ADAP wavelets algorithm. Peaks were aligned across all samples via the Random sample consensus aligner module, gap-filled, and assigned identities using an exact mass MS1(+/−15ppm) and retention time RT (+/−0.5min) search of our in-house MS1-RT database. Peak boundaries and identifications were then further refined by manual curation. Peaks were quantified by area under the curve integration and exported as CSV files. If stable isotope tracing was used in the experiment, the peak areas were additionally processed via the R package AccuCor85 to correct for natural isotope abundance. Peak areas for each sample were normalized by the measured area of the internal standard trifluoromethanesulfonate (present in the extraction buffer) and by the number of cells present in the extracted well.
Neutral lipid analysis
Cells were trypsinized, washed with PBS, and stained with 2μM BODIPY 493/503 for 15 minutes at 37°C in the dark. Cells were then washed and resuspended in PBS prior to flow cytometry analysis.
Organoid culture
Using a razor blade, individual tumors were mechanically dissociated in dissociation media comprised of RPMI-1640 containing 10% (v/v) fetal bovine serum, 100 units/mL penicillin, and 100μg/mL streptomycin, 1mg/mL collagenase type I, 1mg/ml dispase, 0.1mg/mL deoxyribonuclease, and 10μM of the p160ROCK inhibitor Y-27632 dihydrochloride (Tocris Bioscience). When chunks were no longer visible, the samples were incubated at 37°C on a nutating platform for 45 minutes in 10 mL of dissociation media. After centrifugation at 800g for 5 minutes, the pellet was washed with 1x phosphate buffered saline. The cell pellet was resuspended in human organoid media86 and passed through a 100μm cell strainer. Growth factor reduced Matrigel (Corning) was added to the cell suspension at a final concentration of 75% before plating into rings in 24-well plates. After Matrigel rings solidified at 37°C for 1 hour, 500 μl human organoid media was added to each well. Each vehicle- and Enzalutamide-treated sample was cultured +/− 30nM IACS-010759 (ChemieTek) for 72 hours.
RNA sequencing
RNA was extracted from samples using the RNeasy Mini Kit (QIAGEN). Library preparation was performed using the KAPA Stranded mRNA-Seq Kit (Roche). The workflow consists of mRNA enrichment, cDNA generation, and end repair to generate blunt ends, A-tailing, adaptor ligation, and PCR amplification. Different adaptors were used for multiplexing samples in one lane. The Illumina HiSeq 3000 was used to perform sequencing for 1×50 run.
Reiter clinical trial: patient cohort
All patients provided informed consent to join study NCI-2015-01448 (NCT01990196).
Men with prostate adenocarcinoma with planned radical prostatectomy with curative intent were randomized to three treatment groups: patients treated with Enzalutamide and either Degarelix, Trametinib, or Dasatinib. Each patient underwent a targeted biopsy prior to neo-adjuvant treatment, and a subsequent radical prostatectomy. RNA was extracted from both FFPE pre-treatment needle biopsy and post-treatment surgical specimens from each patient.
Pre-ADT samples from all treatment arms were used in this study. Only post-ADT samples treated with Enzalutamide and Degarelix were included. Enzalutamide was delivered 160mg orally daily. Degarelix was administered with a 240mg subcutaneous loading dose in the first month, and then 80mg subcutaneously every four weeks.
Reiter clinical trial: tumor RNA sequencing
Libraries for RNA-Seq were prepared with Clonetech SMARTer Stranded Total RNA-Seq (Pico) Kit. The workflow consists of converting total RNA to cDNA, and then adapters for Illumina sequencing are added through PCR. The PCR products are purified, and then ribosomal cDNA is depleted. The cDNA fragments are further amplified with primers universal to all libraries. Lastly, the PCR products are purified once more to yield the final cDNA library. Different adaptors were used for multiplexing samples in one lane. Sequencing was performed on Illumina Novaseq 6000 for a paired-end read 50 bp run. Data quality check was done on Illumina SAV. Demultiplexing was performed with Illumina Bcl2fastq2 (v2.17) program.
Clinical data: RNA data processing
RNA data processing steps were common to all datasets. RNA sequencing reads were aligned to GRCh38.13 using STAR (v2.7.6a)75. fastqc (v0.11.8) was used for file-level per base sequence quality, GC content and other metrics (Babraham Bioinformatics - FastQC A Quality Control tool for High Throughput Sequence Data https://www.bioinformatics.babraham.ac.uk/projects/fastqc/.). We used fastp (v0.20.1) to trim adaptor sequences87. multiqc (v1.15) was used to summarize fastqc metrics for all samples and collate into summary plots88. RNA quantification was performed using RSEM (v1.3.3)89.
Clinical data: differential abundance and gene set enrichment
We used DESeq2 (v1.40.2) for differential mRNA abundance analysis90. RSEM’s gene-level expected counts were used for model fitting. For pre vs. post treatment comparisons across all datasets, batch effects were captured in the model design:
‘ADT Status’ is either “Pre-ADT” or “Post-ADT” and ‘Dataset’ is one of the four datasets included in this study. When estimating differential abundance within a dataset, we did not include a Dataset term in our model.
Gene set enrichment analysis was performed using the hallmark gene set from the Molecular Signatures Database (MSigDB) using GSEA (v4.3.2)73. Normalized TPM counts were used as input for GSEA. All hallmark gene sets were tested against the complete expression set output from DESeq2. ADT (Pre/Post) was used as the phenotype for the GSEA analysis. Gene set permutation was used to calculate the p-value for each gene set, and 1000 permutations were performed. Gene sets with an FDR q-value < 0.05 were considered significant.
Clinical data: statistical Analysis
We performed all statistical analysis using R (v4.2.2) (R Core Team (2016). R: A Language and Environment for Statistical Computing (R Foundation for Statistical Computing)). Data visualization was performed using the BPG package (v7.0.5)91.
Visualization of mitochondria and lipid droplets
Cells were cultured in μ-Slide Well (Ibidi) and fixed with 4% Paraformaldehyde/PBS for 2 minutes. After washing with PBS, cells were stained with anti-TUFM (Atlas Antibodies, AMAb90966) followed by Alexa Fluor 488-conjugated anti-mouse IgG (H+L) (Thermo Fisher Scientific, A11001) to visualize mitochondria, or 1 μg/ml BODIPY 493/503 for 15 minutes to visualize lipid droplets, and 4’,6-diamidino-2-phenylindole (DAPI) (Sigma, D8417). Signals were visualized using Zeiss LSM 880 confocal scanning microscope with Airyscan with 100x oil immersion objectives.
Western blot
Cells were lysed in RIPA buffer (50mM Tris-HCL pH8.0, 150nM NaCl, 1% NP-40, 0.5% Sodium Deoxycholate, 0.1% SDS) containing a phosphatase inhibitor cocktail (Halt, 78428) and a protease inhibitor cocktail (Millipore Sigma, 11697498001). Sonication was performed with a sonic dismembrator (Thermo Fisher Scientific, FB120) to improve membranous and nuclear protein yield. For extraction of protein lysate from tumor samples, tumors were minced with a razor blade prior to transfer to pre-filled bead mill tubes (Thermo Fisher Scientific, 15-340-153) and resuspension in the lysis solution described above. Homogenization was performed for 2 minutes at max intensity using a Bead Mill 4 homogenizer (Thermo Fisher Scientific, 15-340-164). Samples were run on NuPAGE 4%−12% Bis-Tris Gels (Thermo Fisher Scientific, NP0335) and protein was transferred to PVDF transfer membranes (Thermo Fisher Scientific, IPV00010). Total protein was visualized using the SYPRO RUBY protein blot stain (Thermo Fisher Scientific, S11791) and membranes were blocked in PBS + 0.1% Tween-20 (Thermo Fisher Scientific, BP337–500) + 5% milk (Thermo Fisher Scientific, BC9121673). Proteins were probed with primary antibodies followed by chromophore-conjugated anti-mouse (Thermo Fisher Scientific, A21235) or anti-rabbit secondary antibodies (Thermo Fisher Scientific, A21244) or HRP-conjugated anti-mouse (Thermo Fisher Scientific, 31430) or anti-rabbit secondary antibodies (Thermo Fisher Scientific, 31463) and detected via florescence or HRP chemiluminescence respectively. Primary antibodies used were beta-Actin (Thermo Fisher Scientific, MA1–140), Androgen Receptor (Cell Signaling, 5153S), Hexokinase II (Cell Signaling, 2867), DRP1 (Cell Signaling, 5391S), Phospho-DRP1 (Ser616) (Cell Signaling, 3455S), Anti-LDH-A (MilliporeSigma, MABC150), Recombinant-Anti-c-MYC (Abcam, ab32072), NSE (Proteintech, 66150–1-Ig), and PSA/KLK3 (Cell Signaling, 5877).
QUANTIFICATION AND STATISTICAL ANALYSIS
Ki67 immunohistochemistry quantification
Ki67-stained images were opened into ImageJ and converted into 8 bit files. The threshold was set to identify positive staining and applied across all images, and mean grey value was measured for each image to reflect the average intensity over all pixels in the image. Relative staining was calculated based on the average for the control (intact/vehicle) samples.
Metabolomics analysis
For projection plots, principal component analysis (PCA) was performed with the scikit-learn, NumPy, pandas, and Matplotlib libraries in Python. Feature selection was done based on shared features between differing datasets. Count/abundance matrices were sorted along their respective feature-axis to ensure features were listed in the same order. After performing z-score scaling, the coordinates from the in vitro samples were merged onto a PCA plot with the values from in vivo samples. 95% confidence ellipses were generated from PCA-transformed coordinates using a script from Matplotlib (https://github.com/Nick-Nunley/PCA-for-AR-induced-metabolic-reprogramming-in-CRPCa). Heatmaps were generated by plotting row z-scores in GraphPad Prism Version 7. To generate the average z-score plot, an in vivo Enzalutamide-enriched metabolite signature was defined. Row z-scores of in vivo Enzalutamide-enriched metabolites were calculated from the in vitro metabolomics dataset. Row z-scores from three technical replicates from a representative experiment (n=3) were averaged and represented on a dot plot. MSEA was generated using Metaboanalyst 5.069 (https://www.metaboanalyst.ca/MetaboAnalyst/home.xhtml).
Mitochondrial content and morphology, and lipid droplets
Mitochondrial elongation was expressed as aspect ratio (long axis/short axis ratio) and eccentricity, calculated as the ratio of the distance between the foci of an ellipse and its major axis length. Branching was expressed as form factor ((4π(area))/Perimeter2). Mitochondrial parameters were determined from mitochondrial TUFM staining. Image analysis was performed using ImageJ v1.53c and CellProfiler v2.070. For mitochondrial volume quantification, z-stack images were processed with Imaris software (Oxford Instruments) to identify TUFM-positive regions and calculate TUFM-positive volume. The number of lipid droplets per cell were quantified with Imaris software (Oxford instruments).
RNA sequencing analysis
KEGG pathway analysis was performed using DAVID Bioinformatics71,72. GSEA was performed as described previously using GSEA_4.0.3 software73,74. Projection plots were generated as described for metabolomics analysis. After performing z-score scaling, the coordinates from the in vitro 16D Enzalutamide time-course RNA-sequencing data were merged onto a PCA plot with the values from the Rajan et al dataset. 95% confidence ellipses were generated as described for metabolomics analysis. Average z-score plots and heatmaps were generated as described for metabolomics analysis.
In the Quigley et al dataset, there were 63 Enzalutamide-naive and 36 Enzalutamide-resistant patients whose tumor underwent RNA-seq92. Alignment to hg38-decoy reference was performed using STAR aligner (version 2.5.0b) with per-gene counts quantification on the basis of Illumina RNA-seq alignment app Version 1.1.075.
Western blot quantification
Western blots were quantified using ImageJ software. Background values were subtracted from the mean gray value for each band. Each band was normalized to its respective loading control.
Supplementary Material
Supplementary Table 1. KEGG PATHWAY analysis: Rajan et al. Top 30 significantly enriched pathways
Supplementary Table 2. KEGG PATHWAY analysis: 16D cells Top 30 significantly enriched pathways
KEY RESOURCES TABLE
| REAGENT or RESOURCE | SOURCE | IDENTIFIER |
|---|---|---|
| Antibodies | ||
| Mouse anti-TUFM | Atlas Antibodies | Cat#AMAb190966; RRID: AB_2665738 |
| Rabbit anti-phospho DRP1 (S616) | Cell Signaling | Cat#3455S; RRID: AB_2085352 |
| Rabbit anti-DRP1 | Cell Signaling | Cat#5391S; RRID: AB_11178938 |
| Rabbit anti-PSA | Cell Signaling | Cat#5877; RRID: AB_2797624 |
| Mouse anti-beta Actin | Thermo Fisher Scientific | Cat#MA1–140; RRID: AB_2536844 |
| Mouse anti-NSE | Proteintech | Cat#66150–1-Ig; RRID: AB_2881546 |
| Rabbit anti-Hexokinase II | Cell Signaling | Cat#2867, clone C64G5; RRID: AB_2232946 |
| Mouse anti-Ki67 | Dako | Cat#IR62661–2, clone MIB-1; RRID: |
| Mouse anti-LDHA | Millipore Sigma | Cat#MABC150 |
| Mouse anti-cMYC | Abcam | Cat#Ab32072; RRID: AB_731658 |
| Rabbit anti-Androgen receptor | Cell Signaling | Cat#5153S; RRID: AB_10691711 |
| Alexa Fluor 488-conugated goat anti-mouse IgG (H+L) | Thermo Fisher Scientific | Cat#A11001; RRID: AB_2534069 |
| Alexa Fluor 647-conjugated goat anti-mouse IgG (H+L) | Thermo Fisher Scientific | Cat#A21235; RRID: AB_2535804 |
| Alexa Fluor 647-conjugated goat anti-rabbit IgG (H+L) | Thermo Fisher Scientific | Cat#A21244; RRID: AB_2535812 |
| HRP-conjugated goat anti-mouse IgG (H+L) | Thermo Fisher Scientific | Cat#31430; RRID: AB_228307 |
| HRP-conjugated goat anti-rabbit IgG (H+L) | Thermo Fisher Scientific | Cat#31463; RRID: AB_228333 |
| Bacterial and virus strains | ||
| FU-MYC-CRW lentivirus | Stoyanova et al.64 | N/A |
| DRP1-S616E lentivirus | VectorBuilder | VB211024–1031mfm |
| HK2-overexpression lentivirus | VectorBuilder | VB211024–1030wt |
| FU-shScramble-CRW lentivirus | This study | N/A |
| FU-shTP35-shRB1-CRW lentivirus | This study | N/A |
| Biological samples | ||
| MDA-PCa 180-30 patient-derived xenograft | Palanisamy et al.25 | N/A |
| MDA-PCa 173-2 patient-derived xenograft | Palanisamy et al.25 | N/A |
| MDA-PCa 183-A patient-derived xenograft | Palanisamy et al.25 | N/A |
| Chemicals, peptides, and recombinant proteins | ||
| Trypsin-EDTA | GIBCO | Cat#25300–054 |
| Poly-L-Lysine 0.01% (v/v) | Sigma | Cat#P4832 |
| 5α-Androstan-17β-ol-3-one (DHT) | Sigma | Cat#A8380–1G |
| Fetal bovine serum, charcoal stripped | Sigma | Cat#F6765 |
| cOmplete protease inhibitor cocktail tablet | Roche | Cat#11697498001 |
| Phosphatase inhibitor cocktail | Halt | Cat#78428 |
| Polybrene | Thermo Fisher Scientific | Cat#NC0663391 |
| 4’,6-diamidino-2-phenylindole (DAPI) | Thermo Fisher Scientific | Cat#D1306 |
| Hoechst 33342 | Thermo Fisher Scientific | Cat#62249 |
| BODIPY 493/503 | Thermo Fisher Scientific | Cat#D3922 |
| U-13C6-glucose | Cambridge Isotope Laboratories | Cat#CLM-1396–5 |
| Enzalutamide | Selleck Chemicals | Cat#S1250 |
| Apalutamide | Cayman Chemicals | Cat#17132 |
| ARCC4 | Tocris | Cat#7254 |
| IACS-010759 | ChemieTek | Cat#CT-IACS107 |
| Metformin | Selleck Chemicals | Cat#S1950 |
| Oligomycin | Sigma-Aldrich | Cat#75351 |
| Carbonyl cyanide 4-(trifluoromethoxy)phenylhydrazone (FCCP) | Sigma-Aldrich | Cat#C2920 |
| Rotenone | Sigma-Aldrich | Cat#R8875 |
| Antimycin A | Sigma-Aldrich | Cat#A8674 |
| Matrigel growth factor-reduced membrane matrix | Corning | Cat#CB-40230C |
| Matrigel membrane matrix | Corning | Cat#CB-40234 |
| DNase I from bovine pancreas | Sigma-Aldrich | Cat#D5025 |
| Dispase II | Gibco | Cat#17-105-041 |
| Collagenase, Type I | Gibco | Cat#17-100-017 |
| Y-27632 dihydrochloride (ROCK inhibitor) | Selleck Chemicals | Cat#S1049 |
| B27 supplement, 50x | Life Technologies | Cat#17504–044 |
| GlutaMAX, 100x | Life Technologies | Cat#35050–068 |
| Nicotinamide | Sigma-Aldrich | Cat#N0636 |
| N-acetyl-L-cysteine | Sigma-Aldrich | Cat#A9165 |
| Normocin | Thermo Fisher Scientific | Cat#ant-nr-1 |
| Recombinant human Noggin | PeproTech | Cat#120–10C |
| SB202190 | Sigma-Aldrich | Cat#S7076 |
| A83–01 | Tocris Bioscience | Cat#2939 |
| Human FGF-2 | PeproTech | Cat#100–18B |
| Prostaglandin E2 | Tocris Bioscience | Cat#2296 |
| Human fibroblast growth factor (FGF)-10 | PeproTech | Cat#100–26 |
| Human epidermal growth factor (EGF) | PeproTech | Cat#AF-100–15 |
| Critical commercial assays | ||
| RNeasy Mini Kit | QIAGEN | Cat#74104 |
| KAPA Stranded mRNA-Seq Kit | Roche | Cat#07962193001 |
| Apoptosis Detection Kit (FITC Annexin V with 7-AAD) | Biolegend | Cat#640922 |
| Click-iT™ Plus EdU Alexa Fluor™ 647 Flow Cytometry Assay Kit | Thermo Fisher Scientific | Cat#C10635 |
| EZ DNA methylation kit | Zymo Research | Cat#D5001 |
| Deposited data | ||
| Raw and processed RNAseq (16D Enzalutamide timecourse) | This paper | GEO: GSE202885 |
| Raw and processed RNAseq (LNCaP Castration vs Enzalutamide) | This paper | GEO: GSE202755 |
| Raw and processed RNAseq (16D Enzalutamide-treated cells transduced with cMyc, shRb1, shTp53, or shRb1_shTp53) | This paper | GEO: GSE202897 |
| Raw and processed ChIP-seq (16D AR ChIP) | Davies et al.30 | GEO: GSE138460 |
| Raw metabolomics data (In vivo 16D vehicle and Enzalutamide tumors) | This paper | NMDR: ST002852 |
| Raw metabolomics data (In vitro 16D vehicle and Enzalutamide replicate 1 for Figure 2I) | This paper | NMDR: ST002859 |
| Raw metabolomics data (In vitro 16D vehicle and Enzalutamide replicates 2 and 3 for Figure 2I) | This paper | NMDR: ST002860 |
| Raw metabolomics data (In vitro 16D validation of IACS-010759) | This paper | NMDR: ST002856 |
| Raw metabolomics data (In vitro 16D vehicle and Enzalutamide for Supplementary Figures 1f–h) | This paper | NMDR: ST002863 |
| Raw metabolomics data (In vitro 16D Enzalutamide, Apalutamide, ARCC-4) | This paper | NMDR: ST002865 |
| Raw metabolomics data (In vitro 16D −/+ MYC −/+ Enza) | This paper | NMDR: ST002864 |
| Experimental models: Cell lines | ||
| LNCaP | ATCC | CRL-1740 |
| V16D | Bishop et al.19 | N/A |
| LAPC4 | Klein et al.65 | N/A |
| 22Rv1 | ATCC | CRL-2505 |
| Experimental models: Organisms/strains | ||
| Mouse: NSG | Jackson Laboratories and the UCLA Department of Radiation Oncology Animal Core Facility | Cat#005557 |
| Oligonucleotides | ||
| 5’-AATTCTTTAATTAAAG-3’ | This paper | N/A |
| 5’-CCTTAATTAAGCGATCGCACTGGGTACCTGGGCC-3’ | This paper | N/A |
| 5’-CAGGTACCCAGTGCGATCGCTTAATTAAGGGTAC-3’ | This paper | N/A |
| 5’-CTTAATTAAACTGGGGAGCTCCGC-3’ | This paper | N/A |
| 5’-GGAGCTCCCCAGTTTAATTAAGAGCT-3’ | This paper | N/A |
| 5’-GACGATGATTAATTAA-3’ | This paper | N/A |
| 5’-CACCGAATTCTTCCATAGAGCTCGTCAAGAGCGAGCTCTATGGAAGAATTC-3’ | This paper | N/A |
| 5’-AAAAGAATTCTTCCATAGAGCTCGCTCTTGACGAGCTCTATGGAAGAATTC-3’ | This paper | N/A |
| F-5′- AGTTGAGTTTTAGTGATTTTGTGGT −3′ | This paper | N/A |
| R-5′- AACTTACCTTCTACACTTAATCATAATTAA −3′ | This paper | N/A |
| Recombinant DNA | ||
| pBluescript II KS(+) | Stratagene | Cat#212207 |
| shp53 pLO1 pure | Godar et al.66 | Addgene Cat#19119 |
| pENTR/U6 vector | Thermo Fisher Scientific | Cat#K4945–00 |
| Software and algorithms | ||
| DeepTools program suite | Ramirez et al.67 | https://deeptools.readthedocs.io/en/develop/index.html |
| Trim Galore version 0.6.6 | N/A | https://github.com/FelixKrueger/TrimGalore |
| Bismark version 0.23.0 | Krueger et al.68 | https://www.bioinformatics.babraham.ac.uk/projects/bismark/ |
| Principal component analysis projection plots | This paper | https://github.com/Nick-Nunley/PCA-for-AR-induced-metabolic-reprogramming-in-CRPCa |
| Metaboanalyst 5.0 | Pang et al.69 | https://www.metaboanalyst.ca/MetaboAnalyst/home.xhtml |
| ImageJ v1.53c | ImageJ | https://imagej.nih.gov/ij/download.html |
| CellProfiler v2.0 | Kamentsky et al.70 | https://cellprofiler.org/ |
| Imaris software | Oxford Instruments | https://imaris.oxinst.com/ |
| DAVID Bioinformatics | Huang et al.71, Huang et al.72 | https://david.ncifcrf.gov/ |
| GSEA_4.0.3 | Subramanian et al.73, Mootha et al.74 | https://www.gsea-msigdb.org/gsea/index.jsp |
| STAR aligner version 2.5.0b | Dobin et al.75 | N/A |
| Prism v8 | GraphPad | https://www.graphpad.com/scientific-software/prism/ |
| Other | ||
| Sonic dismembrator | Thermo Fisher Scientific | Cat#FB120 |
Acknowledgments
P.D.C. and J.M.G. acknowledge the support of the Ruth L. Kirschstein National Research Service Award GM007185 and the UCLA Eli and Edythe Broad Center of Regenerative Medicine and Stem Cell Research Training Program. P.D.C. is also supported by the NIH grants TL1 DK132768 and U2C DK129496. A.E.J. is supported by the UCLA Tumor Cell Biology Training Grant (NIH T32CA009056). A.S.G. is supported by the National Cancer Institute of the National Institutes of Health under Award Number R01CA237191. The content is solely the responsibility of the authors and does not necessarily represent the official views of the National Institutes of Health. A.M.L.D. is supported by NCI/NIH supplement related to R01CA237191. A.S.G. is also supported by Department of Defense PCRP award HT94252310379, American Cancer Society award RSG-17-068-01-TBG, the UCLA Eli and Edythe Broad Center of Regenerative Medicine and Stem Cell Research Rose Hills Foundation Innovator Grant, the UCLA Jonsson Comprehensive Cancer Center and Eli and Edythe Broad Center of Regenerative Medicine and Stem Cell Research Ablon Scholars Program, the National Center for Advancing Translational Sciences UCLA CTSI Grant UL1TR001881, STOP CANCER, and the UCLA Institute of Urologic Oncology. A.S.G., A.S.D., O.S.S., R.E.R, M.B.R., P.C.B are supported by the UCLA Prostate Cancer Specialized Programs of Research Excellence (SPORE) NCI P50 CA092131. M.C.H. is supported by the U.S. Department of Defense Prostate Cancer Research Program (W81XWH-20-1-0111, W81XWH-21-1-0229) and Grant 2021184 from the Doris Duke Charitable Foundation. N.M.N. (Navone) is supported by NCI U01 CA224044-03. We acknowledge the support of the Hutton Family Foundation. We thank UCLA Technology Center for Genomics & Bioinformatics, UCLA Metabolomics Center, UCLA MCDB/BSCRC Microscopy Core. The UCLA Integrated Technologies Core is supported by CURE/P30 DK041301. NIH Common Fund’s National Metabolomics Data Repository (NMDR) website, the Metabolomics Workbench, is supported by NIH grant U2C-DK119886 and OT2-OD030544 grants. We thank Michaela Veliova, Thomas Graeber, Linsey Stiles, Brigitte Gomperts, and other collaborators who provided intellectual support and critical feedback during the course of this project.
Inclusion and Diversity statement
One or more of the authors of this paper self-identifies as an underrepresented ethnic minority in science. One or more of the authors of this paper self-identifies as a member of the LGBTQIA2S+ community. One or more of the authors of this paper received support from a program designed to increase minority representation in science.
Footnotes
Competing interests statement
P.C.B. sits on the Scientific Advisory Boards of Sage Bionetworks, BioSymetrics Inc. and Intersect Diagnostics Inc. All other authors declare no competing interests.
REFERENCES
- 1.Siegel RL, Miller KD, Wagle NS, and Jemal A (2023). Cancer statistics, 2023. CA Cancer J Clin 73, 17–48. 10.3322/caac.21763. [DOI] [PubMed] [Google Scholar]
- 2.Sayegh N, Swami U, and Agarwal N (2022). Recent Advances in the Management of Metastatic Prostate Cancer. JCO Oncol Pract 18, 45–55. 10.1200/OP.21.00206. [DOI] [PubMed] [Google Scholar]
- 3.Nakazawa M, Paller C, and Kyprianou N (2017). Mechanisms of Therapeutic Resistance in Prostate Cancer. Curr Oncol Rep 19, 13. 10.1007/s11912-017-0568-7. [DOI] [PMC free article] [PubMed] [Google Scholar]
- 4.Tran C, Ouk S, Clegg NJ, Chen Y, Watson PA, Arora V, Wongvipat J, Smith-Jones PM, Yoo D, Kwon A, et al. (2009). Development of a second-generation antiandrogen for treatment of advanced prostate cancer. Science 324, 787–790. 10.1126/science.1168175. [DOI] [PMC free article] [PubMed] [Google Scholar]
- 5.Beer TM, Armstrong AJ, Rathkopf DE, Loriot Y, Sternberg CN, Higano CS, Iversen P, Bhattacharya S, Carles J, Chowdhury S, et al. (2014). Enzalutamide in metastatic prostate cancer before chemotherapy. N Engl J Med 371, 424–433. 10.1056/NEJMoa1405095. [DOI] [PMC free article] [PubMed] [Google Scholar]
- 6.Alumkal JJ, Sun D, Lu E, Beer TM, Thomas GV, Latour E, Aggarwal R, Cetnar J, Ryan CJ, Tabatabaei S, et al. (2020). Transcriptional profiling identifies an androgen receptor activity-low, stemness program associated with enzalutamide resistance. Proc Natl Acad Sci U S A 117, 12315–12323. 10.1073/pnas.1922207117. [DOI] [PMC free article] [PubMed] [Google Scholar]
- 7.Schmidt KT, Huitema ADR, Chau CH, and Figg WD (2021). Resistance to second-generation androgen receptor antagonists in prostate cancer. Nat Rev Urol 18, 209–226. 10.1038/s41585-021-00438-4. [DOI] [PubMed] [Google Scholar]
- 8.Faubert B, Solmonson A, and DeBerardinis RJ (2020). Metabolic reprogramming and cancer progression. Science 368. 10.1126/science.aaw5473. [DOI] [PMC free article] [PubMed] [Google Scholar]
- 9.Bader DA, Hartig SM, Putluri V, Foley C, Hamilton MP, Smith EA, Saha PK, Panigrahi A, Walker C, Zong L, et al. (2019). Mitochondrial pyruvate import is a metabolic vulnerability in androgen receptor-driven prostate cancer. Nat Metab 1, 70–85. 10.1038/s42255-018-0002-y. [DOI] [PMC free article] [PubMed] [Google Scholar]
- 10.Choi SYC, Ettinger SL, Lin D, Xue H, Ci X, Nabavi N, Bell RH, Mo F, Gout PW, Fleshner NE, et al. (2018). Targeting MCT4 to reduce lactic acid secretion and glycolysis for treatment of neuroendocrine prostate cancer. Cancer Med 7, 3385–3392. 10.1002/cam4.1587. [DOI] [PMC free article] [PubMed] [Google Scholar]
- 11.Lin C, Blessing AM, Pulliam TL, Shi Y, Wilkenfeld SR, Han JJ, Murray MM, Pham AH, Duong K, Brun SN, et al. (2021). Inhibition of CAMKK2 impairs autophagy and castration-resistant prostate cancer via suppression of AMPK-ULK1 signaling. Oncogene 40, 1690–1705. 10.1038/s41388-021-01658-z. [DOI] [PMC free article] [PubMed] [Google Scholar]
- 12.Massie CE, Lynch A, Ramos-Montoya A, Boren J, Stark R, Fazli L, Warren A, Scott H, Madhu B, Sharma N, et al. (2011). The androgen receptor fuels prostate cancer by regulating central metabolism and biosynthesis. EMBO J 30, 2719–2733. 10.1038/emboj.2011.158. [DOI] [PMC free article] [PubMed] [Google Scholar]
- 13.Priolo C, Pyne S, Rose J, Regan ER, Zadra G, Photopoulos C, Cacciatore S, Schultz D, Scaglia N, McDunn J, et al. (2014). AKT1 and MYC induce distinctive metabolic fingerprints in human prostate cancer. Cancer Res 74, 7198–7204. 10.1158/0008-5472.CAN-14-1490. [DOI] [PMC free article] [PubMed] [Google Scholar]
- 14.Reina-Campos M, Linares JF, Duran A, Cordes T, L’Hermitte A, Badur MG, Bhangoo MS, Thorson PK, Richards A, Rooslid T, et al. (2019). Increased Serine and One-Carbon Pathway Metabolism by PKClambda/iota Deficiency Promotes Neuroendocrine Prostate Cancer. Cancer Cell 35, 385–400 e389. 10.1016/j.ccell.2019.01.018. [DOI] [PMC free article] [PubMed] [Google Scholar]
- 15.Xu L, Yin Y, Li Y, Chen X, Chang Y, Zhang H, Liu J, Beasley J, McCaw P, Zhang H, et al. (2021). A glutaminase isoform switch drives therapeutic resistance and disease progression of prostate cancer. Proc Natl Acad Sci U S A 118. 10.1073/pnas.2012748118. [DOI] [PMC free article] [PubMed] [Google Scholar]
- 16.Zadra G, Ribeiro CF, Chetta P, Ho Y, Cacciatore S, Gao X, Syamala S, Bango C, Photopoulos C, Huang Y, et al. (2019). Inhibition of de novo lipogenesis targets androgen receptor signaling in castration-resistant prostate cancer. Proc Natl Acad Sci U S A 116, 631–640. 10.1073/pnas.1808834116. [DOI] [PMC free article] [PubMed] [Google Scholar]
- 17.Basu HS, Wilganowski N, Robertson S, Reuben JM, Cohen EN, Zurita A, Ramachandran S, Xiao LC, Titus M, and Wilding G (2021). Prostate cancer cells survive anti-androgen and mitochondrial metabolic inhibitors by modulating glycolysis and mitochondrial metabolic activities. Prostate 81, 799–811. 10.1002/pros.24146. [DOI] [PMC free article] [PubMed] [Google Scholar]
- 18.Rajan P, Sudbery IM, Villasevil ME, Mui E, Fleming J, Davis M, Ahmad I, Edwards J, Sansom OJ, Sims D, et al. (2014). Next-generation sequencing of advanced prostate cancer treated with androgen-deprivation therapy. Eur Urol 66, 32–39. 10.1016/j.eururo.2013.08.011. [DOI] [PMC free article] [PubMed] [Google Scholar]
- 19.Bishop JL, Thaper D, Vahid S, Davies A, Ketola K, Kuruma H, Jama R, Nip KM, Angeles A, Johnson F, et al. (2017). The Master Neural Transcription Factor BRN2 Is an Androgen Receptor-Suppressed Driver of Neuroendocrine Differentiation in Prostate Cancer. Cancer Discov 7, 54–71. 10.1158/2159-8290.CD-15-1263. [DOI] [PubMed] [Google Scholar]
- 20.Divakaruni AS, Paradyse A, Ferrick DA, Murphy AN, and Jastroch M (2014). Analysis and interpretation of microplate-based oxygen consumption and pH data. Methods Enzymol 547, 309–354. 10.1016/B978-0-12-801415-8.00016-3. [DOI] [PubMed] [Google Scholar]
- 21.Jones AE, Sheng L, Acevedo A, Veliova M, Shirihai OS, Stiles L, and Divakaruni AS (2021). Forces, fluxes, and fuels: tracking mitochondrial metabolism by integrating measurements of membrane potential, respiration, and metabolites. Am J Physiol Cell Physiol 320, C80–C91. 10.1152/ajpcell.00235.2020. [DOI] [PMC free article] [PubMed] [Google Scholar]
- 22.Desousa BR, Kim KK, Jones AE, Ball AB, Hsieh WY, Swain P, Morrow DH, Brownstein AJ, Ferrick DA, Shirihai OS, et al. (2023). Calculation of ATP production rates using the Seahorse XF Analyzer. EMBO Rep, e56380. 10.15252/embr.202256380. [DOI] [PMC free article] [PubMed] [Google Scholar]
- 23.Molina JR, Sun Y, Protopopova M, Gera S, Bandi M, Bristow C, McAfoos T, Morlacchi P, Ackroyd J, Agip AA, et al. (2018). An inhibitor of oxidative phosphorylation exploits cancer vulnerability. Nat Med 24, 1036–1046. 10.1038/s41591-018-0052-4. [DOI] [PubMed] [Google Scholar]
- 24.He L, and Wondisford FE (2015). Metformin action: concentrations matter. Cell Metab 21, 159–162. 10.1016/j.cmet.2015.01.003. [DOI] [PubMed] [Google Scholar]
- 25.Palanisamy N, Yang J, Shepherd PDA, Li-Ning-Tapia EM, Labanca E, Manyam GC, Ravoori MK, Kundra V, Araujo JC, Efstathiou E, et al. (2020). The MD Anderson Prostate Cancer Patient-derived Xenograft Series (MDA PCa PDX) Captures the Molecular Landscape of Prostate Cancer and Facilitates Marker-driven Therapy Development. Clin Cancer Res 26, 4933–4946. 10.1158/1078-0432.CCR-20-0479. [DOI] [PMC free article] [PubMed] [Google Scholar]
- 26.Gomes LC, Di Benedetto G, and Scorrano L (2011). During autophagy mitochondria elongate, are spared from degradation and sustain cell viability. Nat Cell Biol 13, 589–598. 10.1038/ncb2220. [DOI] [PMC free article] [PubMed] [Google Scholar]
- 27.Petcherski A, Trudeau KM, Wolf DM, Segawa M, Lee J, Taddeo EP, Deeney JT, and Liesa M (2018). Elamipretide Promotes Mitophagosome Formation and Prevents Its Reduction Induced by Nutrient Excess in INS1 beta-cells. J Mol Biol 430, 4823–4833. 10.1016/j.jmb.2018.10.020. [DOI] [PMC free article] [PubMed] [Google Scholar]
- 28.Mishra P, and Chan DC (2016). Metabolic regulation of mitochondrial dynamics. J Cell Biol 212, 379–387. 10.1083/jcb.201511036. [DOI] [PMC free article] [PubMed] [Google Scholar]
- 29.Lee YG, Nam Y, Shin KJ, Yoon S, Park WS, Joung JY, Seo JK, Jang J, Lee S, Nam D, et al. (2020). Androgen-induced expression of DRP1 regulates mitochondrial metabolic reprogramming in prostate cancer. Cancer Lett 471, 72–87. 10.1016/j.canlet.2019.12.017. [DOI] [PubMed] [Google Scholar]
- 30.Davies A, Nouruzi S, Ganguli D, Namekawa T, Thaper D, Linder S, Karaoglanoglu F, Omur ME, Kim S, Kobelev M, et al. (2021). An androgen receptor switch underlies lineage infidelity in treatment-resistant prostate cancer. Nat Cell Biol 23, 1023–1034. 10.1038/s41556-021-00743-5. [DOI] [PMC free article] [PubMed] [Google Scholar]
- 31.Rambold AS, Kostelecky B, Elia N, and Lippincott-Schwartz J (2011). Tubular network formation protects mitochondria from autophagosomal degradation during nutrient starvation. Proc Natl Acad Sci U S A 108, 10190–10195. 10.1073/pnas.1107402108. [DOI] [PMC free article] [PubMed] [Google Scholar]
- 32.Long X, Hou H, Wang X, Liu S, Diao T, Lai S, Hu M, Zhang S, Liu M, and Zhang H (2020). Immune signature driven by ADT-induced immune microenvironment remodeling in prostate cancer is correlated with recurrence-free survival and immune infiltration. Cell Death Dis 11, 779. 10.1038/s41419-020-02973-1. [DOI] [PMC free article] [PubMed] [Google Scholar]
- 33.Wilkinson S, Ye H, Karzai F, Harmon SA, Terrigino NT, VanderWeele DJ, Bright JR, Atway R, Trostel SY, Carrabba NV, et al. (2021). Nascent Prostate Cancer Heterogeneity Drives Evolution and Resistance to Intense Hormonal Therapy. Eur Urol 80, 746–757. 10.1016/j.eururo.2021.03.009. [DOI] [PMC free article] [PubMed] [Google Scholar]
- 34.Stine ZE, Walton ZE, Altman BJ, Hsieh AL, and Dang CV (2015). MYC, Metabolism, and Cancer. Cancer Discov 5, 1024–1039. 10.1158/2159-8290.CD-15-0507. [DOI] [PMC free article] [PubMed] [Google Scholar]
- 35.Gao L, Schwartzman J, Gibbs A, Lisac R, Kleinschmidt R, Wilmot B, Bottomly D, Coleman I, Nelson P, McWeeney S, and Alumkal J (2013). Androgen receptor promotes ligand-independent prostate cancer progression through c-Myc upregulation. PLoS One 8, e63563. 10.1371/journal.pone.0063563. [DOI] [PMC free article] [PubMed] [Google Scholar]
- 36.Akamatsu S, Wyatt AW, Lin D, Lysakowski S, Zhang F, Kim S, Tse C, Wang K, Mo F, Haegert A, et al. (2015). The Placental Gene PEG10 Promotes Progression of Neuroendocrine Prostate Cancer. Cell Rep 12, 922–936. 10.1016/j.celrep.2015.07.012. [DOI] [PubMed] [Google Scholar]
- 37.Ku SY, Rosario S, Wang Y, Mu P, Seshadri M, Goodrich ZW, Goodrich MM, Labbe DP, Gomez EC, Wang J, et al. (2017). Rb1 and Trp53 cooperate to suppress prostate cancer lineage plasticity, metastasis, and antiandrogen resistance. Science 355, 78–83. 10.1126/science.aah4199. [DOI] [PMC free article] [PubMed] [Google Scholar]
- 38.Guo H, Ci X, Ahmed M, Hua JT, Soares F, Lin D, Puca L, Vosoughi A, Xue H, Li E, et al. (2019). ONECUT2 is a driver of neuroendocrine prostate cancer. Nat Commun 10, 278. 10.1038/s41467-018-08133-6. [DOI] [PMC free article] [PubMed] [Google Scholar]
- 39.Aggarwal R, Huang J, Alumkal JJ, Zhang L, Feng FY, Thomas GV, Weinstein AS, Friedl V, Zhang C, Witte ON, et al. (2018). Clinical and Genomic Characterization of Treatment-Emergent Small-Cell Neuroendocrine Prostate Cancer: A Multi-institutional Prospective Study. J Clin Oncol 36, 2492–2503. 10.1200/JCO.2017.77.6880. [DOI] [PMC free article] [PubMed] [Google Scholar]
- 40.Beltran H, Prandi D, Mosquera JM, Benelli M, Puca L, Cyrta J, Marotz C, Giannopoulou E, Chakravarthi BV, Varambally S, et al. (2016). Divergent clonal evolution of castration-resistant neuroendocrine prostate cancer. Nat Med 22, 298–305. 10.1038/nm.4045. [DOI] [PMC free article] [PubMed] [Google Scholar]
- 41.Westbrook TC, Guan X, Rodansky E, Flores D, Liu CJ, Udager AM, Patel RA, Haffner MC, Hu YM, Sun D, et al. (2022). Transcriptional profiling of matched patient biopsies clarifies molecular determinants of enzalutamide-induced lineage plasticity. Nat Commun 13, 5345. 10.1038/s41467-022-32701-6. [DOI] [PMC free article] [PubMed] [Google Scholar]
- 42.Mukhopadhyay S, Goswami D, Adiseshaiah PP, Burgan W, Yi M, Guerin TM, Kozlov SV, Nissley DV, and McCormick F (2020). Undermining Glutaminolysis Bolsters Chemotherapy While NRF2 Promotes Chemoresistance in KRAS-Driven Pancreatic Cancers. Cancer Res 80, 1630–1643. 10.1158/0008-5472.CAN-19-1363. [DOI] [PMC free article] [PubMed] [Google Scholar]
- 43.Evans KW, Yuca E, Scott SS, Zhao M, Paez Arango N, Cruz Pico CX, Saridogan T, Shariati M, Class CA, Bristow CA, et al. (2021). Oxidative Phosphorylation Is a Metabolic Vulnerability in Chemotherapy-Resistant Triple-Negative Breast Cancer. Cancer Res 81, 5572–5581. 10.1158/0008-5472.CAN-20-3242. [DOI] [PMC free article] [PubMed] [Google Scholar]
- 44.Zhou W, Yao Y, Scott AJ, Wilder-Romans K, Dresser JJ, Werner CK, Sun H, Pratt D, Sajjakulnukit P, Zhao SG, et al. (2020). Purine metabolism regulates DNA repair and therapy resistance in glioblastoma. Nat Commun 11, 3811. 10.1038/s41467-020-17512-x. [DOI] [PMC free article] [PubMed] [Google Scholar]
- 45.Li J, Huang Q, Long X, Guo X, Sun X, Jin X, Li Z, Ren T, Yuan P, Huang X, et al. (2017). Mitochondrial elongation-mediated glucose metabolism reprogramming is essential for tumour cell survival during energy stress. Oncogene 36, 4901–4912. 10.1038/onc.2017.98. [DOI] [PubMed] [Google Scholar]
- 46.Baek ML, Lee J, Pendleton KE, Berner MJ, Goff EB, Tan L, Martinez SA, Wang T, Meyer MD, Lim B, et al. (2022). Mitochondrial structure and function adaptation in residual triple negative breast cancer cells surviving chemotherapy treatment. bioRxiv, 2022.2002.2025.481996. 10.1101/2022.02.25.481996. [DOI] [PMC free article] [PubMed] [Google Scholar]
- 47.Kong B, Tsuyoshi H, Orisaka M, Shieh DB, Yoshida Y, and Tsang BK (2015). Mitochondrial dynamics regulating chemoresistance in gynecological cancers. Ann N Y Acad Sci 1350, 1–16. 10.1111/nyas.12883. [DOI] [PubMed] [Google Scholar]
- 48.Courtois S, de Luxan-Delgado B, Penin-Peyta L, Royo-Garcia A, Parejo-Alonso B, Jagust P, Alcala S, Rubiolo JA, Sanchez L, Sainz B Jr., et al. (2021). Inhibition of Mitochondrial Dynamics Preferentially Targets Pancreatic Cancer Cells with Enhanced Tumorigenic and Invasive Potential. Cancers (Basel) 13. 10.3390/cancers13040698. [DOI] [PMC free article] [PubMed] [Google Scholar]
- 49.Yu M, Nguyen ND, Huang Y, Lin D, Fujimoto TN, Molkentine JM, Deorukhkar A, Kang Y, San Lucas FA, Fernandes CJ, et al. (2019). Mitochondrial fusion exploits a therapeutic vulnerability of pancreatic cancer. JCI Insight 5. 10.1172/jci.insight.126915. [DOI] [PMC free article] [PubMed] [Google Scholar]
- 50.Hagenbuchner J, Kuznetsov AV, Obexer P, and Ausserlechner MJ (2013). BIRC5/Survivin enhances aerobic glycolysis and drug resistance by altered regulation of the mitochondrial fusion/fission machinery. Oncogene 32, 4748–4757. 10.1038/onc.2012.500. [DOI] [PubMed] [Google Scholar]
- 51.Kumar R, Bhat TA, Walsh EM, Chaudhary AK, O’Malley J, Rhim JS, Wang J, Morrison CD, Attwood K, Bshara W, et al. (2019). Cytochrome c Deficiency Confers Apoptosome and Mitochondrial Dysfunction in African-American Men with Prostate Cancer. Cancer Res 79, 1353–1368. 10.1158/0008-5472.CAN-18-2383. [DOI] [PMC free article] [PubMed] [Google Scholar]
- 52.Qiu X, Boufaied N, Hallal T, Feit A, de Polo A, Luoma AM, Alahmadi W, Larocque J, Zadra G, Xie Y, et al. (2022). MYC drives aggressive prostate cancer by disrupting transcriptional pause release at androgen receptor targets. Nat Commun 13, 2559. 10.1038/s41467-022-30257-z. [DOI] [PMC free article] [PubMed] [Google Scholar]
- 53.Bernard D, Pourtier-Manzanedo A, Gil J, and Beach DH (2003). Myc confers androgen-independent prostate cancer cell growth. J Clin Invest 112, 1724–1731. 10.1172/JCI19035. [DOI] [PMC free article] [PubMed] [Google Scholar]
- 54.Berger A, Brady NJ, Bareja R, Robinson B, Conteduca V, Augello MA, Puca L, Ahmed A, Dardenne E, Lu X, et al. (2019). N-Myc-mediated epigenetic reprogramming drives lineage plasticity in advanced prostate cancer. J Clin Invest 129, 3924–3940. 10.1172/JCI127961. [DOI] [PMC free article] [PubMed] [Google Scholar]
- 55.Dardenne E, Beltran H, Benelli M, Gayvert K, Berger A, Puca L, Cyrta J, Sboner A, Noorzad Z, MacDonald T, et al. (2016). N-Myc Induces an EZH2-Mediated Transcriptional Program Driving Neuroendocrine Prostate Cancer. Cancer Cell 30, 563–577. 10.1016/j.ccell.2016.09.005. [DOI] [PMC free article] [PubMed] [Google Scholar]
- 56.Mossa F, Robesti D, Sumankalai R, Corey E, Titus M, Kang Y, Zhang J, Briganti A, Montorsi F, Vellano CP, et al. (2023). Subtype and Site Specific-Induced Metabolic Vulnerabilities in Prostate Cancer. Mol Cancer Res 21, 51–61. 10.1158/1541-7786.MCR-22-0250. [DOI] [PMC free article] [PubMed] [Google Scholar]
- 57.Nobes JP, Langley SE, Klopper T, Russell-Jones D, and Laing RW (2012). A prospective, randomized pilot study evaluating the effects of metformin and lifestyle intervention on patients with prostate cancer receiving androgen deprivation therapy. BJU Int 109, 1495–1502. 10.1111/j.1464-410X.2011.10555.x. [DOI] [PubMed] [Google Scholar]
- 58.Ahn HK, Lee YH, and Koo KC (2020). Current Status and Application of Metformin for Prostate Cancer: A Comprehensive Review. Int J Mol Sci 21. 10.3390/ijms21228540. [DOI] [PMC free article] [PubMed] [Google Scholar]
- 59.Hess C, Unger M, Madea B, Stratmann B, and Tschoepe D (2018). Range of therapeutic metformin concentrations in clinical blood samples and comparison to a forensic case with death due to lactic acidosis. Forensic Sci Int 286, 106–112. 10.1016/j.forsciint.2018.03.003. [DOI] [PubMed] [Google Scholar]
- 60.Demir U, Koehler A, Schneider R, Schweiger S, and Klocker H (2014). Metformin anti-tumor effect via disruption of the MID1 translational regulator complex and AR downregulation in prostate cancer cells. BMC Cancer 14, 52. 10.1186/1471-2407-14-52. [DOI] [PMC free article] [PubMed] [Google Scholar]
- 61.Ben Sahra I, Laurent K, Loubat A, Giorgetti-Peraldi S, Colosetti P, Auberger P, Tanti JF, Le Marchand-Brustel Y, and Bost F (2008). The antidiabetic drug metformin exerts an antitumoral effect in vitro and in vivo through a decrease of cyclin D1 level. Oncogene 27, 3576–3586. 10.1038/sj.onc.1211024. [DOI] [PubMed] [Google Scholar]
- 62.Colquhoun AJ, Venier NA, Vandersluis AD, Besla R, Sugar LM, Kiss A, Fleshner NE, Pollak M, Klotz LH, and Venkateswaran V (2012). Metformin enhances the antiproliferative and apoptotic effect of bicalutamide in prostate cancer. Prostate Cancer Prostatic Dis 15, 346–352. 10.1038/pcan.2012.16. [DOI] [PubMed] [Google Scholar]
- 63.Yap TA, Daver N, Mahendra M, Zhang J, Kamiya-Matsuoka C, Meric-Bernstam F, Kantarjian HM, Ravandi F, Collins ME, Francesco MED, et al. (2023). Complex I inhibitor of oxidative phosphorylation in advanced solid tumors and acute myeloid leukemia: phase I trials. Nat Med 29, 115–126. 10.1038/s41591-022-02103-8. [DOI] [PMC free article] [PubMed] [Google Scholar]
- 64.Stoyanova T, Cooper AR, Drake JM, Liu X, Armstrong AJ, Pienta KJ, Zhang H, Kohn DB, Huang J, Witte ON, and Goldstein AS (2013). Prostate cancer originating in basal cells progresses to adenocarcinoma propagated by luminal-like cells. Proc Natl Acad Sci U S A 110, 20111–20116. 10.1073/pnas.1320565110. [DOI] [PMC free article] [PubMed] [Google Scholar]
- 65.Klein KA, Reiter RE, Redula J, Moradi H, Zhu XL, Brothman AR, Lamb DJ, Marcelli M, Belldegrun A, Witte ON, and Sawyers CL (1997). Progression of metastatic human prostate cancer to androgen independence in immunodeficient SCID mice. Nat Med 3, 402–408. 10.1038/nm0497-402. [DOI] [PubMed] [Google Scholar]
- 66.Godar S, Ince TA, Bell GW, Feldser D, Donaher JL, Bergh J, Liu A, Miu K, Watnick RS, Reinhardt F, et al. (2008). Growth-inhibitory and tumor- suppressive functions of p53 depend on its repression of CD44 expression. Cell 134, 62–73. 10.1016/j.cell.2008.06.006. [DOI] [PMC free article] [PubMed] [Google Scholar]
- 67.Ramirez F, Ryan DP, Gruning B, Bhardwaj V, Kilpert F, Richter AS, Heyne S, Dundar F, and Manke T (2016). deepTools2: a next generation web server for deep-sequencing data analysis. Nucleic Acids Res 44, W160–165. 10.1093/nar/gkw257. [DOI] [PMC free article] [PubMed] [Google Scholar]
- 68.Krueger F, and Andrews SR (2011). Bismark: a flexible aligner and methylation caller for Bisulfite-Seq applications. Bioinformatics 27, 1571–1572. 10.1093/bioinformatics/btr167. [DOI] [PMC free article] [PubMed] [Google Scholar]
- 69.Pang Z, Chong J, Zhou G, de Lima Morais DA, Chang L, Barrette M, Gauthier C, Jacques PE, Li S, and Xia J (2021). MetaboAnalyst 5.0: narrowing the gap between raw spectra and functional insights. Nucleic Acids Res 49, W388–W396. 10.1093/nar/gkab382. [DOI] [PMC free article] [PubMed] [Google Scholar]
- 70.Kamentsky L, Jones TR, Fraser A, Bray MA, Logan DJ, Madden KL, Ljosa V, Rueden C, Eliceiri KW, and Carpenter AE (2011). Improved structure, function and compatibility for CellProfiler: modular high-throughput image analysis software. Bioinformatics 27, 1179–1180. 10.1093/bioinformatics/btr095. [DOI] [PMC free article] [PubMed] [Google Scholar]
- 71.Huang da W, Sherman BT, and Lempicki RA (2009). Systematic and integrative analysis of large gene lists using DAVID bioinformatics resources. Nat Protoc 4, 44–57. 10.1038/nprot.2008.211. [DOI] [PubMed] [Google Scholar]
- 72.Huang da W, Sherman BT, and Lempicki RA (2009). Bioinformatics enrichment tools: paths toward the comprehensive functional analysis of large gene lists. Nucleic Acids Res 37, 1–13. 10.1093/nar/gkn923. [DOI] [PMC free article] [PubMed] [Google Scholar]
- 73.Subramanian A, Tamayo P, Mootha VK, Mukherjee S, Ebert BL, Gillette MA, Paulovich A, Pomeroy SL, Golub TR, Lander ES, and Mesirov JP (2005). Gene set enrichment analysis: a knowledge-based approach for interpreting genome-wide expression profiles. Proc Natl Acad Sci U S A 102, 15545–15550. 10.1073/pnas.0506580102. [DOI] [PMC free article] [PubMed] [Google Scholar]
- 74.Mootha VK, Lindgren CM, Eriksson KF, Subramanian A, Sihag S, Lehar J, Puigserver P, Carlsson E, Ridderstrale M, Laurila E, et al. (2003). PGC-1alpha-responsive genes involved in oxidative phosphorylation are coordinately downregulated in human diabetes. Nat Genet 34, 267–273. 10.1038/ng1180. [DOI] [PubMed] [Google Scholar]
- 75.Dobin A, Davis CA, Schlesinger F, Drenkow J, Zaleski C, Jha S, Batut P, Chaisson M, and Gingeras TR (2013). STAR: ultrafast universal RNA-seq aligner. Bioinformatics 29, 15–21. 10.1093/bioinformatics/bts635. [DOI] [PMC free article] [PubMed] [Google Scholar]
- 76.Cordes T, and Metallo CM (2019). Quantifying Intermediary Metabolism and Lipogenesis in Cultured Mammalian Cells Using Stable Isotope Tracing and Mass Spectrometry. Methods Mol Biol 1978, 219–241. 10.1007/978-1-4939-9236-2_14. [DOI] [PubMed] [Google Scholar]
- 77.Trefely S, Ashwell P, and Snyder NW (2016). FluxFix: automatic isotopologue normalization for metabolic tracer analysis. BMC Bioinformatics 17, 485. 10.1186/s12859-016-1360-7. [DOI] [PMC free article] [PubMed] [Google Scholar]
- 78.Desousa BR, Kim KKO, Hsieh WY, Jones AE, Swain P, Morrow DH, Ferrick DA, Shirihai OS, Neilson A, Nathanson DA, et al. (2022). Calculating ATP production rates from oxidative phosphorylation and glycolysis during cell activation. bioRxiv, 2022.2004.2016.488523. 10.1101/2022.04.16.488523. [DOI] [Google Scholar]
- 79.Zhang A, Zhao JC, Kim J, Fong KW, Yang YA, Chakravarti D, Mo YY, and Yu J (2015). LncRNA HOTAIR Enhances the Androgen-Receptor-Mediated Transcriptional Program and Drives Castration-Resistant Prostate Cancer. Cell Rep 13, 209–221. 10.1016/j.celrep.2015.08.069. [DOI] [PMC free article] [PubMed] [Google Scholar]
- 80.Robinson JT, Thorvaldsdottir H, Winckler W, Guttman M, Lander ES, Getz G, and Mesirov JP (2011). Integrative genomics viewer. Nat Biotechnol 29, 24–26. 10.1038/nbt.1754. [DOI] [PMC free article] [PubMed] [Google Scholar]
- 81.Yegnasubramanian S, Lin X, Haffner MC, DeMarzo AM, and Nelson WG (2006). Combination of methylated-DNA precipitation and methylation-sensitive restriction enzymes (COMPARE-MS) for the rapid, sensitive and quantitative detection of DNA methylation. Nucleic Acids Res 34, e19. 10.1093/nar/gnj022. [DOI] [PMC free article] [PubMed] [Google Scholar]
- 82.Chambers MC, Maclean B, Burke R, Amodei D, Ruderman DL, Neumann S, Gatto L, Fischer B, Pratt B, Egertson J, et al. (2012). A cross-platform toolkit for mass spectrometry and proteomics. Nat Biotechnol 30, 918–920. 10.1038/nbt.2377. [DOI] [PMC free article] [PubMed] [Google Scholar]
- 83.Pluskal T, Castillo S, Villar-Briones A, and Oresic M (2010). MZmine 2: modular framework for processing, visualizing, and analyzing mass spectrometry-based molecular profile data. BMC Bioinformatics 11, 395. 10.1186/1471-2105-11-395. [DOI] [PMC free article] [PubMed] [Google Scholar]
- 84.Myers OD, Sumner SJ, Li S, Barnes S, and Du X (2017). One Step Forward for Reducing False Positive and False Negative Compound Identifications from Mass Spectrometry Metabolomics Data: New Algorithms for Constructing Extracted Ion Chromatograms and Detecting Chromatographic Peaks. Anal Chem 89, 8696–8703. 10.1021/acs.analchem.7b00947. [DOI] [PubMed] [Google Scholar]
- 85.Su X, Lu W, and Rabinowitz JD (2017). Metabolite Spectral Accuracy on Orbitraps. Anal Chem 89, 5940–5948. 10.1021/acs.analchem.7b00396. [DOI] [PMC free article] [PubMed] [Google Scholar]
- 86.Drost J, Karthaus WR, Gao D, Driehuis E, Sawyers CL, Chen Y, and Clevers H (2016). Organoid culture systems for prostate epithelial and cancer tissue. Nat Protoc 11, 347–358. 10.1038/nprot.2016.006. [DOI] [PMC free article] [PubMed] [Google Scholar]
- 87.Chen S, Zhou Y, Chen Y, and Gu J (2018). fastp: an ultra-fast all-in-one FASTQ preprocessor. Bioinformatics 34, i884–i890. 10.1093/bioinformatics/bty560. [DOI] [PMC free article] [PubMed] [Google Scholar]
- 88.Ewels P, Magnusson M, Lundin S, and Kaller M (2016). MultiQC: summarize analysis results for multiple tools and samples in a single report. Bioinformatics 32, 3047–3048. 10.1093/bioinformatics/btw354. [DOI] [PMC free article] [PubMed] [Google Scholar]
- 89.Bray NL, Pimentel H, Melsted P, and Pachter L (2016). Near-optimal probabilistic RNA-seq quantification. Nat Biotechnol 34, 525–527. 10.1038/nbt.3519. [DOI] [PubMed] [Google Scholar]
- 90.Love MI, Huber W, and Anders S (2014). Moderated estimation of fold change and dispersion for RNA-seq data with DESeq2. Genome Biol 15, 550. 10.1186/s13059-014-0550-8. [DOI] [PMC free article] [PubMed] [Google Scholar]
- 91.P’ng C, Green J, Chong LC, Waggott D, Prokopec SD, Shamsi M, Nguyen F, Mak DYF, Lam F, Albuquerque MA, et al. (2019). BPG: Seamless, automated and interactive visualization of scientific data. BMC Bioinformatics 20, 42. 10.1186/s12859-019-2610-2. [DOI] [PMC free article] [PubMed] [Google Scholar]
- 92.Quigley DA, Dang HX, Zhao SG, Lloyd P, Aggarwal R, Alumkal JJ, Foye A, Kothari V, Perry MD, Bailey AM, et al. (2018). Genomic Hallmarks and Structural Variation in Metastatic Prostate Cancer. Cell 174, 758–769 e759. 10.1016/j.cell.2018.06.039. [DOI] [PMC free article] [PubMed] [Google Scholar]
- 93.Sud M, Fahy E, Cotter D, Azam K, Vadivelu I, Burant C, Edison A, Fiehn O, Higashi R, Nair KS, et al. (2016). Metabolomics Workbench: An international repository for metabolomics data and metadata, metabolite standards, protocols, tutorials and training, and analysis tools. Nucleic Acids Res 44, D463–470. 10.1093/nar/gkv1042. [DOI] [PMC free article] [PubMed] [Google Scholar]
Associated Data
This section collects any data citations, data availability statements, or supplementary materials included in this article.
Supplementary Materials
Supplementary Table 1. KEGG PATHWAY analysis: Rajan et al. Top 30 significantly enriched pathways
Supplementary Table 2. KEGG PATHWAY analysis: 16D cells Top 30 significantly enriched pathways
Data Availability Statement
RNA sequencing data that support the findings of this study have been deposited in NCBI’s Gene Expression Omnibus and are accessible through GEO Series accession numbers GSE202885, GSE202755, and GSE202897. Metabolomics data that support the findings of this study have been deposited in the National Metabolomics Data Repository93 and are accessible through Study IDs ST002852, ST002859, ST002860, ST002856, ST002863, ST002864, and ST002865. Previously published ChIP sequencing data that was reanalyzed here is available under accession number GSE138460.
Code for generating PCA projection plots can be found at https://github.com/Nick-Nunley/PCA-for-AR-induced-metabolic-reprogramming-in-CRPCa
Any additional information required to reanalyze the data reported in this work paper is available from the lead contact upon request.