

Abstract
Purpose:
The standard of care for locally advanced, human epidermal growth factor receptor 2 positive (HER2+) breast cancer includes neoadjuvant chemotherapy with docetaxel, carboplatin, trastuzumab, and pertuzumab (TCHP). Many patients do not receive the full course of therapy due to various complications, possibly affecting the potential to achieve a pathologic complete response (pCR). The amount of therapy received is typically measured by relative dose intensity (RDI). This study aimed to evaluate pCR rates in patients receiving optimal and suboptimal RDI TCHP.
Methods:
This study was a retrospective chart review of patients treated between 2014 and 2021 at UK HealthCare. Patients included were 18 years of age or older with HER2+ breast cancer and received at least one cycle of neoadjuvant TCHP. The primary objective compared pCR rates in patients receiving≥85% RDI or <85% RDI. Secondary objectives included pCR rates based on clinical stage, age, body mass index, or hormone receptor status; factors leading to discontinuation or delay in treatment; and impact of dose reductions and delays on pCR.
Results:
A total of 101 patients were included and divided into two cohorts: 54 patients received≥85% RDI and 47 patients received <85% RDI. Patients who received≥85% total RDI had an approximate increase of 17% in pCR rates (59.3% vs 42.6%, p=0.11). Additionally, 82% of patients experienced a dose delay or adjustment.
Conclusions:
Patients who received≥85% RDI had increased pCR rates compared to patients receiving <85% RDI. A larger patient population is needed to formulate definitive conclusions on the impact of RDI and pCR rates.
Keywords: HER2+ breast cancer, chemotherapy, relative dose intensity, monoclonal antibody
Introduction
Breast cancer is the most common cancer diagnosed in women and the second leading cause of cancer-related death. Human epidermal growth factor receptor 2 positive (HER2+) breast cancer accounts for approximately 15–20% of all diagnosed breast cancers and is considered a negative prognostic factor for survival.1 However, the introduction of anti-HER2 treatments, including trastuzumab and pertuzumab, changed the course and survival of this disease. The current standard of care for early stage, locally advanced, HER2+ breast cancer includes neoadjuvant chemotherapy with docetaxel, carboplatin, trastuzumab, and pertuzumab (TCHP), followed by surgery and adjuvant targeted therapy for at least 1 year.2 Primary studies for this regimen have measured success by the rate of pathologic complete response (pCR), defined as the absence of invasive tumor in the breast and lymph nodes at the time of surgery, which is an accepted surrogate endpoint for survival in this population.3 It has been demonstrated patients who attain pCR have improved rates of event-free and overall survival.4 The TRYPHAENA trial, a study evaluating the cardiac safety of six cycles of TCHP in comparison to standard chemotherapy in the neoadjuvant setting, demonstrated a pCR rate of 66.2% in the TCHP cohort. Despite the emergence of targeted anti-HER2 treatments, many patients do not receive the full dose or full course of neoadjuvant therapy due to various toxicities and complications.5 Reductions in standard chemotherapy regimens typically occur due to a myriad of factors—including performance status and adverse events. These reductions are generally correlated with an increased risk of disease progression and worsened overall survival.6 Moreover, the amount of therapy a patient receives in a standard regimen is typically measured by the relative dose intensity (RDI). The RDI is defined as the ratio of the received dose intensity to the planned dose intensity, measured as the amount of drug delivered over time. RDI is directly impacted by dose delays (impacting the unit of time) and dose reductions (impacting the amount of drug delivered).7 It has been demonstrated in previous studies that breast cancer patients receiving greater than 85% of planned doses of traditional chemotherapy have higher pCR rates and improved outcomes.8,9 However, the agents included in these studies are older and no longer commonly utilized in the neoadjuvant setting.
At University of Kentucky (UK) HealthCare, most patients with stage II-III HER2+ breast cancer who are deemed surgical candidates receive six cycles of neoadjuvant TCHP, followed by surgical intervention, then adjuvant targeted therapy to complete 1 year. However, many patients do not receive the full course of therapy due to various toxicities and complications. Achievement of a pCR is variable, and anecdotally not well correlated with the amount of neoadjuvant therapy received by an individual patient. There is currently no published literature that evaluates the association of RDI of neoadjuvant TCHP and pCR rates. This study aimed to evaluate pCR rates in patients receiving both optimal and suboptimal RDI during neoadjuvant TCHP.
Materials and methods
This study was a single-center, retrospective cohort study of patients treated between 1 January 2014 and 1 September 2021 at the University of Kentucky HealthCare system. Data sources included the Enterprise Data Warehouse, Vizient® database for UK HealthCare, Sunrise Clinical Manager Electronic Medical Record, and Epic Electronic Medical Record. Patient records were reviewed manually to collect demographic information, clinical stage of disease, hormone receptor (HR) status, doses and timing of anti-cancer agents received, and documented complications. Final surgical pathology reports were extracted from Sunrise Clinical Manager and Epic Electronic Medical Record.
Patients aged 18 years and older with HER2+ breast cancer who received at least one cycle of neoadjuvant TCHP followed by surgery at UK Markey Cancer Center and UK Chandler or Good Samaritan Hospital were included in the study. Patients with metastatic disease were excluded. RDI was calculated based on the equations in Figure 1.
Figure 1.

Equations used to calculate relative dose intensity.
Dose reductions were calculated as the dose received divided by the dose prescribed. A dose delay was defined as treatment given longer than 7 days after the scheduled treatment, calculated as treatment weeks planned divided by treatment weeks received. RDI was categorized as being either greater than or equal to 85% or less than 85%. RDI was calculated separately for monoclonal antibodies (mABs) and chemotherapy. The total RDI was calculated by taking the average of mAB RDI and chemotherapy RDI. The primary objective was to determine pCR rates in patients receiving greater than or equal to 85% RDI or less than 85% RDI of neoadjuvant TCHP. PCR was defined as the absence of invasive tumor in the breast and lymph nodes at the time of surgery (ypT0ypN0). Secondary objectives included pCR rates based on clinical stage, age, body mass index (BMI), HR status, administration of growth factor, or administration of a neurokinin-1 receptor (NK1) antagonist; factors leading to discontinuation or delay in treatment; and impact of dose reductions and delays on pCR.
Statistical analysis
Descriptive statistics were utilized to describe baseline characteristics as well as outcomes for the entire sample and by RDI subgroup (≥ 85% vs < 85%). Fisher’s Exact two-sided tests were utilized and reported in Table 1 for nominal data to assess general association. Nominal data were expressed with counts and percentages. The Wilcoxon Rank Sum test was utilized to compare continuous measures such as age, BMI, body surface area (BSA), Eastern Cooperative Oncology Group (ECOG) performance status, and ejection fraction between the two RDI groups of interest. Continuous data were expressed as mean and standard deviation.
Table 1.
Background demographics.
| Patient demographics | Total sample (n=101) | RDI total ≥85% (n=54) | RDI total < 85% (n=47) | P-value |
|---|---|---|---|---|
| Age at diagnosis, mean (SD) | 52.7 (11.9) | 50.0 (11.3) | 55.91 (11.9) | 0.02 |
| BMI, mean (SD) | 29.2 (6.4) | 29.4 (6.8) | 29.0 (5.9) | 0.99 |
| BSA, mean (SD) | 1.8 (0.2) | 1.84 (0.2) | 1.83 (0.2) | 0.86 |
| ECOGa, mean (SD) | 0.17 (0.4) | 0.10 (0.3) | 0.26 (0.5) | 0.08 |
| Baseline ejection fractiona, mean (SD) | 61.5 (6.9) | 61.9 (6.9) | 61.0 (6.9) | 0.48 |
| Menopausal status at diagnosis (n, %) | 0.07 | |||
| Pre-menopausal | 35 (34.7) | 11 (23.4) | ||
| Post-menopausal | 58 (57.4) | 27 (50.0) | 31(66.0) | |
| Unknown | 8 (7.9) | 3 (5.6) | 5 (10.6) | |
| Hormone receptor status (n, %) | 1.00 | |||
| ER/PR+ | 62 (61.4) | 33 (61.1) | 29 (61.7) | |
| ER/PR− | 39 (38.6) | 21 (38.9) | 18 (38.3) | |
| AJCC stage at diagnosis (n, %) | 0.15 | |||
| I | 6 (5.9) | 4 (7.4) | 2 (4.3) | |
| II | 58 (57.4) | 27 (50.0) | 31 (66.0) | |
| III | 17 (16.8) | 13 (24.1) | 4 (8.5) | |
| Unknown | 20 (19.8) | 10 (18.5) | 10 (21.3) | |
| Tumor grade | 0.01 | |||
| 1 | 2 (2.0) | 2 (3.7) | 0 (0) | |
| 2 | 30 (29.7) | 9 (16.7) | 21 (44.7) | |
| 3 | 56 (55.5) | 35 (64.8) | 21 (44.7) | |
| Unknown | 13 (12.9) | 8 (14.8) | 5 (10.6) | |
| Required chemotherapy dose adjustment (n, %) | <0.0001 | |||
| Yes | 77 (76.2) | 31 (57.4) | 46 (97.9) | |
| No | 24 (23.8) | 23 (42.6) | 1 (2.1) | |
| Required chemotherapy dose delay (n, %) | 0.0007 | |||
| Yes | 48 (47.5) | 17 (31.5) | 31 (66.0) | |
| No | 53 (52.5) | 37 (68.5) | 16 (34.0) | |
| Received growth factor (n, %) | 0.10 | |||
| Yes | 38 (37.6) | 16 (29.6) | 22 (46.8) | |
| No | 63 (62.4) | 38 (70.4) | 25 (53.2) | |
| Received NK1 antagonist after toxicity (n, %) | 0.42 | |||
| Yes | 17 (16.8) | 11 (20.4) | 6 (12.8) | |
| No | 84 (83.2) | 43 (79.6) | 41 (87.2) | |
| Pathologic complete response (n, %) | 0.11 | |||
| Yes | 52 (51.5) | 32 (59.3) | 20 (42.6) | |
| No | 49 (48.5) | 22 (40.7) | 27 (57.5) |
RDI, relative dose intensity; NK-1, neurokinin-1 receptor; BSA, body surface area; ECOG, Eastern Cooperative Oncology Group.
92 patients had a non-missing ECOG status, 97 patients had a non-missing ejection fraction measurement.
1 – p-value for continuous variables corresponds to Wilcoxon Rank Sum test comparing the distribution of the patient characteristic between the two RDI groups (<85% vs ≥85%); p-value for categorical patient characteristic variable corresponds to Fisher’s Exact test between group comparison.
Univariable and multiple logistic regressions were used to perform unadjusted as well as adjusted analyses, respectively, for the effect of RDI status on pCR status. The odds ratio was used to measure the magnitude of effect and the 95% confidence interval, and the Wald chi-square p-value was used to assess statistical significance of the measured effect. Covariate adjustments included baseline menopausal status, baseline hormonal status, American Joint Committee on Cancer (AJCC) clinical stage, tumor grade, baseline BMI, baseline age, whether a dose adjustment or a dose delay occurred, receipt of a growth factor, and receipt of an NK1 antagonist. Three covariate-adjusted and saturated logistic models containing 11 covariates each were fit. Each of these three models corresponded to using three separately defined RDI variables. These three RDI variables were defined as (a) an average RDI using two separate RDIs for chemotherapy and mABs, (b) the RDI for chemotherapy only, and (c) the RDI for mABs only. Each of these three were included in the three separate models, with the other 10 covariates also included. The only adjusted logistic model presented was the model with the RDI variable that measured average (chemotherapy and/or mAB therapy) RDI given the other two models yielded results quite similar in interpretation.
There were three nominal covariates that contained missing data that would have resulted in lowering the sample size in these models from n=101 down to n=66. These covariates were menopausal status (n=8 missing values), stage (n=20 missing values), and tumor grade (n=13 missing values). To address this issue, these variables were transformed to three new variables that preserved values that were non-missing but accommodated the inclusion of patient data records whose values were missing by coding them into their own separate “Unknown” category which allowed them to be included in all of the models. This process served to preserve the overall model sample size of n=101.
The overall fit of the full (adjusted) models were assessed using the Breslow-Day test with adequate model fit being characterized by a non-significant (p > 0.05) p-value. This p-value is also reported in Table 2. Additionally, we conducted a post-hoc power analysis based on observed study data for the average RDI variable. These findings are included in the discussion section of this manuscript.
Table 2.
Associations with achieving pathologic complete response.
| Using RDI status: chemo and/or monoclonal antibody | ||||||
|---|---|---|---|---|---|---|
| Unadjusted odds ratio (95% CI; p-value) | Adjusted odds ratiob (95% CI; p-value) | |||||
|
| ||||||
| Covariates | OR | 95% CI | p | OR | 95% CI | p |
| RDI status | 0.14 | |||||
| RDI ≥ 85% | 1.96 | (0.89, 4.34) | 0.09 | 2.51 | (0.74, 8.65) | |
| RDI < 85% | aref | ref | ||||
| Required chemotherapy dose adjustment | 0.91 | |||||
| Yes | 0.70 | (0.28, 1.76) | 0.44 | 1.08 | (0.30, 3.96) | |
| No | ref | ref | ||||
| Required chemotherapy dose delay | 0.46 | |||||
| Yes | 1.05 | (0.48, 2.29) | 0.91 | 1.49 | (0.51, 4.32) | |
| No | ref | ref | ||||
| Menopausal status | ||||||
| Pre-menopausal | ref | ref | ||||
| Post-menopausal | 0.73 | (0.32, 1.70) | 0.47 | 0.67 | (0.13, 3.32) | 0.62 |
| Unknown | 2.53 | (0.45, 14.29) | 0.30 | 1.1 | (0.12, 10.11) | 0.93 |
| HR subtype | 0.0039 | |||||
| ER/PR+ | ref | 0.0016 | ref | |||
| ER/PR− | 4.03 | (1.70, 9.57) | 4.97 | (1.67, 14.76) | ||
| AJCC clinical stage | ||||||
| I | ref | ref | ||||
| II | 2.30 | (0.39, 13.5) | 0.36 | 1.71 | (0.18, 16.33) | 0.64 |
| III | 1.78 | (0.25, 12.45) | 0.56 | 1.41 | (0.12, 16.19) | 0.78 |
| Unknown | 2.44 | (0.36, 16.54) | 0.36 | 2.74 | (0.23, 32.56) | 0.42 |
| Tumor grade | ||||||
| 1 | ref | ref | ||||
| 2 | 0.76 | (0.04, 13.41) | 0.85 | 0.71 | (0.03, 18.35) | 0.84 |
| 3 | 1.24 | (0.07, 20.83) | 0.88 | 0.78 | (0.03, 19.57) | 0.89 |
| Unknown | 1.17 | (0.06, 22.94) | 0.92 | 1.26 | (0.04, 36.66) | 0.89 |
| BMI | 0.35 | |||||
| ≥ 25 kg/m2 | 0.81 | (0.34, 1.93) | 0.64 | 0.61 | (0.21, 1.72) | |
| < 25 kg/m2 | ref | ref | ||||
| Age | 0.64 | |||||
| ≥ 50 years | 0.92 | (0.41, 2.08) | 0.85 | 1.47 | (0.30, 7.20) | |
| < 50 years | ref | ref | ||||
| Received growth factor | 0.28 | |||||
| Yes | 0.54 | (0.24, 1.23) | 0.14 | 0.59 | (0.22, 1.56) | |
| No | ref | ref | ||||
| Received NK1 antagonist after toxicity | 0.99 | |||||
| Yes | 1.07 | (0.38, 3.05) | 0.90 | 0.99 | (0.28, 3.50) | |
| No | ref | ref | ||||
RDI, relative dose intensity; BMI, body mass index; HR, hormone receptor; NK-1, neurokinin-1 receptor; AJCC, American Joint Committee on Cancer; ER/PR, estrogen receptor/progesterone receptor.
Six variables had p-values in the full model that were all above 0.80. Likelihood ratio testing was performed and demonstrated that these six variables could be eliminated from further modeling (chi-square=ab.cdef ; p=0.wxyz). The p-value for the age binary variable in the full model containing 12 covariates as in the table above was also > 0.80, but given the perceived importance of age in the cancer clinical setting, it was kept in the final model. Therefore, the odds ratios and their associated 95% Cis and p-values are based on this final (reduced) model fit.
“ref” in the table indicates reference cell category in computing the odds ratio.
Hosmer-Lemeshow goodness of fit statistic p-value : 0.8184 (shows no lack of fit of the final multivariable logistic model).
Results
A total of 101 patients were included in the study. Patients were categorized into two groups based on whether they received ≥85% total RDI of therapy (n =54) from either chemotherapy or mABs or < 85% RDI of therapy (n=47). Baseline characteristics differed slightly between the groups, as patients in the <85% RDI group were slightly older and had higher ECOG scores (Table 1). The patients in the total study sample were predominantly post-menopausal at diagnosis (57.4%), with most patients characterized as AJCC stage II (57.4%). Most patients were estrogen receptor/progesterone receptor (ER/PR)-positive (61.4% overall; 61.1% vs 61.7% in the ≥85% RDI and <85% RDI group, respectively).
Overall, patients completed an average of five cycles of chemotherapy. The mean doses of docetaxel and carboplatin received were 71 mg/m2 and AUC of 5, respectively. Of the mABs, pertuzumab was the agent most commonly omitted from the regimen as patients received a mean of seven cycles of trastuzumab and five cycles of pertuzumab.
Patients in the < 85% RDI group had higher rates of dose adjustment and dose delays in treatment than patients in the ≥85% group (97.9% vs 57.4% for dose adjustments, 66% vs 31.5% for delays). Roughly 82% of patients in the study group experienced a dose delay or dose adjustment (Figure 2). The most common reason for a delay in treatment or a dose adjustment was diarrhea, which caused a delay or adjustment in 29.7% of patients. Thrombocytopenia and infection were additional common reasons for delay with 25.7% and 18.8% of patients documented, respectively.
Figure 2.

Reasons for dose delay or adjustments.
Results of the primary outcome are shown in Figure 3. Patients who received ≥85% total RDI had an approximate increase of 17% in pCR rates compared to patients who received < 85% RDI of total therapy (59.3% vs 42.6%, p=0.11). For chemotherapy-specific and mAB-specific RDI, pCR rates were increased by 16% (61% vs 45%, p=0.16) and 10% (54.2% vs 44.8%, p=0.51), respectively, in the ≥85% RDI group. Of the patients achieving pCR, 73% experienced a dose adjustment (p=0.49) and 48% experienced a dose delay (p=1.00).
Figure 3.
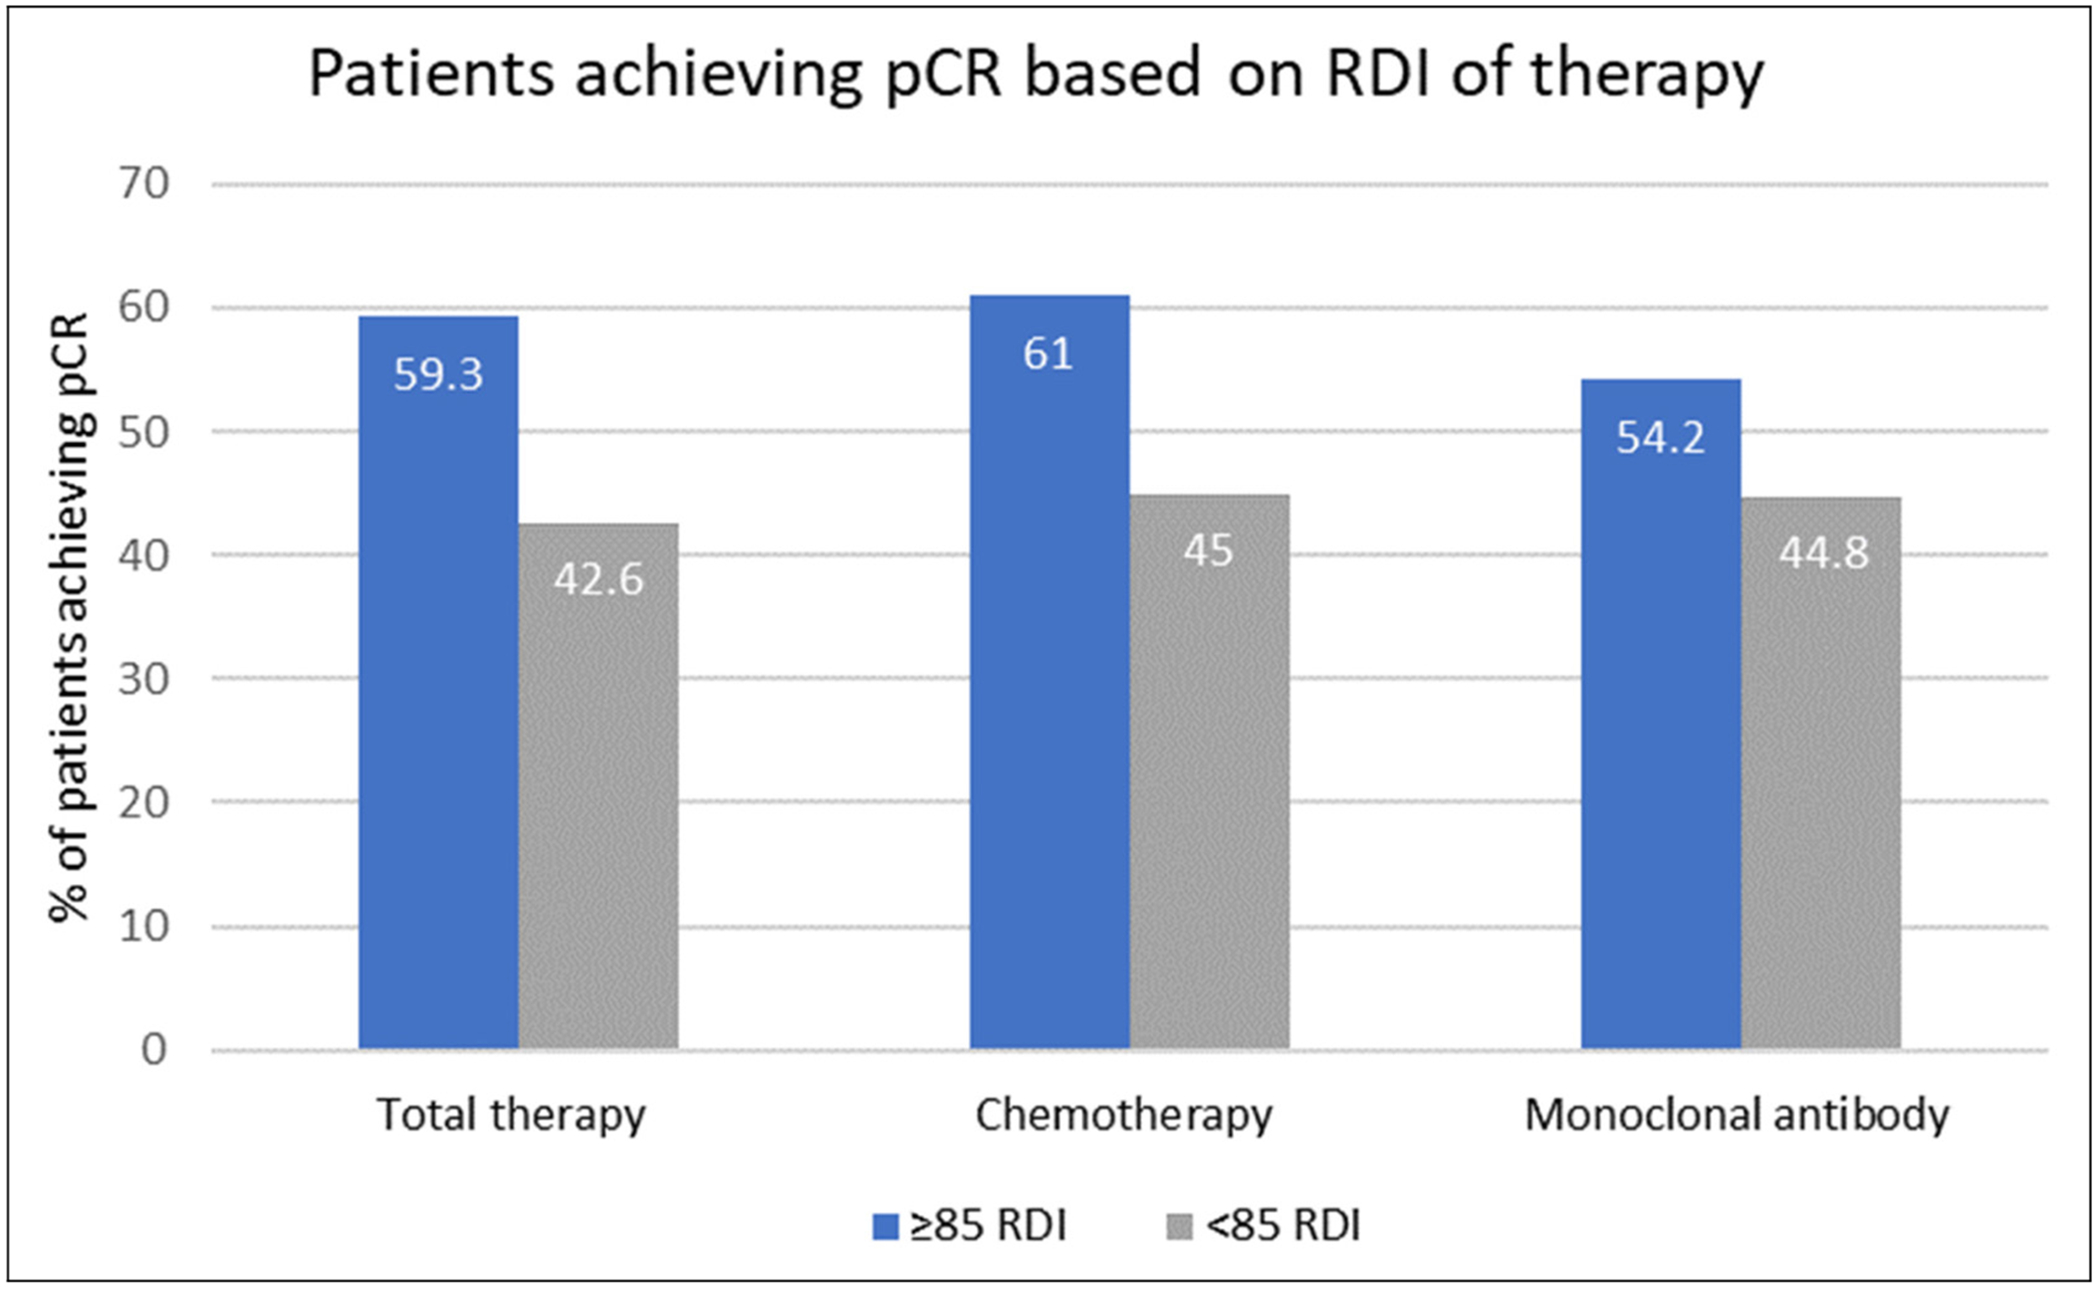
Percent of patients achieving pCR based on RDI. RDI, relative dose intensity; pCR, pathologic complete response.
Univariable and multiple logistic regressions examining the correlation between the selected variables and pCR status are shown in Table 2. There were no statistically significant relationships between pCR rates and dose adjustment/delays, menopausal status, AJCC clinical stage, tumor grade, BMI, age, or administration of growth factor or NK1 antagonist. RDI status demonstrated a trend toward possible association with pCR (OR = 1.96, 95% CI [0.89, 4.34]).
Discussion
This study evaluates the association between RDI and pCR in patients receiving neoadjuvant TCHP for early stage, locally advanced HER2+breast cancer. The amount of therapy a patient needs to receive in order to achieve a pCR has not yet been clearly established. Previously, studies have examined pCR rates based on total cycles of therapy received. In the NEOSPHERE trial, locally advanced HER2+breast cancer patients were assigned one of four treatment regimens, consisting of varying combinations of docetaxel, pertuzumab, and trastuzumab therapy prior to surgery. The treatment group receiving four cycles of pertuzumab and trastuzumab plus docetaxel had improved pCR rates compared to chemotherapy in combination with a single anti-HER2 agent (45.8% vs 29.0%).10 These findings were further validated by the TRYPHAENA trial, which evaluated the cardiac safety of six cycles of pertuzumab, trastuzumab, docetaxel, and carboplatin (TCHP) in comparison to two anthracycline-containing regimens with trastuzumab and pertuzumab in the neoadjuvant setting. Patients in the anthracycline-free treatment group had a pCR rate of 66.2%, compared to 57.3% and 61.6% in the anthracycline-containing groups.5 In both NEOSPHERE and TRYPHAENA trials, patients receiving neoadjuvant chemotherapy in combination with anti-HER2 agents had pCR rates vastly improved from rates seen in traditional chemotherapy regimens. However, many patients do not receive the full dose or full course of neoadjuvant therapy, as demonstrated in the current study patient population. In the TRYPHAENA trial, roughly 10% of patients did not receive the full course of chemotherapy, with most patients requiring dose reductions or elimination of docetaxel or carboplatin therapy.5 Our real-world study compounded this finding, as roughly 82% of our patient population experienced a dose delay or dose adjustment due to toxicity, most often diarrhea—a known side effect of chemotherapy and anti-HER2 therapy.
Due to the large amounts of dose reductions and delays, utilizing RDI as a measurement for amount of therapy received allows for a more accurate assessment. The impact of dose intensity was first investigated roughly 40 years ago in a retrospective study examining the role of the dose level of cyclophosphamide, methotrexate, and fluorouracil in the adjuvant chemotherapy setting.8 The study found a clear dose–response effect in patients receiving greater than 85% of the planned dose. Patients at this dose level experienced a 5-year relapse-free survival of 77%, compared to a 48% relapse-free survival in patients who had significant dose reductions. This concept was further validated by the JONIE1 trial, which examined the impact of RDI of neoadjuvant chemotherapy on survival rates in patients with HER2-negative breast cancer. This trial found patients with an RDI ≥85% had a 5-year overall survival of 91.2%, compared to 76.3% in patients that received less than 85% of the planned chemotherapy course.9 Since the publication of the original landmark trial, a threshold of 85% RDI has generally been accepted as the cutoff below which response and outcomes are suboptimal. Utilizing this threshold, we found an increase of approximately 17% in pCR rates among patients receiving ≥85% total RDI. This finding was consistent across both chemotherapy and mAB RDIs. However, these findings were not statistically significant—a likely consequence of the small sample population. In fact, post-hoc power analyses revealed a meager 38.6% power to detect the observed difference of 59.3% (n=54) vs 42.6% (n =47) between the proportions experiencing pCR in the ≥85% RDI group compared to the < 85% RDI group. Power is likely higher based on using the multiple logistic regression modeling given gains in efficiency using covariate adjustment. However, a gain in power of at or above 80% is quite unlikely in this case. Future studies would require a much larger sample size in order to have adequate power to detect this magnitude of difference.
This study had several limitations. As a retrospective study, the investigators are limited by the accuracy of information documented in the medical record and the proper extraction of data. The study was conducted at a single academic medical center; thus, the data is reflective of the patient population seen at the study institution. The patient population was relatively small, with only 101 patients included after the proper exclusions. The study did not reach power to make any statistically significant conclusions. There could be utility in conducting a prospective study, with a larger patient population, in order to provide data from which conclusive, causative relationships could be established.
Of note, “de-escalation” of therapy for early-stage HER2+breast cancer is an active area of clinical research and this concept may also explain the lack of statistical significance in this study. The Adjuvant Paclitaxel and Trastuzumab trial demonstrated that a de-escalated regimen could be safely used in patients with low risk, node-negative, HER2+breast cancer (7-year DFS of 93.3% (95% CI [90.4–96.2%]) and 7-year OS of 95.0% (95% CI [92.4–97.7%]), and was immediately practice changing as a single-arm, phase II study.11 At the time of this publication, the non-inferiority CompassHER2 trial is actively recruiting patients to evaluate the efficacy of neoadjuvant taxane, trastuzumab, and pertuzumab for four cycles in locally advanced, HER2+breast cancer.12 This trial is intended to expand on the hypothesis that patients with HER2+disease can effectively be treated with a de-escalated regimen without sacrificing clinical outcomes.
To our knowledge, this is the first study to investigate the association between RDI and pCR in patients receiving neoadjuvant TCHP for early stage, locally advanced HER2 breast cancer. We found patients receiving ≥85% RDI tend to have higher rates of pCR than those that received suboptimal RDI; however, this improvement was not statistically significant. The results of this study highlight the importance of maximizing the amount of treatment while minimizing dose delays.
Funding
The authors received no financial support for the research, authorship, and/or publication of this article.
Abbreviations
- TCHP
Docetaxel 75 mg/m2; Carboplatin AUC 6; Trastuzumab 8 mg/kg day 1, then 6 mg/kg thereafter; Pertuzumab 840 mg day 1, then 420 mg thereafter.
Footnotes
Declaration of conflicting interests
The authors do not have any current or potential conflicts of interest.
References
- 1.Loibl S and Gianni L. HER2 + breast cancer. Lancet. 2017;389:2415–2429. [DOI] [PubMed] [Google Scholar]
- 2.National Comprehensive Cancer Network. Breast Cancer (Version 8.2021). https://www.nccn.org/professionals/physician_gls/pdf/breast.pdf. (accessed September 16, 2021).
- 3.von Minckwitz G, Untch M, Blohmer JU, et al. Definition and impact of pathologic complete response on prognosis after neoadjuvant chemotherapy in various intrinsic breast cancer subtypes. J Clin Oncol 2012; 30: 1796–1804. [DOI] [PubMed] [Google Scholar]
- 4.Cortazar P, Zhang L, Untch M, et al. Pathological complete response and long-term clinical benefit in breast cancer: the CTNeoBC pooled analysis [published correction appears in Lancet. 2019 Mar 9;393(10175):986]. Lancet 2014; 384: 164–172. [DOI] [PubMed] [Google Scholar]
- 5.Shneeweiss A, Chia S, Hickish T, et al. Pertuzumab plus trastuzumab in combination with standard neoadjuvant anthracycline-containing and anthracycline-free chemotherapy regimens in patients with HER2 + early breast cancer: a randomized phase II cardiac safety study (TRYPHAENA). Ann Oncol 2013; 24: 2278–2284. [DOI] [PubMed] [Google Scholar]
- 6.Weycker D, Barron R, Edelsberg J, et al. Incidence of reduced chemotherapy relative dose intensity among women with early stage breast cancer in US clinical practice. Breast Cancer Res Treat 2012; 133: 301–310. [DOI] [PubMed] [Google Scholar]
- 7.Usiskin I, Li F, Irwin ML, et al. Association of relative dose intensity with BMI and pathologic complete response in patients treated with neoadjuvant chemotherapy for breast cancer. Breast Cancer Res Treat 2021; 186: 191–197. [DOI] [PubMed] [Google Scholar]
- 8.Bonadonna G and Valagussa P. Dose-response effect of adjuvant chemotherapy in breast cancer. N Engl J Med 1981; 304: 10–15. [DOI] [PubMed] [Google Scholar]
- 9.Yamada A, Nakazawa K, Akazawa K, et al. Impact of the relative dose intensity of neoadjuvant chemotherapy with anthracycline followed by taxane on the survival of patients with human epidermal growth factor receptor 2-negative breast cancer: the JONIE1 study. Anticancer Res 2021; 41: 1063–1068. [DOI] [PubMed] [Google Scholar]
- 10.Gianni L, Pienkowski T, Im YH, et al. Efficacy and safety of neoadjuvant pertuzumab and trastuzumab in women with locally advanced, inflammatory, or early HER2 + breast cancer (NeoSphere): a randomised multicentre, open-label, phase 2 trial. Lancet Oncol 2012; 13: 25–32. [DOI] [PubMed] [Google Scholar]
- 11.Tolaney SM, Guo H, Pernas S, et al. Seven-year follow-up analysis of adjuvant paclitaxel and trastuzumab trial for node-negative, human epidermal growth factor receptor 2-positive breast cancer. J Clin Oncol 2019; 37: 1868–1875. [DOI] [PMC free article] [PubMed] [Google Scholar]
- 12.ECOG-ACRIN Cancer Research Group. (CompassHER2-pCR): Preoperative THP and Postoperative HP in Patients Who Achieve a Pathologic Complete Response. ClinicalTrials.gov identifier: NCT04266249. https://clinicaltrials.gov/ct2/show/NCT04266249 (accessed June 22, 2023).