

Abstract
Objective:
Black youth are disproportionately exposed to school exclusionary discipline. We examined the impact of race on age at the onset of school disciplinary actions and police contact, and the rate of receiving increasingly severe disciplinary actions.
Method:
Youth (N = 2,156) and their caregivers participating in the Adolescent Brain Cognitive Development Social Development (ABCD-SD) study reported on the occurrence and timing of disciplinary events and youths’ demographics, delinquency, and neighborhood conditions. Experiences of exclusionary discipline were analyzed using logistic regression and Cox proportional hazards models.
Results:
Black youth reported significantly higher rates of almost all disciplinary events compared to White youth. In logistic regression and Cox models, Black youth experienced higher risk for exclusionary discipline and police contact (odds ratios from 2.47 [detention] to 5.16 [sent home]; hazard ratios from 1.36 [detention] to 4.71 [expelled]), even after adjusting for sex, delinquency, neighborhood conditions, and the interaction between race and sex. Black youth who received detention and suspension were at higher risk for additional, more severe school discipline than were White youth.
Conclusion:
Consistent with a racial bias in exclusionary discipline practices and policing, Black youth, particularly Black male youth, were at a higher risk for experiencing almost all disciplinary outcomes and at younger ages than White youth, after controlling for delinquency, sex, and neighborhood factors. Compared to White students, school detention and suspension status predicted an accelerated cascade of school discipline outcomes for Black students, suggesting racial disparities in how the severity of school discipline escalates over time.
Plain language summary:
This authors of this study used data from 2,156 participants in the Adolescent Brain Cognitive Development Social Development study—a national, longitudinal study of adolescent development—to examine the impact of race and sex on exposure to exclusionary discipline (detention, being sent home, expelled) in early adolescence. The authors found that Black youth experienced higher rates of exclusionary discipline and police contact than White youth, even after controlling for self-reported delinquent behavior, sex at birth, and environmental enrichment. Black youth who received detention and suspension were at higher risk for additional, more severe school discipline over time than were White youth who received detention.
Diversity & Inclusion Statement:
We worked to ensure that the study questionnaires were prepared in an inclusive way. One or more of the authors of this paper self-identifies as a member of one or more historically underrepresented racial and/or ethnic groups in science. We actively worked to promote inclusion of historically underrepresented racial and/or ethnic groups in science in our author group. While citing references scientifically relevant for this work, we also actively worked to promote sex and gender balance in our reference list. While citing references scientifically relevant for this work, we also actively worked to promote inclusion of historically underrepresented racial and/or ethnic groups in science in our reference list.
Keywords: education, Black, racism, adolescent, police
Exclusionary discipline practices in schools such as detention and expulsion entail removing students from their learning environment as punishment for disruptive behaviors. However, exclusionary discipline is ineffective in deterring disruptive behavior and is associated with increased risk of school dropout and justice system involvemen—termed the school-to-prison pipeline.1–3 Exposure to exclusionary discipline practices during childhood is associated with decreased engagement in school, poorer grades, and lower rates of high school graduation and college enrollment.4,5 These negative outcomes have a disproportionate impact on Black youth, who are subject to exclusionary discipline practices at higher rates than their White peers.6–9 Therefore, racial disparities in exclusionary discipline increase risk for developmental maladjustment and negative academic outcomes for Black youth, compared to their White peers.1 However, it is unclear whether Black youth, relative to White youth, receive exclusionary discipline at earlier ages and experience a faster escalation to more severe punishments over time. Therefore, we examined differences between Black and White youth in the experience, timing, and escalation of exclusionary discipline and police contact.
Compared to White youth, Black youth are more likely to receive school detention, to be suspended or expelled,6,9–11 and to experience more severe punishment without prior warnings.12 These racial disparities in exclusionary discipline persist even after controlling for levels of delinquent behavior, neighborhood and school characteristics, and academic performance.13 These differences are present in childhood. For example, analysis of data from the Adolescent Brain Cognitive Development Study (ABCD Study) found that Black students9 to 10 years of age were 3.5 times more likely to receive detention or to be suspended from school than White students even after controlling for problem behavior.10
Exclusionary discipline contributes to educational disadvantages in the form of missed educational time, dropping out, and grade retention, which mediate the risk for juvenile justice contact and arrest.6,14,15 Individuals who experienced childhood exclusionary discipline incur an 82% increase in odds of police contact in adolescence.16 The association between exclusionary discipline and police contact cannot be accounted for by delinquent behavior, as the link was present even among those without a history of childhood delinquency. Furthermore, students who receive exclusionary discipline by age 9 years were more likely to be stopped by the police at younger ages (ie, before age 13 years) and to experience multiple police stops,16 suggesting that the timing also relates to an accelerated trajectory of police contact. Similarly, even in a sample matched on demographic and contextual risk factors, suspension was associated with greater subsequent risk for arrest.5,17
Although a student’s commission of delinquent acts has a strong association with receiving exclusionary discipline, these behaviors do not fully account for the racial differences in exclusionary discipline.1,5,6,10,11,13 In addition, it is important to consider the impact of sex and its interaction with race in association with risk for exclusionary discipline. Although male youth engage in higher rates of delinquent behaviors than female youth in childhood and early adolescence,18 Black male youth are perceived as more dangerous than White male youth.19,20 This bias is also consistent for female youth, as Black female youth have higher rates of suspension and expulsion than White female youth in elementary and secondary schools, although Black male youth are at the highest risk for experiencing exclusionary discipline overall.1,21 Systemic inequalities also have an impact on exposure to crime and lack of resources for Black youth. For example, because of racially biased housing, banking, and infrastructure practices, Black families have been pushed into neighborhoods with higher crime rates.22 These neighborhoods are also subject to higher rates of policing and aggressive tactics (eg stop and frisk).23 As a result of this increased police presence, Black youth experience higher rates of police contact than their White peers,24 beginning in childhood.25 This early and continuing contact with the police has been found to undermine youth mental health and well-being.26–30 These neighborhood factors also have an impact on the resources of the schools that youth attend. Schools that have a predominantly Black student body also rely more on exclusionary discipline practices, due in part to a lack of resources for addressing disruptive behavior through other means.9
Current Study
We examined the impact of race on the experience, timing, and acceleration of exclusionary discipline and police contact. Previous research has collapsed across distinct types of exclusionary discipline, which has precluded a careful examination of how different forms of exclusionary discipline are linked over time. Previous studies have also focused on recent experiences (eg, past year, past 30 days) and therefore lack the information necessary to examine the developmental timing of these exposures. Consequently, existing studies rarely examine how experiencing less severe forms of discipline (eg, detention) at a young age might have an impact on the risk for more severe discipline and police contact for Black compared to White youth.
We addressed these limitations using data from the ABCD Social Development (ABCD-SD) Study—a large, geographically diverse sample of youth with longitudinal data from late childhood to early adolescence. Our objectives were as follow: (1) to characterize youth who had received exclusionary discipline in terms of sociodemographic and mental health characteristics; (2) to examine whether risk for exclusionary discipline and police contact increased as a function of race, after controlling for delinquency, sex, and neighborhood factors; (3) to examine the how the interaction between race and sex affected risk for exclusionary discipline and police contact; and (4) to examine how age of onset of exclusionary discipline events predicted more severe exclusionary discipline and police contact, as a function of race.
We hypothesized the following: (1) experiences of exclusionary discipline and police contact would be associated with higher levels of externalizing psychopathology, and these individuals would be more likely to be male (compared to female) and Black (compared to White); (2) Black youth would experience exclusionary discipline and police contact at a younger age than their White peers; and (3) there would be a significant interaction between race and sex. Given previous research on the early criminalization of Black male youth, we hypothesized that Black male youth would experience higher rates of exclusionary discipline and at an earlier age than White male youth. Finally, we hypothesized that (4) the interactions between the experience of disciplinary action at a young age and race would predict a faster escalation of punishment, such that following minor sanctions at a young age (ie, detention before age 10 years), Black youth would have a greater risk for suspension, being sent home, and experiencing police contact than White youth.
METHOD
Sample
Data were from the ABCD study, a longitudinal study of a community sample of youth in the United States. We used data from participants in the ABCD-Social Development study, which is a substudy of the national ABCD study and adds annual assessments of delinquency, victimization, and personality features, for participants from 5 sites (N = 2,426). We used all available data from participants in Release 5.0, which included the full wave of data from baseline and the 1-year follow up and partial data from the 2-year follow-up wave of data collection (n = 1,395 with data available from the 2-year follow up). Based on previous research demonstrating that racial disparities are greatest between Black and White youth,1 analyses focused on youth whose caregivers reported that the youth were either White (n = 1,395) or Black (n = 761) and youth who reported being of male (n = 1,121, 52%) or female (n = 1,035) sex assigned at birth, resulting in an analytic sample of N = 2,156 (mean age = 10.6, SD = 0.9). Results for youth who identified as both Black and White (n = 147) are presented in Supplement 1, Table S1 and Table S2 (available online). In all, 30% of the analytic sample reported that their annual household income was below US $50,000, and 35% reported that their annual household income was above US $100,000. Of the sample, 22% reported that their highest level of parental education was a Bachelor degree and 13% reported their highest level of parental education was a high school diploma or general equivalency diploma (GED_.
Measures
Disciplinary Actions.
Youth and their caregivers reported if the youth had ever experienced 8 disciplinary actions ranging in severity from school detention to arrest (Table 1 for item content and endorsement rates, coded 0, 1). It is unclear whether being sent home for bad behavior is a more severe action than suspension, which could occur in or out of school. Given that these 2 disciplinary actions were asked about separately in the original questionnaire, we treat these variables as distinct, while acknowledging the overlap. We coded an item as endorsed if either the youth or caregiver reported that it had occurred. Data were available at baseline and 2 follow- up waves. At baseline, respondents were also asked how old they were the first time that an event or behavior had occurred. In the follow-up waves, youth and caregivers were asked to report if an event had occurred since their last study visit. The baseline and follow-up information were used to calculate lifetime endorsement of each disciplinary action as of the most recent time point available for that participant. We also coded the age at the first event from the information available from the baseline retrospective report and the follow-up wave.
TABLE 1.
Item Descriptives and Odds Ratios From Logistic Regression Models for Race and Sex and Child Behavior Checklist (CBCL) Externalizing and Internalizing Scores
| Total |
||||||
|---|---|---|---|---|---|---|
| N = 2,156 |
||||||
| Item | n (%) | Mean age (SD) | ||||
| Detention | 761 (36) | 9.8 (1.7) | ||||
| Suspension | 497 (23) | 9.7 (1.7) | ||||
| Expelled | 62 (2.9) | 9.8 (1.5) | ||||
| Caught cheating | 124 (5.8) | 9.3 (1.9) | ||||
| Sent home for bad behavior | 351 (16) | 9.1 (2.0) | ||||
| Stopped/ questioned by the police | 189 (8.8) | 10.2 (1.8) | ||||
| Arrested | 16 (0.7) | 10.7 (1.6) | ||||
| Loud or rowdy in public and got in trouble | 330 (15) | 8.7 (2.8) | ||||
| Race |
||||||
| White |
Black |
|||||
| n = 1,395 |
n = 761 |
|||||
| n (%) | Mean age (SD) | n (%) | Mean age (SD) | OR (95% CI) | ||
| Detention | 349 (25) | 9.9 (1.8) | 412 (55) | 9.6 (1.5) | 3.6 (3.0–4.4) | |
| Suspension | 178 (13) | 9.7 (1.9) | 319 (42) | 9.6 (1.5) | 5.00 (4.0–6.2) | |
| Expelled | 12 (0.9) | 9.3 (1.4) | 50 (6.6) | 9.9 (1.5) | 8.1 (4.5–16.1) | |
| Caught cheating | 70 (5.1) | 9.0 (2.1) | 54 (7.3) | 9.7 (1.6) | 1.5 (1.0–2.1) | |
| Sent home for bad behavior | 104 (7.5) | 8.7 (2.3) | 247 (33) | 9.3 (1.9) | 6.0 (4.7–7.7) | |
| Stopped/ questioned by the police | 85 (6.1) | 10.4 (2.0) | 104 (14) | 10.0 (1.5) | 2.5 (1.8–3.3) | |
| Arrested | 4 (0.3) | 11.9 (1.1) | 12 (1.6) | 10.3 (1.6) | 5.6 (1.9–20.1) | |
| Loud or rowdy in public and got in trouble | 200 (14) | 8.6 (2.9) | 130 (17) | 9.0 (2.5) | 1.2 (1.0–1.6) | |
| Sex |
||||||
| Female |
Male |
|||||
| n = 1,035 |
n = 1,121 |
|||||
| n (%) | Mean age (SD) | n (%) | Mean age (SD) | OR (95% CI) | ||
| Detention | 277 (27) | 9.8 (1.6) | 484 (44) | 9.7 (1.7) | 2.1 (1.7–2.5) | |
| Suspension | 166 (16) | 10.0 (1.3) | 331 (30) | 9.5 (1.8) | 2.2 (1.8–2.7) | |
| Expelled | 20 (1.9) | 9.6 (1.5) | 42 (3.8) | 9.8 (1.5) | 2.0 (1.2–3.5) | |
| Caught cheating | 50 (4.9) | 9.3 (1.9) | 74 (6.7) | 9.4 (2.0) | 1.4 (1.0–2.0) | |
| Sent home for bad behavior | 104 (10) | 9.4 (1.9) | 247 (22) | 9.0 (2.1) | 2.5 (2.0–3.3) | |
| Stopped/ questioned by the police | 55 (5.4) | 10.4 (1.5) | 134 (12) | 10.1 (1.9) | 2.43 (1.8–3.4) | |
| Arrested | 3 (0.3) | 10.9 (1.9) | 13 (1.2) | 10.6 (1.6) | 4.1 (1.3–17.7) | |
| Loud or rowdy in public and got in trouble | 117 (11) | 8.8 (2.8) | 213 (19) | 8.7 (2.7) | 1.9 (1.5–2.4) | |
| Child Behavior Checklist |
||||||
| Externalizing |
Internalizing |
|||||
| Endorsed |
Not endorsed |
Endorsed |
Not endorsed |
|||
| Mean (SD) | Mean (SD) | OR (95% CI) | Mean (SD) | Mean (SD) | OR (95% CI) | |
| Detention | 6.9 (7.7) | 3.2 (4.5) | 1.9 (1.7–2.1) | 5.4 (6.0) | 4.9 (5.1) | 1.1 (1.0–1.2) |
| Suspension | 8.1 (8.5) | 3.4 (4.6) | 2.0 (1.8–2.2) | 5.4 (6.2) | 4.9 (5.2) | 1.1 (1.0–1.2) |
| Expelled | 10.0 (10.2) | 4.3 (5.8) | 1.7 (1.4–2.0) | 5.1 (5.0) | 5.1 (5.5) | 1.0 (0.8–1.3) |
| Caught cheating | 5.3 (7.3) | 4.4 (5.9) | 1.2 (1.0–1.3) | 4.4 (4.6) | 5.0 (5.4) | 0.9 (0.7–1.1) |
| Sent home for bad behavior | 9.1 (8.9) | 3.6 (4.9) | 2.0 (1.8–2.2) | 5.9 (6.3) | 4.9 (5.3) | 1.2 (1.1–1.3) |
| Stopped/ questioned by the police | 8.6 (9.0) | 4.1 (5.6) | 1.7 (1.5–1.9) | 5.9 (6.4) | 5.0 (5.3) | 1.2 (1.0–1.3) |
| Arrested | 10.0 (7.6) | 4.5 (6.1) | 1.6 (1.2–2.1) | 4.7 (3.9) | 5.1 (5.5) | 0.9 (0.5–1.5) |
| Loud or rowdy in public and got in trouble | 8.1 (8.3) | 3.8 (5.3) | 1.7 (1.6–1.9) | 6.5 (6.5) | 4.8 (5.2) | 1.3 (1.2–1.5) |
Note: OR = odds ratio.
Demographic Variables.
We included sex assigned at birth (0 = female, 1 = male) and race (0 = White, 1 = Black) as predictors of disciplinary actions.
Broad Psychopathology.
We used the parent-report Child Behavior Checklist31 Internalizing and Externalizing raw scores to index current mental health problems. Scores were z scored for logistic regressions to increase the interpretability of odds ratios (ORs).
Delinquency.
Youth and caregivers reported whether the youth had ever engaged in a variety of delinquent behaviors (theft, physical violence, vandalism). Based on recommendations from previous studies,32 we adjusted Delinquency scores for differential item functioning (DIF) due to sex, race, and ethnicity. Because of low endorsement rates (95% of the sample endorsed as 0), likely due to the severity of the behaviors (eg, selling drugs), 18 items were removed from the DIF analyses. In all, 20 items were used to compute the DIF-adjusted Delinquency scores. The DIF-adjusted Delinquency scores were highly correlated with the non-adjusted Delinquency scores (r = 0.99).
Child Opportunity Index.
The Child Opportunity Index (COI) is derived from geocoded data (residential address) from the ABCD study.33 This is a nationally normed (z-scored) composite score of 29 variables indexing neighborhood conditions relevant to healthy child development that comprise 3 domains: education (eg, school poverty), health/environment (eg, neighborhood walkability), and social/economic opportunities (eg, homeownership rate). The COI was scored such that youth with higher scores lived in more enriched areas.
Analytic Approach
Logistic regressions and Cox proportional hazard (PH) models were used to examine the association between race and disciplinary action. ORs are reported from the logistic regressions. PH models were used to include additional information regarding the first occurrence of each disciplinary event. The PH models provide the hazard ratio (HR; ie, the exponential of the parameter estimate), which provides the relative risk for each predictor relative to a comparison group, over time. Therefore, this metric describes the likelihood that Black and White youth will experience the same number of events during a certain period. The benefit of the PH models is that we can include information regarding not only whether but also when (per retrospective self-report) a given event has occurred.
For each disciplinary item, 5 separate logistic regressions models were run. First, models were run in which race, sex, Externalizing, and Internalizing Problems were separately included as predictors of each disciplinary item. Then, we ran multivariate models that included race, sex, Delinquency, COI scores, and, in a separate step, the interaction between race and sex. Finally, we ran a parallel multivariate Cox PH model that included race, sex, Delinquency, COI scores, and the race by sex interaction term.
We also conducted analyses to examine the association between race and receiving increasingly severe punishment in school. In these Cox PH models, we used a dummy coded variable reflecting whether an individual had ever experienced a certain disciplinary event before vs after the age of 10 years. Age 10 was chosen as a breakpoint because it coincides with the approximate age when youth move from elementary school to middle school in the United States. This variable had 3 levels based on severity: 0 = never experienced [event]; 1 = experienced [event] at or after age 10; 2 = experienced [event] before age 10. We included this variable and its interaction with race in follow-up analyses along with sex, race, Delinquency score, and COI score. We examined the following: (1) the effects of detention on risk for suspension, being sent home, and police contact; (2) the effects of suspension on risk for being sent home and police contact; and (3) the effect of being sent home on risk for suspension and police contact. Expulsion was rare in this sample (n = 62, 2.9% of the total sample), so we did not use expulsion status in these analyses. All analyses were run in R (v4.3) using the stats and survival packages.34
RESULTS
Rates of item endorsement and mean age of item endorsement for the overall sample, as well as stratified by race and sex, are provided in Table 1 (Table S3, available online, for rates broken down by race and sex). Table 1 also includes ORs from the logistic regression models. Black youth were at significantly higher risk for experiencing all events of interest, except for getting in trouble for being loud in public, in comparison to White youth (ORs range from 1.47 [caught cheating] to 8.14 [expelled]), and these events occurred at an earlier age (mean agedetention Black youth = 9.63 years; White youth = 9.94 years; Cohen d = 0.19). Regarding the main effect of sex, male youth were at significantly higher risk for experiencing all events, excluding getting caught cheating, relative to female youth (ORs range from 1.85 [rowdy in public] to 4.06 [arrested]), and these events also occurred at an earlier age (mean agesent home male youth = 9.04 years; female youth = 9.35 years, d = 0.16). Externalizing problems were associated with increased risk for all events, excluding caught cheating (ORs range from 1.62 [arrested] to 2.01 [suspension]). Internalizing problems were significantly associated with increased risk for detention (OR = 1.10), being sent home for bad behavior (1.17), being stopped or questioned by the police (OR = 1.03), and being rowdy in public (OR = 1.32).
Table 2 contains the results of the multivariate logistic regression and Cox PH models examining associations of race, sex, Delinquency scores, COI scores, and the interaction between race and sex, with the endorsement of each discipline item. From the logistic regressions, Black race was associated with increased risk for experiencing detention, suspension, expulsion, being caught cheating, and being sent home for bad behavior (ORs range from 1.34 [caught cheating] to 3.54 [sent home]). Male sex was also significantly associated with increased risk incidence of detention, suspension, being sent home, being stopped by the police, and being arrested (ORs range from 1.52 [detention] to 2.25 [arrest]). Higher Delinquency scores were associated with increased risk for all events. Higher COI scores were associated with decreased risk for detention, suspension, and being sent home. There was also evidence for an interaction between race and sex, such that Black male youth were at increased risk for suspension (OR = 0.57).
TABLE 2.
Risk for Experience of Exclusionary Discipline and Police Contact as a Function of Race, Sex, Delinquency, and Neighborhood Characteristics
| Race (Black) |
Sex (male) |
Delinquency |
Childhood Opportunity Index |
Race × sex (Black × male) |
||||||
|---|---|---|---|---|---|---|---|---|---|---|
| Item | OR (95% CI) | HR (95% CI) | OR (95% CI) | HR (95% CI) | OR (95% CI) | HR (95% CI) | OR (95% CI) | HR (95% CI) | OR (95% CI) | HR (95% CI) |
| Detention | 1.94 (1.46–2.59) | 1.24 (1.01–1.51) | 1.52 (1.21–1.91) | 1.23 (1.05–1.45) | 2.84 (2.43–3.33) | 1.45 (1.31–1.6) | 0.39 (0.28–0.55) | 0.49 (0.39–0.62) | ||
| Suspension (in-school or out-of-school) | 2.63 (1.91–3.63) | 1.59 (1.23–2.06) | 1.69 (1.29–2.21) | 1.42 (1.15–1.76) | 2.65 (2.23–3.16) | 1.46 (1.3–1.65) | 0.33 (0.23–0.49) | 0.42 (0.31–0.56) | ||
| Expelled | 4.03 (1.75–9.81) | 3.24 (1.33–7.9) | 1.37 (0.74–2.65) | 1.03 (0.56–1.91) | 3.08 (2.13–4.53) | 2.27 (1.51–3.41) | 0.64 (0.26–1.5) | 0.77 (0.3–1.99) | ||
| Caught cheating | 1.34 (0.78–2.26) | 1.68 (1–2.83) | 0.93 (0.61–1.42) | 0.92 (0.61–1.39) | 2.46 (1.9–3.19) | 1.92 (1.5–2.47) | 1.71 (0.9–3.25) | 1.38 (0.74–2.58) | ||
| Sent home for bad behavior | 3.54 (2.43–5.2) | 1.86 (1.33–2.6) | 2.15 (1.57–2.98) | 1.47 (1.13–1.9) | 3.55 (2.89–4.38) | 1.82 (1.58–2.09) | 0.44 (0.28–0.68) | 0.49 (0.34–0.71) | ||
| Stopped or questioned by the police | 1.55 (0.98–2.44) | 1.55 (1.02–2.35) | 1.62 (1.12–2.39) | 1.2 (0.83–1.75) | 3.29 (2.61–4.18) | 1.64 (1.33–2.03) | 0.69 (0.41–1.18) | 0.6 (0.36–1.01) | ||
| Arrested | 3.71 (0.82–20.24) | 19.94 (1.8–221.44) | 2.25 (0.67–10.19) | 2.48 (0.51–12.14) | 3.11 (1.57–6.32) | 3.54 (1.52–8.26) | 0.79 (0.15–3.75) | 0.82 (0.13–5.22) | ||
| Got in trouble for being loud or rowdy in public | 0.73 (0.5–1.06) | 0.93 (0.68–1.27) | 1.25 (0.94–1.68) | 1.26 (0.98–1.61) | 3.82 (3.15–4.66) | 1.87 (1.61–2.17) | 1.05 (0.68–1.64) | 0.88 (0.61–1.26) | ||
| Detention | 2.47 (1.68–3.63) | 1.36 (1.01–1.83) | 1.81 (1.34–2.44) | 1.34 (1.05–1.72) | 2.84 (2.42–3.33) | 1.44 (1.3–1.59) | 0.39 (0.28–0.56) | 0.49 (0.39–0.62) | 0.65 (0.41–1.04) | 0.86 (0.62–1.2) |
| Suspension (in-school or out-of-school) | 3.77 (2.35–6.13) | 2.26 (1.49–3.44) | 2.32 (1.54–3.56) | 2.01 (1.36–2.96) | 2.64 (2.22–3.15) | 1.46 (1.29–1.64) | 0.34 (0.23–0.49) | 0.43 (0.32–0.57) | 0.57 (0.33–0.98) | 0.6 (0.38–0.96) |
| Expelled | 3.95 (1.1–18.8) | 4.71 (1.21–18.32) | 1.34 (0.36–6.31) | 1.63 (0.42–6.39) | 3.09 (2.13–4.54) | 2.25 (1.5–3.37) | 0.64 (0.26–1.5) | 0.76 (0.3–1.95) | 1.03 (0.19–4.56) | 0.56 (0.12–2.55) |
| Caught cheating | 1.55 (0.75–3.17) | 1.94 (0.97–3.87) | 1.04 (0.6–1.82) | 1.04 (0.6–1.8) | 2.45 (1.89–3.18) | 1.91 (1.49–2.45) | 1.71 (0.91–3.25) | 1.37 (0.74–2.57) | 0.77 (0.33–1.78) | 0.78 (0.35–1.74) |
| Sent home for bad behavior | 5.16 (2.76–10.13) | 3.43 (1.88–6.25) | 3.06 (1.74–5.7) | 2.72 (1.55–4.79) | 3.52 (2.87–4.35) | 1.8 (1.57–2.07) | 0.44 (0.28–0.68) | 0.49 (0.34–0.71) | 0.59 (0.29–1.18) | 0.44 (0.23–0.83) |
| Stopped or questioned by the police | 1.67 (0.83–3.39) | 2.12 (1.12–4.03) | 1.73 (0.99–3.12) | 1.56 (0.9–2.7) | 3.28 (2.6–4.17) | 1.65 (1.33–2.03) | 0.69 (0.41–1.18) | 0.58 (0.35–0.98) | 0.9 (0.41–1.91) | 0.62 (0.31–1.27) |
| Arrested | 1.85 (0.14–44.81) | 0.99 (0.63–1.55) | 1.13 (0.11–24.73) | 1.31 (0.95–1.8) | 3.15 (1.59–6.45) | 1.87 (1.61–2.17) | 0.78 (0.15–3.72) | 0.88 (0.61–1.26) | 2.51 (0.09–46.37) | 0.91 (0.55–1.5) |
| Got in trouble for being loud or rowdy in public | 0.85 (0.5–1.42) | 1.36 (1.01–1.83) | 1.37 (0.96–1.98) | 1.34 (1.05–1.72) | 3.81 (3.14–4.65) | 1.44 (1.3–1.59) | 1.05 (0.68–1.64) | 0.49 (0.39–0.62) | 0.79 (0.44–1.43) | 0.86 (0.62–1.2) |
Note: Odds ratios are derived from logistic regression models in which race, sex, Delinquency score, Childhood Opportunity Index score, and, when relevant, the interaction between race and sex predict each exclusionary discipline/police contact outcome. Hazard ratios are derived from parallel Cox proportional hazard models. HR = hazard ratio; OR = odds ratio.
The results from the PH models were largely consistent with the logistic regressions. Race was significantly associated with incidence of detention, suspension, expulsion, being sent home, being stopped by the police, and being arrested (HRs range from 1.24 [detention] to 19.94 [arrest]). Results from the PH model were consistent for sex, excluding police contact and arrest, which were no longer significant. Effects of Delinquency and COI were also consistent in the PH models. The race by sex interaction term was a significant predictor of suspension (HR = 0.60) and being sent home for bad behavior (HR = 0.44), such that Black male youth had the highest probability of experiencing these events (Figure 1).
FIGURE 1. Cumulative Hazard for Detention (Top Left), Suspension (Top Right), Sent Home From School (Bottom Left), and Stopped by Police (Bottom Right) Items, Stratified by Race and Sex.
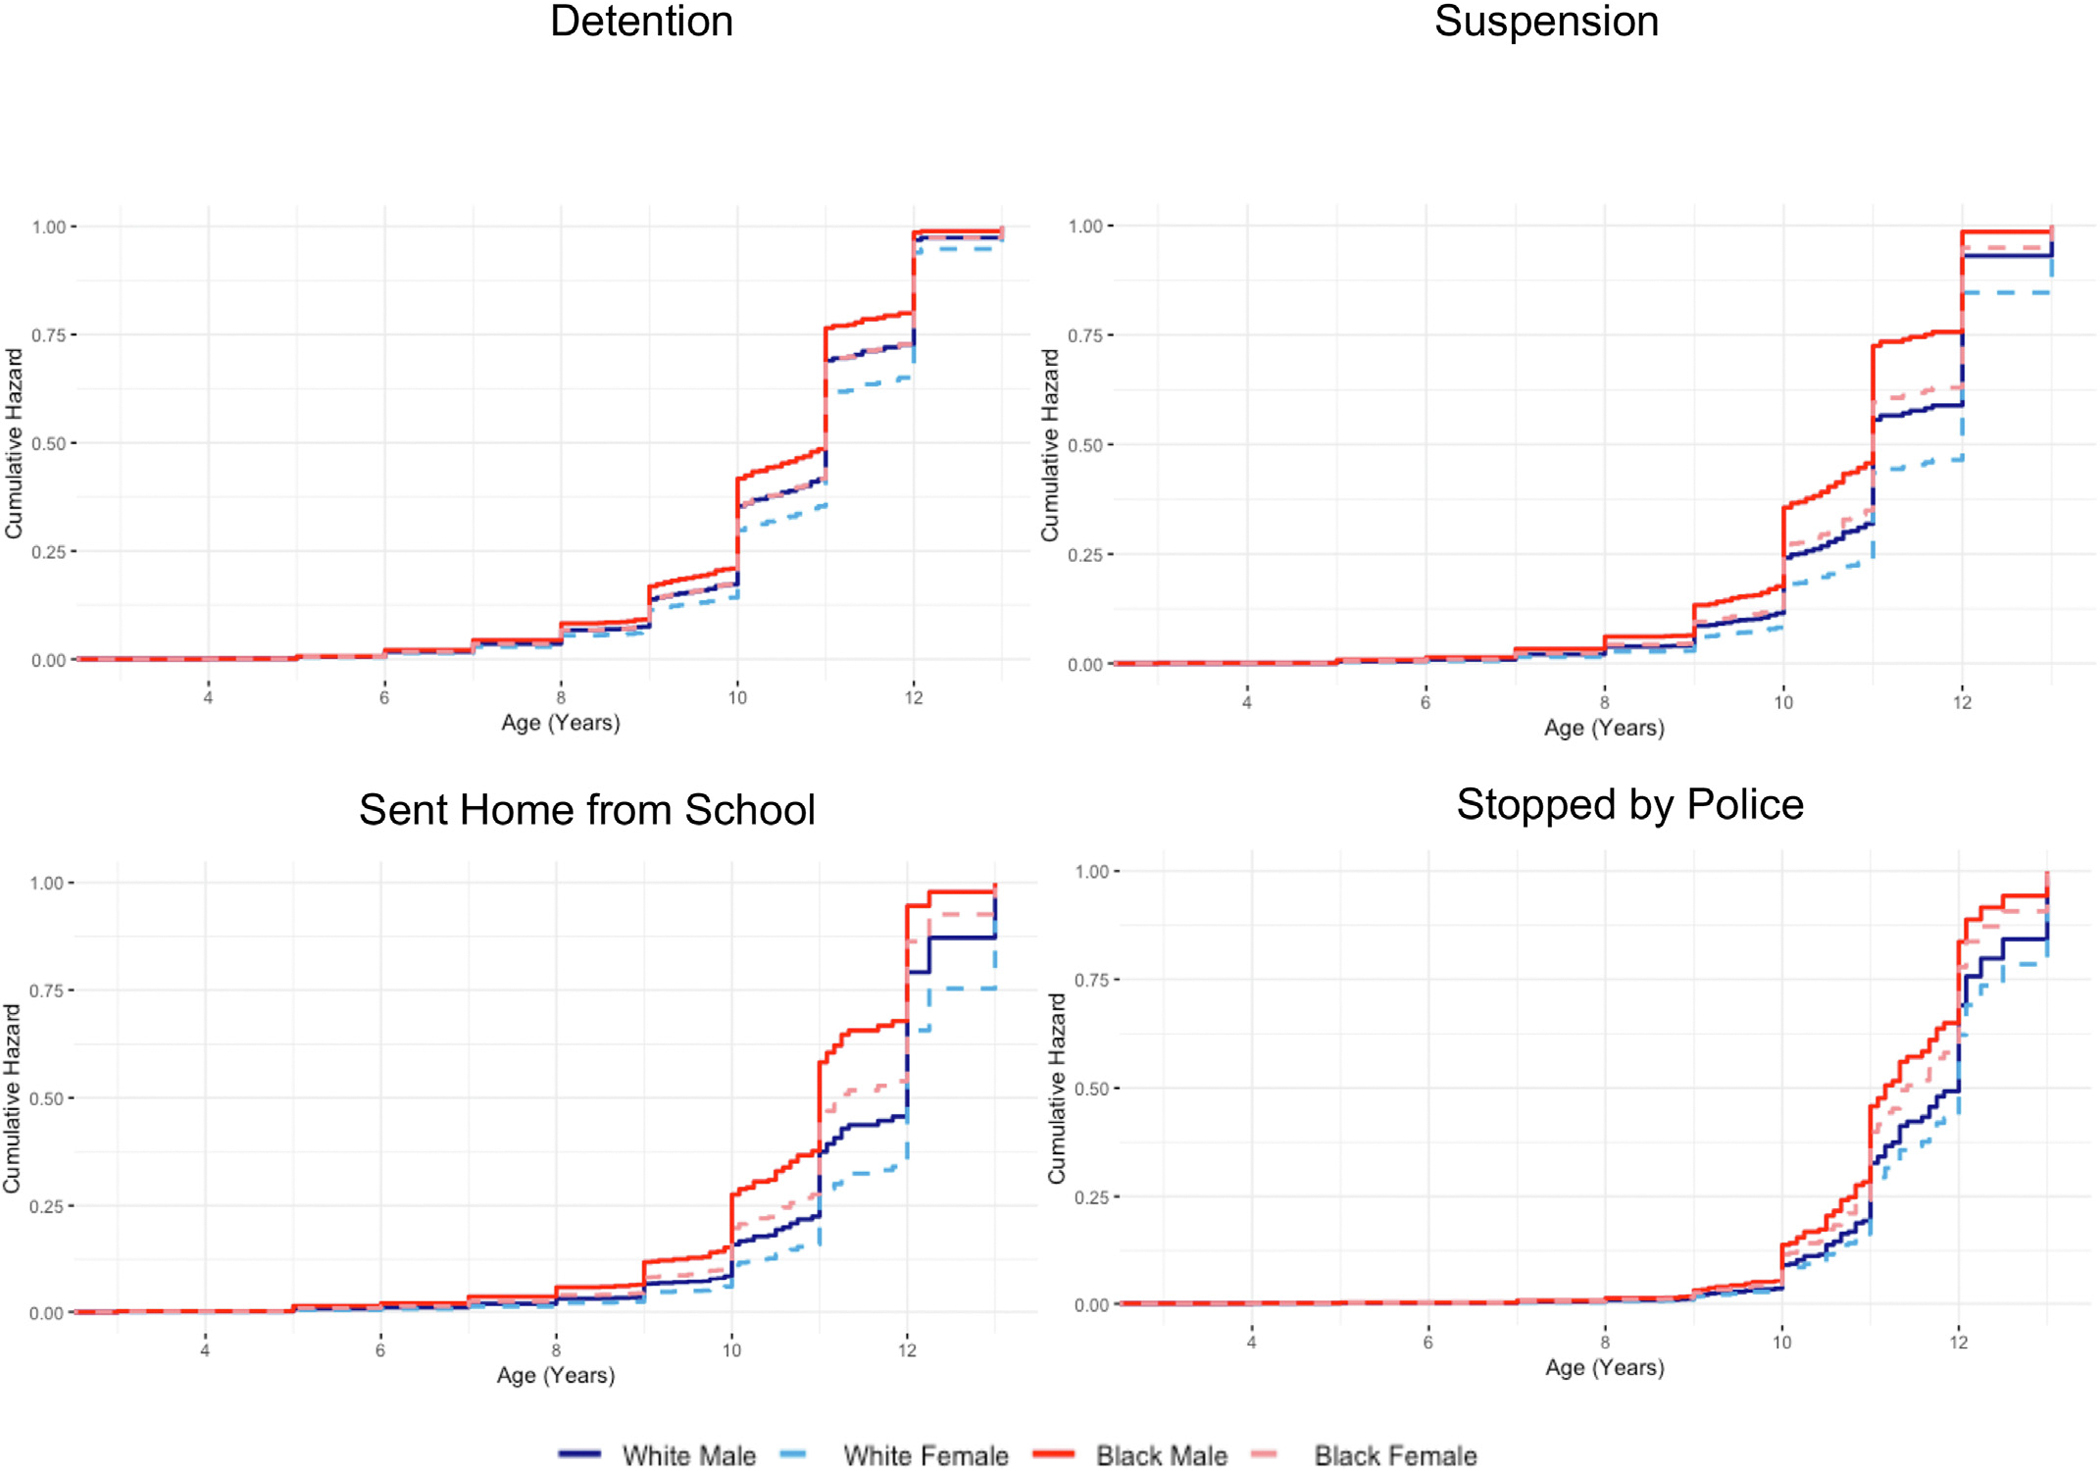
Note: Cumulative hazards are derived from Cox proportional hazard models in which race, sex, Delinquency score, and Childhood Opportunity Index score predict each exclusionary discipline/police contact outcome.
Progression of School Discipline
We examined how previous disciplinary action in school was associated with more severe punishment and tested whether any such associations differed by race (Table 3).
TABLE 3.
Impact of Disciplinary Events on Progression of More Severe Disciplinary Actions and Police Contact
| Effect of detention on: |
|||
|---|---|---|---|
| Risk for suspension HR (95% CI) | Risk for being sent home HR (95% CI) | Risk for being stopped or questioned by police HR (95% CI) | |
| Race, Black | 2.78 (1.72–4.52) | 4.24 (2.38–7.56) | 1.54 (0.8–2.94) |
| Sex, male | 1.35 (1.09–1.67) | 1.33 (1.02–1.74) | 1.2 (0.83–1.75) |
| Delinquency | 1.19 (1.04–1.35) | 1.59 (1.37–1.86) | 1.59 (1.27–1.99) |
| Childhood Opportunity Index | 0.45 (0.33–0.61) | 0.51 (0.35–0.75) | 0.71 (0.41–1.22) |
| Discipline: detention | |||
| Never vs Before age 10 | 4.84 (2.97–7.88) | 6.12 (3.39–11.07) | 1.29 (0.66–2.52) |
| Never vs After age 10 | 1.94 (1.25–3) | 2.58 (1.47–4.52) | 0.97 (0.55–1.72) |
| After age 10 vs Before age 10 | 2.5 (1.65–3.8) | 2.37 (1.42–3.98) | 1.33 (0.65–2.71) |
| Discipline × Race | |||
| Detention × Black | |||
| Never vs Before age 10 | 0.56 (0.31–1.02) | 0.23 (0.11–0.46) | 1.31 (0.56–3.09) |
| Never vs After age 10 | 0.44 (0.25–0.76) | 0.32 (0.16–0.63) | 1.01 (0.45–2.28) |
| After age 10 vs Before age 10 | 1.28 (0.78–2.08) | 0.71 (0.39–1.31) | 1.29 (0.55–3.03) |
| Effect of suspension on: |
|||
| Risk for being sent home HR (95% CI) | Risk for being stopped or questioned by police HR (95% CI) | ||
| Race, Black | 2.17 (1.26–3.73) | 1.7 (0.95–3.06) | |
| Sex, male | 1.17 (0.88–1.54) | 1.13 (0.77–1.67) | |
| Delinquency | 1.52 (1.31–1.76) | 1.52 (1.22–1.91) | |
| Childhood Opportunity Index | 0.62 (0.42–0.9) | 0.71 (0.42–1.22) | |
| Discipline: suspension | |||
| Never vs Before age 10 | 15.57 (8.51–28.5) | 2.56 (1.25–5.26) | |
| Never vs After age 10 | 3.13 (1.85–5.31) | 1.63 (0.88–3.03) | |
| After age 10 vs Before age 10 | 4.97 (2.71–9.11) | 1.57 (0.7–3.52) | |
| Discipline × Race | |||
| Suspension × Black | |||
| Never vs Before age 10 | 0.27 (0.13–0.55) | 0.67 (0.28–1.62) | |
| Never vs After age 10 | 0.54 (0.28–1.05) | 0.68 (0.3–1.53) | |
| After age 10 vs Before age 10 | 0.49 (0.25–0.96) | 0.99 (0.38–2.54) | |
| Effect of being sent home on: |
|||
| Risk for suspension HR (95% CI) | Risk for being stopped or questioned by police HR (95% CI) | ||
| Race, Black | 1.63 (1.17–2.28) | 1.64 (0.94–2.83) | |
| Sex, male | 1.24 (1–1.54) | 1.23 (0.84–1.8) | |
| Delinquency | 1.29 (1.14–1.47) | 1.61 (1.27–2.03) | |
| Childhood Opportunity Index | 0.47 (0.35–0.63) | 0.62 (0.36–1.07) | |
| Discipline: being sent home | |||
| Never vs Before age 10 | 3.23 (2.05–5.08) | 1.12 (0.51–2.46) | |
| Never vs After age 10 | 1.64 (1.02–2.63) | 1.08 (0.5–2.32) | |
| After age 10 vs Before age 10 | 1.98 (1.12–3.48) | 1.04 (0.39–2.79) | |
| Discipline × Race | |||
| Sent Home × Black | |||
| Never vs Before age 10 | 0.96 (0.56–1.63) | 1.15 (0.47–2.82) | |
| Never vs After age 10 | 0.71 (0.41–1.24) | 0.79 (0.31–1.98) | |
| After age 10 vs Before age 10 | 1.34 (0.71–2.56) | 1.46 (0.48–4.39) | |
Note: Hazard ratios are derived from Cox proportional hazard models including race, sex, Delinquency score, Childhood Opportunity Index score, timing of detention, suspension, and being sent home (never, before age 10, after age 10), and interaction between race and timing. Hazard ratios reflect the effect of the category in boldface type. For example, the effect of detention before age 10, compared to detention after age 10. HR = hazard ratio.
Effect of School Detention.
There was a significant main effect of the timing of detention on risk for both suspension and being sent home, such that youth who had received detention, both before and after age 10 years, had a higher probability of both events than youth who never received detention. In addition, youth who received their detention before age 10 had a higher probability compared to those who received detention after age 10 (HR = 2.5 [suspension], HR = 2.37 [sent home]). There was no impact of detention timing on probability of police contact. There was a significant detention by race interaction, such that Black youth who received detention after age 10 (compared to never) had a higher probability for suspension compared to White youth who received detention after age 10. There was a significant interaction between receiving detention ever and race, such that Black youth who had ever received detention had a higher probability for being sent home compared to White youth (Figure 2). Race did not moderate the association between detention and police contact.
FIGURE 2. Cumulative Hazard of Detention on Risk for Suspension (Top) and Risk for Being Sent Home (Bottom), Stratified by Race and Sex (Male Youth Left, Female Youth Right).
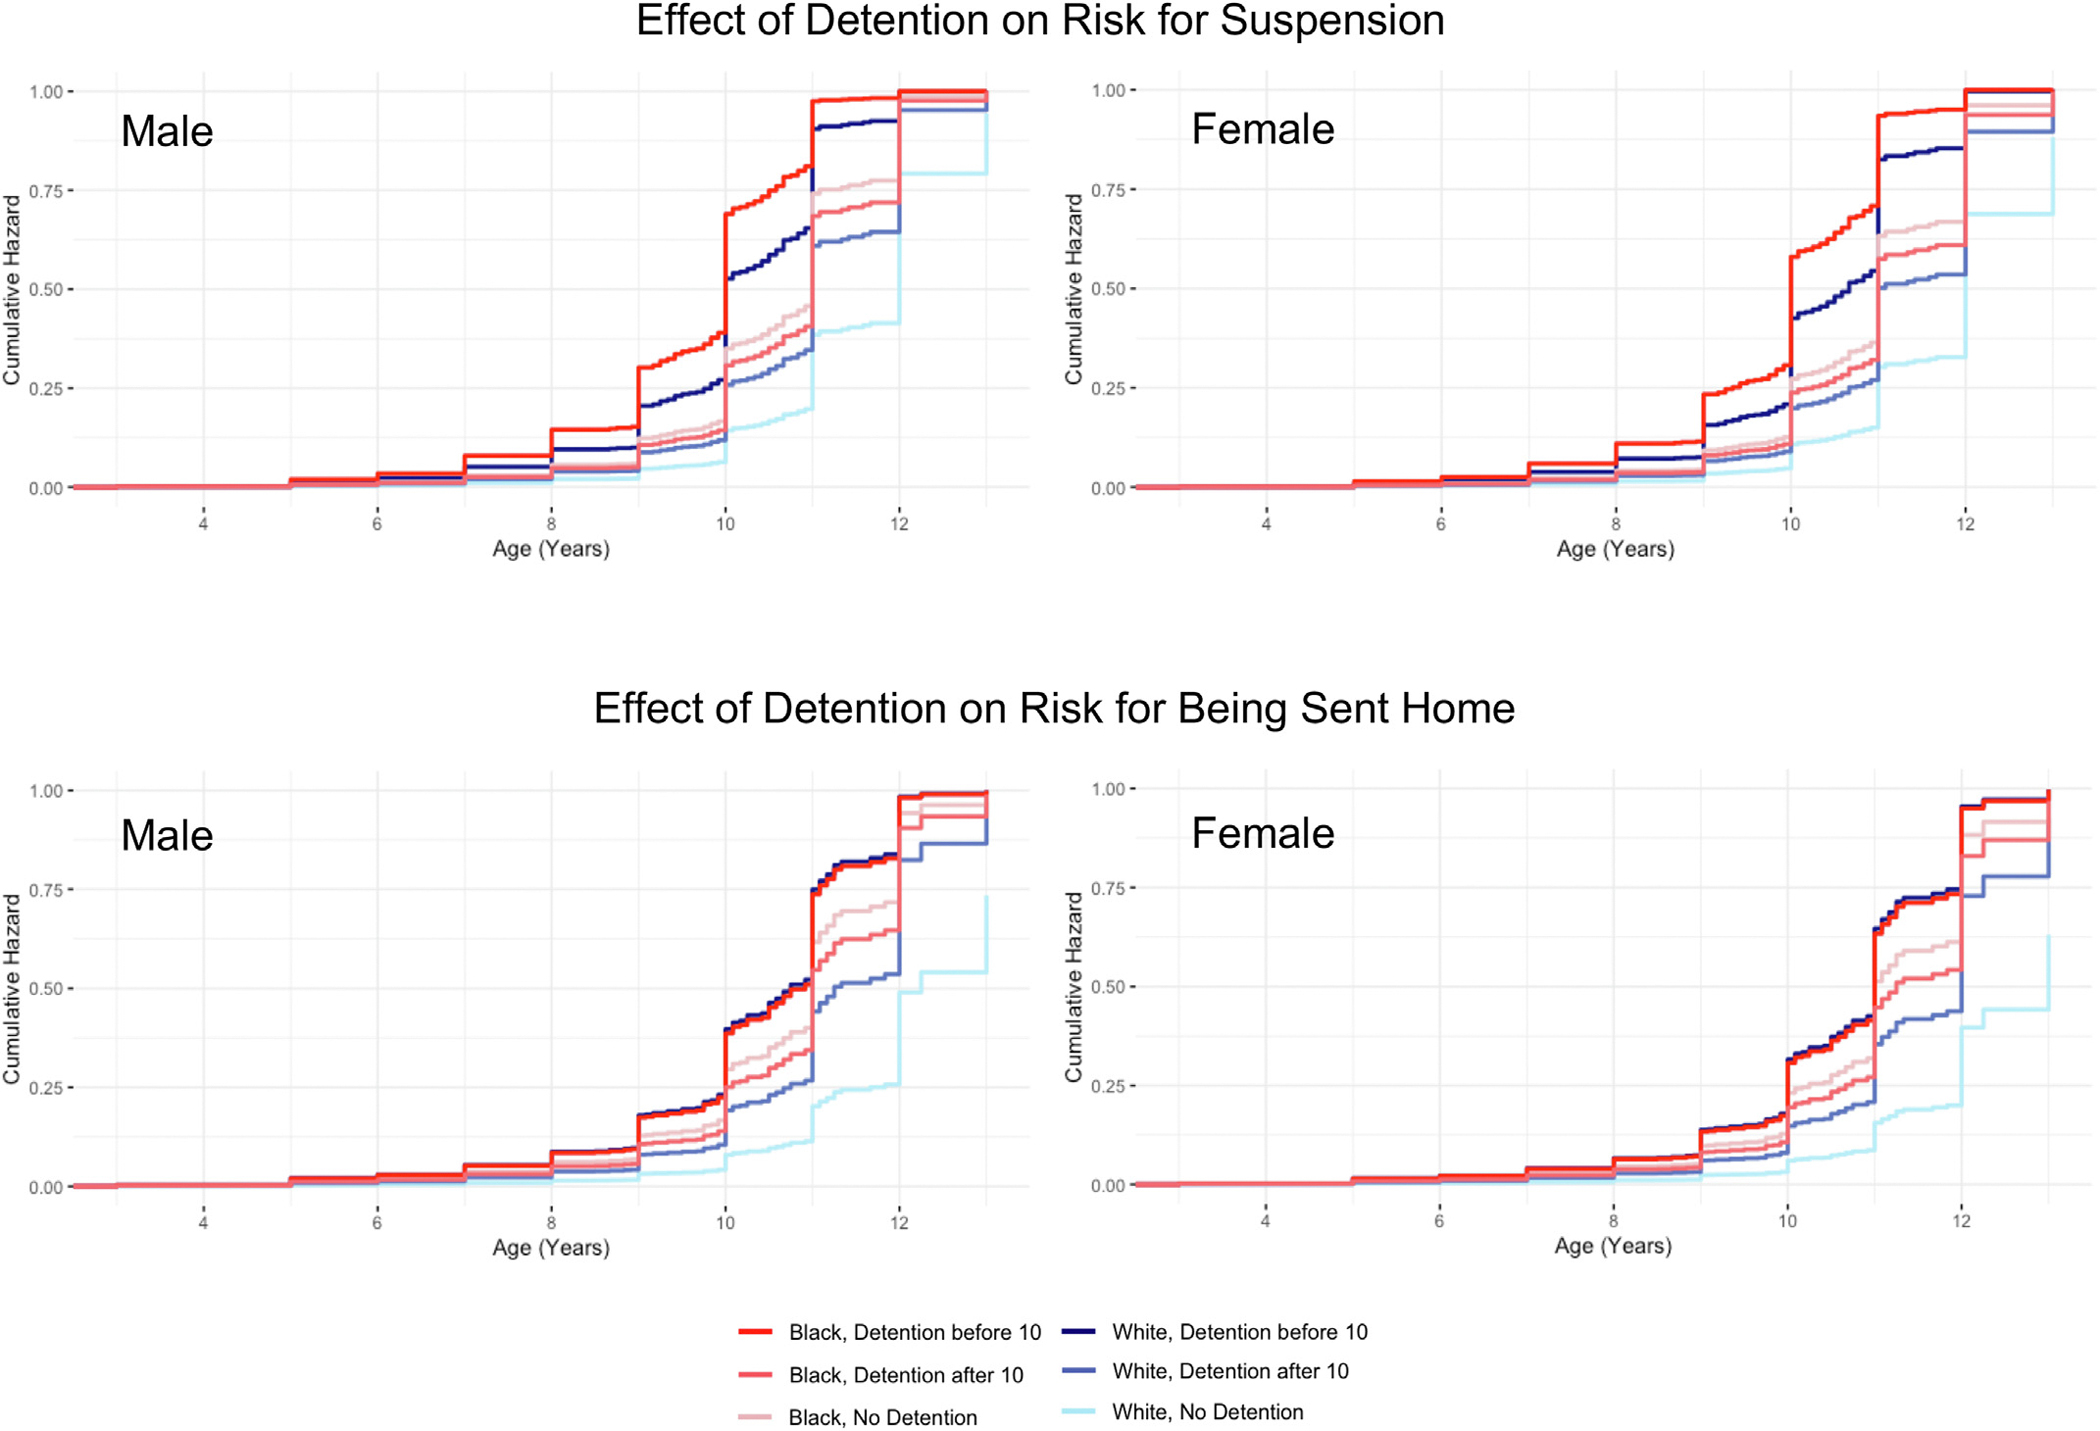
Note: Cumulative hazards are derived from Cox proportional hazard models including race, sex, Delinquency score, Childhood Opportunity Index score, timing of detention (never, before age 10, after age 10), and interaction between race and timing.
Effect of Suspension.
There was a significant main effect of timing of suspension on probability for being sent home, such that receiving suspension before age 10 years conferred the greatest risk, compared to never receiving suspension (HR = 15.57) and receiving suspension after age 10 (HR = 4.97). Receiving suspension after age 10 (compared to never) also was associated with increased probability of being sent home (HR = 3.13). There was evidence that race moderated these associations, such that Black youth who received suspension before age 10 had a greater probability than White youth, when compared to both youth who had been suspended after age 10 (HR = 0.27) and those who had never been suspended (HR = 0.49). Race did not moderate the association between receiving a suspension and police contact.
Effect of Being Sent Home for Bad Behavior.
Being sent home for bad behavior before age 10 was associated with higher probability of suspension, when compared to both youth who had never been sent home for bad behavior (HR = 3.23) and those that were after age 10 (HR = 1.98). Youth who were sent home after age 10 had a higher probability of experiencing suspension than youth who were never suspended (HR = 1.64). Race did not moderate the association between being sent home and risk for suspension. In addition, timing of being sent home and its interaction with race was not associated with risk for police contact.
DISCUSSION
Racial disparities in exclusionary discipline practices and police contact among school aged youth constitute a well-documented phenomenon that contributes to the increased and early marginalization of Black youth.35–37 Recent research has found evidence that these disparities are present as early as preschool.38 However, information is still needed to determine the impact of race on the experience, timing, and escalation of exclusionary discipline and police contact.
The results of the current study parallel those from Fadus et al.,10 who found, using data from ABCD, that Black and multiracial Black children had higher odds of receiving a detention or suspension compared to White children. Our findings are consistent with this study; however, we capitalize on additional information available in the ABCD-SD study to parse differences among the exclusionary discipline types in greater detail. We found that, over and above individual behavior problems and out-of-school factors known to influence mental health and disruptive behavior problems, racial disparities were still apparent in school disciplinary practices and police contact (Table 2). We also detected significant interactions between race and sex in risk of receiving suspension and being sent home for bad behavior, such that Black male youth experienced these events at an earlier age. For example, Figure 1 shows that the cumulative hazard for Black male youth for experiencing suspension and being sent home has a steeper slope than any of the other categories. These findings are consistent with those reported by Wesley and Ellis,37 who found that preschool-age Black boys were being “pushed out” from early educational settings and called for additional training and resources for early childhood educators to decrease the use of exclusionary discipline.
We found evidence that experiencing detention, suspension, and being sent home, particularly before age 10, subsequently increased risk for more severe exclusionary discipline and contact with the justice system (Table 3, Figure 2). Youth who experienced these events before age 10 were at the highest risk for experiencing other forms of exclusionary discipline, even after controlling for overall level of delinquency, neighborhood enrichment, race, and sex. We also found that, in some cases, race was associated with an accelerated cascade of increasingly severe disciplinary punishments in school. School sanctions did not follow a clear linear pattern for all youth (ie, not everyone who reported receiving a suspension had also received detention). However, the previous experience of exclusionary discipline—specifically, detention and being sent home—interacted with race to increase risk for more severe punishment at school. Black youth who experienced detention, both before and after age 10, were significantly more likely to be sent home for bad behavior. Highlighting the importance of the timing, Black youth who experienced suspension before age 10 (but not after age 10) were at increased risk for being sent home, highlighting the impact of having a record of exclusionary discipline before even starting middle school. Overall, these results demonstrate that early exclusionary punishment is associated with increased risk for contact with the justice system, an outcome with potentially dire consequences.
There are several limitations to note. Reports were retrospective, and consequently the results regarding the timing of each event cannot be interpreted as exact. In addition, our measure of delinquency reflects the number of delinquent behaviors endorsed by the youth and parent, but not the severity or frequency of these behaviors. Future work should extend these findings by including information about severity of delinquency as participants in the ABCD Study age. Future analyses should also examine the impact of these disciplinary events on development and acceleration of mental health problems in youth. Finally, we focused on individual-level factors such as self-report of delinquency and demographic characteristics as explanatory variables. School-level variables are also important to consider (eg, demographic makeup of the classroom)39 for future analyses.
Implications for Policy and Practice
Our findings suggest that disciplinary exclusion at a young age is a racialized risk factor that shapes pathways into further cycles of exclusion and punishment by both schools and legal actors (eg, police). It has been noted for decades that the education system can serve as a catalyst for harming the prospect of success for many young Black male youth,40 and our findings support that possibility. Our core findings also speak to the relevance of developmental timing in how school punishment and its escalation become racialized, and highlight multiple levers for early intervention that may disrupt the school-to-prison pipeline.
First, evidence-based alternatives to exclusionary discipline must be implemented to mitigate Black youths’ risk of continuing on a racialized pathway to further marginalization and exclusion in schools.16 For instance, there is a growing effort to replace exclusionary discipline with non-punitive relational approaches to student misconduct that have shown promise in their ability to reduce the need for suspensions.41 Our findings suggest that these alternatives should be adapted to transform elementary and even preschool discipline strategies. Such strategies hold promise for reducing early disparities in seemingly “minor” forms of exclusionary discipline that, for Black youth in particular, often escalate into more severe forms across development. Also, critical consciousness and transformative justice curricula and training for administrators and personnel should also be considered as a way to create change in school systems, mitigating further marginalization and criminalization of students.42,43
Second, schools must take additional steps to invest in mental health and disability services, which can reduce the overuse (or misuse) of punitive discipline measures. Very often, the children with unmet mental health needs are labeled “problem children,” receiving more punishment, and our findings provide evidence in support of this.44 Investment in supports that meet the health needs of the whole child can lessen the need for punitive approaches that often engender collateral harms in the long run.
Third, adults working in school settings (eg, teachers, school police) could benefit from skill-based training centered on responding to misbehaviors without coercion, marginalization, or the need to escalate conflict. This training should include comprehensive education on how intersecting systems of oppression create bias and shape adults’ views of young people, particularly youth of color.45 This type of training may improve adults’ abilities to respond to misbehavior in developmentally appropriate, non-stigmatizing ways, enhancing trust between students and authority figures in the school and promoting school engagement.
Fourth, providing meaningful engagement can provide more effective avenues for youths’ development of a sense of control and self-worth.46 This may include creating regular school-based opportunities for students to be active players (and decision makers) in the efforts to build a positive school culture. These student-led efforts can not only produce innovative and effective conflict management strategies, but also increase student empowerment and autonomy, indirectly reducing overreliance on coercive discipline practices.
Finally, the potential value of legislation in limiting early childhood exclusionary discipline cannot be overstated. History has shown that these legislative efforts can produce major results. For instance, after the Texas legislature passed HB 674 in 2017, prohibiting out-of-school suspensions for public school students in pre-K through second grade except under the most severe circumstances (eg, bringing a weapon to school), the total number of these suspensions dropped by 79%.47 Policies that institute a minimum age or grade for exclusionary discipline may help to limit the racialized escalation of exclusionary discipline detected in the current study and even disrupt the school-to-prison pipeline.
Supplementary Material
Acknowledgments
The ABCD data repository grows and changes over time. The ABCD data used in this report came from ABCD Study’s Data Release 5.0 (https://doi.org/10.15154/8873-zj65). Data used in the preparation of this article were obtained from the Adolescent Brain Cognitive DevelopmentSM (ABCD) Study (https://abcdstudy.org), held in the NIMH Data Archive (NDA). This is a multisite, longitudinal study designed to recruit more than 10,000 children age 9–10 and follow them over 10 years into early adulthood. The ABCD Study is supported by the National Institutes of Health and additional federal partners under award numbers U01DA041048, U01DA050989, U01DA051016, U01DA041022, U01DA051018, U01DA051037, U01DA050987, U01DA041174, U01DA041106, U01DA041117, U01DA041028, U01DA041134, U01DA050988, U01DA051039, U01DA041156, U01DA041025, U01DA041120, U01DA051038, U01DA041148, U01DA041093, U01DA041089, U24DA041123, U24DA041147. A full list of supporters is available at https://abcdstudy.org/federal-partners. html. A listing of participating sites and a complete listing of the study investigators can be found at https://abcdstudy.org/consortium_members/. ABCD consortium investigators designed and implemented the study and/or provided data but did not necessarily participate in the analysis or writing of this report. This manuscript reflects the views of the authors and may not reflect the opinions or views of the NIH or ABCD consortium investigators. This project was supported by Award Number 2017-MU-CX-0044, awarded by the National Institute of Justice, Office of Justice Programs, US Department of Justice with additional funding from the Centers for Disease Control and Prevention, US Department of Health and Human Services. The opinions, findings, and conclusions or recommendations expressed in this publication/program/exhibition are those of the author(s) and do not necessarily reflect those of the Department of Justice or the Department of Health and Human Services.
Additional support for this work was made possible from NIEHS R01-ES032295 and R01-ES031074, and NIMH grant R21MH126130, Postdoctoral fellowship from MindCORE (Center for Outreach, Research, and Education) at the University of Pennsylvania.
This work has been previously posted on a preprint server: https://doi.org/10.31234/osf.io/7azqn.
Footnotes
Disclosure: Dr. Brislin has received funding from the National Institute on Alcohol Abuse and Alcoholism (NIAAA; U01AA021690). Dr. Clark has received funding from the National Institute on Drug Abuse (P50DA046346). Dr. Hicks has received funding from the National Institute of Mental Health (K18 MH135466) and NIAAA (R01AA025790). These grants did not support this research. Drs. Perkins, Ahonen, McCoy, Boxer, and Jackson and Ms. Choi have reported no biomedical financial interests or potential conflicts of interest.
CRediT authorship contribution statement
Sarah J. Brislin: Writing – review & editing, Writing – original draft, Visualization, Funding acquisition, Formal analysis, Data curation, Conceptualization. Maia Choi: Writing – review & editing, Writing – original draft, Formal analysis. Emily R. Perkins: Writing – review & editing, Writing – original draft. Lia Ahonen: Writing – review & editing, Resources, Conceptualization. Henrika McCoy: Writing – review & editing. Paul Boxer: Writing – review & editing, Writing – original draft, Conceptualization. Duncan B. Clark: Writing – review & editing, Writing – original draft, Conceptualization. Dylan B. Jackson: Writing – review & editing, Writing – original draft, Conceptualization. Brian M. Hicks: Writing – review & editing, Writing – original draft, Conceptualization.
This article is part of a special series devoted to addressing bias, bigotry, racism, and mental health disparities through research, practice, and policy. The 2023 Antiracism Team includes Deputy Editor Lisa R. Fortuna, MD, MPH, MDiv, Consulting Editor Andres J. Pumariega, MD, PhD, Diversity, Equity, and Inclusion Emerging Leaders Fellows Tara Thompson-Felix, MD, and Amalia Londoño Tobón, MD, Assistant Editor Eraka Bath, MD, Deputy Editor Wanjikũ F.M. Njoroge, Associate Editor Robert R. Althoff, MD, PhD, and Editor-in-Chief Douglas K. Novins, MD.
Contributor Information
Sarah J. Brislin, Rutgers University, Piscataway, New Jersey..
Maia Choi, Rutgers University, Piscataway, New Jersey..
Emily R. Perkins, University of Pennsylvania, Philadelphia, Pennsylvania..
Lia Ahonen, University of Pittsburgh, Pittsburgh, Pennsylvania..
Henrika McCoy, University of Texas at Austin, Austin, Texas..
Paul Boxer, Rutgers University, Newark, New Jersey..
Duncan B. Clark, University of Pittsburgh, Pittsburgh, Pennsylvania..
Dylan B. Jackson, Johns Hopkins University, Baltimore, Maryland..
Brian M. Hicks, University of Michigan, Ann Arbor, Michigan..
REFERENCES
- 1.Jacobsen WC, Pace GT, Ramirez NG. Punishment and inequality at an early age: exclusionary discipline in elementary school. Social Forces. 2019;97(3):973–998. 10.1093/sf/soz039 [DOI] [PMC free article] [PubMed] [Google Scholar]
- 2.Novak A, Krohn M. Collateral consequences of school suspension: examining the ‘knifing off’hypothesis. Am J Crimin Justice. 2021;46:728–747. 10.1007/s12103-020-09579-5 [DOI] [Google Scholar]
- 3.Welsh RO, Little S. Caste and control in schools: a systematic review of the pathways, rates and correlates of exclusion due to school discipline. Child Youth Services Rev. 2018;94:315–339. 10.1016/j.childyouth.2018.09.031 [DOI] [Google Scholar]
- 4.Jabbari J, Johnson O Jr. The process of “pushing out”: accumulated disadvantage across school punishment and math achievement trajectories. Youth Society. 2022;54(6):911–934. 10.1177/0044118X211007175 [DOI] [Google Scholar]
- 5.Rosenbaum J Educational and criminal justice outcomes 12 years after school suspension. Youth Society. 2020;52(4):515–547. 10.1177/0044118X17752208 [DOI] [PMC free article] [PubMed] [Google Scholar]
- 6.Skiba RJ, Chung C-G, Trachok M, Baker TL, Sheya A, Hughes RL. Parsing disciplinary disproportionality: contributions of infraction, student, and school characteristics to out-of-school suspension and expulsion. Am Educ Res J. 2014;51(4):640–670. 10.3102/0002831214541670 [DOI] [Google Scholar]
- 7.Skiba RJ, Horner RH, Chung C-G, Rausch MK, May SL, Tobin T. Race is not neutral: a national investigation of African American and Latino disproportionality in school discipline. Sch Psychol Rev. 2011;40(1):85–107. 10.1080/02796015.2011.12087730 [DOI] [Google Scholar]
- 8.Smith LH, Bottiani JH, Kush JM, Bradshaw CP. The discipline gap in context: the role of school racial and ethnic diversity and within school positionality on out-of-school suspensions. J Sch Psychol. 2023;98:61–77. 10.1016/j.jsp.2023.02.006 [DOI] [PubMed] [Google Scholar]
- 9.Ksinan AJ, Vazsonyi AT, Ksinan Jiskrova G, Peugh JL. National ethnic and racial disparities in disciplinary practices: a contextual analysis in American secondary schools. J Sch Psychol. 2019;74:106–125. 10.1016/j.jsp.2019.05.003 [DOI] [PubMed] [Google Scholar]
- 10.Fadus MC, Valadez EA, Bryant BE, et al. Racial disparities in elementary school disciplinary actions: findings from the ABCD study. J Am Acad Child Adolesc Psychiatry. 2021;60(8):998–1009. 10.1016/j.jaac.2020.11.017 [DOI] [PMC free article] [PubMed] [Google Scholar]
- 11.Owens J, McLanahan SS. Unpacking the drivers of racial disparities in school suspension and expulsion. Social Forces. 2020;98(4):1548–1577. 10.1093/sf/soz095 [DOI] [PMC free article] [PubMed] [Google Scholar]
- 12.Wegmann KM, Smith B. Examining racial/ethnic disparities in school discipline in the context of student-reported behavior infractions. Child Youth Services Rev. 2019;103:18–27. [Google Scholar]
- 13.Barnes JC, Motz RT. Reducing racial inequalities in adulthood arrest by reducing inequalities in school discipline: evidence from the school-to-prison pipeline. Dev Psychol. 2018;54(12):2328. 10.1037/dev0000613 [DOI] [PubMed] [Google Scholar]
- 14.Hemez P, Brent JJ, Mowen TJ. Exploring the school-to-prison pipeline: how school suspensions influence incarceration during young adulthood. Youth Violence Juv Justice. 2020;18(3):235–255. 10.1177/1541204019880945 [DOI] [PMC free article] [PubMed] [Google Scholar]
- 15.Mowen T, Brent J. School discipline as a turning point: the cumulative effect of suspension on arrest. J Res Crime Delinquency. 2016;53(5):628–653. 10.1177/0022427816643135 [DOI] [Google Scholar]
- 16.Jackson D, Testa A, Todic J, Leos-Martinez J. Exclusionary school discipline during childhood and adolescent police encounters. Deviant Behav. 2022;43(5):573–592. 10.1080/01639625.2021.1891843 [DOI] [Google Scholar]
- 17.Mittleman J A downward spiral? Childhood suspension and the path to juvenile arrest. Sociol Educ. 2018;91(3):183–204. 10.1177/0038040718784603 [DOI] [Google Scholar]
- 18.Miller S, Malone PS, Dodge KA. Conduct Problems Prevention Research Group. Developmental trajectories of boys’ and girls’ delinquency: sex differences and links to later adolescent outcomes. J Abnorm Child Psychol. 2010;38:1021–1032. 10.1007/s10802-010-9430-1 [DOI] [PMC free article] [PubMed] [Google Scholar]
- 19.Essien I, Wood JL. Suspected, surveilled, singled-out, and sentenced: an assumption of criminality for Black males in early learning. J Negro Educ. 2022;91(1):65–82. [Google Scholar]
- 20.Howard TC. How does it feel to be a problem? Black male students, schools, and learning in enhancing the knowledge base to disrupt deficit frameworks. Rev Res Educ. 2013;37(1):54–86. 10.3102/0091732X12462985 [DOI] [Google Scholar]
- 21.Blake JJ, Butler BR, Lewis CW, Darensbourg A. Unmasking the inequitable discipline experiences of urban Black girls: implications for urban educational stakeholders. Urban Rev. 2011;43:90–106. 10.1007/s11256-009-0148-8 [DOI] [Google Scholar]
- 22.Sampson RJ, Wilson WJ. Toward a Theory of Race, Crime, and Urban Inequality. Crime, inequality and the state. Routledge; 2020:312–325. [Google Scholar]
- 23.Huff J Understanding police decisions to arrest: the impact of situational, officer, and neighborhood characteristics on police discretion. J Crimin Justice. 2021;75:101829. 10.1016/j.jcrimjus.2021.101829 [DOI] [Google Scholar]
- 24.Geller A Youth–police contact: burdens and inequities in an adverse childhood experience, 2014–2017. Am J Public Health. 2021;111(7):1300–1308. 10.2105/AJPH.2021.306259 [DOI] [PMC free article] [PubMed] [Google Scholar]
- 25.Zeiders KH, Umaña-Taylor AJ, Carbajal S, Pech A. Police discrimination among Black, Latina/x/o, and White adolescents: examining frequency and relations to academic functioning. J Adolesc. 2021;90:91–99. 10.1016/j.adolescence.2021.06.001 [DOI] [PubMed] [Google Scholar]
- 26.Jackson DB. The Case for Conceptualizing Youth–Police Contact as a Racialized Adverse Childhood Experience. Am Public Health Assoc. 2021;1189–1191. [DOI] [PMC free article] [PubMed] [Google Scholar]
- 27.Jindal M, Mistry KB, Trent M, McRae A, Thornton RL. Police exposures and the health and well-being of Black youth in the US: a systematic review. JAMA Pediatr. 2022;176:78–88. 10.1001/jamapediatrics.2021.2929 [DOI] [PubMed] [Google Scholar]
- 28.McFarland MJ, Geller A, McFarland C. Police contact and health among urban adolescents: the role of perceived injustice. Soc Sci Med. 2019;238:112487. 10.1016/j.socscimed.2019.112487 [DOI] [PubMed] [Google Scholar]
- 29.Del Toro J, Jackson DB, Wang M-T. The policing paradox: police stops predict youth’s school disengagement via elevated psychological distress. Dev Psychol. 2022;58(7):1402. 10.1037/dev0001361 [DOI] [PMC free article] [PubMed] [Google Scholar]
- 30.Jackson DB, Fahmy C, Vaughn MG, Testa A. Police stops among at-risk youth: repercussions for mental health. J Adolesc Health. 2019;65(5):627–632. 10.1016/j.jadohealth.2019.05.027 [DOI] [PubMed] [Google Scholar]
- 31.Achenbach TM, Rescorla LA, McConaughey S, Pecora P, Wetherbee K, Ruffle T. Achenbach system of empirically based assessment. Handbook of psychological and educational assessment of children: Personality, behavior, and context. 2003;2:406–432. [Google Scholar]
- 32.Brislin SJ, Clark DA, Clark DB, et al. Differential item functioning in reports of delinquent behavior between Black and White youth: evidence of measurement bias in self-reports of arrest in the adolescent brain cognitive development study. Assessment. 2023:10731911231164627. 10.1177/10731911231164627 [DOI] [PMC free article] [PubMed] [Google Scholar]
- 33.Fan CC, Marshall A, Smolker H, et al. Adolescent Brain Cognitive Development (ABCD) Study Linked External Data (LED): protocol and practices for geocoding and assignment of environmental data. Dev Cogn Neurosci. 2021;52:101030. 10.1016/j.dcn.2021.101030 [DOI] [PMC free article] [PubMed] [Google Scholar]
- 34.Therneau T A Package for Survival Analysis in R. R package version 3.5–8. Accessed April 12, 2024. https://CRAN.R-project.org/package=survival [Google Scholar]
- 35.Bal A, Betters-Bubon J, Fish RE. A multilevel analysis of statewide disproportionality in exclusionary discipline and the identification of emotional disturbance. Educ Urban Soc. 2019;51(2):247–268. 10.1177/0013124517716260 [DOI] [Google Scholar]
- 36.Labeling Pesta R. and the differential impact of school discipline on negative life outcomes: assessing ethno-racial variation in the school-to-prison pipeline. Crime Delinquency. 2018;64(11):1489–1512. 10.1177/0011128717749223 [DOI] [Google Scholar]
- 37.Wesley L, Ellis AL. Exclusionary discipline in preschool: young Black boys’ lives matter. J Afr Am Males Educ. 2017;8(2):22–29. [Google Scholar]
- 38.Henneman TK. Preschool Expulsions: Parental Experiences of Black Boys Who Were Pushed Out or Left Behind. Mills College; 2014. Accessed April 12, 2024. https://login.proxy.libraries.rutgers.edu/login?qurl=https%3A%2F%2Fwww.proquest.com%2Fdissertations-theses%2Fpreschool-expulsions-parental-experiences-black%2Fdocview%2F1658787740%2Fse-2%3Faccountid%3D13626 [Google Scholar]
- 39.Wiley KE. A tale of two logics: school discipline and racial disparities in a “mostly white” middle school. Am J Educ. 2021;127(2):163–192. 10.1086/712084 [DOI] [Google Scholar]
- 40.Kunjufu J The conspiracy to destroy Black boys. Doc Resume. 1985;682:20. [Google Scholar]
- 41.Todic J, Cubbin C, Armour M. Restorative Justice in K-12 Schools as a Structural Health Equity Intervention. In: Vaughn M, Salas-Wright CP, Jackson DB, eds. International Handbook of Delinquency and Health. Routledge; 2019:269–290. [Google Scholar]
- 42.Anand D, Hsu L. Think outside the book: transformative justice using children’s literature in educational settings. J Curriculum Stud Res. 2020;2(2):122–143. 10.46303/jcsr.2020.13 [DOI] [Google Scholar]
- 43.Souto-Manning M, Winn LT. Toward shared commitments for teacher education: transformative justice as an ethical imperative. Theory Pract. 2019;58(4):308–317. 10.1080/00405841.2019.1626619 [DOI] [Google Scholar]
- 44.Miller CE, Meyers SA. Disparities in school discipline practices for students with emotional and learning disabilities and autism. J Educ Hum Dev. 2015;4. 10.15640/jehd.v4n1a23 [DOI] [Google Scholar]
- 45.Carter PL, Skiba R, Arredondo MI, Pollock M. You can’t fix what you don’t look at: acknowledging race in addressing racial discipline disparities. Urban Educ. 2017;52(2):207–235. 10.1177/0042085916660350 [DOI] [Google Scholar]
- 46.Todic J, Cubbin C, Armour M, Rountree M, Gonzalez T. Reframing school-based restorative justice as a structural population health intervention. Health Place. 2020;62:102289. 10.1016/j.healthplace.2020.102289 [DOI] [PMC free article] [PubMed] [Google Scholar]
- 47.Suspension Report 2019. Texans Care for Children. Keeping Kids in Class II: Analysis of Suspensions in Pre-K through 2nd Grade in Texas Schools in 2017–18. Accessed May 23, 2023. https://static1.squarespace.com/static/5728d34462cd94b84dc567ed/t/5d66db90cffcc60001618eec/1567021974145/Suspensions-Report-2019.pdf [Google Scholar]
Associated Data
This section collects any data citations, data availability statements, or supplementary materials included in this article.