

Abstract
Aim
Our aim was to examine how fever duration affected the ability of biomarkers to diagnose community‐acquired pneumonia (CAP).
Methods
This was a retrospective cohort study of children aged 2–18 years who attended the emergency department at Schneider Children's Medical Centre of Israel with CAP from June 2015 to May 2020. The children underwent biomarker measurements and chest radiographs and optimal biomarker thresholds were identified. Biomarker predictions of x‐ray positive CAP were analysed, using receiver operating characteristic curves and area under the curve calculations.
Results
We screened 3346 children, 509 met the inclusion criteria and 363 of those had x‐ray positive CAP. White blood counts of >15 000/mm3 and absolute neutrophil counts of >11 200/mm3 showed significant discriminatory power on day 2 of a fever. A neutrophil to lymphocyte ratio (NLR) of >4.5 displayed significant discriminatory power from days 2–5 and peaked on day 4. C‐reactive protein of 6.23 mg/dL was discriminatory on day 4.
Conclusion
Fever duration affected how effectively biomarkers diagnosed x‐ray positive CAP and all were unreliable on day 1. The NLR showed the most consistent reliability and may be suitable for clinical decision‐making. Fever duration should be considered to optimise diagnostic accuracy.
Keywords: biomarkers, community‐acquired pneumonia, C‐reactive protein, emergency department, neutrophil–lymphocyte ratio
Abbreviations
- ANC
absolute neutrophil count
- AUC
area under the curve
- CAP
community‐acquired pneumonia
- CI
confidence interval
- CRP
C‐reactive protein
- ED
emergency department
- NLR
neutrophil to lymphocyte ratio
- SD
standard deviation
- WBC
white blood count
Key notes.
This study aimed to evaluate what impact fever duration had on how accurately biomarkers diagnosed community‐acquired pneumonia (CAP) in children who attended an Israeli emergency department.
White blood counts and absolute neutrophil counts peaked on day 2, C‐reactive protein peaked on day 4 and the neutrophil to lymphocyte ratio was reliable from days 2–5.
We concluded that using fever duration in such cases would improve diagnostic accuracy.
1. INTRODUCTION
Community‐acquired pneumonia (CAP) is still a leading cause of childhood morbidity and mortality, despite significant governmental and non‐governmental resources. 1 , 2 According to the World Health Organisation, it accounted for more than 740 000 deaths worldwide in 2019 and 14% of deaths of children under 5 years of age. 3 The main burden occurred in the developing world, but severe outcomes are not uncommon in high‐income countries. 4 , 5 Detecting CAP relies on a combination of clinical assessments, laboratory testing, and imaging and has been shown to lack precision. 6 There is no reliable CAP severity score for children, unlike adults. 7 , 8 Overdiagnosis and underdiagnosis have been common, 9 resulting in unnecessary antibiotic use and hospitalisation and increased morbidity, respectively.
Blood biomarkers have improved the detection of bacterial infections and these have included C‐reactive protein (CRP), procalcitonin, the white blood count (WBC) and the absolute neutrophil count (ANC), alone and in combination. 10 , 11 However, a large‐scale meta‐analysis found that their ability to differentiate between bacterial and viral infections was suboptimal. CRP and procalcitonin performed better than WBC, with sensitivity and specificity of around 70% and 65%, respectively. 12 The neutrophil to lymphocyte ratio (NLR) is often overlooked, but it is another valuable tool for detecting infections, particularly CAP. 13 , 14 During the early stages of a bacterial infection, there is a surge in immature neutrophils, which coincides with supressed lymphocyte production and apoptosis. This imbalance has been shown to elevate NLR, which could make it a more accurate marker than individual neutrophil or lymphocyte counts. 15
It has been suggested that considering the time that has lapsed from fever onset can improve the ability of biomarker performance to detect bacterial infections. 16 The aim of this study was to test this hypothesis, by studying children with CAP who presented to an emergency department (ED).
2. METHODS
2.1. Study population and data collection
This was a retrospective cohort study, based on the electronic medical records of children who attended the ED at Schneider Children's Medical Center of Israel. This tertiary paediatric hospital receives ~ 53 000 ED visits a year.
We examined the records of children aged 2–18 years from 1 June 2015 to 31 May 2020. Infants were excluded to avoid overlaps with acute viral bronchiolitis. Pneumonia diagnoses required an International Classification of Diseases, Ninth Revision code of 486.0–9 for children who were admitted to the hospital or discharged home. A full dataset was a prerequisite for inclusion, including information about days of fever, complete blood count, CRP and chest x‐ray. Further information was retrieved from the medical records, including demographics, oxygen saturation in room air, and the presence of chest pain. Children with significant comorbidities, such as chronic respiratory disease, immunodeficiency, and malignancies, were excluded. The analyses included data that had clustered according to the time that had elapsed since the onset of fever: 1, 2, 3, 4, 5 days or more than 5 days.
2.2. Diagnosis of radiographically confirmed CAP
The chest x‐ray reports were routinely interpreted by a senior radiologist, who categorised them using descriptors for radiographic CAP. This process followed the standardised interpretation guidelines established by the World Health Organisation Radiology Working Group and other studies. 17 , 18 A patient was described as having x‐ray‐positive CAP if it was radiographically confirmed by the presence of consolidation, infiltrates occupying a portion or the whole lobe, the entire lung or pleural effusion. Patients were categorised as having x‐ray‐negative CAP if the chest x‐ray was normal or the report described issues such as linear, patchy, or interstitial infiltrates, peribronchial thickening, and small areas of atelectasis. Any disagreement about the classifications was resolved through discussion and consensus by three senior paediatric pulmonologists (OG, ES, and PS). Patients with x‐ray‐positive and x‐ray‐negative CAP were compared.
2.3. Statistical analysis
All data are expressed as means and standard deviations (SD), medians, and interquartile ranges or frequencies and percentages. Categorical variables were compared using the Chi‐square test or Fisher's exact test, as appropriate. Ordinal variables were compared using the Mann–Whitney U test and continuous variables were analysed using the Student's t‐test. Some biomarkers lacked predefined optimal cut‐off points, including the NLR. In these cases, we used the Youden Index method, through receiver operating characteristics curves to determine the optimal threshold for classification. The biomarker analysis evaluated their discriminatory ability by generating receiver operating characteristics curves and calculating the area under the curve (AUC), with corresponding 95% confidence intervals (CIs). A two‐tailed p‐value of <0.05 was statistically significant. All the statistical analyses were performed using the SPSS, version 24 (IBM Corp, New York, USA).
2.4. Biomarkers
Data on biomarkers obtained during the ED attendance, including WBC, ANC, NLR, and CRP were collected. Cut‐off values were used, when available, as defined by previous studies of children with CAP assessed in EDs. 6 Abnormal values were defined as WBC above 15 000/mm3, ANC above 11 200/mm3 and CRP above 6.23 mg/dL. An NLR of 4.5 was used as the cut‐off value, following Youden's J statistical analysis. 19
3. RESULTS
A total of 3346 children attended the ED and were diagnosed with CAP from 1 June 2015 to 31 May 2020. Figure 1 shows how children were excluded from the final analysis, due to chronic diseases and incomplete datasets. A total of 509 children met all the required criteria and were included in the final analyses: 363 with x‐ray‐positive CAP and 146 with x‐ray‐negative CAP.
FIGURE 1.
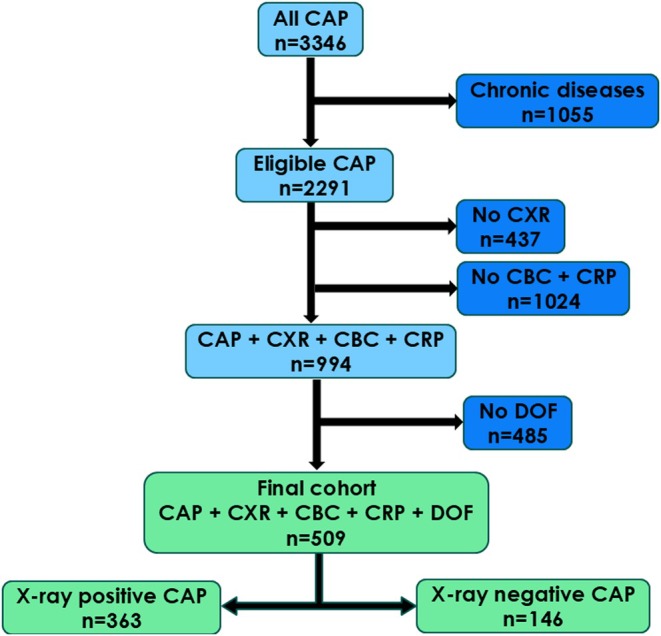
Flowchart showing the selection process for the final cohort. Children were excluded if they presented to the ED with chronic diseases, chest x‐rays, and complete blood counts were not available and the days of fever were not recorded. The cohort was divided into children with radiographic evidence of community‐acquired pneumonia (x‐ray positive) and those without (x‐ray negative). CAP, community‐acquired pneumonia; CBC, complete blood count; CXR, chest x‐ray; DOF, days of fever.
Children with x‐ray‐positive CAP were older than those with x‐ray‐negative CAP: mean 5.4 (3.6 SD) versus 4.4 (3.3 SD) years (p = 0.003). More time had elapsed from the onset of fever in those with x‐ray‐positive than x‐ray‐negative CAP: mean 4.4 (3.2 SD) versus 3.2 (2.5 SD) days (p < 0.001). The x‐ray‐positive group also displayed more focal examination findings (48% vs. 38%, p = 0.02). There were no differences in the number of children with hypoxia or chest pain (Table 1).
TABLE 1.
Comparison between children with (x‐ray‐positive) and without (x‐ray negative) radiographic evidence of CAP who visited the ED.
| Parameter | X‐ray‐positive CAP | X‐ray‐negative CAP | p‐Value |
|---|---|---|---|
| n = 363 | n = 146 | ||
| Age (years) a | 5.4 (3.6) | 4.4 (3.3) | 0.003 |
| Gender (female) | 173 (47.7%) | 77 (52.7%) | 0.30 |
| Fever duration (days) prior to attendance a | 4.4 (3.2) | 3.2 (2.5) | <0.001 |
| Oxygen saturation < 92% in room air | 20 (5.5%) | 6 (4.1%) | 0.61 |
| Chest pain | 29 (7.9%) | 10 (6.2%) | 0.48 |
| Focal lung auscultation findings | 178 (48.2%) | 55 (37.6%) | 0.02 |
Note: The significance value of each comparison in written in the P‐value column . When the P value is very small (e.g., under 0.001) it is quiet common to write it as <0.001 and not the exact number (that is very very small). For example ‐ https://pmc.ncbi.nlm.nih.gov/articles/PMC4877414/
Mean (SD).
3.1. Biomarker dynamics over time
In the x‐ray‐positive CAP group, WBC peaked on the second day of fever at 20.4 (8.9 SD) mm3 and fell on days 3 and 4, to reach 14.1 (7.7 SD) mm3 on the fifth day of fever. The group with x‐ray‐negative CAP showed a similar pattern, with WBC peaking on the first day of fever at 16.4 (7.7 SD) mm3 and then trending downwards to reach 10.4 (4.3 SD) mm3 by the fifth day (Figure 2). The WBC cut‐off value of 15.0 mm3 was only able to discriminate reliably between the groups on day 2 (AUC 0.68, 95% CI 0.56–0.79, p = 0.004), as shown in Table 2.
FIGURE 2.
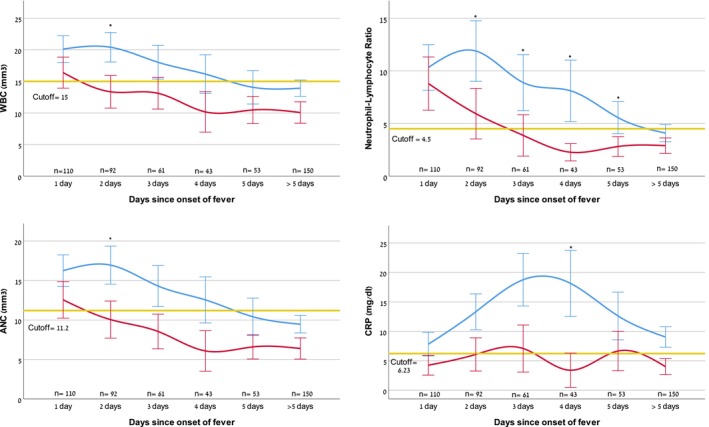
Biomarkers at emergency department attendance, in relation to time elapsed since fever onset for radiographically confirmed (x‐ray‐positive, blue line) versus cases with no radiographic confirmation (x‐ray‐negative, red line) community‐acquired pneumonia. Statistically significant AUCs between the two groups at each time point are marked with asterisks. Values displayed are means and 95% confidence intervals. The yellow line represents cut‐off values for the various biomarkers respectively. Abnormal WBC was defined as above 15 000/mm3, ANC above 11 200/mm3, NLR above 4.5, and CRP above 6.23 mg/dL. ANC, absolute neutrophil count; AUC, area under the curve; CRP, C‐reactive protein; NLR, neutrophil to lymphocyte ratio; WBC, white blood count.
TABLE 2.
Sensitivity of biomarkers to predict radiographically confirmed (x‐ray positive) community acquired pneumonia.
| Biomarker | Threshold | Sensitivity a | Specificity a | Overall AUC a | Day 1 | Day 2 | Day 3 | Day 4 | Day 5 | >5 days |
|---|---|---|---|---|---|---|---|---|---|---|
| n = 110 | n = 92 | n = 61 | n = 43 | n = 53 | n = 150 | |||||
| AUC a | AUC a | AUC a | AUC a | AUC a | AUC a | |||||
| WBC (×109/L) | 15 | 53.5 (48.3–58.7) | 66.2 (58.1–73.7) | 0.61 (0.55–0.66) b | 0.61 (0.49–0.73) | 0.68 (0.57–0.79) b | 0.61 (0.45–0.76) | 0.63 (0.45–0.81) | 0.65 (0.49–0.80) | 0.61 (0.49–0.72) |
| ANC (×109/L) | 11.2 | 48.6 (43.4–53.9) | 67.3 (59.2–74.8) | 0.58 (0.53–0.64) b | 0.56 (0.44–0.67) | 0.68 (0.56–0.79) b | 0.63 (0.47–0.78) | 0.64 (0.46–0.82) | 0.66 (0.51–0.81) | 0.58 (0.47–0.69) |
| NLR | 4.5 c | 48.4 (43.2–53.6) | 68.6 (60.6–76.0) | 0.59 (0.54–0.64) b | 0.53 (0.41–0.64) | 0.67 (0.57–0.80) b | 0.66 (0.52–0.81) b | 0.70 (0.54–0.86) b | 0.68 (0.53–0.82) b | 0.60 (0.48–0.71) |
| CRP (mg/dL) | 6.23 | 52.0 (46.8–57.3) | 68.0 (59.9–75.4) | 0.61 (0.55–0.66) b | 0.60 (0.49–0.71) | 0.61 (0.48–0.73) | 0.64 (0.48–0.80) | 0.81 (0.67–0.95) b | 0.60 (0.44–0.76) | 0.56 (0.44–0.68) |
Note: X‐ray positive CAP (n = 363) from a total cohort of CAP (n = 509) according to the time elapsed between onset of fever and ED attendance.
Abbreviations: ANC, absolute neutrophil count; CAP, community‐acquired pneumonia; CRP, C‐reactive protein; NLR, neutrophil to lymphocyte ratio; WBC, white blood count.
95% CI.
Values in bold are statistically significant, p‐value < 0.05.
NLR optimal cut‐off point as calculated by Youden's J statistical analysis.
ANC exhibited a similar pattern to WBC. It peaked in the x‐ray‐positive CAP group on the second day of fever, with a mean value of 16.2 (8.3 SD) mm3, compared with a peak of 12.5 (7.2 SD) mm3 on the first day in the x‐ray‐negative CAP group. The ANC cut‐off value of 11.2 mm3 only reached the significant predictive value on the second day of fever (AUC 0.68, 95% CI 0.56–0.79, p = 0.004).
On the first day of fever, there was no significant difference in mean NLR values between the two groups, with a mean of 10.3 (9.0 SD) 8.8 (7.9 SD) for the x‐ray‐positive and negative CAP groups. However, this changed on the second day of fever, when the NLR rose to 11.9 (10.9 SD) in the positive group, but fell to 5.9 (6.8 SD) in the negative group. This pattern persisted until more than 5 days of fever. The NLR cut‐off of 4.5 was able to significantly discriminate during days 2–5 of fever, peaking on day 4 (AUC 0.70, 95% CI 0.54–0.86, p = 0.044).
CRP peaked later than the white cell components. It reached its highest values on day 3 18.7 (14.6 SD) mg/dL in the x‐ray‐positive group and 7.1 (7.7 SD) mg/dL in the x‐ray‐negative group. On the fourth day of fever, the mean CRP values maximally diverged, with persistently high values, at 18.1 (15.3 SD) mg/dL, in the x‐ray‐positive group, but a decline to 3.4 (4.5 SD) mg/dL in the negative group. The CRP cut‐off value of 6.23 mg/dL was only able to significantly discriminate on day 4 of fever (AUC 0.81, 95% CI 0.67–0.95, p = 0.002).
4. DISCUSSION
This retrospective cohort study scrutinised the dynamic relationship between fever duration and the sensitivity of key biomarkers for diagnosing radiographically confirmed paediatric CAP. The biomarkers exhibited varying levels of discriminatory ability to detect CAP, depending on the time that had elapsed since the onset of the fever. Their effectiveness peaked at different time points. WBC and ANC showed the highest discriminatory ability on the second day of fever. CRP peaked later, on the fourth day. The NLR maintained its reliability the longest, over a period of 4 days, from days 2–5, of fever, while the other markers were only discriminatory on a single day each. None of the biomarkers showed diagnostic accuracy on days 0–1 and beyond 5 days, suggesting poor reliability during these timeframes.
The literature has frequently contained advice on approaching biomarkers, such as WBC 20 , 21 and CRP, 22 , 23 with caution when it comes to diagnosing bacterial CAP. Indeed, the AUC in our receiver operating characteristics curve analysis almost consistently fell below the generally recommended threshold of 0.75, with the exception of CRP on day 4. 24 Nevertheless, moderate discriminatory ability between x‐ray‐positive and negative CAP was achieved at accepted thresholds at certain points in time. As we have shown, the variations in biomarker diagnostic accuracy over time underscored the need for a more nuanced approach when interpreting laboratory results for paediatric CAP.
Segal et al. carried out a prospective observational study on febrile children who presented to an ED. They examined the effect of time from fever onset on diagnostic performance, albeit only for CRP. The optimal threshold for CRP, which indicated a bacterial infection, changed with time from the onset of the fever. It ranged from 6 mg/dL for more than 12–24 h of fever to 12.6 mg/dL for more than 48 h of fever. The input of time from fever onset improved the area under the receiver operating characteristics curve. 16 The notion that CRP, when measured early on, has limited discriminative value, has led some to suggest serial measurements. 25 However, this is an unappealing option, particularly when it comes to children. A better understanding of the interplay between an early rise in WBC, reliable NLR elevation, and a later CRP peak may optimise available biomarker data. This could potentially eliminate the need for sequential measurements.
NLR was arguably the most reliant biomarker in our cohort, as it was able to differentiate between x‐ray‐positive and negative CAP over 4 days. The NLR has proven valuable in a number of conditions. These have included infective endocarditis, hypertension, coronary artery disease, appendicitis, vestibular neuritis, hepatitis B and C, diabetes mellitus, thyroid disorders, hepatic failure, and renal insufficiency. 26 , 27 , 28 An NLR of ≥3 has been associated with poor lung function and nutritional deficiency, particularly in children with cystic fibrosis. 29 A small retrospective study indicated significantly higher levels of NLR and CRP levels in children with CAP in community and hospital settings, compared with healthy controls. 30 Another retrospective study of children aged 4–15 years found that an NLR of 4.15 was able to predict CAP in patients with asthma. 31 We are not aware of any previous studies that have compared the predictive value of NLR to other biomarkers, with regard to time from fever onset. Its relatively high yield as a discriminator, with earlier and more persistent increases, makes NLR an attractive alternative to CRP, particularly in limited resource settings that may only have access to complete blood counts.
4.1. Strengths and limitations
The strength of this study was that it considered four different biomarkers in a carefully selected cohort and examined their performance over time. The limitations included the fact that this was a single‐centre retrospective design, which may limit the generalisability of our findings. There was no microbiological confirmation of the causative pathogen, in common with other large paediatric CAP cohort studies. Despite this, the presence of alveolar consolidation has been widely accepted as the most specific radiographic predictor of bacterial pneumonia. 17 We cannot rule out that some x‐ray‐negative CAP cases may have been misclassified and those patients could have had viral infections. Some children with CAP may have been missed, if the International Classification of Diseases' code was not correctly recorded by the ED physicians. Relying on the parents recalling how many days their child had a fever may have introduced recall bias. To maintain uniformity, thresholds were uniformly applied across all age groups. This could have skewed the outcomes, since normal levels of biomarkers may differ by age. The study took place in a paediatric ED, which may not reflect the wider paediatric population. Different locations might show different biomarker patterns, due to variations in demographics, the environment or healthcare practices. Excluding patients with incomplete data, which was inevitable, may have introduced selection bias. Finally, we cannot account for the possible use of antibiotics before the children presented to the ED presentation, which could have influenced biomarker levels and diagnostic accuracy. This omission may have impacted the study's findings, as previous treatment could have altered the course of the disease and skewed the results.
5. CONCLUSION
This study contributes to our understanding of the impact that the timing of fever onset had on the reliability of biomarkers to provide a precise diagnosis of paediatric CAP. The NLR, in particular, performed well across a relatively wide range of days. Our findings highlight the limitations of using static cutoffs. More sophisticated algorithms need to be developed, which integrate clinical symptoms and severity scores with the temporal progression of biomarkers.
AUTHOR CONTRIBUTIONS
Ori Goldberg: Conceptualization; investigation; writing – original draft; methodology; visualization; writing – review and editing; software; formal analysis; data curation; supervision; project administration. Einat Shmueli: Writing – review and editing; data curation. Yoel Levinsky: Writing – review and editing; data curation. Yoav Vardi: Data curation; writing – review and editing. Noga Yaniv: Data curation; writing – review and editing; project administration; software. Ophir Bar‐On: Writing – review and editing. Hagit Levine: Writing – review and editing. Ron Berant: Writing – review and editing. Meir Mei Zahav: Writing – review and editing. Dario Prais: Writing – review and editing. Patrick Stafler: Conceptualization; investigation; writing – original draft; writing – review and editing; methodology; visualization; data curation; supervision.
CONFLICT OF INTEREST STATEMENT
The authors have no conflicts of interest to declare.
ETHICS STATEMENT
The study was approved by the Rabin Medical Center institutional review board (number RMC‐18‐0152). Parental consent was not required for this retrospective study.
Goldberg O, Shmueli E, Levinsky Y, Vardi Y, Yaniv N, Bar‐On O, et al. Fever duration enhanced biomarker sensitivity in diagnosing radiographically confirmed community‐acquired pneumonia in children. Acta Paediatr. 2025;114:1015–1021. 10.1111/apa.17531
REFERENCES
- 1. Stop Pneumonia . A global advocacy initiative to end pneumonia [Webpage]. 2024. Accessed October 21, 2024. https://stoppneumonia.org/about‐us/
- 2. Bill & Melinda Gates Foundation . Pneumonia: Advancing Global Health Through Prevention and Treatment Programs [Webpage]. Accessed October 21, 2024. https://www.gatesfoundation.org/our‐work/programs/global‐health/pneumonia
- 3. World Health Organization (WHO) . Pneumonia: key facts on causes, prevention, and global impact. [Webpage]. 2022. Accessed October 21, 2024. https://www.who.int/news‐room/fact‐sheets/detail/pneumonia
- 4. Madhi SA, De Wals P, Grijalva CG, et al. The burden of childhood pneumonia in the developed world: a review of the literature. Pediatr Infect Dis J. 2013;32:e119‐e127. [DOI] [PubMed] [Google Scholar]
- 5. Florin TA, Tancredi DJ, Ambroggio L, et al. Predicting severe pneumonia in the emergency department: a global study of the Pediatric Emergency Research Networks (PERN)‐study protocol. BMJ Open. 2020;10:e041093. [DOI] [PMC free article] [PubMed] [Google Scholar]
- 6. Florin TA, Ambroggio L, Brokamp C, et al. Biomarkers and disease severity in children with community‐acquired pneumonia. Pediatrics. 2020;145:e20193728. [DOI] [PMC free article] [PubMed] [Google Scholar]
- 7. Fine MJ, Auble TE, Yealy DM, et al. A prediction rule to identify low‐risk patients with community‐acquired pneumonia. N Engl J Med. 1997;336:243‐250. [DOI] [PubMed] [Google Scholar]
- 8. Lim WS, van der Eerden MM, Laing R, et al. Defining community acquired pneumonia severity on presentation to hospital: an international derivation and validation study. Thorax. 2003;58:377‐382. [DOI] [PMC free article] [PubMed] [Google Scholar]
- 9. Florin TA, French B, Zorc JJ, Alpern ER, Shah SS. Variation in emergency department diagnostic testing and disposition outcomes in pneumonia. Pediatrics. 2013;132:237‐244. [DOI] [PubMed] [Google Scholar]
- 10. Galetto‐Lacour A, Zamora SA, Gervaix A. Bedside procalcitonin and C‐reactive protein tests in children with fever without localizing signs of infection seen in a referral center. Pediatrics. 2003;112:1054‐1060. [DOI] [PubMed] [Google Scholar]
- 11. de Jager CP, Wever PC, Gemen EF, et al. The neutrophil‐lymphocyte count ratio in patients with community‐acquired pneumonia. PLoS One. 2012;7:e46561. [DOI] [PMC free article] [PubMed] [Google Scholar]
- 12. Simon L, Gauvin F, Amre DK, Saint‐Louis P, Lacroix J. Serum procalcitonin and C‐reactive protein levels as markers of bacterial infection: a systematic review and meta‐analysis. Clin Infect Dis. 2004;39:206‐217. [DOI] [PubMed] [Google Scholar]
- 13. Cataudella E, Giraffa CM, Di Marca S, et al. Neutrophil‐to‐lymphocyte ratio: an emerging marker predicting prognosis in elderly adults with community‐acquired Pneumonia. J Am Geriatr Soc. 2017;65:1796‐1801. [DOI] [PubMed] [Google Scholar]
- 14. Lee H, Kim I, Kang BH, Um SJ. Prognostic value of serial neutrophil‐to‐lymphocyte ratio measurements in hospitalized community‐acquired pneumonia. PLoS One. 2021;16:e0250067. [DOI] [PMC free article] [PubMed] [Google Scholar]
- 15. Delano MJ, Ward PA. Sepsis‐induced immune dysfunction: can immune therapies reduce mortality? J Clin Invest. 2016;126:23‐31. [DOI] [PMC free article] [PubMed] [Google Scholar]
- 16. Segal I, Ehrlichman M, Urbach J, Bar‐Meir M. Use of time from fever onset improves the diagnostic accuracy of C‐reactive protein in identifying bacterial infections. Arch Dis Child. 2014;99:974‐978. [DOI] [PubMed] [Google Scholar]
- 17. Cherian T, Mulholland EK, Carlin JB, et al. Standardized interpretation of paediatric chest radiographs for the diagnosis of pneumonia in epidemiological studies. Bull World Health Organ. 2005;83:353‐359. [PMC free article] [PubMed] [Google Scholar]
- 18. Neuman MI, Monuteaux MC, Scully KJ, Bachur RG. Prediction of pneumonia in a pediatric emergency department. Pediatrics. 2011;128:246‐253. [DOI] [PubMed] [Google Scholar]
- 19. Fluss R, Faraggi D, Reiser B. Estimation of the Youden Index and its associated cutoff point. Biom J. 2005;47:458‐472. [DOI] [PubMed] [Google Scholar]
- 20. Elemraid MA, Rushton SP, Thomas MF, Spencer DA, Gennery AR, Clark JE. Utility of inflammatory markers in predicting the aetiology of pneumonia in children. Diagn Microbiol Infect Dis. 2014;79:458‐462. [DOI] [PubMed] [Google Scholar]
- 21. Hoshina T, Nanishi E, Kanno S, Nishio H, Kusuhara K, Hara T. The utility of biomarkers in differentiating bacterial from non‐bacterial lower respiratory tract infection in hospitalized children: difference of the diagnostic performance between acute pneumonia and bronchitis. J Infect Chemother. 2014;20:616‐620. [DOI] [PubMed] [Google Scholar]
- 22. Bradley JS, Byington CL, Shah SS, et al. The management of community‐acquired pneumonia in infants and children older than 3 months of age: clinical practice guidelines by the Pediatric Infectious Diseases Society and the Infectious Diseases Society of America. Clin Infect Dis. 2011;53:e25‐e76. [DOI] [PMC free article] [PubMed] [Google Scholar]
- 23. Toikka P, Irjala K, Juven T, et al. Serum procalcitonin, C‐reactive protein and interleukin‐6 for distinguishing bacterial and viral pneumonia in children. Pediatr Infect Dis J. 2000;19:598‐602. [DOI] [PubMed] [Google Scholar]
- 24. Fan J, Upadhye S, Worster A. Understanding receiver operating characteristic (ROC) curves. CJEM. 2006;8:19‐20. [DOI] [PubMed] [Google Scholar]
- 25. Peltola H, Jaakkola M. C‐reactive protein in early detection of bacteremic versus viral infections in immunocompetent and compromised children. J Pediatr. 1988;113:641‐646. [DOI] [PubMed] [Google Scholar]
- 26. Tanoglu A, Karagoz E, Yiyit N, Berber U. Is combination of neutrophil to lymphocyte ratio and platelet lymphocyte ratio a useful predictor of postoperative survival in patients with esophageal squamous cell carcinoma? Onco Targets Ther. 2014;7:433‐434. [DOI] [PMC free article] [PubMed] [Google Scholar]
- 27. Celikbilek A, Ismailogullari S, Zararsiz G. Neutrophil to lymphocyte ratio predicts poor prognosis in ischemic cerebrovascular disease. J Clin Lab Anal. 2014;28:27‐31. [DOI] [PMC free article] [PubMed] [Google Scholar]
- 28. Celikbilek M, Dogan S, Ozbakir O, et al. Neutrophil‐lymphocyte ratio as a predictor of disease severity in ulcerative colitis. J Clin Lab Anal. 2013;27:72‐76. [DOI] [PMC free article] [PubMed] [Google Scholar]
- 29. O'Brien CE, Price ET. The blood neutrophil to lymphocyte ratio correlates with clinical status in children with cystic fibrosis: a retrospective study. PLoS One. 2013;8:e77420. [DOI] [PMC free article] [PubMed] [Google Scholar]
- 30. Kartal O, Kartal AT. Value of neutrophil to lymphocyte and platelet to lymphocyte ratios in pneumonia. Bratisl Lek Listy. 2017;118:513‐516. [DOI] [PubMed] [Google Scholar]
- 31. Xu M, Zhou L, Zhang J, Luo S, Zhao Y, Xiong W. Neutrophil to lymphocyte ratio in pediatric patients with asthmatic exacerbation and community‐acquired pneumonia. BMC Pediatr. 2023;23:640. [DOI] [PMC free article] [PubMed] [Google Scholar]