

ABSTRACT
Background and Purpose
Temporal lobe epilepsy is the most common form of focal epilepsy. MR‐guided laser interstitial thermal therapy (LITT) of the amygdalohippocampal complex has become an established therapy option in case of drug resistance. Long‐term anatomic network effects on the brain due to deafferentiation have not yet been evaluated.
Methods
We analyzed brain volumes of 11 patients with temporal lobe epilepsy before and 1‐year after hippocampal LITT with FastSurfer segmenting T1‐weighted data. Additionally, we performed visual ratings and measurements.
Results
A total of 11 patients with temporal lobe epilepsy (7 left‐sided, 4 right‐sided) were included (5 females); the mean age years (±standard deviation) at surgery was 41.5 (±18.4) years. The mean postoperative defect size was 1427 (±517) mm3. Volumetry as well as visual ratings found a progressive volume loss after left‐sided surgery in the ipsilateral temporal lobe, the contralateral (right) part of the thalamus, and especially contralateral (right) fusiform cortex. These changes could not be detected for right‐sided surgery.
Conclusion
A (partial) ablation of the left (dominant) hippocampus appears to exert long‐term effects on the right thalamus and right‐sided temporal cortices. However, we could not observe this effect in the reverse direction. Volumetric studies for larger cohorts should be conducted to investigate these findings.
Keywords: epilepsy, FastSurfer, hippocampal region, laser interstitial thermal therapy, volumetry
1. Introduction
Heterogeneous brain volume loss has been observed following stroke [1] or traumatic brain injury [2]. We hypothesize that atrophy may also occur after neurosurgical procedures. Epilepsy surgery, with its standardized procedures, provides an excellent field for studying and identifying specific atrophy patterns. Current developments revealed the network character of epilepsy [3, 4]. Particularly, the hippocampus represents a significant junction and is connected to many structures [5].
Anterior temporal lobectomy is the gold standard in the treatment of (drug resistant) temporal lobe epilepsies (TLE) with success rates of 60%–80% regarding seizure freedom [6]. Less radical surgical procedures, such as selective amygdalo‐hippocampectomy [7], are often better accepted by patients.
However, automated brain volumetry following brain surgeries is also particularly challenging due to cortical abnormalities [8]. Such defects are significantly smaller with minimally invasive procedures, for example, the MR‐guided laser interstitial thermal therapy (LITT) [9]. Therefore, automated volumetry should be more feasible after this approach compared to invasive methods. Figure 1 demonstrates an MRI following LITT.
FIGURE 1.
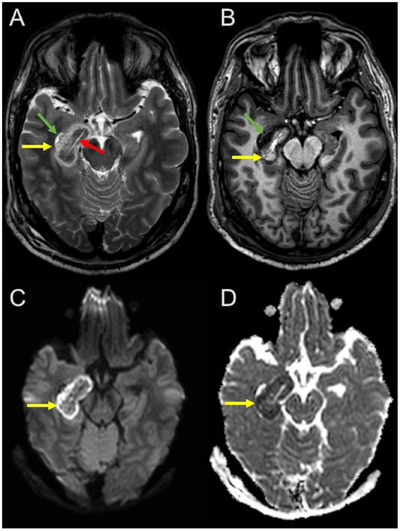
Introduction example. Early postoperative MRI following laser interstitial thermal therapy in a patient with right‐sided temporal lobe epilepsy. In the right amygdala and hippocampal region beside the temporal horn (green arrow), a central elongated early postoperative defect is visible following laser ablation (red arrow) surrounded by thermal edema (yellow arrows) that closely resembles infarction‐related edema due to diffusion restriction. (A) Transversal T2‐weighted Turbo‐Spin‐Echo; (B) transversal T1‐weighted Turbo‐Field‐Echo; bottom: transversal diffusion‐weighted imaging; (C) B1000; (D) apparent diffusion coefficient map.
Therefore, the goal of this MR study is to investigate the long‐term effects of this minimally invasive therapy on the cerebral cortex and brain tissue volumes.
To do this, we performed automated segmentation of the T1‐weighted MRI sequences before and 1 year after surgery using FastSurfer [10, 11]. In addition, we conducted a manual volumetric analysis of the lesioned brain tissue.
2. Methods
2.1. Study Design
This retrospective study was ethically approved by the institutional review board and adhered to the 2013 Declaration of Helsinki. The institutional review board waived the requirement for informed consent because of the retrospective nature of the study. All methods were performed in accordance with relevant guidelines and regulations.
2.2. Participant Population
We screened our picture archiving and communication system (PACS) for patients with TLE and LITT between 01/01/2018 and 12/31/2023. Inclusion criteria were TLE, an MR‐guided LITT with pre‐ and postoperative MRI. Exclusion criteria were the non‐existence of a three‐dimensional (3D) T1‐weighted sequence in the 1‐year follow‐up MRI scans. Due to postoperative changes and edema, 3‐ and 6‐month‐follow‐up MRIs were not included.
One year follow‐up data were available in the International League Against Epilepsy (ILAE) classification [12].
2.3. MRI Protocols and Scanners
3D T1‐Datasets with a voxel‐size of 1 mm × 1 mm × 1 mm were performed on 3T PRISMA (Siemens Healthineers AG, Munich, Germany; 3D‐T1‐Magnetization Prepared—RApid Gradient Echo; repetition time [TR] 2300 ms; echo time [TE] 3 ms) and 3T Achieva (Philips Nederland B.V., Eindhoven, the Netherlands; 3D‐T1‐weighted‐turbo field echo, TR 10 ms; TE 5 ms).
2.4. Volumetry
We ran FastSurfer (Version 2.3.0, German Center for Neurodegenerative Diseases DZNE, Bonn, Germany, https://deep‐mi.org/research/fastsurfer) on T1‐weighted data of MRI and calculated brain volumes according to the Desikan–Killiany–Tourville (DKT) [13] atlas. Additionally, we performed a parcellation based on Yeo's 17‐network resting‐state map [14]. For this purpose, the FreeSurfer (Version Stable v7.4.0, Laboratory for Computational Neuroimaging at the Martinos Center for Biomedical Imaging, Massachusetts General Hospital, Harvard Medical School, Boston, MA, USA, https://surfer.nmr.mgh.harvard.edu) procedures mri_surf2surf [15] and mris_anatomical_stats were applied to the FastSurfer results. A manual masking of the lesions or defect areas was not performed.
We also tried to run the additional HypVINN script [16], when possible, to assess the anterior commissure and the fornix.
We compared pre‐surgery and 1‐year follow‐up and measured the T1‐weighted defect zone with 3D Slicer [17] (Version 5.6.1, Brigham and Women's Hospital, Boston, USA, https://www.slicer.org) in mm3, that is, cerebrospinal fluid (CSF)‐isointense defect on T1‐weighted sequences. We carefully subtracted the ventricle system in cases of possible conflicts (via comparison with the pre‐surgery images). Figure 2 shows an example.
FIGURE 2.
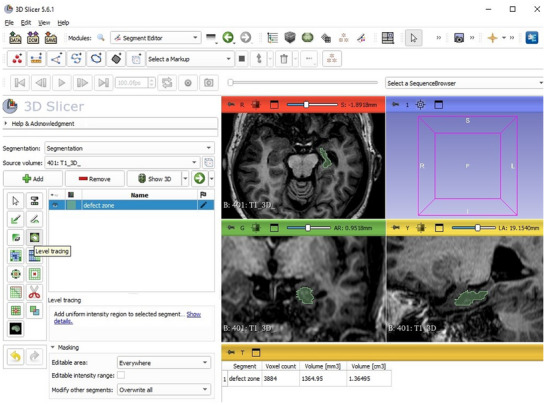
3D Slicer example demonstrates a manual volumetric measurement of the defect zone (green) following laser interstitial thermal therapy. 3D, three‐dimensional; AR, anterior right; B, brain series number and name; cm3, cubic centimeter; I, inferior; L, left; LA, lateral anterior; mm3, cubic millimeter; P, posterior; R, right; S, superior.
Two independent neuroradiologists visually rated the entorhinal cortex atrophy (ERICA) score [18] (0–3) and Schelten's medio temporal atrophy (MTA) score [19] (0–4) before and 1‐year after surgery. The ERICA score measures atrophy of the entorhinal cortex and parahippocampal cortex and is visually assessed in coronal slices at the level of the mammillary bodies. The MTA score captures the width of the choroid fissure, the width of the temporal horn of the lateral ventricle, as well as the height of the hippocampus.
We performed a functional (language) MRI for each patient to determine the dominant hemisphere. As the effects of valproate on volumetry [20, 21, 22] have been extensively described, we conducted an additional analysis of the antiepileptic medication administered before and after LITT.
2.5. Statistical Analysis
We used Python3 (Version 3.9.18, Python Software Foundation, Wilmington, USA, https://www.python.org) for statistical programming and histogram/image construction. As a baseline analysis, we compared the DKT volumes between the initial and follow‐up MRIs. Significance level p was set to 0.05. Additionally, we used the false‐discovery‐rate (FDR) of Benjamini and Hochberg [23] and Bonferroni's correction [24]; hence, we tested 100 variables (50 for each hemisphere), and we set p (Bonferroni corrected) = 0.05/50 = 0.001. We used multiple paired t‐test to compare pre‐ and post‐surgery brain volumes. To test interrater reliability, we calculated intraclass correlation coefficient (ICC) (c, 2) and estimated the 95% confidence intervals with R (Vienna, Austria, https://www.r‐project.org/) (packages irr, readxl, lpSolve, and psych). The value was interpreted following Koo and Li [25]. Pearson's correlation was used to assess the association between size of defect and seizure freedom.
3. Results
3.1. Participants
We found 19 patients in our PACS who met the criteria. Eight patients had to be excluded because of missing/not adequate follow‐up MR scans. Figure 3 shows the inclusion flow chart.
FIGURE 3.
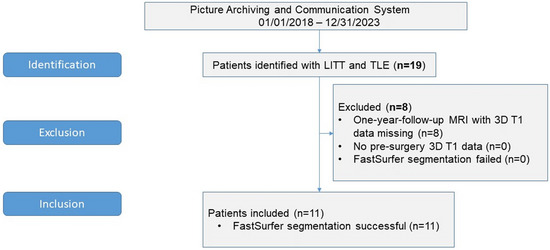
Inclusion Flow Chart. 3D, three‐dimensional; LITT, laser interstitial thermal therapy; n, number of patients; TLE, temporal lobe epilepsy.
The mean age of the finally included 11 patients with TLE was 41.5 ± 18.4 years (range 17–69 years; 5 females) at the time of LITT. The minimal‐invasive amygdalo‐hippocampal ablation was performed seven times left‐sided and four times right‐sided. Mean epileptic onset age was 16 ± 8 years.
3.2. Basic Results
Mean interval between surgery and evaluated follow‐up MRI was 15 ± 6 (range 8.8–26.1) months. Mean outcome (ILAE) was 2.5 ± 1.8 (Median 1; 6 out of 11 patients had an ILAE score of 1, 1 year after LITT).
Table 1 summarizes the important mean volumes and standard deviations of the FastSurfer volumetry using the DKT atlas.
TABLE 1.
Mean volume ± standard deviation (mm3) of relevant structures of the Desikan–Killiany–Tourville‐Atlas and significance p without correction.
| Brain region | All patients (n = 11) | Left‐sided TLE (n = 7) | Right‐sided TLE (n = 4) | Dominant side LITT (left, n = 5) | ||||||||
|---|---|---|---|---|---|---|---|---|---|---|---|---|
| Volume pre‐surgery MRI in mm3 | Volume 1‐year follow‐up MRI in mm3 | p | Volume pre‐surgery MRI in mm3 | Volume 1‐year follow‐up MRI in mm3 | p | Volume pre‐surgery MRI in mm3 | Volume 1‐year follow‐up MRI in mm3 | p | Volume pre‐surgery MRI in mm3 | Volume 1‐year follow‐up MRI in mm3 | p | |
| Left‐thalamus | 7159 | 6789 | 0.19 | 7023 | 6329 | 0.0004 | 7396 | 7595 | 0.78 | 7317 | 6536 | 0.002 a |
| Left‐hippocampus | 3540 | 2551 | 0.004 | 3294 | 1731 | 0.0001 * | 3971 | 3986 | 0.96 | 3349 | 1665 | 0.00002 * |
| Left‐amygdala | 1676 | 1093 | 0.003 | 1625 | 741 | 0.0003 * | 1765 | 1710 | 0.59 | 1718 | 731 | 0.002 a |
| Right‐thalamus | 7095 | 6754 | 0.06 | 7161 | 6740 | 0.001 * | 6978 | 6779 | 0.68 | 7426 | 6926 | 0.003 a |
| Right‐hippocampus | 4052 | 3252 | 0.008 | 4231 | 3840 | 0.008 a | 3740 | 2223 | 0.05 | 4196 | 3724 | 0.008 a |
| Right‐amygdala | 1841 | 1362 | 0.02 | 1777 | 1656 | 0.04 | 1954 | 848 | 0.03 | 1784 | 1650 | 0.08 |
| ctx‐lh‐entorhinal | 1565 | 1156 | 0.01 | 1548 | 888 | 0.0006 * | 1596 | 1624 | 0.88 | 1589 | 941 | 0.008 a |
| ctx‐lh‐fusiform | 6815 | 6151 | 0.08 | 6958 | 5691 | 0.002 a | 6564 | 6955 | 0.55 | 7270 | 5854 | 0.01 a |
| ctx‐lh‐parahippocampal | 1889 | 1642 | 0.04 | 1881 | 1433 | 0.001 * | 1902 | 2009 | 0.32 | 1980 | 1513 | 0.006 a |
| ctx‐rh‐entorhinal | 1485 | 1124 | 0.0001 * | 1491 | 1145 | 0.002 a | 1474 | 1087 | 0.02 | 1487 | 1117 | 0.006 a |
| ctx‐rh‐fusiform | 7354 | 6663 | 0.003 | 7369 | 6449 | 0.001 * | 7326 | 7039 | 0.48 | 7490 | 6443 | 0.006 a |
| ctx‐rh‐parahippocampal | 1798 | 1644 | 0.03 | 1825 | 1619 | 0.02 a | 1752 | 1687 | 0.55 | 1850 | 1587 | 0.02 |
Abbreviations: ctx, cortex; lh, left hemisphere; LITT, laser interstitial thermal therapy; mm3, cubic millimeter; n, number of patients; p, probability (significance) value; rh, right hemisphere; TLE, temporal lobe epilepsy.
aSignificant using the Benjamini–Hochberg false‐discovery‐rate.
*Significant using the Benjamini–Hochberg false‐discovery‐rate and the Bonferroni corrected significance level of 0.1%.
The corrected significance level of 0.001 was reached by the ablated hippocampus and amygdala after left‐sided LITT, as well as the left and right parts of the thalamus and the fusiform cortex of both hemispheres.
The use of the Benjamini–Hochberg FDR instead of the Bonferroni correction led to more frontal and temporal structures of both hemispheres being recognized as having a significantly reduced volume.
In the 1‐year follow‐up after a left‐hemispheric operation, we also observed an increase in the volume of the right temporal horn, along with a reduction in the entorhinal gyrus and the medial and lateral orbitofrontal cortices. The segmented brain volumes with the highest differences are shown in Table 2.
TABLE 2.
Differences in percent (pre‐surgery vs. 1‐year follow‐up MRI) for areas with an increase/decrease >15% (deviations up to 10% could be explained to inter‐scanner deviations).
| All patients (%) | Left‐sided LITT (%) | Right‐sided LITT (%) | |
|---|---|---|---|
| Left‐hippocampus | −27.93 | −47.44 | 0.38 |
| Right‐hippocampus | −19.75 | −9.24 | −40.55 |
| Left‐amygdala | −34.78 | −54.43 | −3.11 |
| Right‐amygdala | −26.03 | −6.82 | −56.60 |
| ctx‐lh‐entorhinal | −26.18 | −42.65 | 1.77 |
| ctx‐rh‐entorhinal | −24.35 | −23.25 | −26.30 |
| ctx‐lh‐fusiform | −9.74 | −18.21 | 5.96 |
| ctx‐rh‐fusiform | −9.39 | −12.50 | −3.92 |
Abbreviations: ctx, cortex; lh, left hemisphere; LITT, laser interstitial thermal therapy; rh, right hemisphere.
Due to a possible influence of asymmetry, we had expected that a missegmentation of the contralateral temporal region might occur after surgery. This was not the case; we only rarely found a minimally missegmented amygdala. We could not detect any failed segmentation of other contralateral volumes, especially not the contralateral entorhinal cortex. Figure 4 demonstrates four post‐surgery segmentations.
FIGURE 4.
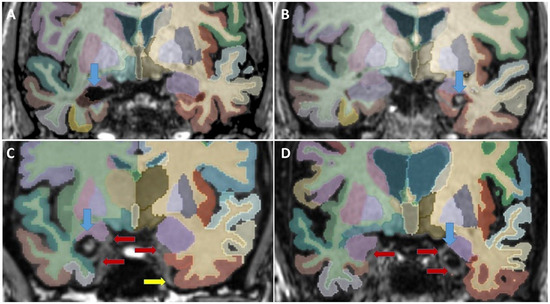
Four coronal slices of post‐surgery segmentations (aparc Desikan–Killiany–Tourville atlas + aseg.deep and orig.mgz). Blue arrows point at the post‐surgery defect. Red arrows point at minimal fail segmentations; the yellow arrow points at a vessel. (A) Right‐sided surgery; no fail segmentations found. (B) Left‐sided surgery hemorrhage in the cavity: no fail segmentations found; (C) right‐sided surgery; and (D) left‐sided surgery, both with minimal fail segmentations of the ipsilateral entorhinal cortex and ipsilateral > contralateral amygdala. The primary olfactory cortex is not segmented in the Desikan–Killiany–Tourville atlas.
Because it is not part of the DKT atlas, we did not segment the primary olfactory cortex and an upper medial area of the amygdala, which consists of the prepiriform cortex and periamygdaloid cortex.
3.3. Measured Volumes and Ratings
The mean manually measured postoperative defect size (CSF‐intense on T1‐weighted imaging) was 1427 ± 517 mm3 (range 959; 2676 mm3; left‐sided mean volume 1411 ± 575 mm; right‐sided mean volume 1453 ± 476 mm3).
In a multiparameter correlation matrix, we found a weak and not significant negative correlation between defect size and ILAE outcome (Pearson's correlation coefficient r = −0.364; p = 0.33).
The mean contralateral ERICA score was 0.23 ± 0.34 pre‐surgery and 0.59 ± 0.58 in the 1‐year follow‐up with a good interrater reliability (ICC [c, 2] = 0.76; 95% confidence interval 0.56–0.87). The mean contralateral Schelten's score was 0.50 ± 0.67 pre‐surgery and 0.64 ± 0.67 in the 1‐year follow‐up with a moderate interrater reliability (ICC [c, 2] = 0.72; 95% confidence interval 0.45–0.87). Both scores did not reveal significant differences (ERICA score p = 0.09; Schelten's score p = 0.63). Table 3 shows the atrophy ratings.
TABLE 3.
Mean ratings ± standard deviation of entorhinal cortex atrophy score and mesiotemporal atrophy score.
| Pre‐surgery | 1‐year follow‐up | |
|---|---|---|
| ERICA‐score contralateral | 0.23 ± 0.34 | 0.58 ± 0.59 |
| ERICA‐score contralateral after left‐sided surgery | 0.29 ± 0.39 | 0.79 ± 0.64 |
| ERICA‐score contralateral after right‐sided surgery | 0.13 ± 0.25 | 0.25 ± 0.29 |
| MTA‐score contralateral | 0.50 ± 0.67 | 0.64 ± 0.67 |
| MTA‐score contralateral after left‐sided surgery | 0.36 ± 0.48 | 0.57 ± 0.53 |
| MTA‐score contralateral after right‐sided surgery | 0.75 ± 0.96 | 0.75 ± 0.96 |
Abbreviations: ERICA‐score, entorhinal cortex atrophy score (0–3); MTA‐score, mesiotemporal atrophy score (0–4).
However, the ERICA score reveals that we could find the same tendencies in the visual ratings with a contralateral atrophy following left‐sided LITT. Figure 5 demonstrates an example of a widening of the entorhinal cortex in the 1‐year follow‐up.
FIGURE 5.
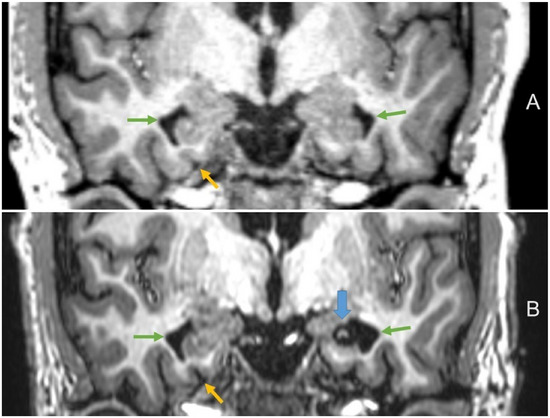
Volume loss of the contralateral entorhinal cortex following laser therapy in a 30‐year‐old‐patient. (A) Pre‐surgery coronal T1‐weighted magnetization prepared—rapid gradient echo; (B) 1‐year follow‐up coronal T1‐weighted Turbo‐Field‐Echo (blue arrow points at the postoperative defect zone after left‐sided surgery; yellow arrows at the widening of the contralateral entorhinal cortex; green arrows at the temporal horns).
The additional HypVINN script finished successfully in 4/11 post‐surgery MRIs. But only in one of those four cases was a correct segmentation detected. For this reason, we did not conduct any further statistical analyses on this subscript.
3.4. Dominant Hemispheres
We found a right‐sided language dominance in two patients (one of those with left‐sided LITT); in two patients, we found a mixed type (one of those with right‐sided pronunciation as well as left‐sided LITT). In all other patients, a left‐sided language dominance was found.
The exclusion of right‐dominant patients slightly influenced the results, as shown in Table 1. Due to the small sample size, we refrained from further subgroup analyses regarding disease duration, head size, and ILAE seizure freedom outcome at 1 year.
A “mirrored” dependent t‐test (n = 11) for the contralateral (non‐LITT) side revealed only (not corrected) significant values in the putamen (p = 0.003), the accumbens area (p = 0.02) as well as the entorhinal and lateral orbitofrontal cortices (p = 0.04 for both).
3.5. Resting‐State Cortical Parcellation Using Yeo's 17 Networks
The use of Yeo's 17 networks confirmed the results, as detailed in Table 4, demonstrating a right‐hemispheric brain volume reduction following a left‐hemispheric LITT. The highest percentage (mean: 8) of contralateral loss after left‐sided LITT was observed in the right “limbic‐1” area. After right‐sided LITT, no significant atrophy was observed in areas of the left hemisphere.
TABLE 4.
Mean gray matter volume (mm3) of the 17 functional networks from Yeo resting‐state network map and significance p without correction.
| Left‐sided LITT and left‐hemispheric language dominance (left, n = 5) | Left‐sided LITT (n = 7) | Right‐sided LITT (n = 4) | ||||||||
|---|---|---|---|---|---|---|---|---|---|---|
| Network name (Yeo17) | Functional network name | Volume pre‐surgery MRI In mm3 | Volume 1‐year follow‐up MRI in mm3 | p | Volume pre‐surgery MRI in mm3 | Volume 1‐year follow‐up MRI in mm3 | p | Volume pre‐surgery MRI in mm3 | Volume 1‐year follow‐up MRI in mm3 | p |
| Left hemisphere | ||||||||||
| 17Networks_1 | Visual‐1 | 16,961 | 16,191 | 0.067 | 16,446 | 15,518 | 0.010 * | 17,395 | 17,294 | 0.878 |
| 17Networks_2 | Visual‐2 | 11,103 | 10,985 | 0.760 | 10,686 | 10,587 | 0.700 | 11,474 | 11,229 | 0.635 |
| 17Networks_3 | Motor‐1 | 16,086 | 16,387 | 0.594 | 15,963 | 16,132 | 0.680 | 17,876 | 16,989 | 0.275 |
| 17Networks_4 | Motor‐2 | 13,965 | 14,255 | 0.326 | 14,067 | 14,106 | 0.880 | 15,408 | 15,647 | 0.703 |
| 17Networks_5 | Dorsal‐attention‐1 | 12,797 | 11,342 | 0.006 * | 12,506 | 11,348 | 0.006 * | 13,287 | 13,101 | 0.236 |
| 17Networks_6 | Dorsal‐attention‐2 | 10,993 | 10,568 | 0.209 | 10,962 | 10,545 | 0.082 | 12,133 | 11,939 | 0.266 |
| 17Networks_7 | Ventral‐attention | 14,065 | 13,699 | 0.012 * | 14,125 | 13,766 | 0.002 * | 15,210 | 15,251 | 0.836 |
| 17Networks_8 | Frontoparietal‐1 | 11,160 | 10,361 | 0.005 * | 11,044 | 10,316 | 0.001 * | 12,152 | 12,113 | 0.944 |
| 17Networks_9 | Limbic‐1 | 14,480 | 12,624 | 0.016 * | 14,033 | 12,049 | 0.004 * | 15,245 | 14,951 | 0.834 |
| 17Networks_10 | Limbic‐2 | 10,487 | 10,330 | 0.549 | 10,373 | 10,194 | 0.360 | 10,839 | 10,868 | 0.958 |
| 17Networks_11 | Frontoparietal‐2 | 4172 | 3953 | 0.180 | 4129 | 3944 | 0.110 | 4337 | 4306 | 0.760 |
| 17Networks_12 | Frontoparietal‐3 | 14,729 | 13,727 | 0.036 * | 14,643 | 13,724 | 0.010 * | 15,329 | 15,264 | 0.872 |
| 17Networks_13 | Frontoparietal‐4 | 13,335 | 12,663 | 0.015 * | 13,256 | 12,516 | 0.001 * | 14,666 | 14,415 | 0.620 |
| 17Networks_14 | Motor‐3 | 7780 | 7432 | 0.065 | 7948 | 7457 | 0.011 * | 8299 | 8273 | 0.883 |
| 17Networks_15 | Default‐mode‐network3 | 5411 | 4752 | 0.034 * | 5214 | 4537 | 0.007 * | 5309 | 5292 | 0.940 |
| 17Networks_16 | Default‐mode‐network1 | 20,920 | 19,646 | 0.026 * | 20,899 | 19,711 | 0.006 * | 22,435 | 22,704 | 0.635 |
| 17Networks_17 | Default‐mode‐network2 | 30,443 | 28,782 | 0.032 * | 30,708 | 28,947 | 0.007 * | 34,134 | 34,222 | 0.876 |
| Right hemisphere | ||||||||||
| 17Networks_1 | Visual‐1 | 18,839 | 18,399 | 0.270 | 18,342 | 17,741 | 0.126 | 19,467 | 18,515 | 0.130 |
| 17Networks_2 | Visual‐2 | 11,213 | 11,550 | 0.440 | 11,136 | 11,309 | 0.570 | 11,862 | 11,451 | 0.409 |
| 17Networks_3 | Motor‐1 | 15,818 | 16,330 | 0.399 | 16,098 | 16,473 | 0.390 | 18,776 | 17,720 | 0.194 |
| 17Networks_4 | Motor‐2 | 13,993 | 13,786 | 0.048 * | 14,159 | 13,903 | 0.045 * | 15,013 | 14,525 | 0.163 |
| 17Networks_5 | Dorsal‐attention‐1 | 15,577 | 14,805 | 0.047 * | 15,215 | 14,464 | 0.020 * | 16,267 | 14,811 | 0.029 * |
| 17Networks_6 | Dorsal‐attention‐2 | 10,752 | 10,732 | 0.923 | 10,829 | 10,743 | 0.650 | 12,356 | 11,922 | 0.338 |
| 17Networks_7 | Ventral‐attention | 15,979 | 15,203 | 0.139 | 16,041 | 15,339 | 0.057 | 17,299 | 16,926 | 0.137 |
| 17Networks_8 | Frontoparietal‐1 | 15,241 | 14,584 | 0.016 * | 15,287 | 14,715 | 0.012 * | 16,213 | 15,920 | 0.556 |
| 17Networks_9 | Limbic‐1 | 15,520 | 14,316 | 0.057 | 15,585 | 14,247 | 0.013 * | 15,338 | 12,493 | 0.054 |
| 17Networks_10 | Limbic‐2 | 9741 | 9135 | 0.032 * | 9591 | 9159 | 0.047 | 9998 | 9583 | 0.497 |
| 17Networks_11 | Frontoparietal‐2 | 4903 | 4675 | 0.287 | 4861 | 4666 | 0.210 | 5141 | 5010 | 0.235 |
| 17Networks_12 | Frontoparietal‐3 | 11,696 | 11,331 | 0.125 | 12,001 | 11,637 | 0.064 | 12,644 | 12,237 | 0.433 |
| 17Networks_13 | Frontoparietal‐4 | 22,129 | 20,754 | 0.012 * | 21,578 | 20,431 | 0.006 * | 22,716 | 21,449 | 0.342 |
| 17Networks_14 | Motor‐3 | 9630 | 9250 | 0.034 * | 9384 | 8989 | 0.004 * | 9767 | 9056 | 0.024 * |
| 17Networks_15 | Default‐mode‐network3 | 4392 | 4152 | 0.121 | 4349 | 4080 | 0.020 * | 4568 | 4385 | 0.508 |
| 17Networks_16 | Default‐mode‐network1 | 22,348 | 21,570 | 0.088 | 21,867 | 21,177 | 0.035 * | 24,226 | 23,594 | 0.477 |
| 17Networks_17 | Default‐mode‐network2 | 14,963 | 14,508 | 0.101 | 14,887 | 14,348 | 0.015 * | 15,704 | 14,426 | 0.151 |
Abbreviations: LITT, laser interstitial thermal therapy; mm3, cubic millimeter; n, number of patients; p, probability (significance) value.
Significant at the corrected significance level of 5%.
3.6. Pharmacological Confounding Factors
We did not find any antiepileptic medications containing valproate in the treatment regimens of the included patients, either before or after LITT.
3.7. MR Scanners and Sequences
The MRIs on the different scanners were not normally distributed among the patients: Philips (5 pre‐surgery vs. 10, 1‐year follow‐up) versus Siemens (6 pre‐surgery vs. 1, 1‐year follow‐up). We found deviations of up to 5%–10% in the segmented volumes among the different scanners, as already mentioned for FreeSurfer in the literature [26]. The ratio for left versus right TLE for the Siemens scans was 5:1 (pre‐surgery) and 0:1 (1 year follow‐up). The left versus right ratio for the Philips scans was 2:3 (pre‐surgery) and 7:3 (1 year follow‐up).
4. Discussion
In our study of 11 patients, we performed a FastSurfer segmentation, visual measurements, and ratings in patients with TLE before and 1‐year after LITT. To the best of our knowledge, no studies to date have addressed whole‐brain volumetry following surgical intervention for TLE. Technically, automated volumetry—typically optimized for “complete and healthy” brains—also poses additional challenges. After minimally invasive surgery, FastSurfer enabled volumetric analysis for each patient in our group. However, it remains uncertain whether this approach can be applied uniformly to all patients following other approaches, for example, temporal lobe resection.
We found significant right‐hemispheric volume losses of the thalamus and temporal structures, for example, the fusiform cortex, after left‐sided surgery. This could be explained by a left‐brain dominated coupling through the Papez circuit [27]. The additional application of Yeo's functional parcellation confirmed the results. A major limitation of this study is that the MRI scans were conducted on two different devices, which may have introduced variability and influenced the results.
LITT [6] is the minimal invasive alternative for anterior temporal lobe resection [28] or selective amygdalo‐hippocampectomy [7] in refractory TLE. Nonetheless, minimal‐invasive surgery could influence the functional and neurocognitive status of the patients [29]. Seizure recurrence has occurred with all of these surgical approaches [30]. The extent of brain surgery significantly affects the long‐term impact on remote brain structures [31].
The overall outcome of LITT was not associated with the ablation volume in a meta‐analysis, in which the mean ablation volume was 5376 mm3, and seizure freedom was achieved in 58% of TLE cases [32]. In comparison, our study reported a mean ablation volume of only 1427 mm3 and a seizure freedom rate of 55%. Some studies suggest that a resection or ablation of the piriform cortex can positively influence the outcome [33].
There is still a lot to learn with this new technique, and the ablated volumes also seem to vary greatly, depending on the patient [34]. The use of adaptive neuronal nets and/or deep learning algorithms, such as FastSurfer, already works successfully in many (mostly neurodegenerative) diseases [35, 36]. We could demonstrate that it can also be used successfully in postoperative patients after LITT. The use of volumetric software after surgery is generally promising but must be adapted accordingly to the size of defect, for example, with deep learning algorithms for resection cavities [37]. In the context of minimally invasive techniques and long‐term MRI monitoring, the question always arises as to where the defect ends and where an ex vacuo dilation of the ventricular system begins. In some cases, this distinction may not be conclusively resolved.
Major limitation of our study is the small patient number. Due to the high number of variables tested, no significant statement can be made. Another limitation is the use of two different MR scanners. Theoretically, the differences measured in the temporal lobes on both sides could also be due to the inter‐scanner deviations [26]. However, this is contradicted by the fact that the temporal horn diameter has also changed on the contralateral side. We were also able to confirm these trends in the visual ratings.
In addition, not all patients were free of symptoms after surgery, so the measured atrophy could also be a result of the ongoing disease or continued medication [38].
The volumetry of surgically treated brains presents a challenge for most software solutions. This could lead to the distortion of the results; therefore, we verified all segmentations visually.
The size of our visually measured defect zones was smaller than in the previously published literature. One reason for this could be that the visual measurements were conducted solely on the CSF defect in the 1‐year follow‐up T1‐weighted data and may not accurately represent the complete defect size.
The observation period was relatively short, set at 1 year, to detect significant effects. Future studies should include 2‐ or 5‐year follow‐up assessments.
The long‐term impact of minimally invasive procedures in epilepsy surgery is becoming increasingly significant, highlighting the importance of future research into their mechanisms and long‐term effects [39]. The harmonization and standardization of MRI techniques, for example, T1‐mappings [40], and measurement methods can contribute to improved patient monitoring.
Our study indicates that undetected effects of minimally invasive epilepsy surgery for TLE exist. A similar atrophy mechanism to that observed in strokes is hypothesized. In addition to the ipsilateral atrophy of brain structures, these could also include contralateral regions included in the Papez circuit.
Ethics Statement
We confirm that we have read the Journal's position on issues involved in ethical publication and affirm that this report is consistent with those guidelines.
Conflicts of Interest
The authors declare no conflicts of interest.
Acknowledgments
The authors have nothing to report.
Open access funding enabled and organized by Projekt DEAL.
Friedhelm Schmitt and Lars Büntjen contributed equally to this study.
Funding: No funding was received for the conduct of this study. We acknowledge support from the Open Access Publication Fund of the Medical Faculty of Otto‐von‐Guericke University Magdeburg.
References
- 1. Bu N., Churilov L., Khlif M. S., et al., “Early Brain Volume Changes After Stroke: Subgroup Analysis From the AXIS‐2 Trial,” Frontiers in Neurology 12 (2022): 747343. [DOI] [PMC free article] [PubMed] [Google Scholar]
- 2. Harris T. C., De Rooij R., and Kuhl E., “The Shrinking Brain: Cerebral Atrophy Following Traumatic Brain Injury,” Annals of Biomedical Engineering 47 (2019): 1941–1959. [DOI] [PMC free article] [PubMed] [Google Scholar]
- 3. Burman R. J. and Parrish R. R., “The Widespread Network Effects of Focal Epilepsy,” Journal of Neuroscience 38 (2018): 8107–8109. [DOI] [PMC free article] [PubMed] [Google Scholar]
- 4. Slinger G., Otte W. M., Braun K. P. J., and Van Diessen E., “An Updated Systematic Review and Meta‐Analysis of Brain Network Organization in Focal Epilepsy: Looking Back and Forth,” Neuroscience and Biobehavioral Reviews 132 (2022): 211–223. [DOI] [PubMed] [Google Scholar]
- 5. Larivière S., Schaper F., Royer J., et al., “Brain Networks for Cortical Atrophy and Responsive Neurostimulation in Temporal Lobe Epilepsy,” JAMA Neurology 81 (2024): 1199–1209. [DOI] [PMC free article] [PubMed] [Google Scholar]
- 6. Chang E. F., Englot D. J., and Vadera S., “Minimally Invasive Surgical Approaches for Temporal Lobe Epilepsy,” Epilepsy & Behavior 47 (2015): 24–33. [DOI] [PMC free article] [PubMed] [Google Scholar]
- 7. Yasargil M. G., Teddy P. J., and Roth P., “Selective Amygdalo‐Hippocampectomy Operative Anatomy and Surgical Technique,” in Advances and Technical Standards in Neurosurgery. Vol 12. Advances and Technical Standards in Neurosurgery, eds. Symon L., Brihaye J., Guidetti B., et al. (Springer Vienna, 1985), 93–123. [DOI] [PubMed] [Google Scholar]
- 8. Germeyan S. C., Kalikhman D., Jones L., and Theodore W. H., “Automated Versus Manual Hippocampal Segmentation in Preoperative and Postoperative Patients With Epilepsy,” Epilepsia 55 (2014): 1374–1379. [DOI] [PMC free article] [PubMed] [Google Scholar]
- 9. Willie J. T., Laxpati N. G., Drane D. L., et al., “Real‐Time Magnetic Resonance‐Guided Stereotactic Laser Amygdalohippocampotomy for Mesial Temporal Lobe Epilepsy,” Neurosurgery 74 (2014): 569–585. [DOI] [PMC free article] [PubMed] [Google Scholar]
- 10. Henschel L., Conjeti S., Estrada S., Diers K., Fischl B., and Reuter M., “FastSurfer—A Fast and Accurate Deep Learning Based Neuroimaging Pipeline,” Neuroimage 219 (2020): 117012. [DOI] [PMC free article] [PubMed] [Google Scholar]
- 11. Henschel L., Kügler D., and Reuter M., “FastSurferVINN: Building Resolution‐Independence Into Deep Learning Segmentation Methods—A Solution for HighRes Brain MRI,” Neuroimage 251 (2022): 118933. [DOI] [PMC free article] [PubMed] [Google Scholar]
- 12. Wieser H. G., Blume W. T., Fish D., et al., “ILAE Commission Report. Proposal for a New Classification of Outcome With Respect to Epileptic Seizures Following Epilepsy Surgery,” Epilepsia 42 (2001): 282–286. [PubMed] [Google Scholar]
- 13. Klein A. and Tourville J., “101 Labeled Brain Images and a Consistent Human Cortical Labeling Protocol,” Frontiers in Neuroscience 6 (2012): 171. [DOI] [PMC free article] [PubMed] [Google Scholar]
- 14. Thomas Yeo B. T., Krienen F. M., Sepulcre J., et al., “The Organization of the Human Cerebral Cortex Estimated by Intrinsic Functional Connectivity,” Journal of Neurophysiology 106 (2011): 1125–1165. [DOI] [PMC free article] [PubMed] [Google Scholar]
- 15. Fischl B., Sereno M. I., Tootell R. B., and Dale A. M., “High‐Resolution Intersubject Averaging and a Coordinate System for the Cortical Surface,” Human Brain Mapping 8 (1999): 272–284. [DOI] [PMC free article] [PubMed] [Google Scholar]
- 16. Estrada S., Kügler D., Bahrami E., et al., “FastSurfer‐HypVINN: Automated Sub‐Segmentation of the Hypothalamus and Adjacent Structures on High‐Resolutional Brain MRI,” Imaging Neuroscience 1 (2023): 1–32. [DOI] [PMC free article] [PubMed] [Google Scholar]
- 17. Fedorov A., Beichel R., Kalpathy‐Cramer J., et al., “3D Slicer as an Image Computing Platform for the Quantitative Imaging Network,” Magnetic Resonance Imaging 30 (2012): 1323–1341. [DOI] [PMC free article] [PubMed] [Google Scholar]
- 18. Enkirch S. J., Traschütz A., Müller A., et al., “The ERICA Score: An MR Imaging–Based Visual Scoring System for the Assessment of Entorhinal Cortex Atrophy in Alzheimer Disease,” Radiology 288 (2018): 226–333. [DOI] [PubMed] [Google Scholar]
- 19. Scheltens P., Leys D., Barkhof F., et al., “Atrophy of Medial Temporal Lobes on MRI in “Probable” Alzheimer's Disease and Normal Ageing: Diagnostic Value and Neuropsychological Correlates,” Journal of Neurology, Neurosurgery, and Psychiatry 55 (1992): 967–972. [DOI] [PMC free article] [PubMed] [Google Scholar]
- 20. Pardoe H. R., Berg A. T., and Jackson G. D., “Sodium Valproate Use Is Associated With Reduced Parietal Lobe Thickness and Brain Volume,” Neurology 80 (2013): 1895–1900. [DOI] [PMC free article] [PubMed] [Google Scholar]
- 21. Tondelli M., Vaudano A. E., Sisodiya S. M., and Meletti S., “Valproate Use Is Associated With Posterior Cortical Thinning and Ventricular Enlargement in Epilepsy Patients,” Frontiers in Neurology 11 (2020): 622. [DOI] [PMC free article] [PubMed] [Google Scholar]
- 22. Umlauf J., Rau A., Demerath T., et al., “Valproate Associated Brain Volume‐Loss in Pediatric Epilepsy—A Case Series,” Epilepsia Open 8 (2023): 1581–1587. [DOI] [PMC free article] [PubMed] [Google Scholar]
- 23. Benjamini Y. and Hochberg Y., “Multiple Hypotheses Testing With Weights,” Scandinavian Journal of Statistics 24 (1997): 407–418. [Google Scholar]
- 24. Shaffer J. P., “Multiple Hypothesis Testing,” Annual Review of Psychology 46 (1995): 561–584. [Google Scholar]
- 25. Koo T. K. and Li M. Y., “A Guideline of Selecting and Reporting Intraclass Correlation Coefficients for Reliability Research,” Journal of Chiropractic Medicine 15 (2016): 155–163. [DOI] [PMC free article] [PubMed] [Google Scholar]
- 26. Liu S., Hou B., Zhang Y., et al., “Inter‐Scanner Reproducibility of Brain Volumetry: Influence of Automated Brain Segmentation Software,” BMC Neuroscience [Electronic Resource] 21 (2020): 35. [DOI] [PMC free article] [PubMed] [Google Scholar]
- 27. Kamali A., Milosavljevic S., Gandhi A., et al., “The Cortico‐Limbo‐Thalamo‐Cortical Circuits: An Update to the Original Papez Circuit of the Human Limbic System,” Brain Topography 36 (2023): 371–389. [DOI] [PMC free article] [PubMed] [Google Scholar]
- 28. Mathon B. and Clemenceau S., “Surgery Procedures in Temporal Lobe Epilepsies,” in: Handbook of Clinical Neurology (Elsevier, 2022), 531–556. [DOI] [PubMed] [Google Scholar]
- 29. Brenner D. A., Valdivia D. J., Dadario N. B., et al., “Functional Outcomes in MRI‐Guided Laser Interstitial Therapy for Temporal Lobe Epilepsy: A Systematic Review and Meta‐Analysis,” Journal of Neurosurgery 141 (2024): 362–371. [DOI] [PubMed] [Google Scholar]
- 30. Jehi L. and Jetté N., “Not All That Glitters Is Gold: A Guide to Surgical Trials in Epilepsy,” Epilepsia Open 1 (2016): 22–36. [DOI] [PMC free article] [PubMed] [Google Scholar]
- 31. Arnold T. C., Kini L. G., Bernabei J. M., et al., “Remote Effects of Temporal Lobe Epilepsy Surgery: Long‐Term Morphological Changes After Surgical Resection,” Epilepsia Open 8 (2023): 559–570. [DOI] [PMC free article] [PubMed] [Google Scholar]
- 32. Kerezoudis P., Parisi V., Marsh W. R., et al., “Surgical Outcomes of Laser Interstitial Thermal Therapy for Temporal Lobe Epilepsy: Systematic Review and Meta‐Analysis,” World Neurosurgery 143 (2020): 527–536.e3. [DOI] [PubMed] [Google Scholar]
- 33. Galovic M., Baudracco I., Wright‐Goff E., et al., “Association of Piriform Cortex Resection With Surgical Outcomes in Patients With Temporal Lobe Epilepsy,” JAMA Neurology 76 (2019): 690–700. [DOI] [PMC free article] [PubMed] [Google Scholar]
- 34. Shofty B., Bergman L., Berger A., et al., “Adopting MR‐Guided Stereotactic Laser Ablations for Epileptic Lesions: Initial Clinical Experience and Lessons Learned,” Acta Neurochirurgica 163 (2021): 2797–2803. [DOI] [PubMed] [Google Scholar]
- 35. Khadhraoui E., Nickl‐Jockschat T., Henkes H., Behme D., and Müller S. J., “Automated Brain Segmentation and Volumetry in Dementia Diagnostics: A Narrative Review With Emphasis on FreeSurfer,” Frontiers in Aging Neuroscience 16 (2024): 1459652. [DOI] [PMC free article] [PubMed] [Google Scholar]
- 36. Müller S. J., Khadhraoui E., Hansen N., et al., “Brainstem Atrophy in Dementia With Lewy Bodies Compared With Progressive Supranuclear Palsy and Parkinson's Disease on MRI,” BMC Neurology [Electronic Resource] 23 (2023): 114. [DOI] [PMC free article] [PubMed] [Google Scholar]
- 37. Arnold T. C., Muthukrishnan R., Pattnaik A. R., et al., “Deep Learning‐Based Automated Segmentation of Resection Cavities on Postsurgical Epilepsy MRI,” Neuroimage: Clinical 36 (2022): 103154. [DOI] [PMC free article] [PubMed] [Google Scholar]
- 38. Sammarra I., Caligiuri M. E., Bonacci M. C., et al., “May Anti‐seizure Medications Alter Brain Structure in Temporal Lobe Epilepsy? A Prospective Study,” Epilepsia Open 9 (2024): 1076–1082. [DOI] [PMC free article] [PubMed] [Google Scholar]
- 39. Petito G. T., Wharen R. E., Feyissa A. M., Grewal S. S., Lucas J. A., and Tatum W. O., “The Impact of Stereotactic Laser Ablation at a Typical Epilepsy Center,” Epilepsy & Behavior 78 (2018): 37–44. [DOI] [PubMed] [Google Scholar]
- 40. Müller S. J., Khadhraoui E., Voit D., Riedel C. H., Frahm J., and Ernst M., “First Clinical Application of a Novel T1 Mapping of the Whole Brain,” Neuroradiology Journal 35 (2022): 684–691. [DOI] [PMC free article] [PubMed] [Google Scholar]