



ABSTRACT
Metformin is a classical oral hypoglycemic drug, often recommended as the first‐line therapy for type 2 diabetes mellitus (T2DM). Previous research has shown that the efficacy of metformin is associated with the genetic polymorphisms of patients. Considering the role of G6PC in gluconeogenesis and glycogenolysis, this study aims to investigate the association of G6PC rs161620 and rs2229611 with metformin efficacy in T2DM patients who take metformin only. According to the decrease of HbA1c, 116 T2DM patients receiving metformin monotherapy were divided into two groups: response group (the decrease of HbA1c by at least 1.5% after 3 months) and non‐response group (the decrease of HbA1c < 1.5%). SNPscan technology was used to genotype. There were significant differences in rs161620 and rs2229611 presented in genotype frequency (p = 0.027 both) between the response group and the non‐response group. According to the results of logistic analysis, the genetic polymorphisms of G6PC rs161620 or rs2229611 could influence the hypoglycemic effect of metformin in T2DM patients. We found that the decreasing values of PBG and HbA1c in G6PC rs161620 (C > A) or rs2229611 (T > C) mutants were significantly more than those in wild‐type individuals, which means the more effective genotypes of metformin are CA/AA of rs161620 and TC/CC of rs2229611. This study suggested that the G6PC rs161620 and rs2229611 genetic polymorphisms were significantly associated with metformin efficacy in Chinese T2DM patients.
Keywords: G6PC, metformin, polymorphism, rs161620, rs2229611, type 2 diabetes mellitus
1. Introduction
Type 2 diabetes mellitus (T2DM) is a chronic metabolic disorder characterized by hyperglycemia primarily driven by insulin resistance and progressive β‐cell dysfunction in its pathogenesis. The 2021 IDF Diabetes Atlas indicates that the global prevalence of diabetes among adults is 10%, with the total number of diabetes patients worldwide reaching 537 million, more than 90% of whom have T2DM [1].
Metformin, a well‐established drug for the treatment of T2DM for over 50 years that is recommended as the first‐line therapy in recent international guidelines [2], may exhibit suboptimal efficacy or adverse reactions in some T2DM patients [3]. Recently, several genetic variations associated with the efficacy of metformin have been identified through pharmacogenomic studies [4]. However, there are currently very few studies on the effects of genetic polymorphisms related to glucose metabolism on the efficacy of metformin.
G6PC1 (Glucose‐6‐Phosphatase Catalytic Subunit 1), also called G6PC, is a protein coding gene that is predominantly expressed in the liver and kidney, with minimal expression in the intestine and pancreas [5]. This enzyme catalyzes the conversion of glucose‐6‐phosphate (G6P) to glucose and inorganic phosphate, representing the final step in the catalytic pathways of gluconeogenesis and glycogenolysis, thereby playing a crucial role in maintaining fasting blood glucose levels [6]. The GSEA analysis has revealed that metformin significantly impacts the expression of G6PC and SLC2A4 [7]. It has been demonstrated that G6PC is among the 12 genes regulated by metformin, with its chronic effect on gluconeogenesis being mediated through inhibition of G6PC expression [8]. Several mutations in G6PC have been linked to glycogen storage disease type 1a (GSD‐1a), including rs2229611 [9, 10]. However, further validation is required to determine whether genetic variations in G6PC influence the hypoglycemic effects of metformin.
This study aims to investigate the impact of G6PC genetic polymorphism on metformin efficacy for treating T2DM by collecting DNA samples from T2DM patients who are receiving metformin monotherapy. It also speculates on the mechanisms underlying the effects of G6PC genetic polymorphisms on metformin efficacy, providing a scientific basis for personalized metformin administration.
2. Material and Methods
2.1. Subjects
This study was carried out in 450 T2DM patients (281 males and 169 females). All subjects were recruited from Zhuzhou Central Hospital. The criteria for enrollment were as follows: diagnosed with T2DM in keeping with the ADA standard [11], with fasting blood glucose (FBG) ≥ 7.0 mmol/L or 2 h plasma glucose (2 h PBG) during oral glucose tolerance test (OGTT) ≥ 11.1 mmol/L or glycosylated hemoglobin (HbA1c) ≥ 6.5%; only using metformin for antidiabetic drugs within the experimental period. Patients who were diagnosed with type1 diabetes, gestational diabetes, and other significant illnesses such as chronic kidney disease, liver disease, myocardial infarction, stroke, and pregnancy were excluded. This study complies with the Declaration of Helsinki and was approved by the Ethics Committee of the Affiliated Zhuzhou Hospital of Xiangya School of Medicine CSU (Zhuzhou, Hunan, China) (2019‐05031). All the subjects had written informed consent before participating in the study.
A series of clinical parameters including metformin dose, HbA1c, FBG, PBG, and body mass index (BMI) were collected from each patient at the baseline and ending point. The values of FPG and PBG were detected by the hexokinase method, and the HbA1c value was detected by high‐performance liquid chromatography (HPLC). Metformin dosages ranged from 500 to 2000 mg per day among individuals and were adjusted according to the changes of glucose. After 3 months of treatment with metformin, these T2DM patients were divided into two groups based on the decrease of HbA1c value; a decrease of at least 1.5% in HbA1c levels from baseline value was defined as the response group, and a decrease of less than 1.5% in HbA1c levels from baseline value was defined as the non‐response group [12, 13].
2.2. DNA Isolation and Genotyping
Three milliliters of venous blood were collected from each subject using EDTA anticoagulant tubes. Genomic DNA was extracted from peripheral blood leukocytes using the SQ Blood DNA Kit II (Omega Bio‐Tek, Guangzhou, China) according to the manufacturer's protocol. SNP genotyping was conducted by a multiple SNP genotyping kit named SNPscan (G0104K, Genesky Inc., Shanghai, China). This method is a patented technology that is based on multiplex fluorescent polymerase chain reaction (PCR) from Genesky Biotechnologies Inc.
2.3. Statistics
Data were analyzed by SPSS 23.0 (Chicago, Illinois, USA) and PLINK v1.07. The Pearson Chi‐squared (χ 2) test was used to analyze the Hardy–Weinberg Equilibrium (HWE) and allelic frequencies in different groups. The demographic and clinical characteristics that obeyed the normal distribution were compared by the two‐sample t test, while the skewed parameters were compared by the Mann–Whitney U test. Furthermore, the association between metformin efficacy and alleles was analyzed using logistic regression by adjusting for sex, age, BMI, and metformin dosage. In our statistical analysis, two‐tailed p values < 0.05 were significant.
3. Results
3.1. Clinical Characteristics of Subjects
Of the 450 T2DM patients who take metformin, 334 were treated with other hypoglycemic agents, such as acarbose, repaglinide, or insulin. In this circumstance, only 116 T2DM patients who were treated with metformin alone were enrolled in the final efficacy analysis. According to the grouping standard, there are 77 T2DM patients in the response group and 39 in the non‐response group. The demographic and clinical characteristics of these two groups were shown in Table 1. There were no significant differences in age and gender between the response and non‐response groups. After treatment with metformin for consecutively 3 months, the mean changes of HbA1c value in the response group were significantly higher than in the non‐response group (−3.68% ± 1.61% vs. −0.64% ± 0.62%, p < 0.001). Compared with the non‐response group, the mean changes of FBG value (−2.92 ± 2.55 mmol/L vs. −0.98 ± 2.01 mmol/L, p < 0.001) and PBG value (−5.83 ± 5.05 mmol/L vs. −2.59 ± 4.11 mmol/L, p = 0.001) in the response group were also significantly higher. However, there were no significant mean changes in BMI between these two groups.
TABLE 1.
Comparison of clinical characteristics between the response group and non‐response group before and after metformin treatment.
| Parameter | Non‐responses (n = 39) | Responses (n = 77) | p |
|---|---|---|---|
| Gender | |||
| Male | 25 (39.1%) | 39 (60.9%) | 0.169 a |
| Female | 14 (26.9%) | 38 (73.1%) | |
| Age (years) | 55.95 ± 14.66 | 55.39 ± 13.41 | 0.842 b |
| BMI (kg/m2) | |||
| Baseline | 24.24 ± 2.16 | 24.11 ± 1.49 | 0.718 b |
| After metformin | 24.07 ± 3.04 | 23.13 ± 2.80 | 0.924 b |
| Mean change | −0.16 ± 3.86 | 0.34 ± 3.11 | 0.508 b |
| HbA1c (%) | |||
| Baseline | 6.49 ± 1.03 | 9.27 ± 2.09 | 0.000 b |
| After metformin | 5.84 ± 1.04 | 5.63 ± 1.25 | 0.335 b |
| Mean change | −0.64 ± 0.62 | −3.68 ± 1.61 | 0.000 b |
| FBG (mmol/L) | |||
| Baseline | 6.86 ± 2.11 | 9.55 ± 3.37 | 0.000 b |
| After metformin | 5.86 ± 1.15 | 5.83 ± 1.46 | 0.899 b |
| Mean change | −0.98 ± 2.01 | −2.92 ± 2.55 | 0.000 b |
| PBG (mmol/L) | |||
| Baseline | 11.43 ± 4.22 | 14.32 ± 4.65 | 0.001 b |
| After metformin | 9.05 ± 1.78 | 8.53 ± 1.85 | 0.183 b |
| Mean change | −2.59 ± 4.11 | −5.83 ± 5.05 | 0.001 b |
Note: The numbers in bold indicate statistically significant values.
Abbreviations: BMI, body mass index; FBG, fasting blood‐glucose; HbA1c, glycosylated hemoglobin; PBG, postprandial blood glucose.
Data was analyzed by the Pearson Chi‐squared (χ 2) test.
Data was analyzed by two‐sample t test or Mann–Whitney U test.
3.2. Genotype and Allele Frequencies Distribution
The genotype and allele frequencies of G6PC rs161620 and rs2229611 polymorphism in the response group and non‐response group are shown in Table 2. Both groups did not deviate from Hardy–Weinberg equilibrium (p = 0.121 and p = 0.651, separately). There were significant differences in rs161620 and rs2229611 presented in genotype frequency (p = 0.027 both) between the response group and the non‐response group, indicating that G6PC rs161620 and rs2229611 polymorphisms were significantly related to the therapeutic efficacy of metformin in the Chinese T2DM patients. Using the SHEsis online tool (http://analysis.bio‐x.cn/myAnalysis.php) for linkage disequilibrium (LD) analysis, we found there was complete LD between rs161620 and rs2229611 with r 2 = 1 and D′ = 1.
TABLE 2.
Comparisons of allelic frequencies of G6PC rs161620 and rs2229611 polymorphisms in the response group and non‐response group.
| Parameter | Non‐responses (n = 39) | Responses (n = 77) | p |
|---|---|---|---|
| G6PC rs161620 | |||
| CC | 20 (42.6%) | 14 (20.3%) | 0.027 |
| CA | 19 (40.4%) | 43 (62.3%) | |
| AA | 8 (17.0%) | 12 (17.4%) | |
| Alleles | |||
| C | 59 (62.8%) | 71 (51.4%) | 0.088 |
| A | 35 (37.2%) | 67 (48.6%) | |
| G6PC rs2229611 | |||
| TT | 20 (42.6%) | 14 (20.3%) | 0.027 |
| TC | 19 (40.4%) | 43 (62.3%) | |
| CC | 8 (17.0%) | 12 (17.4%) | |
| Alleles | |||
| T | 59 (62.8%) | 71 (51.4%) | 0.088 |
| C | 35 (37.2%) | 67 (48.6%) | |
| HWE p | 0.651 | 0.121 | |
Note: Data was analyzed by chi‐squared (χ 2) test. The numbers in bold indicate statistically significant values.
Abbreviation: HWE, Hardy–Weinberg equilibrium.
3.3. Analysis of the Effects of G6PC rs161620 and rs2229611 Polymorphisms on Metformin Efficacy in T2DM Patients
After genotype distribution analysis, we also analyzed the association between G6PC rs161620 and rs2229611 polymorphisms on metformin efficacy, using binary logistic analysis adjusted for age, sex, BMI, and metformin dosage (Table 3). We found that the genetic polymorphisms of G6PC rs161620 or rs2229611 could influence the hypoglycemic effect of metformin in T2DM patients. Compared with the wild type, the mutant heterozygote and mutant homozygote of rs161620 or rs2229611 are protective factors for T2DM patients who take metformin (OR = 0.309, p = 0.009 and OR = 0.296, p = 0.050, respectively). In the dominant model, when the G6PC rs161620 CC genotype was made to be the reference, the CA/AA genotype was linked to a significantly better therapeutic efficacy of metformin (CC vs. CA/AA: adjusted OR = 0.306, 95% CI = 0.133–0.706, p = 0.006). However, there was no difference between the CA/CC genotype and AA genotype in the recessive model. Because of the complete LD between rs161620 and rs2229611, the results of rs2229611 were fully in agreement with rs161620. Compared with the TT genotype of rs2229611, the TC/CC genotype was associated with a significantly better therapeutic efficacy of metformin (TT vs. TC/CC: adjusted OR = 0.306, 95% CI = 0.133–0.706, p = 0.006).
TABLE 3.
Association between G6PC genetic polymorphisms and metformin efficacy in T2DM patients (adjusted for age, gender, BMI and metformin dosage).
| Genotype | Non‐responses (n = 39) | Responses (n = 77) | OR (95% CI) | p |
|---|---|---|---|---|
| rs161620 (C > A) | ||||
| CC | 18 (52.9%) | 16 (47.1%) | 1.0 (reference) | — |
| CA | 16 (25.8%) | 46 (74.2%) | 0.309 (0.128–0.747) | 0.009 |
| AA | 5 (25.0%) | 15 (75.0%) | 0.296 (0.088–0.999) | 0.050 |
| CC vs. CA/AA (Dominant model) | 0.306 (0.133–0.706) | 0.006 | ||
| CC/CA vs. AA (Recessive model) | 0.562 (0.182–1.736) | 0.317 | ||
| rs2229611 (T > C) | ||||
| TT | 18 (52.9%) | 16 (47.1%) | 1.0 (reference) | — |
| TC | 16 (25.8%) | 46 (74.2%) | 0.309 (0.128–0.747) | 0.009 |
| CC | 5 (25.0%) | 15 (75.0%) | 0.296 (0.088–0.999) | 0.050 |
| TT vs. TC/CC (Dominant model) | 0.306 (0.133–0.706) | 0.006 | ||
| TT/TC vs. CC (Recessive model) | 0.562 (0.182–1.736) | 0.317 | ||
Note: Data was analyzed by the logistic regression by adjusting for sex, age, BMI, and metformin dosage. The numbers in bold indicate statistically significant values.
Abbreviations: CI, confidence interval; OR, odds ratio.
By comparing the decreasing values of PBG and HbA1c before and after taking metformin, it was found that the decreases of PBG value (Figure 1a) and HbA1c value (Figure 1b) in G6PC rs161620 (C > A) mutants were significantly greater than those in wild‐type individuals, and the decreases of PBG value (Figure 1c) and HbA1c value (Figure 1d) in G6PC rs2229611 (T > C) mutants were also significantly higher.
FIGURE 1.
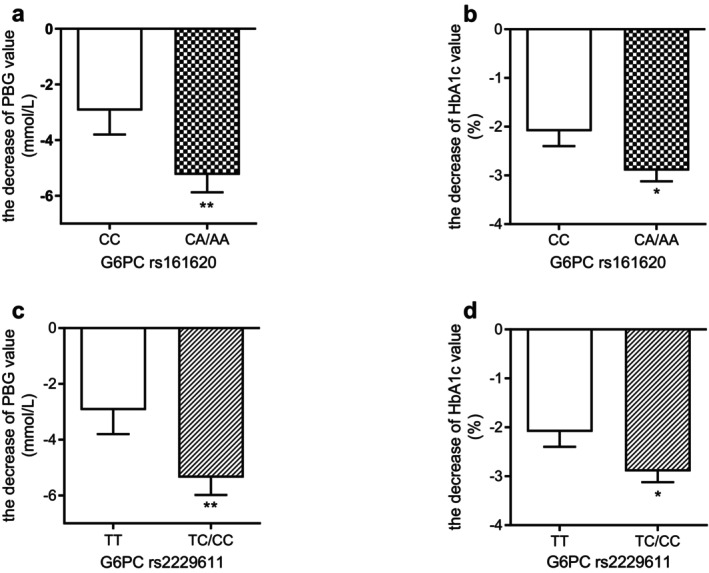
The decreases of PBG value and HbA1C value in T2DM patients after metformin treatment. (a) the decrease of PBG value in G6PC rs161620 (C >A ) mutants was significantly greater than that in wild‐type individuals. (b) the decrease of HbA1c value in G6PC rs161620 (C > A) mutants was significantly greater than that in wild‐type individuals. (c) the decrease of PBG value in G6PC rs2229611 (T > C) mutants was significantly greater than that in wild‐type individuals. (d) the decrease of HbA1c value in G6PC rs2229611 (T >C ) mutants was significantly greater than that in wild‐type individuals. Data are shown as mean ± SD. *p < 0.05 compared with the wild type (n = 116). **p < 0.01 compared with the wild type (n = 116).
4. Discussion
Due to its favorable safety profile and robust glucose‐lowering effects, metformin is widely recognized as a cost‐effective first‐line therapy in comparison to other hypoglycemic agents [14]. Consistent with this, current national and international guidelines recommend metformin as the initial pharmacological treatment for the management of hyperglycemia in individuals with T2DM [15, 16]. However, it is noteworthy that around one‐third of patients with T2DM do not achieve optimal glycemic control with metformin monotherapy [3]. In our study, we also found that about 66.4% of participants achieved acceptable glycemic control, which is in accordance with previous studies.
Several studies have explored the relationship between genetic polymorphisms and metformin efficacy [17, 18]. G6PC is a critical enzyme in the gluconeogenesis pathway, playing a pivotal role in maintaining glucose homeostasis [19]. Genetic variants of G6PC have been identified in GSD‐Ia and hepatocellular carcinoma in several independent studies [20, 21, 22, 23]. In this study, we investigated the effect of two G6PC variants (rs161620 and rs2229611) on response to metformin therapy in T2DM patients for the first time. we have observed that the genotype frequencies of G6PC rs161620 and rs2229611 were significantly different between the response group and the non‐response group, which indicates that the genetic polymorphisms of rs161620 and rs2229611 are associated with metformin efficacy in T2DM. Compared with the wild type, patients with the mutant type of rs161620 or rs229611 could achieve better therapeutic effects. And there was complete LD between rs161620 and rs2229611.
The genetic polymorphisms of the gene's 3′UTR could play an important role in regulating gene expression via binding to miRNA. It was reported that rs2229611 altered the binding of miRNAs to affect the stability and expression of G6PC, but the specific miRNA responsible was not verified [24]. We also conducted in silico analysis using an online tool named miRNASNP V3. We found that the variations of rs161620 and rs2229611 could permit a gain or loss of allele‐dependent miRNA target sequence recognition, which gives opportunity to miRNA for its regulation mechanisms, thus affecting protein expression; however, these results need further validation in vitro.
Our study has shown that patients with the CA/AA genotype of rs161620 exhibited a greater reduction in FBG and HbA1c levels compared to wild type. The TC/CC genotype of rs2229611 was the same. Notably, there are limited studies concerning rs2229611 or rs161620. We found the studies that explored the effect of rs2229611polymorphism on GSD‐1a [9, 24], but no studies that discussed the effect of metformin efficacy. Also, there are no studies focused on rs161620. It is reported that metformin could decrease the mRNA expression of G6PC in rat hepatocytes [25, 26]; the chronic effect of metformin on gluconeogenesis is mediated by repression of the G6PC and PCK1 genes, resulting in lower protein levels [8]. However, no study revealed the effect of G6PC on metformin efficacy; this was the innovation point of our study. In addition, we found that G6PC rs2229611 and rs161620 could influence the efficacy of metformin in T2DM patients. Therefore, we speculate that there may be individual differences in the chronic effect of metformin on gluconeogenesis, which may be related to G6PC expression influenced by the polymorphisms of G6PC rs2229611 and rs161620. Of course, further experiments are needed to verify this speculation, which will be the next step of our team.
There were still some limitations in this study. The primary limitation of our study was the small sample size, which restricts the statistical power and generalizability of our findings. A larger cohort is necessary to more accurately assess the potential association of rs161620 and rs2229611 gene polymorphisms on the G6PC gene and metformin efficacy. Additionally, our study did not monitor plasma concentrations of metformin to evaluate its pharmacokinetics or its correlation with gene polymorphisms. Therefore, further comprehensive investigations are warranted to elucidate the mechanism of the relationship between SNP and metformin efficacy.
5. Conclusion
In conclusion, the G6PC rs161620 and rs2229611 genetic polymorphisms could influence the therapeutic efficacy of metformin in Chinese T2DM patients. Our study suggests that the more effective genotypes of metformin are CA/AA of rs161620 and TC/CC of rs2229611. Nevertheless, more investigation should be conducted to confirm these findings in various ethnic groups with larger sample sizes.
Author Contributions
C.L. and X.L. contributed to the conceptualization, research objectives, interpretation of results, and manuscript writing; X.Y., L.H., and Z.B. performed the analysis and enrolled participants in the study; L.Z. and Y.T. contributed to laboratory analyses; all authors revised the manuscript and accepted submission to the journal.
Ethics Statement
This study complies with the Declaration of Helsinki and was approved by the Ethics Committee of the Affiliated Zhuzhou Hospital of Xiangya School of Medicine CSU (Zhuzhou, Hunan, China) (2019‐05031). All the subjects had written informed consent before participating in the study.
Conflicts of Interest
The authors declare no conflicts of interest.
Acknowledgments
We thank all volunteers for their cooperation and the involved physicians of Zhuzhou Central Hospital.
Funding: This study was supported by the Natural Science Foundation of Hunan Province (No. 2021JJ80090).
The authors confirm that the Principal Investigator for this paper is Xin Liu and that he had direct clinical responsibility for patients.
Data Availability Statement
The data that support the findings of this study are available from the corresponding author upon reasonable request.
References
- 1. Sun H., Saeedi P., Karuranga S., et al., “IDF Diabetes Atlas: Global, Regional and Country‐Level Diabetes Prevalence Estimates for 2021 and Projections for 2045,” Diabetes Research and Clinical Practice 183 (2022): 109119, 10.1016/j.diabres.2021.109119. [DOI] [PMC free article] [PubMed] [Google Scholar]
- 2. Flory J. and Lipska K., “Metformin in 2019,” JAMA 321, no. 19 (2019): 1926–1927. [DOI] [PMC free article] [PubMed] [Google Scholar]
- 3. Cook M. N., Girman C. J., Stein P. P., and Alexander C. M., “Initial Monotherapy With Either Metformin or Sulphonylureas Often Fails to Achieve or Maintain Current Glycaemic Goals in Patients With Type 2 Diabetes in UK Primary Care,” Diabetes/Metabolism Research and Reviews 24, no. 4 (2007): 350–358, 10.1111/j.1464-5491.2007.02078.x. [DOI] [PubMed] [Google Scholar]
- 4. Florez J. C., “The Pharmacogenetics of Metformin,” Diabetologia 60, no. 9 (2017): 1648–1655, 10.1007/s00125-017-4335-y. [DOI] [PMC free article] [PubMed] [Google Scholar]
- 5. van Schaftingen E. and Gerin I., “The Glucose‐6‐Phosphatase System,” Biochemical Journal 362, no. Pt 3 (2002): 513–532, 10.1042/0264-6021:3620513. [DOI] [PMC free article] [PubMed] [Google Scholar]
- 6. Hutton J. C. and O'Brien R. M., “Glucose‐6‐Phosphatase Catalytic Subunit Gene Family,” Journal of Biological Chemistry 284, no. 43 (2009): 29241–29245. [DOI] [PMC free article] [PubMed] [Google Scholar]
- 7. Dawed A. Y., Ali A., Zhou K., Pearson E. R., and Franks P. W., “Evidence‐Based Prioritisation and Enrichment of Genes Interacting With Metformin in Type 2 Diabetes,” Diabetologia 60, no. 11 (2017): 2231–2239. [DOI] [PMC free article] [PubMed] [Google Scholar]
- 8. Agius L., Ford B. E., and Chachra S. S., “The Metformin Mechanism on Gluconeogenesis and AMPK Activation: The Metabolite Perspective,” International Journal of Molecular Sciences 21, no. 9 (2020): 3240, 10.3390/ijms21093240. [DOI] [PMC free article] [PubMed] [Google Scholar]
- 9. Pinheiro F. C., Sperb‐Ludwig F., Fagundes V. J., et al., “The rs2229611 (G6PC:C.*23 T>C) is Associated With Glycogen Storage Disease Type Ia in Brazilian Patients,” Molecular Genetics and Metabolism Reports 25 (2020): 100659. [DOI] [PMC free article] [PubMed] [Google Scholar]
- 10. Gu L. L., Li X. H., Han Y., Zhang D. H., Gong Q. M., and Zhang X. X., “A Novel Homozygous No‐Stop Mutation in G6PC Gene From a Chinese Patient With Glycogen Storage Disease Type Ia,” Gene 536, no. 2 (2014): 362–365, 10.1016/j.gene.2013.11.059. [DOI] [PubMed] [Google Scholar]
- 11. American Diabetes Association Professional Practice Committee , “2. Diagnosis and Classification of Diabetes: Standards of Care in Diabetes‐2024,” Diabetes Care 47, no. Suppl 1 (2024): S20–S42. [DOI] [PMC free article] [PubMed] [Google Scholar]
- 12. Garber A. J., Duncan T. G., Goodman A. M., Mills D. J., and Rohlf J. L., “Efficacy of Metformin in Type II Diabetes: Results of a Double‐Blind, Placebo‐Controlled, Dose‐Response Trial,” American Journal of Medicine 103, no. 6 (1997): 491–497, 10.1016/s0002-9343(97)00254-4. [DOI] [PubMed] [Google Scholar]
- 13. Ji L., Li H., Guo X., Li Y., Hu R., and Zhu Z., “Impact of Baseline BMI on Glycemic Control and Weight Change With Metformin Monotherapy in Chinese Type 2 Diabetes Patients: Phase IV Open‐Label Trial,” PLoS One 8, no. 2 (2013): e57222. [DOI] [PMC free article] [PubMed] [Google Scholar]
- 14. Klarenbach S., Cameron C., Singh S., and Ur E., “Cost‐Effectiveness of Second‐Line Antihyperglycemic Therapy in Patients With Type 2 Diabetes Mellitus Inadequately Controlled on Metformin,” CMAJ 183, no. 16 (2011): E1213–E1220, 10.1503/cmaj.110178. [DOI] [PMC free article] [PubMed] [Google Scholar]
- 15. de Boer I. H., Khunti K., Sadusky T., et al., “Diabetes Management in Chronic Kidney Disease: A Consensus Report by the American Diabetes Association (ADA) and Kidney Disease: Improving Global Outcomes (KDIGO),” Diabetes Care 45, no. 12 (2022): 3075–3090. [DOI] [PMC free article] [PubMed] [Google Scholar]
- 16. ElSayed N. A., Aleppo G., Aroda V. R., et al., “Addendum. 4. Comprehensive Medical Evaluation and Assessment of Comorbidities: Standards of Care in Diabetes‐2023. Diabetes Care 2023; 46 (Suppl. 1): S49–S67,” Diabetes Care 46, no. 9 (2023): 1718–1720. [DOI] [PMC free article] [PubMed] [Google Scholar]
- 17. Li Q., Li C., Li H., et al., “STK11 rs2075604 Polymorphism Is Associated With Metformin Efficacy in Chinese Type 2 Diabetes Mellitus,” International Journal of Endocrinology 2017 (2017): 3402808, 10.1155/2017/3402808. [DOI] [PMC free article] [PubMed] [Google Scholar]
- 18. Li S., Xu B., Fan S., et al., “Effects of Single‐Nucleotide Polymorphism on the Pharmacokinetics and Pharmacodynamics of Metformin,” Expert Review of Clinical Pharmacology 15, no. 9 (2022): 1107–1117, 10.1080/17512433.2022.2118714. [DOI] [PubMed] [Google Scholar]
- 19. Hatting M., Tavares C., Sharabi K., et al., “Insulin Regulation of Gluconeogenesis,” Annals of the New York Academy of Sciences 1411 (2018): 21–35, 10.1111/nyas.13435. [DOI] [PMC free article] [PubMed] [Google Scholar]
- 20. Bergamini C., Leoni I., Rizzardi N., et al., “MiR‐494 Induces Metabolic Changes Through G6pc Targeting and Modulates Sorafenib Response in Hepatocellular Carcinoma,” Journal of Experimental & Clinical Cancer Research 42, no. 1 (2023): 145, 10.1186/s13046-023-02718-w. [DOI] [PMC free article] [PubMed] [Google Scholar]
- 21. Ito K., Tajima G., Kamisato C., et al., “A Splice‐Switching Oligonucleotide Treatment Ameliorates Glycogen Storage Disease Type 1a in Mice With G6PC c.648G>T,” Journal of Clinical Investigation 133, no. 23 (2023): e163464. [DOI] [PMC free article] [PubMed] [Google Scholar]
- 22. Chou J. Y. and Mansfield B. C., “Mutations in the Glucose‐6‐Phosphatase‐Alpha (G6PC) Gene That Cause Type Ia Glycogen Storage Disease,” Human Mutation 29, no. 7 (2008): 921–930. [DOI] [PMC free article] [PubMed] [Google Scholar]
- 23. Wang Q., Gao W., Pu W., et al., “G6PC Expression Is Downregulated in Hepatocellular Carcinoma and Associated With Malignant Progression,” Asian Journal of Surgery 47, no. 8 (2024): 3727. [DOI] [PubMed] [Google Scholar]
- 24. Karthi S., Rajeshwari M., Francis A., et al., “3'‐UTR SNP rs2229611 in G6PC1 Affects mRNA Stability, Expression and Glycogen Storage Disease Type‐Ia Risk,” Clinica Chimica Acta 471 (2017): 46–54, 10.1016/j.cca.2017.05.016. [DOI] [PubMed] [Google Scholar]
- 25. Moonira T., Chachra S. S., Ford B. E., et al., “Metformin Lowers Glucose 6‐Phosphate in Hepatocytes by Activation of Glycolysis Downstream of Glucose Phosphorylation,” Journal of Biological Chemistry 295, no. 10 (2020): 3330–3346, 10.1074/jbc.RA120.012533. [DOI] [PMC free article] [PubMed] [Google Scholar]
- 26. Ota S., Horigome K., Ishii T., et al., “Metformin Suppresses Glucose‐6‐Phosphatase Expression by a Complex I Inhibition and AMPK Activation‐Independent Mechanism,” Biochemical and Biophysical Research Communications 388, no. 2 (2009): 311–316, 10.1016/j.bbrc.2009.07.164. [DOI] [PubMed] [Google Scholar]
Associated Data
This section collects any data citations, data availability statements, or supplementary materials included in this article.
Data Availability Statement
The data that support the findings of this study are available from the corresponding author upon reasonable request.