

Abstract
DF13-2 and YC13-1 are two large gas fields found in Yinggehai and Qiongdongnan Basins, respectively, and the gas-source correlation is a very challenging scientific exercise due to the similarity of their hydrocarbon isotoperatios and gas dryness. In this study, the chemical and isotopic compositions of natural gases (including rare gases and bulk gases) and the biomarkers of condensate were comprehensively integrated to identify their origins. The gases from the two fields are composed primarily of methane (87–91%), and isotope ratios of hydrocarbon compounds exhibit a thermogenic origin, with δ13C1 values ranging from − 40.7 to 35.0‰, and δ13C2 from − 27.0 to − 25.4‰. There are small yet distinct differences in the genetic characteristics of CH4 He, Ar, CO2, N2 and condensate between the samples from two regions. The δ13C1 values of DF13-2 (− 36.8 to − 33.7‰) are slightly larger than those (− 40.7 to − 35.5‰) of YC13-1, suggesting a slightly higher thermal maturity in DF13-2 field. In addition, DF13-2 gases contain lower Ar (0.0096–0.016%) and He (11–15 ppm). The 3He/4He ratios range from 3.31 × 10⁻⁸ to 7.72 × 10⁻⁸, indicating a typical crustal origin, likely representative of pristine source-rock signatures. The gases have higher N2 (8.4–9.66%) but lower CO2 contents (0.10–0.36%), which are co-generated with the thermogenic hydrocarbon gases. The condensate coexisted with gas contains abundant terrestrial-derived oleanane but a low abundance of bicadinanes. These characteristics correlate well with the Miocene neritic shales in Yinggehai Basin. Fractures associated with the diapiric activity provide key conduits for gas up-migration into the Huangliu Formation reservoir, implying that the flank of a diapiric structure is a favorable site for gas accumulation. In contrast, the gases from YC13-1 field show lower N2 but higher CO2 amounts. He and Ar abundances are both higher with a small amount contribution (2–9%) of mantle-derived He. The elevated amounts of mantle-derived 3He may come from mantle-enriched groundwater circulating in the petroleum system. The coexisted condensate is rich in terrestrial biomarkers such as oleanane and bicadinane, which is significantly different from DF13-2 condensate, and has a close affinity with the coal-bearing source rocks of the Oligocene Yacheng Formation. Unconformities and faults serve as important conduits for lateral and vertical migration from the source rocks to the traps. This suggests that short-distance migration and source facies control the distribution of the natural gases in Qiongdongnan Basin. This study provides novel insights into the origin and accumulation model of natural gases in Yinggehai and Qiongdongnan Basins.
Keywords: DF13-2 gas field, YC13-1 gas field, Noble gases, Natural gas, Isotopic composition, Gas-source correlation, Yinggehai–Qiongdongnan Basins
Subject terms: Geochemistry, Geochemistry
Introduction
The Yinggehai (YGH) Basin and Qiongdongnan (QDN) Basin (referred to as the Ying-Qiong Basins) are two separate Cenozoic basins with close geographic proximity and genetic linkage1,2. Great attention has been paid to the basins in recent years because of their abundant natural gas resources and unique geological conditions1–4. Since 1983, eight large and medium-sized gas fields and a number of gas-bearing structures have been discovered within the basins, with proven natural gas reserves of up to approximately 600 billion cubic meters. This makes it the largest natural gas production area in China’s offshore region. Among these discoveries, the YC13-1 gas field in the QDN Basin has proven natural gas geological reserves of 803 × 108 cubic meters5. The DF13-2 gas field is situated in the central diapiric zone of the YGH Basin, with proven natural gas reserves of approximately 686 × 108 cubic meters5. They represent the two largest high-quality natural gas fields in the shallow waters of the Ying-Qiong Basins (Fig. 1).
Fig. 1.

Maps showing the structural divisions of Yinggehai and Qiondongnan basins (a), the sampling locations of DF13-2 gas field (b) and YC13-1gas field (c). The Yinggehai (YGH) Basin and Qiongdongnan (QDN) Basin are two Cenozoic oil and gas-bearing basins with close geographic proximity and genetic linkage. The structural divisions: (1) Yabei Sag, (2) Songxi Sag, (3) Songdong B Sag, (4) Yanan Sag, (5) Ledong Sag, (6) Lingshui Sag, (7) Songnan Sag, (8) Baodao Sag, and (9) Central Yinggehai Depression (Diapir Belt). The YC13-1 gas field is located in the upthrown block of the No. 1 fault in Yana Sag of QDN Basin. The DF13-2 gas field is situated in the Central Diapiric belt of YGH Basin.
Numerous papers have been published on the origin and accumulation of natural gas in the Ying-Qiong Basins3,4,6–9. The origin of these gases has been a subject of heated debate, but no general consensus has been reached. For example, the marine shales in the Meishan Formation in the Yinggehai Basin were suggested to be the major source rocks for the YC13-1 gas field6,8,10, whereas others believe that the source for these gases was the coal-bearing Yacheng Formation in Yanan Sag of the QDN Basin3,7,11. In addition, recent geochemical studies have focused on the origin and accumulation of natural gas in the dipiric shallow gas fields (Upper Neogene and Quaternary reservoirs), and the marine shales in the Meishan and Sanya Formations in the YGH Basin were suggested to be the major source rocks for these gases9,12,13. Little research has been conducted on the origin of natural gas in the medium-deep-seated Huangliu Formation for DF13-2 gas field. On the other hand, there is a lack of study on the rare gas characteristics of YC13-1 and DF13-2 gas fields. Noble gases are ideal tracers of fluid provenance and physical processes in a variety of subsurface14, and will lead to a better understanding of origins of the coexisted gases14,15. Therefore, the primary goal of this paper is to provide an overview of the geochemical characteristics of these gases for DF13-2 and YC 13-1 fields, and determine their origins by integrating the molecular and isotopic compositions of bulk gas and noble gas. The biomarker data of the condensate associated with gas are also utilized to identify their source rocks. A secondary objective is to discuss the gas accumulation model combining with the geological condition. This will be helpful to better define the petroleum system and favorable exploration areas in the YGH-QDN basins.
Geological settings
The Ying-Qiong Basin, located in the western part of the northern continental shelf of the South China Sea, is situated in the southwest to south of Hainan Island. It is separated by the No. 1 fault during the Paleogene, with the QDN Basin to the east and the YGH Basin to the west (Fig. 1). In the Neogene, the fault is no longer in control of sedimentation, and the two basins are merged, and followed by rapid subsidence1,2. The total area is approximately 160,000 square kilometers.
The tectonic evolution of the Ying-Qiong Basin can be divided into two stages: the Paleogene rifting stage and the Neogene-Quaternary post-rift thermal subsidence stage1,2 (Fig. 2). The QDN Basin has a greater sediment with a maximum thickness of about 6600 m during the rifting stage. The Eocene is characterized by lacustrine deposits with relatively thin and variable thickness. The Early Oligocene Yachang Formation received mostly neritic and coastal plain coal-bearing sediments. Immediately above the Late Oligocene Yacheng Formation are the littoral, neritic as well as deltaic Lingshui Formation, and the third member of the Lingshui Formation, consisting of deltaic sandstones, forms the main reservoir of the YC13-1 gas field (Fig. 2). Post-rift sediments in the QDN Basin are much thinner (about 2000–5000 m) compared to the YGH Basin, primarily consisting of shallow to semi-deep marine deposits.
Fig. 2.

Generalized stratigraphic column of the Yinggehai and Qiongdongnan basins, showing schematic stratigraphy system, the sedimentary environments and the occurrence of natural gases. The tectonic evolution of the Ying-Qiong Basins can be divided into two stages: the Paleogene rifting stage and the Neogene-Quaternary post-rift thermal subsidence stage1,2.
The Paleogene sediments in the central depression of the YGH Basin have not been penetrated due to their deep burial, except for encounters at the margin of basin. In the central part of the basin, post-rift Neogene-Quaternary marine deposits have a thickness of nearly 7000 m, primarily composed of mudstones with interbedded delta and submarine fan fine sandstones. These sediments have not been structurally disrupted except where shale diapirs developed9,12. Among them, the Upper Middle Miocene Huangliu Formation submarine fan sandstones serve as the main reservoir for DF13-2 gas field.
High temperatures (39–45 °C/km) and rapid subsidence/sedimentation (maximum sedimentation rate up to 1.2 mm/year) are unique geological features of the Ying-Qiong Basin. The rapid sedimentation coupled with under-compaction, results in the development of a widespread overpressure with a pressure coefficient of up to 2.32,4,13. High temperature and high-pressure conditions, along with the diapiric activity, significantly influence the generation and migration of natural gas in the region. Available geological and geochemical data indicate that the Neogene (especially the Meishan to Sanya Formations) marine mudstones received a significant amount of terrestrial organic matter, and are believed to be the primary hydrocarbon source rocks in the YGH Basin, while the coal-bearing strata in the Yanchang Formation are the main source rocks in the QDN Basin4,13. These source rocks are rich in gas-prone type II2–III kerogens, generating abundant gases13.
Samples and methods
Thirty-one gas samples were directly collected from the production wells of the DF13-2 and YC13-1 gas fields, and sampling locations are shown in Fig. 1.
The gas analysis, including the chemical and isotopic composition of natural gas was conducted in the Key Laboratory of Petroleum Resources Research, Institute of Geology and Geophysics, Chinese Academy of Sciences (Lanzhou, China).
The measurements of gas molecular composition were performed using a combination of gas chromatography and gas mass spectrometry. First, the MAT271 gas mass spectrometer was used to analyze the relative content of non-hydrocarbon gases, rare gases and CH4. Subsequently, the gaseous hydrocarbon (CH4, C2H6, C3H8, etc.) were examined with an Agilent 6890N gas chromatograph equipped with a capillary column (PLOT Al2O3, 50 m × 0.53 mm). The data obtained by gas mass spectrometry and gas chromatography were normalized with the CH4 content, and the relative standard deviation of the gas components is 0.5%.
Rare gas isotopic composition was measured using a specially designed noble gas mass spectrometry system16, consisting of QMG422 quadrupole mass spectrometer made by Pfeiffer Vacuum GmbH (Germany) and the Noblesse rare gas isotope mass spectrometer manufactured by Nu Instruments Ltd. (UK). The details of analytical procedure were described in Cao et al.16. 4He, 20Ne, 22Ne, 40Ar, and 36Ar were examined with a Faraday collector, and 3He, 21Ne, 38Ar, and Kr isotopes were analyzed with an electron multiplier. The atmospheric standard (collected from the top of Gaolan Mountain in Lanzhou) was measured before and after each sample.
Carbon and hydrogen isotope composition analysis was carried out using the Thermo Scientific MAT 253 plus isotope ratio mass spectrometer. The Trace 1310 gas chromatograph with a capillary column (CP-arboBOND, 50 m × 0.53 mm × 10 μm) was used to separate individual compounds in natural gas. The separated compounds were oxidized to CO2 and then analyzed for carbon isotope composition. The δ13C values are reported relative to the VPDB standard, with an analytical precision of 0.3‰. Hydrogen isotope composition was reported relative to VSMOW. Calibration of hydrogen isotope values was performed using laboratory inter-laboratory standards16.
Measurement of nitrogen isotope values was conducted using a gas chromatography-isotope ratio mass spectrometry system produced by Thermo Fisher. The temperature was initially set at 30 °C and held for 8 min, then increased at 10 °C/min to 280 °C. Atmospheric nitrogen was used as the standard for calibration of the nitrogen isotope values of the samples.
Results and discussion
Chemical composition of natural gases
The bulk gas compositions and stable isotope compositions are presented in Table 1. All samples from DF13-2 and YC13-1 gas fields exhibit a typical bulk composition for thermogenic gas. The natural gases are characterized by high hydrocarbon gas contents of 90–95.5%. Methane concentrations range from 86.8 to 90.6% with dryness coefficients (C1/C1–5) of 0.94–0.97. The non-hydrocarbon gases are mainly N2 (1.15–9.77%) and CO2 (0.1–6.26%). DF13-2 gases contain 88.05–88.79% of methane, with relatively high N2 (8.27–9.77%) and very low CO2 (0.10–0.35%). YC13-1 gases have also high methane content (86.75–90.06%), but their N2 content, ranging from 1.15 to 2.24%, is much lower than DF13-2 gases (Table 1). This suggests the differences of gas sources for the both fields.
Table 1.
Chemical and isoltopic compositions of bulk gases in YC13-1and DF13-2 gas field.
| Well | Formation | Compositions (%) | C1/C1–5 | δ13C (VPDB, ‰) | δDC1 (‰) | δN (‰) | ||||||||||
|---|---|---|---|---|---|---|---|---|---|---|---|---|---|---|---|---|
| C1 | C2 | C3 | C4 | C5 | C6 | CO2 | N2 | CH4 | C2H6 | C3H8 | CO2 | |||||
| YC13-1-A1 | LS3 | 90.06 | 1.48 | 0.44 | 0.22 | 0.04 | 0.03 | 5.61 | 1.70 | 0.97 | − 35.3 | − 25.4 | − 26.2 | − 7.7 | − 138.5 | |
| YC13-1-A3 | LS3 | 89.45 | 2.04 | 0.66 | 0.29 | 0.09 | 0.05 | 5.81 | 1.15 | 0.97 | − 36.1 | − 26.1 | − 25.5 | − 7.5 | − 142.7 | − 1.3 |
| YC13-1-A4 | LS3 | 90.64 | 1.66 | 0.48 | 0.17 | 0.04 | 0.03 | 5.38 | 1.48 | 0.97 | − 35.4 | − 26.5 | − 26.3 | − 7.8 | − 141.2 | − 2.2 |
| YC13-1-A8 | SY | 89.56 | 3.83 | 1.40 | 0.60 | 0.12 | 0.02 | 2.13 | 2.24 | 0.94 | − 38.7 | − 26.7 | − 25.2 | − 7.2 | − 154.8 | − 1.6 |
| YC13-1-A9 | LS3 | 89.75 | 1.51 | 0.51 | 0.23 | 0.07 | 0.02 | 3.67 | 2.18 | 0.97 | − 35.2 | − 27.0 | − 26.5 | − 7.8 | − 137.6 | |
| YC13-1-A12 | LS2 | 88.28 | 1.98 | 0.58 | 0.23 | 0.05 | 0.02 | 6.26 | 1.83 | 0.97 | − 36.0 | − 26.2 | − 25.5 | − 8.1 | − 132.6 | |
| YC13-1-A13 | LS2 | 88.84 | 3.84 | 1.50 | 0.74 | 0.21 | 0.07 | 2.95 | 1.76 | 0.93 | − 38.9 | − 26.7 | − 25.3 | − 8.1 | − 151.0 | |
| YC13-1-A14 | LS2 | 86.75 | 3.90 | 1.45 | 0.65 | 0.12 | 0.03 | 5.04 | 1.96 | 0.93 | − 40.7 | − 26.2 | − 25.3 | − 10.8 | − 149.5 | |
| DF13-2-A1 | HL1 | 88.74 | 1.44 | 0.72 | 0.37 | 0.10 | 0.05 | 0.13 | 8.39 | 0.97 | − 35.7 | − 26.3 | − 26.7 | — | − 156.2 | |
| DF13-2-A3 | HL1 | 88.37 | 1.44 | 0.65 | 0.31 | 0.10 | 0.05 | 0.22 | 8.76 | 0.97 | − 35.1 | − 26.0 | − 26.1 | — | − 154.4 | |
| DF13-2-A4 | HL1 | 88.22 | 1.37 | 0.57 | 0.26 | 0.08 | 0.04 | 0.36 | 9.04 | 0.97 | − 33.7 | − 25.5 | − 25.4 | − 6.9 | − 150.2 | |
| DF13-2-A5 | HL1 | 88.41 | 1.43 | 0.69 | 0.35 | 0.11 | 0.03 | 0.20 | 8.71 | 0.97 | − 34.6 | − 26.1 | − 26.4 | − 8.2 | − 152.7 | |
| DF13-2-A6 | HL1 | 88.45 | 1.42 | 0.64 | 0.31 | 0.09 | 0.04 | 0.19 | 8.79 | 0.97 | − 34.7 | − 25.8 | − 26.5 | — | − 152.6 | − 5.6 |
| DF13-2-A7 | HL1 | 88.05 | 1.51 | 0.77 | 0.39 | 0.11 | 0.04 | 0.27 | 8.80 | 0.97 | − 36.3 | − 26.6 | − 26.3 | — | − 156.8 | − 5.4 |
| DF13-2-B3 | HL1 | 88.41 | 1.53 | 0.74 | 0.35 | 0.11 | 0.04 | 0.28 | 8.40 | 0.97 | − 35.5 | − 26.2 | − 26.0 | − 8.1 | − 154.5 | |
| DF13-2-B4 | HL1 | 88.36 | 1.52 | 0.75 | 0.37 | 0.11 | 0.04 | 0.30 | 8.46 | 0.97 | − 35.9 | − 26.4 | − 26.3 | − 9.0 | − 155.4 | |
| DF13-2-B6 | HL1 | 87.35 | 1.57 | 0.81 | 0.37 | 0.11 | 0.04 | 0.28 | 9.38 | 0.97 | − 36.8 | − 26.6 | − 26.4 | − 9.2 | − 158.3 | |
| DF13-2-B9 | HL1 | 87.05 | 1.46 | 0.81 | 0.40 | 0.12 | 0.04 | 0.28 | 9.77 | 0.97 | − 36.7 | − 26.4 | − 26.5 | − 8.2 | − 157.7 | − 5.5 |
| DF13-2-B12 | HL1 | 88.56 | 1.48 | 0.68 | 0.31 | 0.10 | 0.05 | 0.35 | 8.40 | 0.97 | − 35.2 | − 26.3 | − 26.4 | − 8.8 | − 154.1 | |
| DF13-2-B13 | HL1 | 88.57 | 1.56 | 0.76 | 0.33 | 0.10 | 0.04 | 0.29 | 8.28 | 0.97 | − 36.3 | − 26.4 | − 25.7 | − 8.0 | − 157.1 | |
| DF13-2-B14 | HL1 | 87.57 | 1.32 | 0.67 | 0.33 | 0.10 | 0.05 | 0.22 | 9.66 | 0.97 | − 36.8 | − 26.4 | − 26.8 | − 7.5 | − 158.3 | |
| DF13-2-B17 | HL1 | 88.79 | 1.50 | 0.73 | 0.35 | 0.10 | 0.04 | 0.15 | 8.27 | 0.97 | − 35.2 | − 26.3 | − 26.2 | — | − 155.0 | |
| DF13-2-B19 | HL1 | 88.54 | 1.51 | 0.72 | 0.35 | 0.11 | 0.05 | 0.10 | 8.51 | 0.97 | − 35.0 | − 25.8 | − 26.0 | − 9.4 | − 156.3 | |
Errors are ± 0.1% for concentrations, and ± 0.1‰ for isotope values.
HL Huangliu Formation(Upper Miocene), SY Sanya Formation(Lower Miocene), LS Lingshui Formation(Upper Oligocene).
These gases contain a trace of rare gases (Table 2). The abundance of light rare gases (He, Ne, Ar) is much higher than that of heavy rare gases (Kr, Xe) (Fig. 3). Moreover, the abundance of heavy rare gas components significantly decreases with increasing molecular weight.
Table 2.
Concentrations and isotopic compositions of rare gases from YC13-1and DF13-2 gas field.
| Well | He(ppm) | err(2σ) | Ne(ppm) | err(2σ) | Ar(%) | err(2σ) | Kr(ppm) | err(2σ) | Xe(ppb) | err(2σ) | 3He/4He | err(2σ) | R/Ra | err(2σ) |
|---|---|---|---|---|---|---|---|---|---|---|---|---|---|---|
| YC13-1-A1 | 39 | 5 | 0.49 | 0.10 | 0.0320 | 0.0035 | 0.024 | 0.006 | 0.7 | 0.2 | 1.08E−06 | 1.1E−07 | 0.77 | 0.08 |
| YC13-1-A3 | 41 | 5 | 0.34 | 0.07 | 0.0150 | 0.0015 | 0.011 | 0.003 | 0.3 | 0.1 | 1.14E−06 | 1.3E−07 | 0.81 | 0.09 |
| YC13-1-A4 | 40 | 4 | 0.42 | 0.09 | 0.0260 | 0.0026 | 0.024 | 0.005 | 4.0 | 1.3 | 1.04E−06 | 1.1E−07 | 0.74 | 0.08 |
| YC13-1-A8 | 57 | 6 | 0.72 | 0.16 | 0.0320 | 0.0034 | 0.041 | 0.009 | 6.8 | 2.1 | 9.82E−07 | 1.5E−07 | 0.70 | 0.11 |
| YC13-1-A9 | 27 | 3 | 0.57 | 0.13 | 0.0510 | 0.0055 | 0.083 | 0.019 | 26.6 | 9.2 | 8.65E−07 | 1.5E−07 | 0.62 | 0.11 |
| YC13-1-A12 | 45 | 5 | 0.39 | 0.09 | 0.0170 | 0.0018 | 0.009 | 0.002 | 1.5 | 0.5 | 4.92E−07 | 7.9E−08 | 0.35 | 0.06 |
| YC13-1-A13 | 68 | 7 | 0.60 | 0.12 | 0.0200 | 0.0022 | 0.009 | 0.002 | 0.2 | 0.1 | 7.80E−07 | 1.3E−07 | 0.56 | 0.10 |
| YC13-1-A14 | 72 | 8 | 0.50 | 0.12 | 0.0220 | 0.0025 | 0.015 | 0.003 | 0.3 | 0.1 | 2.76E−07 | 4.8E−08 | 0.20 | 0.03 |
| DF13-2-A1 | 11 | 1 | 0.26 | 0.06 | 0.0110 | 0.0011 | 0.016 | 0.003 | 7.8 | 2.6 | 5.88E−08 | 1.3E−08 | 0.04 | 0.01 |
| DF13-2-A3 | 13 | 2 | 0.33 | 0.07 | 0.0110 | 0.0013 | 0.020 | 0.005 | 10.1 | 3.5 | 6.38E−08 | 1.4E−08 | 0.05 | 0.01 |
| DF13-2-A4 | 11 | 1 | 0.39 | 0.08 | 0.0160 | 0.0018 | 0.018 | 0.004 | 1.1 | 0.4 | 7.32E−08 | 1.7E−08 | 0.05 | 0.01 |
| DF13-2-A5 | 13 | 1 | 0.32 | 0.07 | 0.0096 | 0.0010 | 0.013 | 0.003 | 5.7 | 2.0 | 6.56E−08 | 1.5E−08 | 0.05 | 0.01 |
| DF13-2-A6 | 13 | 1 | 0.41 | 0.09 | 0.0150 | 0.0018 | 0.023 | 0.005 | 3.8 | 1.3 | 6.85E−08 | 1.5E−08 | 0.05 | 0.01 |
| DF13-2-A7 | 14 | 2 | 0.45 | 0.11 | 0.0210 | 0.0025 | 0.026 | 0.006 | 3.0 | 0.9 | 7.01E−08 | 1.6E−08 | 0.05 | 0.01 |
| DF13-2-B3 | 14 | 1 | 0.35 | 0.08 | 0.0120 | 0.0014 | 0.021 | 0.005 | 8.6 | 2.6 | 3.31E−08 | 7.9E−09 | 0.02 | 0.01 |
| DF13-2-B4 | 14 | 2 | 0.33 | 0.08 | 0.0110 | 0.0012 | 0.016 | 0.004 | 7.2 | 2.4 | 6.82E−08 | 1.6E−08 | 0.05 | 0.01 |
| DF13-2-B6 | 15 | 2 | 0.30 | 0.06 | 0.0110 | 0.0013 | 0.017 | 0.004 | 3.3 | 1.1 | 3.89E−08 | 9.1E−09 | 0.03 | 0.01 |
| DF13-2-B9 | 14 | 1 | 0.33 | 0.08 | 0.0120 | 0.0013 | 0.019 | 0.004 | 3.9 | 1.2 | 4.05E−08 | 9.6E−09 | 0.03 | 0.01 |
| DF13-2-B12 | 13 | 2 | 0.32 | 0.08 | 0.0120 | 0.0013 | 0.016 | 0.004 | 2.7 | 0.9 | 3.40E−08 | 7.6E−09 | 0.02 | 0.01 |
| DF13-2-B13 | 14 | 2 | 0.38 | 0.08 | 0.0130 | 0.0014 | 0.016 | 0.003 | 1.4 | 0.4 | 4.49E−08 | 9.0E−09 | 0.03 | 0.01 |
| DF13-2-B14 | 15 | 2 | 0.34 | 0.07 | 0.0120 | 0.0012 | 0.020 | 0.004 | 3.2 | 1.1 | 4.19E−08 | 9.6E−09 | 0.03 | 0.01 |
| DF13-2-B17 | 13 | 1 | 0.33 | 0.08 | 0.0110 | 0.0011 | 0.018 | 0.004 | 3.1 | 1.0 | 6.67E−08 | 1.5E−08 | 0.05 | 0.01 |
| DF13-2-B19 | 13 | 2 | 0.42 | 0.09 | 0.0140 | 0.0015 | 0.016 | 0.004 | 1.4 | 0.5 | 5.22E−08 | 1.1E−08 | 0.04 | 0.01 |
| *Air | 1.14 | 8.7 | 1.40E-06 |
| Well | 20Ne/22Ne | err(2σ) | 21Ne/22Ne | err(2σ) | 40Ar/36Ar | err(2σ) | 38Ar/36Ar | err(2σ) | 80Kr/84Kr | err(2σ) | 82Kr/84Kr | err(2σ) | Mantel-derived He(%)** | |
|---|---|---|---|---|---|---|---|---|---|---|---|---|---|---|
| YC13-1-A1 | 9.6 | 0.4 | 0.028 | 0.002 | 304 | 13 | 0.191 | 0.018 | 0.043 | 0.005 | 0.21 | 0.02 | 8.35 | |
| YC13-1-A3 | 9.8 | 0.5 | 0.028 | 0.002 | 321 | 15 | 0.191 | 0.017 | 0.040 | 0.004 | 0.21 | 0.02 | 8.83 | |
| YC13-1-A4 | 9.8 | 0.4 | 0.027 | 0.002 | 306 | 15 | 0.185 | 0.015 | 0.044 | 0.004 | 0.21 | 0.02 | 8.04 | |
| YC13-1-A8 | 9.8 | 0.4 | 0.028 | 0.002 | 322 | 15 | 0.185 | 0.018 | 0.045 | 0.005 | 0.21 | 0.02 | 7.57 | |
| YC13-1-A9 | 9.9 | 0.4 | 0.030 | 0.003 | 302 | 13 | 0.187 | 0.016 | 0.043 | 0.005 | 0.21 | 0.02 | 6.64 | |
| YC13-1-A12 | 9.9 | 0.5 | 0.029 | 0.003 | 312 | 15 | 0.173 | 0.017 | 0.042 | 0.004 | 0.21 | 0.02 | 3.68 | |
| YC13-1-A13 | 10.3 | 0.5 | 0.029 | 0.003 | 310 | 13 | 0.189 | 0.017 | 0.041 | 0.005 | 0.21 | 0.02 | 5.97 | |
| YC13-1-A14 | 10.1 | 0.4 | 0.028 | 0.002 | 315 | 14 | 0.182 | 0.016 | 0.044 | 0.005 | 0.21 | 0.02 | 1.96 | |
| DF13-2-A1 | 10.1 | 0.5 | 0.033 | 0.004 | 327 | 16 | 0.189 | 0.018 | 0.043 | 0.005 | 0.21 | 0.02 | 0.23 | |
| DF13-2-A3 | 10.0 | 0.4 | 0.032 | 0.003 | 326 | 16 | 0.183 | 0.018 | 0.044 | 0.005 | 0.21 | 0.02 | 0.27 | |
| DF13-2-A4 | 10.2 | 0.5 | 0.030 | 0.002 | 317 | 14 | 0.187 | 0.015 | 0.043 | 0.005 | 0.21 | 0.02 | 0.34 | |
| DF13-2-A5 | 10.0 | 0.4 | 0.030 | 0.003 | 330 | 16 | 0.187 | 0.019 | 0.042 | 0.005 | 0.21 | 0.02 | 0.28 | |
| DF13-2-A6 | 10.0 | 0.5 | 0.028 | 0.003 | 317 | 14 | 0.183 | 0.018 | 0.044 | 0.004 | 0.21 | 0.02 | 0.31 | |
| DF13-2-A7 | 9.8 | 0.5 | 0.028 | 0.002 | 313 | 14 | 0.185 | 0.018 | 0.044 | 0.005 | 0.21 | 0.02 | 0.32 | |
| DF13-2-B3 | 9.9 | 0.4 | 0.030 | 0.002 | 328 | 15 | 0.183 | 0.015 | 0.044 | 0.005 | 0.20 | 0.02 | 0.02 | |
| DF13-2-B4 | 9.9 | 0.5 | 0.029 | 0.003 | 331 | 14 | 0.186 | 0.018 | 0.044 | 0.005 | 0.21 | 0.02 | 0.30 | |
| DF13-2-B6 | 9.7 | 0.5 | 0.029 | 0.003 | 336 | 15 | 0.184 | 0.017 | 0.043 | 0.005 | 0.20 | 0.02 | 0.07 | |
| DF13-2-B9 | 9.9 | 0.5 | 0.032 | 0.003 | 331 | 14 | 0.183 | 0.018 | 0.041 | 0.004 | 0.21 | 0.02 | 0.08 | |
| DF13-2-B12 | 9.9 | 0.5 | 0.028 | 0.003 | 328 | 16 | 0.186 | 0.016 | 0.043 | 0.005 | 0.21 | 0.02 | 0.03 | |
| DF13-2-B13 | 9.9 | 0.4 | 0.028 | 0.003 | 327 | 16 | 0.185 | 0.017 | 0.044 | 0.005 | 0.21 | 0.02 | 0.12 | |
| DF13-2-B14 | 9.9 | 0.4 | 0.027 | 0.002 | 329 | 15 | 0.182 | 0.017 | 0.045 | 0.005 | 0.21 | 0.02 | 0.09 | |
| DF13-2-B17 | 9.9 | 0.4 | 0.029 | 0.003 | 329 | 14 | 0.185 | 0.017 | 0.043 | 0.005 | 0.21 | 0.02 | 0.29 | |
| DF13-2-B19 | 10.0 | 0.5 | 0.029 | 0.002 | 322 | 13 | 0.182 | 0.018 | 0.046 | 0.005 | 0.22 | 0.02 | 0.18 | |
| *Air | 9.81 | 0.029 | 295.5 | 0.188 | 0.202 | |||||||||
*Data from Ozima and Podosek (2002).
**Mantle helium proportion (%) = (3He/4He)sample − (3He/4He)crustal/(3He/4He)mantle − (3He/4He)crustal.
Fig. 3.
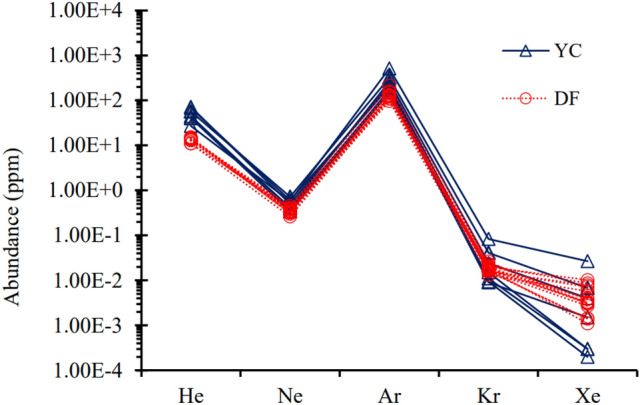
Diagram showing rare gas concentrations for the gas samples collected from DF13-2 and YC13-1 gas fields. The abundance of light rare gases (He, Ne, Ar) is much higher than that of heavy rare gases (Kr, Xe), and the abundance of heavy rare gas components significantly decreases with increasing molecular weight.
Isotope ratios and origins of rare gases
Noble gas isotope ratios and associated errors are reported in Table 2.
Helium (He)
Helium concentrations range from 11 to 72 ppm, and are significantly lower in samples from DF13-2 field, compared to those from YC13-1field (Fig. 4). 4He/20Ne ratios are 35–162 for all samples, which by comparison with the atmospheric 4He/20Ne ratio (0.318), shows that atmospheric helium contributions are negligible. Therefore, 3He/4He ratios can be thought of as 2-endmember mixing between crustal radiogenic helium and small contributions of 3He-enriched mantle helium. The ratio for atmospheric helium (Ra) is 1.40 × 10⁻⁶, and the 3He/4He ratio for sub-continental lithospheric mantle helium (Rm) is 6.1Ra17,18, while crustal radiogenic helium has an average 3He/4He ratio (Rc) of around 3 × 10−819. The 3He/4He ratios for YC13-1 gases range from 9.82 × 10⁻⁷ to 1.04 × 10⁻⁶ (R/Ra = 0.2–0.81). Using a mixing model of crustal and mantel-derived origins, the mantle helium contributions are calculated to be up to 1.96–8.83% for YC13-1 dataset, while 3He/4He values of samples from DF13-2 field fall within the typical crustal origin area (Fig. 4). The distribution of mantle helium is detailed further in the following section.
Fig. 4.
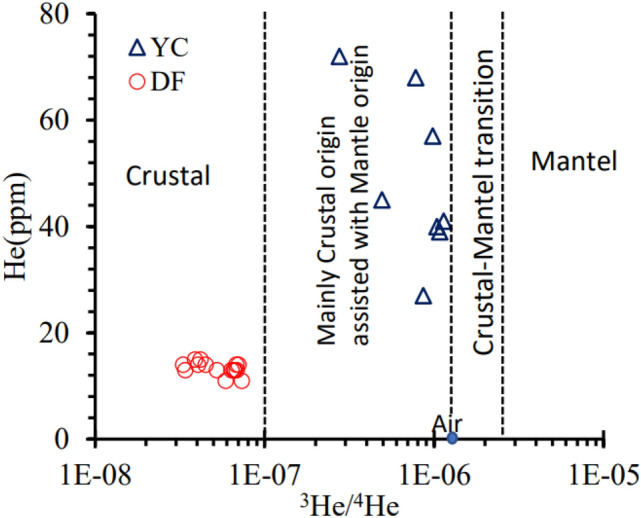
Plot of He content vs 3He/4He in gases, showing a small and distinct difference between DF13-2 and YC13-1 gas fields. Sample areas are denoted by colour, and different fields by marker shape. He concentrations are significantly lower of samples from DF13-2 field, compared to those from YC13-1field. The 3He/4He values of DF13-2 gases fall within the typical crustal origin area, while 3He/4He ratios for YC13-1 gases range from 9.82 × 10⁻⁷ to 1.04 × 10⁻⁶ (R/Ra = 0.2–0.81), and mantle helium contributions are calculated to be up to 1.96–8.83% for the YC13-1 dataset. The elevated amounts of mantle-derived 3He may come from mantle-enriched groundwater circulating in the petroleum system.
Neon (Ne)
For most samples, Neon isotope ratios (20Ne/22Ne and 21Ne/22Ne) show an excess of the radiogenically-produced 20Ne and 22Ne relative to air (Fig. 5), for which atmospheric 20Ne/22Ne = 9.81, 21Ne/22Ne = 0.02920. The 20Ne/22Ne ratios of these gases are in the range of 9.6–10.3 (Table 2), and lower than that (12.221) of mantle-derived Neon. The Neon concentrations of YC13-1 samples range from 0.34 to 0.72 ppm, and are slightly higher relative to the DF13-2 samples (0.26–0.45 ppm). This positive relationship between Ne concentrations and helium isotope ratios/He concentrations is also observed in these gas samples (Table 2), which is likely due to resolvable contributions of mantle-sourced noble gases in YC13-1 gases.
Fig. 5.

Cross plot of 21Ne/22N vs. 20Ne/22Ne values for the gas samples collected from the DF13-2 and YC13-1 gas fields. Sample areas are denoted by colour, and different fields by marker shape. For most samples, Neon isotope ratios (20Ne/22Ne and 21Ne/22Ne) show an excess of the radiogenically-produced 20Ne and 22Ne relative to air, for which atmospheric 20Ne/22Ne = 9.81, 21Ne/22Ne = 0.029 20.
Argon (Ar)
Argon isotope ratios (40Ar/36Ar) in DF13-2 and YC13-1 gases range from 306 to 332 and show an excess of radiogenically-produced 40Ar (Fig. 6), compared with the air ratio of 295.522. However, the 40Ar/36Ar ratios of the samples are much lower than mantle-sourced 40Ar/36Ar values (1000–44,000,23,24). Argon abundances show higher in YC13-1 samples (0.017–0.051%), and lower in DF13-2 samples (0.0096–0.016%) (Fig. 6; Table 2). As 36Ar is atmosphere-derived isotope introduced primarily through groundwater infiltration13, the observed difference likely implies that DF13-2 and YC 13-1 natural gases are derived from different petroleum systems.
Fig. 6.
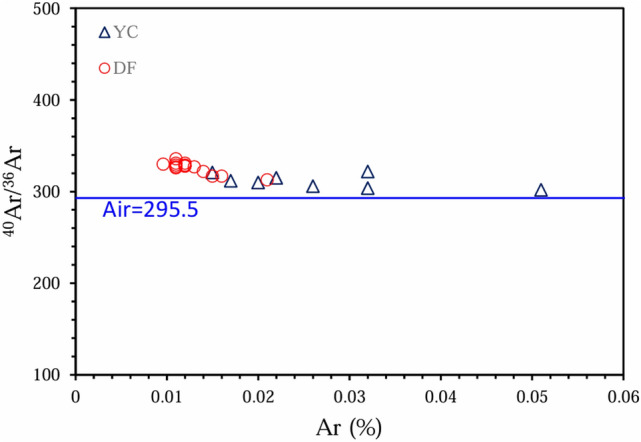
Cross plot of 40Ar/36Ar vs. Ar concentrationsfor the gas samples collected from the DF13-2 and YC13-1 gas fields. Sample areas are denoted by colour, and different fields by marker shape. Atmospheric ratio is 295.522. Values in excess of atmospheric ratio are due to contribution of radiogenic 40Ar produced by 40K decay within the crust. Argon abundance is slightly higher in YC13-1 samples (0.017-0.051%), and lower in DF13-2 samples (0.0096–0.016%). As atmosphere-derived 36Ar is introduced into natural gas accumulations by interaction with groundwater during hydrocarbon generation and migration14, the observed difference likely reflects DF13-2 and YC 13-1 natural gases are derived from different petroleum systems.
Krypton (Kr) and Xenon (Xe)
The 80Kr/84Kr values in these natural gases range from 0.040 to 0.046, and 82Kr/84Kr from 0.20 to 0.21. Obviously, Krypton isotope ratios in all samples are indistinguishable from air. While fissiogenic production of Kr does occur in subsurface, it is at exceedingly low rates and only observed in extremely old, isolated samples25,26. 84Kr and 130Xe abundances observed in some other petroleum systems27,28 are enriched relative to Ar when compared to air values, and this excess Kr and Xe may be derived from the organic-rich shales themselves27,29. The Kr and Xe abundances of these samples range from 0.009 to 0.083 ppm and 0.3 to 26.6 ppb, respectively (Table 2), and the relationship of Kr and Xe abundances with the organic matter type of source rocks remains unclear in the studied samples.
Origin of bulk gases
Based on the following chemical and isotopic characteristics, we suggest that bulk gases in DF13-2 and YC13-1 fields originates from geographically separate petroleum systems. The bulk gases in YC13-1 field were generated from the coal-bearing source rocks in the Yacheng Formation, whereas those in the DF13-2 were likely sourced from the Miocene marine shales.
Gas–source correlation for hydrocarbon gases
(1) Isotopes of hydrocarbon compounds
According to the relationship of δ13C1 values with dryness coefficients, the hydrocarbon gases of all samples show thermogenic origin with a relatively high maturity (Fig. 7). Isotope values of hydrocarbon compounds are consistent with a thermogenic origin, with δ13C1 ranging from − 40.7 to − 35.0‰, and δDCH4 from − 158.3 to − 132.6‰. Both ranges are consistent with a thermogenic origin of methane rather than any contribution from biogenic sources30. These gases have relatively large δ13C2 values of − 27.0 to − 25.4‰, indicating that they likely were derived from humic organic matter5,31. As shown in the plot of δ13C1 vs. δ13C2 values, these samples fall within the area of coal-type gas in Chinese basins (Fig. 8). The relatively heavy δDCH4 values may be due to the formation of their source rocks in a brackish water environment31.
Fig. 7.
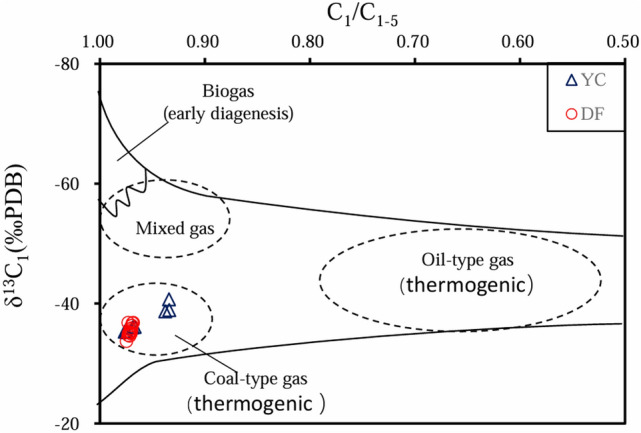
Cross plot of δ13C1‰ values vs. C1/C1–5 for the gas samples collected from DF13-2 and YC13-1 gas fields. Sample areas are denoted by colour, and different fields by marker shape. The boundary lines are modified from32. The δ13C1 values of these gases range from − 40.7 to 35.0‰, with dryness coefficients (C1/C1–5) of 0.94–0.97, exhibiting a bulk composition typical for thermogenic gas. The δ13C1 values of YC13-1 gases (− 40.7‰ to − 35.3‰) are slightly lighter than those of DF13-2 gases (− 36.8 to − 33.7‰), suggesting a slightly higher thermal maturity for DF13-2 gases.
Fig. 8.

Cross plot of δ13C1 vs. δ13C2 values for the gas samples collected from the DF13-2 and YC13-1 gas fields. Sample areas are denoted by colour, and different fields by marker shape. The boundary lines between different genetic groups are taken from Xu31. All samples fall within the area of coal-type gas in Chinese basins.
There is a minor difference in isotopic signatures (δ13C1) between the two fields sampled. The δ13C1 values in YC13-1 gases (− 40.7 to − 35.3‰) is slightly lighter than those of DF13-2 gases (− 36.8 to − 33.7‰), suggesting a slightly higher thermal maturity for DF13-2 gases. We can also see the distinct difference in non-hydrocarbon contents between both fields. N2 and CO2 in YC13-1gases range from 1.15 to 2.24% and 2.13 to 6.26%, respectively, whiles DF13-2 natural gas has slightly higher N2 of 8.4 to 9.66%, with a lower content of 0.10 to 0.36% CO2. They are clearly separated into two groups in the plot of N2% vs. CO2% of the natural gases (Fig. 9). This suggests that DF13-2 and YC13-1 gases may originate from different source rocks, respectively, as these organic CO2 and N2 would be co-generated with the thermogenic hydrocarbon gases (as will be further discussed in following section).
Fig. 9.

Plot of N2% vs. CO2% of gases, showing the different groups of DF13-2 gases with YC13-1gases. N2 and CO2 in YC13-1gases range from 1.15 to 2.24% and 2.13 to 6.26%, respectively, whiles DF13-2 natural gas has slightly higher N2 of 8.4 to 9.66%, with a lower content of 0.10 to 0.36% CO2. This suggests that they may originate from different source rocks.
(2) Biomarkers of condensates associated with gases
The condensates associated with YC13-1 gases have relatively high Pr/Ph (Pristane/Phytane) values (5–7), similar to those of the Yacheng Formation source rocks deposited in marine delta/coastal plain3. This is consistent with the reported high Pr/Ph values in oils from terrestrial organic matter in the Tarim Basin33 and in the Gippsland Basin, Australia34. The condensate is characterized by high abundant terrigenous biomarkers such as bicadinaes sourced from dammar resin of gymnosperms35 and oleanane derived from higher land plant36. These diagnostic molecular markers occur commonly in the coal-bearing source facies in the Yacheng Formation in QDN basin, showing a close genetic relationship with the condensate (Fig. 10).
Fig. 10.

Representative m/z 191 and 217 mass fragmentograms showing the different sources of YC13-1 condensate from DF13-2 condensate. W and T = bicadinanes; O = oleanane; Pr/Ph = pristine/phytane; Ts = 18a(H) 22,29,30-trisnor-neohopane; Tm = 17a(H)-22,29,30-trisnorhopane. C27, C28, C29 = 20R_αααC29 sterane. The YC13-1 condensates is characterized by high abundant terrigenous biomarkers such as bicadinanes sourced from dammar resin of gymnosperms35 and oleanane derived from higher land plant36. These diagnostic molecular markers occur commonly in the coal-bearing source facies in the YachengFormation in QDN basin, showing a close genetic relationship with the condensates. The DF13-2 condensate contains abundant terrestrial-derived oleanane but a low abundance of bicadinaes, which correlate well with the Miocene (Meishan Formation) neritic shales in the YGH Basin.
In contrast, the condensates associated with DF13-2 have much lower Pr/Ph values of 3–4 with a low abundance of bicadinanes and a high content of oleanane, which are obviously different from the YC13-1 condensate and Yacheng Formation coal-bearing source rocks (Fig. 10). In the mass fragmentograms of m/z 217, the content of C29 sterane (20R) is greater than that of C27 sterane (20R) with a C27/C29 ratio of 0.57 based on peak area. The C27 regular sterane is generally related with lower aquatic alga, while the C29 regular sterane is the biomarker derived from terrestrial organic matters36. The genetic characteristics of the condensate correlate well with the Miocene (Meishan Formation) neritic shales in the YGH Basin (Fig. 10). The Miocene source rocks have a predominant Type II2-III of keregen, with a total organic carbon (TOC) content ranging from 0.4 to 2.97%12. The current burial depth is approximately between 3500 and 6500 m, and based on measured vitrinite reflectance (Ro) combined with thermal history simulation results, their Ro is estimated to be between 1.1% and 3.0% (Fig. 11). The main gas generation period should be during the rapid thermal subsidence stage in the Pliocene to Quaternary12, providing abundant gas resources for the accumulation of DF13-2 gas field.
Fig. 11.
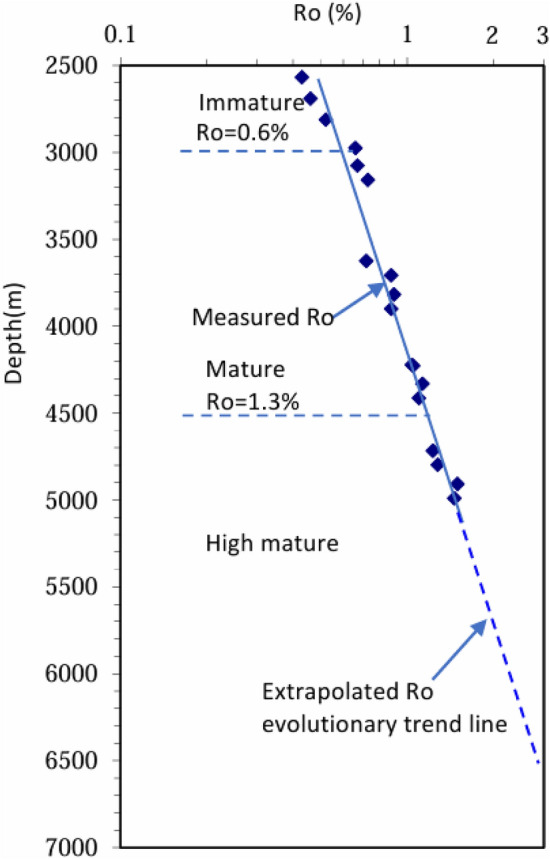
Cross plot of measured Ro values vs depths for DL30-1 well. The well location is shown in Fig. 1a. The current burial depth of the Miocene source rocks is approximately between 3500 and 6500 m and their Ro is estimated to be between 1.1 and 3.0%. The main gas generation period should be during the rapid thermal subsidence stage in the Pliocene to Quaternary12.
Origin of non-hydrocarbon gas (CO2 and N2)
(1) Origin of carbon dioxide (CO2)
Non-hydrocarbon gases from DF13-2 and YC13-1 fields are present in small amounts, with CO2 concentrations up to 6.26% and N2 up to 9.66%. Carbon isotope values of CO2 range from − 10.8 to − 6.9‰, falling outside the accepted range of mantle CO2 values (− 6.0 to − 3.5‰37). They are quite different from the mantle-derived CO2 gas in the nearby Peral Mouth basin38 (Fig. 12). This makes it unlikely that there is any significant contribution of mantle CO2 in the total gases currently in the reservoirs of the fields. In addition, there is a small difference of CO2 concentrations between the two fields. DF13-2 gas has a very low CO2 content (0.10–0.36%) with δ13Cco2 values in the range of − 6.9 to − 9.2‰, while YC13-1 gas demonstrates a slightly high CO2 content (2.13–6.26%) with δ13Cco2 values ranging from − 7.5 to − 10.8‰. The characteristics indicate that these CO2 gases are a primarily organic origin (Fig. 12), while the observed difference of CO2 contents in the DF13-2 and YC13-1gases can be attributed to the contributions from different organic matter in Meishan formation shale and Yacheng Formation coal-bearing source rocks, respectively.
Fig. 12.
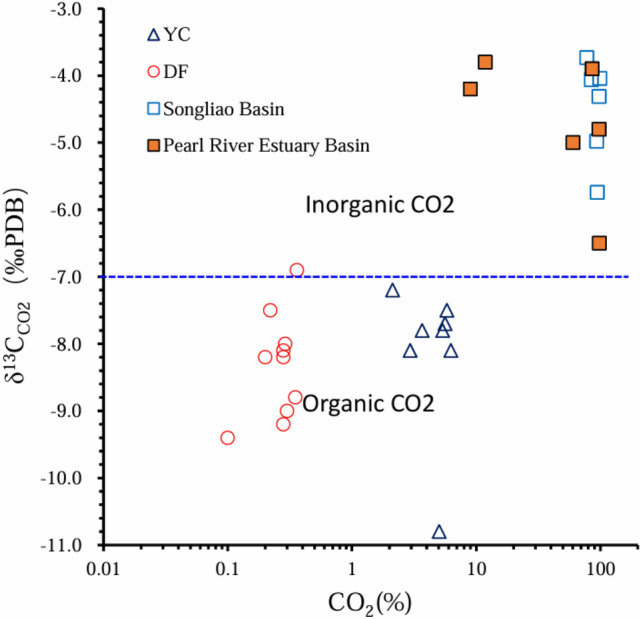
Plot of CO2 (%) vs δ13CCO2(‰) of natural gases from DF13-2 and YC13-1 gas fields. Sample areas are denoted by colour, and different fields by marker shape. Carbon isotope values of CO2 range from − 10.8 to − 6.9‰, falling outside the accepted range of mantle CO2 values (− 6.0 to − 3.5‰,37) and indicating a primarily organic origin. They are quite different from the mantle-derived CO2 gas in the nearby Peral Mouth basin38. This makes it unlikely that there is any significant contribution of mantle CO2 in the total gases currently in the reservoirs of the fields. In addition, DF13-2 gases contain an extremely low CO2 content (0.10–0.36%), while YC13-1 gases have a slightly high CO2 concentration (2.13–6.26%). The observed difference of CO2 contents in the two fields likely reflects contributions from different source-rock organic matters.
(2) Origin of nitrogen (N2)
DF13-2 gases contain a relatively high N2 content of 8.4% to 9.77%, with δ15N values of − 5.6 to − 5.4‰, which are similar to the δ15N values of natural gas generated from organic matter in the LD gas field (− 9 to − 4‰)11, but significantly lower than the δ15N value (δ15N = 0‰,39 in the atmosphere. Although the nitrogen isotopic composition has a complicated origin, more negative δ15N values (− 15 to − 1‰) are usually associated with organic-derived gases40. This suggests that there would be co-generation for both the thermogenic hydrocarbon gases and nitrogen gases in the DF13-2 gas field.
Compared to DF13-2 gases, YC13-1 gases derived from Yacheng Formation coal-bearing strata have a lower N2 content, and the δ15N2 value is slightly larger, ranging from − 2.2 to − 1.3‰ (Fig. 13). One possible explanation for the observed differences is that coal usually contains fewer amino compounds and trends to generate ammonia at low thermal evolution stage and then convert it into nitrogen under oxidative conditions. Since most early-generated nitrogen can be easily absorbed by coal, the available liberated free nitrogen is relatively low. The nitrogenous heterocycles in coal can generate some nitrogen only through cracking at post maturation stage (Ro > 3.0%41). Therefore, lower nitrogen content is normally expected from coal-derived gases than from humic-rich mudstone derived gases when the source rocks have not reached around 3.0%Ro, which further supports our interpretation on the origin of DF 13-2 and YC13-1 gases.
Fig. 13.
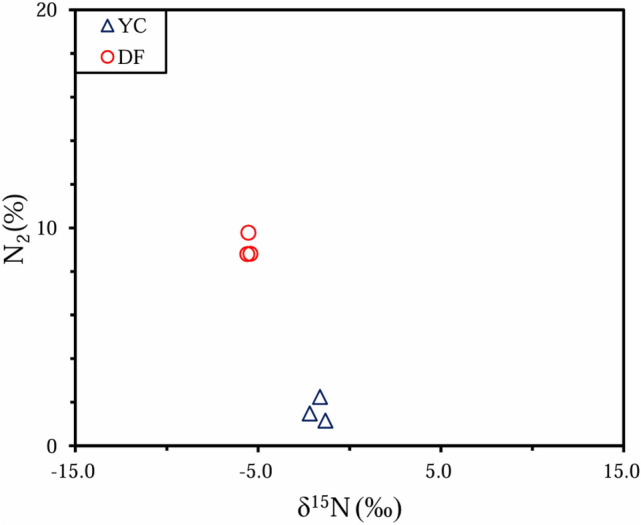
Nitrogen isotope values and concentrations of the gases from the DF13-2 and YC13-1 gas fields. The relatively negative δ15N values of − 5.6 to − 1.3‰, suggesting an organic origin. Compared to DF13-2 gases sourced from Middle-Lower Miocene mudstones, YC13-1 gases derived from Yacheng Formation coal-bearing strata have a lower N2 content, and the δ15N2 value is slightly larger, ranging from − 2.2 to − 1.3‰. One possible explanation for the observed differences is that the nitrogenous heterocycles in coal can generate some nitrogen only through cracking at post maturation stage (Ro > 3.0%41). Therefore, lower nitrogen content is normally expected from coal-derived gases than from humic-rich mudstone derived gases when the source rocks have not reached around 3.0%Ro.
Origin of bulk gas from noble gas perspective
As mentioned above, YC13-1 gases possess relatively high He contents (27–72 ppm), with 3He/4He ratio of 9.82 × 10⁻⁷ to 1.14 × 10⁻⁶, and mantle helium contributions are calculated to be up to 2–9% for this dataset. The elevated amounts of mantle-derived 3He may reflect mixing between a pristine source-rock signature and an endmember characterized by elevated 3He/4He, likely representative of mantle-enriched groundwater circulating in the petroleum system13. The No. 1 fault adjacent to the YC13-1 field could serve as a crucial conduit for the up-migration of a small amount of mantle-derived fluid. Previous research indicates that the fault is a boundary fault between the YGH Basin and the QDN Basin, stretching approximately 190 km in a NW–NNW trend. As it cuts through the pre-Cenozoic and extends upward into the upper-middle Miocene1,2, the elevated 3He amounts in YC13-1 field can be attributed to the influx of mantle helium along the fault over timescales of millions of years. In contrast, the 3He/4He ratios of DF13-2 gases ranges between 3.31 and 7.72 × 10⁻⁸ (Fig. 4), indicating that helium in these gases is mainly derived from the decay of crustal radioactive elements, e.g., U and Th, which may be representative of the original source rock signature. This suggests that the DF diapir did not develop active deep fractures or faults connecting to the mantle (Table 2).
Furthermore, there is a minor difference in Ar abundances between the two fields sampled. The Ar abundance in YC13-1 samples is slightly higher, ranging from 0.017 to 0.051%, while it is lower in DF13-2 samples, ranging from 0.0096 to 0.016%. The 40Ar/36Ar ratios of theses samples range from 306 to 332 and the values exceeding the atmospheric ratio are due to contribution of radiogenic 40Ar produced by 40 K decay within the crust. Given that atmosphere-derived 36Ar is introduced into natural gas accumulations by interaction with groundwater during hydrocarbon generation and migration13, the difference may imply DF13-2 and YC 13-1 natural gases originate from different petroleum systems or source-rocks (the Meishan formation mudstones and the Yacheng Formation coal-bearing strata, respectively). This further corroborates our interpretation of the gas-sources based on the bulk gas signatures and condensate biomarkers.
Gas accumulation patterns and exploration implications
DF13-2 gas field
DF13-2 gas field is located on the western and southwestern wings of DF1-1 diapiric structure in the YGH Basin (Fig. 14a). It is composed of multiple sand bodies in the upper-middle Miocene Huangliu Formation, forming a lithologic gas reservoir (Fig. 14a). The gas reservoirs are under high-temperature and overpressure conditions, with a geothermal gradient of 4.68 °C/100 m and pressure coefficients ranging from 1.68 to 1.82.
Fig. 14.

(a) Gas migration pathways and accumulation model of DF13-2 gas field. The gas payzones are Upper Miocene marine sandstones, and the cap layers consist of local mudstones and thick mudstones in the upper Huangliu Formation. The gases primarily originate from the deep source rocks of Middle-Lower Miocene. Diapiric fractures provide key conduits for the upward migration of gases. (b) Gas migration pathways and accumulation model of YC13-1 gas field. The gas payzones are Oligocene –Lower Miocene marine sandstones, and the overpressure mudstones of the middle Miocene Meishan Formation form an excellent-effective cap rock. The gas primarily originates from the coal-bearing source rocks of the Yacheng Formation developed in the Yanan sag of QDN basin. Unconformities and faults serve as important conduits for lateral and vertical migration of gases, leading to near-source gas accumulation.
The reservoir rocks are fine sandstones in the first member of the Huangliu Formation (HL1) at a depth of 2900–3200 m, which were deposited in multiple submarine fans between continental shelf and outer shelf environments. The porosity of the sandstone cores ranges from 6.37 to 21.50% with an average of 17.30%, and permeability from 0.05 to 345.0 × 10⁻³μm2 with an average of average of 49.31 × 10⁻³μm2. The cap layers consist of local mudstones and thick mudstones in the upper Huangliu Formation.
As mentioned above, the gases primarily originate from the deep source rocks of Middle-Lower Miocene. Diapiric fractures provide key conduits for the upward migration of gases (Fig. 14a). The deep abnormal overpressure and buoyancy act as significant driving forces. This migration-accumulation pattern suggest that the pressure transition zone in the flank of the diapiric structure is a favorable site for natural gas accumulation.
YC13-1 gas field
The YC13-1 gas field is situated in the upthrown block of the No. 1 fault in QDN Basin (Fig. 14a). It is a northwest–southeast trending half anticline (13.5 km long and 5.5 km wide, with a structural closure of about 420 m), and there are complex stratigraphic—lithologic traps on the limb. The gas reservoirs exhibit a unified gas/water interface and temperature system, with an average temperature of 174.4 °C, a geothermal gradient of 4.0 °C/100 m, and a pressure coefficient of 1.05.
The reservoir rocks mainly consist of the Oligocene LS3 (the third member of the Lingshui Formation), LS2 (the second member of the Lingshui Formation) and the Lower Miocene SY (Sanya Formation) sandstones. Among them, The LS3 is the main reservoir rocks deposited in a braid river dominated deltaic setting. The porosity of these sandstones ranges from 11 to 21% (with an average of 14.8%), and permeability from 10 × 10−3 to 1152.4 × 10−3 µm2 (with an average of 80 × 10−3 µm2). The LS2 reservoir rock, located in the limb, is composed of fine-grain sandstones in a tidal influenced nearshore environment. The SY reservoir rock is present only on the eastern limb. It consists of siltstones and fine-grain sandstones, deposited along shoreline to shallow open marine environment. The overpressure mudstones of the middle Miocene Meishan Formation form an excellent-effective cap rock.
The gas source primarily comes from the coal-bearing source rocks of the Yacheng Formation developed in the Yanan sag of QDN basin. Unconformities and faults serve as important conduits for lateral and vertical migration, resulting in near-source gas accumulation (Fig. 14b). This suggests that short-distance migration and source facies control the distribution of natural gases in the QDN Basin.
Conclusions
This study presents rare and bulk gas data for natural gases sampled from the DF13-2 and YC13-1 gas fields in the Ying-Qiong Basins.
Natural gases from the two gas fields are composed primarily of methane (87–91%) with dryness coefficients of 0.94–0.97, and isotope ratios of hydrocarbon compounds exhibit a thermogenic origin, with δ13C1 ranging from − 40.7 to − 33.7‰, and δ13C2 from − 27.0 to − 25.4‰. Non-hydrocarbon gases are present in much smaller amounts, with CO2 concentrations up to 6.26% and N2 up to 9.66%. Carbon isotope values of CO2 range from − 10.8 to − 6.9‰, and δ15N values from − 5.6 to − 1.3‰, suggesting a primarily organic origin. There is co-generation for both thermogenic hydrocarbon gases and non-hydrocarbon gases in these gases.
DF13-2 gases have slightly larger δ13C1 values (− 36.8 to − 33.7‰), relative to YC13-1 gases (− 40.7 to − 35.2‰), suggesting a slightly higher thermal maturity in DF13-2 field. The gases possess relatively high N2 and low CO2 amounts. He concentrations are relatively low with 3He/4He ratios ranging from 3.31 × 10⁻⁸ to 7.72 × 10⁻⁸, indicating a typical crustal origin, likely representative of pristine source-rock signatures. The associated condensate contains abundant terrestrial-derived oleanane but low abundances of bicadinanes. These characteristics correlate well with the Miocene neritic shales in YGH Basin. In contrast, δ13C1 values of YC13-1 gases are slightly smaller. The gases have lower N2 (1.15–2.24%) but higher CO2 contents (2.13–6.26%). The 3He/4He ratios of 9.82 × 10⁻⁷ to 1.14 × 10⁻⁶, and mantle helium contributions are calculated to be up to 2–9% for this dataset. The elevated amounts of mantle-derived 3He may come from mantle-enriched groundwater circulating in the petroleum system. The coexisted condensate is rich in terrestrial biomarkers (such as oleanane and bicadinane), which displays different biomarker signatures from DF13-2 condensate, and has a close affinity with the coal-bearing source rocks of the Oligocene Yacheng Formation. The results of this study clearly demonstrate that the natural gases in DF13-2 and YC13-1 fields originate from two distinct petroleum systems. This research offers new perspectives on the origin and accumulation model of natural gases in YGH and QDN Basins, which is of great significance for further understanding the hydrocarbon exploration potential in these basins.
Acknowledgements
We would like to thank Liwu Li and Chunhui Cao from Oil and Gas Research Center, Northwest Institute of Eco-Evironment and Resources, CAS, for rare gas content and isotope analysis. We also thank the two anonymous reviewers and the responsible editor for their constructive comments. This research was supported by National Key R & D Program of China (2021YFC2800900) and Gansu Province Science and Technology Program (22JR5RA045).
Author contributions
Huang Qianfeng: Conceptualization, Methodology, Formal analysis, Software, Validation, Writing – original draft. Lyu Chengfu: Funding acquisition, Methodology, Formal analysis, Investigation, Software, Writing – review & editing. Pang Weixin: Investigation, Resources, Writing – review & editing. Wu Tao: Investigation, Resources, Writing – review & editing. Li Qianzhe: Investigation, Resources. Xiao Yueye: Conceptualization, Investigation.
Data availability
The data that support the findings of this study are available on request from the corresponding author.
Competing interests
The authors declare no competing interests.
Footnotes
Publisher’s note
Springer Nature remains neutral with regard to jurisdictional claims in published maps and institutional affiliations.
References
- 1.Gong, Z. & Li, S. Continental Margin Basin Analysis and Hydrocarbon Accumulation of the Northern South China Sea (Science Press, 1997). [Google Scholar]
- 2.Zhu, W. L., Zhang, G. C. & Yang, S. K. Natural Gas Geology in the Northern Continental Margin Basin of South China Sea (Petroleum Industry Press, 2007). [Google Scholar]
- 3.Zhu, W. L. et al. Geochemistry, origin and deep-water exploration potential of natural gases in the Pearl River mouth and Qiongdongnan basins, south China sea. AAPG Bull.93, 741–761 (2009). [Google Scholar]
- 4.Zhu, W. L., Shi, H. S., Huang, B. J., Zhong, K. & Huang, Y. W. Geology and geochemistry of large gas fields in the deepwater areas, continental margin basins of northern South China Sea. Mar. Pet. Geol.126(2021), 104901 (2021). [Google Scholar]
- 5.Dai, J. X. et al. China’s Large-Scale Fields and Their Gas Origins (Science Press, 2024). [Google Scholar]
- 6.Zhang, Q. M. & Zhang, Q. X. Evidence for primary migration of condensate by molecular solution in aqueous phase in the Yacheng field, offshore South China. J. SE Asian Earth Sci.5, 101–107 (1991). [Google Scholar]
- 7.Hao, F., Li, S. T., Sun, Y. C. & Zhang, Q. M. Geology, compositional heterogeneities and geochemical origin of the Yacheng Gas Field in the Qiongdongnan basin, South China Sea. Bull. Am. Assoc. Petrol. Geol.82, 1372–1384 (1998). [Google Scholar]
- 8.Chen, H., Li, S., Sun, Y. & Zhang, Q. Charging of the YC13-1 gas field from two petroleum systems in the Yinggehai and Qiongdongnan basins, South China Sea. Bull. Am. Assoc. Petrol. Geol.82, 757–772 (1998). [Google Scholar]
- 9.Huang, B. J., Xiao, X. M. & Dong, W. L. Migration and diapir structures in the Dongfang gas field, South China Sea. Mar. Pet. Geol.19, 861–872 (2002). [Google Scholar]
- 10.Zhang, Q. M. & Hu, Z. L. Hot, geopressured Yinnggehai—Qiongdongnan basins and their hydrocarbon migration. China Offshore Oil Gas Geol.6, 1–10 (1992) ((in Chinese)). [Google Scholar]
- 11.Xiao, X. M. et al. Determination of the source area of the Ya13-1 gas pool in the Qiongdongnan Basin, South China Sea. Organ. Geochem.37, 990–1002 (2006). [Google Scholar]
- 12.Huang, B. J., Xiao, X. M. & Hu, Z. L. Geochemistry and episodic accumulation of natural gases from the Ledong gas field in the Yinggehai Basin, offshore South China Sea. Org. Geochem.36, 1689–1702 (2005). [Google Scholar]
- 13.Huang, B. J., Huang, H. T., Li, L. & Wang, L. F. Characteristics of marine source rocks and effect of high temperature and overpressure to organic matter maturation in Yinggehai–Qiongdongnan basins. Marine Origin Petrol. Geol.15(3), 11–18 (2010) ((in Chinese)). [Google Scholar]
- 14.Byrne, D. J., Barry, P. H., Lawson, M. & Ballentine, C. J. The use of noble gas isotopes to constrain subsurface fluid flow and hydrocarbon migration in the East Texas Basin. Geochim. Cosmochim. Acta268, 186–208 (2020). [Google Scholar]
- 15.Wang, X. et al. Accumulation mechanism of mantle-derived helium resources in petroliferous basins, eastern China. Sci. China Earth Sci.65(12), 2322–2334 (2022). [Google Scholar]
- 16.Chunhui, C. et al. Tracing the sources and evolution processes of shale gas by coupling stable (C, H) and noble gas isotopic compositions: Cases from Weiyuan and Changning in Sichuan Basin, China. J. Nat. Gas Sci. Eng.78(2020), 103304 (2020). [Google Scholar]
- 17.Gautheron, C. & Moreira, M. Helium signature of the subcontinental lithospheric mantle. Earth Planet. Sci. Lett.199, 39–47 (2002). [Google Scholar]
- 18.Day, J. M. D. et al. The helium flux from the continents and ubiquity of low-3He/4He recycled crust and lithosphere. Geochim. Cosmochim. Acta153, 116–133 (2015). [Google Scholar]
- 19.Poreda, R. J. et al. Mantle helium in Sacramento basin natural gas wells. Geochimica et Cosmochimica Acta50(12), 2847–2853 (1986). [Google Scholar]
- 20.Porcelli, D., Ballentine, C. J. & Wieler, R. An overview of noble gas geochemistry and cosmochemistry. Rev. Mineral. Geochem.47, 1–19 (2002). [Google Scholar]
- 21.Ballentine, C. J., Marty, B. & Sherwood, L. B. Cassidy M. Neon isotopes constrain convection and volatile origin in the Earth’s mantle. Nature433, 33–38 (2005). [DOI] [PubMed] [Google Scholar]
- 22.Ozima, M. & Podosek, F. A. Noble Gas Geochemistry 2nd edn. (Cambridge University Press, 2002). [Google Scholar]
- 23.Burnard, P., Graham, D. & Turner, G. Vesicle-specific noble gas analyses of “popping rock”: implications for primordial noble gases in earth. Science276, 568–571 (1997). [DOI] [PubMed] [Google Scholar]
- 24.Moreira, M., Kunz, J. & Allegre, C. Rare gas systematics in popping rock: isotopic and elemental compositions in the upper mantle. Science279(5354), 1178–1181 (1998). [DOI] [PubMed] [Google Scholar]
- 25.Holland, G. et al. Deep fracture fluids isolated in the crust since the Precambrian era. Nature497, 357–360 (2013). [DOI] [PubMed] [Google Scholar]
- 26.Heard, A. W. et al. South African crustal fracture fluids preserve paleometeoric water signatures for up to tens of millions of years. Chem. Geol.493, 379–395 (2018). [Google Scholar]
- 27.Zhou, Z., Ballentine, C. J., Kipfer, R., Schoell, M. & Thibodeaux, S. Noble gas tracing of groundwater/coalbed methane interaction in the San Juan Basin, USA. Geochim. Cosmochim. Acta69, 5413–5428 (2005). [Google Scholar]
- 28.Barry, P. H., Lawson, M., Meurer, W. P., Cheng, A. & Ballentine, C. J. Noble gases in deepwater oils of the U.S. Gulf of Mexico. Geochem. Geophys. Geosyst.19, 4218–4235 (2018). [Google Scholar]
- 29.Marrocchi, Y. & Marty, B. Experimental determination of the xenon isotopic fractionation during adsorption. Geophys. Res. Lett.40, 4165–4170 (2013). [Google Scholar]
- 30.Rice, D. D. Relation of natural gas composition to thermal maturity and source rock type in San Juan Basin, Northwestern New Mexico and Southwestern Colorado. AAPG Bull.67, 1199–1218 (1983). [Google Scholar]
- 31.Xu, Y. C. & Shen, P. A study of natural gas origins in China. AAPG Bull.80, 1604–1614 (1996). [Google Scholar]
- 32.Tissot, B. P. & Welte, D. H. Petroleum Formation and Occurrence 2nd edn. (Springer, 1984). [Google Scholar]
- 33.Li, M. et al. Organic geochemistry of oils and condensates in the Kekeya field, Southwest Depression of the Tarim Basin (China). Organ. Geochem.30, 15–37 (1999). [Google Scholar]
- 34.Philp, R. P. & Gilbert, T. D. Biomarker distribution in Australian oils predominantly derived from terrigenous source material. Organ. Geochem.10, 73–84 (1986). [Google Scholar]
- 35.van Aarssen, B. G. K., Zhang, Q. & de Leeuw, J. W. Anunusual distribution of bicadinanes, tricadinanes and oliocadinanes in sediments from the Yacheng Gasfield, China. Organ. Geochem.18, 805–812 (1992). [Google Scholar]
- 36.Peters, K. E., Walters, C. C. & Moldowan, J. M. The Biomarker Guide 2nd edn, 1155 (Cambridge University Press, 2005). [Google Scholar]
- 37.Coltice, N., Simon, L. & Lecuyer, C. Carbon isotope cycle and mantle structure—art. no. L05603. Geophys. Res. Lett.31(5), 66 (2004). [Google Scholar]
- 38.Huang, B. J. et al. Origin and accumulation of CO2 and its natural displacement of oils in the continental margin basins, northern South China Sea. AAPG Bull.99(7), 1349–1369 (2015). [Google Scholar]
- 39.Li, J. et al. Geochemical characteristics and N2 source of nitrogen riched natural gas in Tarim Basin. Acta Petrolei Sinica34(S1), 102–109 (2013). [Google Scholar]
- 40.Stahl, W. J. Carbon and nitrogen isotopes in hydrocarbon research and exploration. Chem. Geol.20, 121–149 (1977). [Google Scholar]
- 41.Littke, R., Krooss, B., Idiz, E. & Frielingsdorf, J. Moleculanitrogen in natural gas accumulation: Generation from sedimentary organic matter at high temperatures. Am. Assoc. Petrol. Geol. Bull.79, 410–430 (1995). [Google Scholar]
Associated Data
This section collects any data citations, data availability statements, or supplementary materials included in this article.
Data Availability Statement
The data that support the findings of this study are available on request from the corresponding author.