

Summary
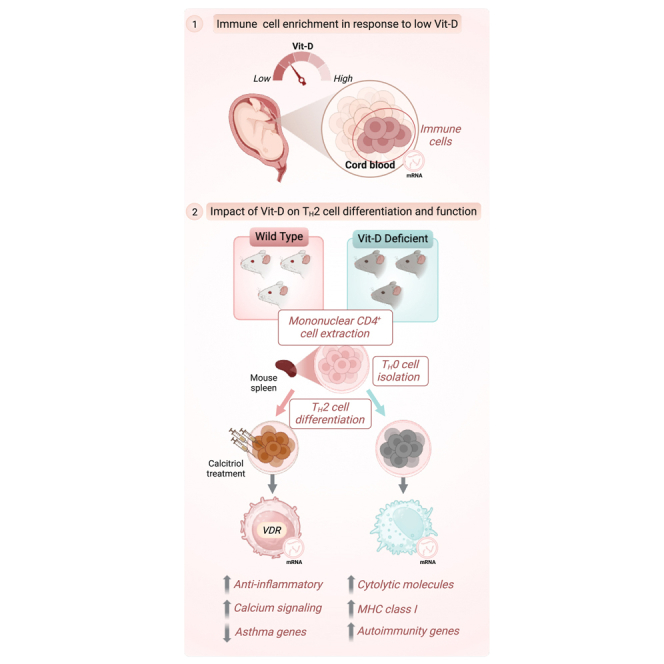
Circulating Vitamin D (Vit-D) has emerged as a potent immune modulator in asthma, yet its direct impact on TH2 cell regulation, the central effectors of allergic inflammation, remains unclear. Preliminary transcriptomic analysis of neonatal cord blood revealed that gestational Vit-D deficiency corresponds to elevated adaptive and innate immune responses, driven by TH2 immunity and antimicrobial responses related to asthma inflammation. To elucidate cell-specific molecular mechanisms of Vit-D, we differentiated murine TH2 cells in vitro under conditions mimicking Vit-D sufficiency and deficiency. Our findings demonstrate that Vit-D exposure promotes intracellular calcium ion homeostasis while suppressing prominent inflammatory cytokines characteristic of asthma. Conversely, Vit-D deficiency reprograms TH2 cell lineage commitment, inducing overexpression of cytolytic molecules and major histocompatibility complex (MHC) class I molecules—traits typically associated with cytotoxicity rather than the canonical helper function. Our findings underscore Vit-D’s role in stabilizing TH2 cell function and fate, offering insights into asthma and autoimmune disorders.
Subject areas: biological sciences, immune response, transcriptomics
Graphical abstract
Highlights
-
•
Vit-D intrinsically modulates TH2 cell transcription, revealing their immune plasticity
-
•
Vit-D deficiency primes neonatal immunity toward a pro-inflammatory TH2 response in utero
-
•
Vit-D supports immune tolerance in TH2 cells through the VDR–CYP24A1–PMCA axis
-
•
Vit-D deficiency shifts TH2 cells to a cytotoxic phenotype with enriched cytolytic markers
Biological sciences; Immune response; Transcriptomics
Introduction
Asthma is a chronic respiratory disorder characterized by airway inflammation, airway hyperresponsiveness, and tissue remodeling.1,2 Compelling epidemiological evidence has established a strong association between Vit-D deficiency and asthma.3,4,5,6,7 Specifically, asthma patients with low serum Vit-D levels are more likely to experience poor control of their asthma, associated with severe symptoms, increased exacerbation risk, and reduced lung function.7,8,9,10,11,12,13 Notably, research investigating the potential effects of Vit-D supplementation on asthma has largely focused on a possible link between prenatal maternal Vit-D status and wheezing or asthma in the offspring.14,15 The collection of cord blood from newborns offers a unique opportunity to study the impact of Vit-D on immune function, as it reflects the prenatal environment and may provide insights into early immune development and disease susceptibility. Studies have highlighted that antenatal Vit-D deficiency in pregnant women could impair development of the neonatal immune system and disrupt fetal lung development, thereby predisposing the offspring to allergies and asthma during childhood.15,16 Recent advancements have shown that Vit-D supplementation can effectively reduce inflammatory markers involved in immune cell differentiation, maturation, and cytokine production implicated in asthma.17,18,19 Improved understanding of the regulatory influence exerted by Vit-D on crucial immune cells linked to asthma has the potential to elucidate its prophylactic role in the management of asthma responses.
Circulating Vit-D is primarily found in two forms: 25-hydroxyvitamin D (calcidiol or 25-Vit-D) and 1,25-dihydroxyvitamin D (calcitriol or 1,25-Vit-D). Clinically, the major circulating metabolite, 25-Vit-D, serves as a reliable indicator of overall Vit-D status due to its stable serum levels and longer half-life of 2–3 weeks.20 It accounts for total Vit-D from all sources, including skin synthesis upon UV exposure, dietary intake, and supplementation. Conversely, 1,25-Vit-D, the active metabolite of Vit-D, plays a critical role in regulating cellular processes, gene expression, and immune responses. The immunomodulatory capabilities of 1,25-Vit-D were first recognized with the discovery of the vitamin D receptor (VDR) expression in various immune cell types, namely, T cells, B cells, monocytes, and antigen-presenting cells (APCs).21 Vitamin D3 (cholecalciferol), a fat-soluble hormone, is predominantly synthesized in the skin upon exposure to ultraviolet B (UVB) light from the sun or obtained from the diet.22 After synthesis, Vitamin D3 is transported to the liver by Vitamin D-binding protein (VDBP), where it is first converted to its circulating form, 25-Vit-D, through the enzymatic activity of cytochrome P450 family 2 subfamily R member 1 (CYP2R1), and subsequently to its active form, 1,25-Vit-D, through renal hydroxylation by CYP27B1 (1α-hydroxylase) enzyme.23
Upon binding to cytosolic or nuclear VDR, 1,25-Vit-D induces conformational changes that activate the receptor. The physiological effects of Vit-D are mediated by activated VDR forming a heterodimer with the retinoid-X receptor (RXR). This complex recruits co-activators and binds to specific genomic regions called vitamin D response elements (VDREs), thereby regulating the transcription of hundreds of downstream target genes.24,25 The resulting gene products participate in various cellular processes, including calcium and phosphorus homeostasis, immune response modulation, and the regulation of cell growth and differentiation.26 Essentially, VDR functions as a transcription factor by regulating the expression of target genes in response to the presence of 1,25-Vit-D. Therefore, elucidating the molecular mechanisms influenced by 1,25-Vit-D in key effector immune cells may offer valuable insights into potential therapeutic targets for asthma.
The precise regulation of 1,25-Vit-D is essential for maintaining appropriate circulating levels and preventing excessive accumulation. After exerting its effects, 1,25-Vit-D decreases its own synthesis by inhibiting the activity of CYP27B1 while simultaneously upregulating cytochrome P450 family 24 subfamily A member 1 (CYP24A1) enzyme through the VDR-RXR complex.27 CYP24A1 plays a key role in maintaining the balance between active and inactive metabolites of Vit-D by catabolizing 1,25-Vit-D into biologically less active metabolites, primarily 24,25-dihydroxyvitamin D and calcitroic acid, facilitating their excretion and thereby regulating Vit-D levels within the body.28 This tight regulation of 1,25-Vit-D prevents excessive activation of 1,25-Vit-D-dependent processes by limiting its availability and attenuating VDR signaling. Elucidating the complex multifactorial interplay between 1,25-Vit-D, VDR, and the enzymes regulated by 1,25-Vit-D endogenously within immune cells provides a promising avenue for unraveling the mechanistic underpinnings of asthma pathogenesis.
While traditionally recognized for its systemic endocrine effects, Vit-D can also be metabolized within activated immune cells, which constitutively express VDR and convert precursor 25-Vit-D to active 1,25-Vit-D locally,29 enabling dynamic modulation of immune responses to adapt to environmental and inflammatory cues. The primary function of VDR signaling in T cells is to maintain immune homeostasis by balancing the production of pro-inflammatory and anti-inflammatory cytokines.30 For instance, VDR signaling has been reported to suppress the production of pro-inflammatory cytokines such as interleukin-17 (IL-17) and interferon-γ (IFN-γ), while promoting production of anti-inflammatory cytokines, including IL-10 and FOXP3.31,32 These cytokines promote differentiation of regulatory T cells (T-regs) critical for immune tolerance. Additionally, VDR signaling inhibits the activation of nuclear factor κB (NF-κB) pathway, which is involved in the production of pro-inflammatory cytokines such as tumor necrosis factor alpha (TNF-α), IL-6, IL-1, and IL-8.33 In TH1 cells, Vit-D regulates the production of the anti-inflammatory co-receptor CTLA4 and the Vit-D-inactivating enzyme CYP24A1, while also downregulating pro-inflammatory cytokines such as IFN-γ, IL-17A, IL-17F, IL-22, and IL-26.34 Moreover, VDR also regulates genes involved in antimicrobial activity such as CD14 and cathelicidin anti-microbial peptide (CAMP) in monocytes.35 In macrophages, Vit-D exerts an anti-inflammatory effect by inhibiting pro-inflammatory cytokines (IL-1β, IL-6, TNF-α, and cyclooxygenase-2 (COX-2)) and promoting the production of the anti-inflammatory cytokine IL-10.36 Furthermore, Vit-D is associated with decreased neutrophils and reduced NETosis response in autoimmune diseases.37 Notably, VDR signaling serves as a potential mechanism by which Vit-D contributes to preventing autoimmune diseases.38,39 Nevertheless, the intracrine synthesis and effects of 1,25-Vit-D on TH2 cell function remain unknown. The pleiotropic role of Vit-D in the immune system is becoming increasingly evident, and understanding the 1,25-Vit-D/VDR axis in TH2 cells could prove instrumental in understanding inflammatory responses in asthma.
Driven by the hypothesis that maternal Vit-D status is a critical determinant of neonatal immune function and asthma susceptibility, we first investigated the transcriptomic profiles of cord blood obtained from the neonates born to mothers with varying prenatal Vit-D status who participated in the Vit-D Antenatal Asthma Reduction Trial (VDAART). Our findings revealed that maternal Vit-D deficiency during pregnancy disrupts neonatal immune programming, transcriptionally activating pro-inflammatory and TH2-associated pathways. Building on these systemic insights, we assessed direct, cell-intrinsic effects of Vit-D on TH2 cells by culturing CD4+ mononuclear cells and differentiating them in vitro under conditions simulating Vit-D sufficiency (calcitriol stimulation) and deficiency (using cells from mice maintained on a Vit-D-depleted diet in a UV-free environment). By integrating differential expression (DE) analysis, pathway enrichment analysis, and discrete dynamical modeling, we uncovered the critical, multifaceted autocrine role of Vit-D in regulating TH2 cell function and identity—an aspect of immune regulation that has not been previously addressed. These findings offer novel insights into the regulatory capacity of Vit-D in immune cell lineage commitment and its potential implications for TH2 cell-driven diseases, such as asthma.
Results
Gestational Vit-D status regulates immune responses in neonatal cord blood profiles from the VDAART cohort
To investigate the relationship between maternal Vit-D status during pregnancy and neonatal immune responses, we analyzed transcriptomic data from cord blood samples collected at birth in the VDAART cohort (Table S1). The VDAART trial is a randomized, double-blind, placebo-controlled clinical study designed to evaluate the effects of prenatal Vit-D supplementation on asthma susceptibility in offspring (STAR Methods).40 Pregnant participants enrolled during early pregnancy received either a daily Vit-D dosage of 4000 IU (100 g/day) or a placebo, along with a multivitamin containing a basal Vit-D dosage of 400 IU (10 g/day). To capture the cumulative gestational effects of maternal Vit-D status on neonatal programming, we analyzed physiological Vit-D levels at three critical time points—early pregnancy (10–18 weeks), late pregnancy (32–38 weeks), and at birth (cord blood). Early pregnancy measurements serve as a baseline for fetal exposure to maternal Vit-D levels during foundational stages of fetal immune programming, whereas late pregnancy and cord blood levels more accurately reflect fetal Vit-D status at birth due to the progressive increase in placental transfer efficiency throughout gestation.41 By measuring Vit-D at these time points, our approach integrates early programming effects and cumulative maternal-fetal Vit-D transfer.42
We analyzed 192 cord blood profiles from samples that met inclusion criteria for consistent physiological Vit-D levels across three key time points—early pregnancy, late pregnancy, and at birth—ensuring the analysis reflected physiological Vit-D status rather than supplementation group assignments. To isolate profiles specifically influenced by Vit-D, we applied unsupervised K-means clustering to the normalized expression profiles of 201 unique VDR signaling genes (from AmiGO 2 and WikiPathways databases) to delineate two distinct groups: Cluster 1 and Cluster 2 (STAR Methods, Figure 1A). This approach aimed to identify molecular profiles reflecting receptor-mediated biological effects of Vit-D while minimizing potential confounding influences, such as pregnancy-related factors (e.g., hormonal fluctuations, placental physiology, and maternal-fetal nutrient transfer), immune activation unrelated to Vit-D, genetic variability, environmental exposures, and other endocrine or nutritional effects. These clusters included profiles with Vit-D levels ranging from very low (< 10 ng/mL) to high (> 50 ng/mL) yet showed no distinct association with VDR signaling. Applying a 25 ng/mL cutoff (indicative of moderate Vit-D deficiency)43 across three time points, we identified a low Vit-D group (< 25 ng/mL, N = 62) and a high Vit-D group (≥ 25 ng/mL, N = 35), with mean levels of 11.93 ng/mL and 37.06 ng/mL, respectively. These classifications align with established thresholds for low (< 20 ng/mL) and high (> 30 ng/mL) Vit-D status. This approach provides insight into the physiological extremes of Vit-D status that are clinically actionable in the context of immune programming and asthma risk.
Figure 1.

Cord blood transcriptomic patterns associated with gestational Vit-D status in the VDAART cohort
(A) Overview of the analysis workflow, depicting RNA-seq data collection from 192 cord blood samples, followed by clustering of 201 VDR signaling genes, and subsequent subsetting into groups based on Vit-D status.
(B) Heatmap showing normalized expression of differentially expressed genes in cord blood from the high Vit-D group compared to the low Vit-D group. Gene expression is standardized as a Z-score (−2 to +2) to show relative upregulation (red), downregulation (blue), and average expression (white). Differential expression analysis was conducted using the limma package with a moderated t-test, applying an FDR < 0.05 (Benjamini-Hochberg correction) and FC > 1.5 for significance.
(C) Boxplot displaying normalized gene expression of three key representative differentially expressed VDR signaling genes (VDR, THBD, and CD14) associated with Vit-D status in high and low Vit-D groups (∗∗∗∗).
DE analysis of the high Vit-D group with respect to the low Vit-D group identified upregulation of 145 genes and downregulation of 594 genes at a false discovery rate (FDR) of 0.05 and fold change (FC) cutoff of 1.5-fold (Figure 1B, Table S2). Notably, the VDR gene itself and prominent VDR target genes such as THBD and CD14 were differentially expressed (Figure 1C). Other noteworthy differentially expressed VDR target genes, such as CEBPA, CAMP, ITGAM, LRRC25, MXD1, KLF4, S100A4, S100A6, S100A9, SERPINB1, and SLC8A1, also showed significant differences in expression (Figure S1). Thus, our clustering analysis identified a targeted subset of 97 profiles for downstream analysis, where Vit-D status during pregnancy is associated with genes involved in VDR signaling in neonates.
To identify specific biological processes associated with changes in Vit-D levels, we performed an overrepresentation test on Gene Ontology (GO) annotations44 for biological processe (BP), cellular component (CC), and molecular function (MF) () (STAR Methods, Table S3). Enrichment analysis revealed Vit-D modulation primarily affects transcriptional regulation of immune responses, with upregulated differentially expressed genes (DEGs) in the high Vit-D group localized to the T cell receptor (TCR) complex (), a critical component in the development of adaptive immunity (Table S3). Genes encoding TCR variable segments, such as TRAV8-3, TRAV9-2, TRBV10-3, and TRAV13-1 genes, as well as joining segments, including TRAJ3, TRAJ5, TRAJ6, TRAJ12, TRAJ14, and TRAJ22, were among those identified. These segments are crucial for TCR assembly and the development of a versatile T cell repertoire, which enables the recognition and elimination of a broad spectrum of antigens.45,46
Conversely, the downregulated DEGs exhibited a complex transcriptional response, with GO BP enrichment highlighting two functional themes, namely immune effector processes and cellular migration (Figure 2). The top enriched immune effector BPs—inflammatory response (), myeloid leukocyte activation (), regulation of cytokine production (), and response to bacterium ()—shared genes with sub-processes involved in production of various pro-inflammatory cytokines (IL-1, IL-1β, IL-6, IL-8, IL-10, IL-12, IFN-γ, and TNF), which are known to regulate T cell activity in asthma (Table S3).47 Additionally, pathways related to T cell enrichment included T cell-mediated immunity () and T cell activation (). Notably, we observed enrichment of type 2 immune response-related processes, including T-helper 2 cell differentiation (), type 2 immune response (), and regulation of type 2 immune response () (Table S3). The type 2 immune response pathways mapped to cell surface markers CD86, CCR2, and the pattern recognition receptor NOD2, as well as transcription factors NLRP3, HLX, BLC6, and BCL3.
Figure 2.

Enrichment of inflammatory pathways associated with gestational Vit-D deficiency in the cord blood profiles of VDAART cohort
Network representation of GO enrichment for BP (bottom), CC (top left), and MF (top right) annotations, where each node represents a GO term corresponding to an enriched biological pathway, cellular component, and molecular function, respectively. The node size corresponds to number of genes annotated per node, and color corresponds to the adjusted −log10FDR. Edges between nodes indicate the presence of common DE genes annotated to both nodes. For GO CC and MF annotations, edges are shown when there is at least a 10% overlap in DE genes between both nodes. Due to a larger network size in GO BP annotations compared to GO CC and MF annotations, nodes with −log10FDR ≥ 5 and edges with ≥ 25% overlapping genes are displayed for GO BP annotations. Statistical significance was evaluated using the enrichGO function in clusterProfiler, with significance determined at FDR < 0.01 (hypergeometric test with Benjamini-Hochberg correction applied).
A subset of enriched immune effector pathways consisted of antimicrobial activity processes, including defense response to bacterium (), positive regulation of defense response (), response to molecule of bacterial origin (), response to lipopolysaccharide (LPS) (), phagocytosis (), detection of biotic stimulus (), and antimicrobial humoral response (). These processes mapped to cell surface receptor family genes, such as toll-like receptors (TLR1, TLR2, TLR4, TLR5, TLR8), the pattern recognition receptor NOD2, and IFN-γ receptors (IFNGR1, IFNGR2). Moreover, inflammasome-activated genes, such as IL1RAP, IL18R1, IL18RAP, NLRP3, NLRC4, PYCARD, NAIP, AIM2, and CASP5, as well as LPS-binding genes, including BPI, CAMP, CD14, and RNASE3, also mapped to the enriched biological processes. The GO MF analysis identified these genes as being associated with NAD+ and NADP+ nucleosidase activity, which are crucial cofactors in redox reactions that modulate immune responses by regulating oxidative stress, inflammation, and cellular metabolism.48
Additionally, GO MF analysis (Figure 2, Table S3) identified enrichment of cell surface receptor activity, which is important for recognition and response to extracellular signals. Enriched functions included transmembrane signaling receptor activity (), signaling receptor regulator activity (), receptor ligand activity (), signaling receptor activator activity (), carbohydrate binding (), immune receptor activity (), and pattern recognition receptor activity (). The signaling receptor activity and immune receptor activity were associated with cell surface receptors, such as CXCR1, CXCR2, CCR1, and CCR2, as well as members of LILR (leukocyte immunoglobulin-like receptor) family genes including LILRA2, LILRA5, LILRB3, and LILRB4. The carbohydrate-binding MF was attributed to pattern recognition receptors that are essential for pathogen identification. These receptors included genes encoding C-type lectin domain family proteins, such as CLEC10A, CLEC12A, CLEC12B, CLEC1B, CLEC4D, CLEC4E, CLEC5A, and CLEC6A.
The BPs related to cell migration highlighted enrichment of humoral immune response processes associated with chemotaxis (), taxis (), myeloid leukocyte migration (), leukocyte migration (), neutrophil migration (), and granulocyte migration (). These processes mapped to genes associated with neutrophil migration including ITGAM, CD33, CD177, GRN, BST1, PF4, PPBP, RHOG, PRKCD, CSF2RA, VEGFA, and FUT7, as well as C3AR1 and C5AR2 receptors that activate neutrophils in response to complement activation as the first line of defense.49 Furthermore, the upregulation of neutrophil cytosolic factors NCF1, NCF2, and NCF4 was also observed. These factors constitute subunits of NADPH oxidase, an enzyme responsible for producing reactive oxygen species in neutrophils.50
Consistent with these processes, GO CC enrichment analysis (Figure 2, Table S3) revealed that the downregulated DEGs were localized to the lumen and membrane of secretory granules involved in neutrophil maturation, namely azurophil and ficolin-1-rich granules. Azurophil granules mapped to genes involved in killing and digesting engulfed microorganisms, such as AZU1, BPI, LYZ, CEACAM6, CEACAM8, RNASE3, CD63, STX3, and VNN1. Similarly, ficolin-1 rich granules mapped to immune regulation genes, such as FCN1, FCAR, CST3, CDA, GAA, GYG1, MNDA, PGAM1, and SERPINB10, as well as cathepsin family genes (CTSS and CTSH) and SLC family genes (SLC11A1 and SLC2A3). These genes play a crucial role in the innate immune response by recognizing and binding to pathogen-associated molecular patterns on the surface of invading microorganisms. Collectively, GO BP and CC analyses support the involvement of downregulated genes in an innate immune phagocytic response mediated through neutrophils.
The complex transcriptional patterns in DEGs were further examined for specific canonical pathways underlying the observed genomic response using Kyoto Encyclopedia of Genes and Genomes (KEGG) database51 (STAR Methods), revealing 11 significant pathways (), 8 of which were associated with innate and adaptive immune responses (Figure S2). Notably, neutrophil extracellular trap formation (), phagosome (), TNF signaling (), and C-type lectin receptor signaling () were consistent with the findings from GO enrichment analysis.
In conclusion, our cord blood DE analysis demonstrates that Vit-D deficiency results in upregulation of immune processes associated with TH2 adaptive responses, antimicrobial humoral responses, and neutrophilic innate responses. These findings suggest that maintaining adequate Vit-D levels during pregnancy may influence the neonatal immune transcriptome, potentially affecting immune function at birth.
Vitamin D stimulation promotes calcium homeostasis and induces anti-inflammatory response in TH2 cells
Building on the enrichment of TH2 cells observed in the low Vit-D group of the VDAART cohort, we explored the cell-autonomous effects of Vit-D on TH2 cells by stimulating them with calcitriol, the active Vit-D metabolite, which acts as a potent VDR agonist. Splenic CD4+ T cells from wild-type (WT) BALB/c mice (N = 11) were differentiated into TH2 cells in vitro while being exposed to calcitriol, then compared to unstimulated controls (Figure 3A, STAR Methods). DE analysis revealed overexpression of 470 genes and repression of 441 genes in calcitriol-stimulated TH2 cells (FC > 1.5, FDR < 0.01) (Figure 3B, Table S4). Our analysis illustrated local modulation of various asthma-related genes within TH2 cells after calcitriol exposure, underscoring its direct regulatory role in immune function (Figure 3C).
Figure 3.

Calcitriol stimulation reprograms TH2 cells by modulating transcriptional pathways involved in calcium homeostasis and inflammation
(A) Experimental schematic showing in vitro differentiation of naïve CD4+ T cells into TH2 cells, followed by calcitriol stimulation. Splenic CD4+ T cells were isolated from BALB/c mice and cultured with TH2 polarization cocktail, with or without the active Vit-D metabolite, calcitriol, to investigate the transcriptional effects of Vit-D signaling.
(B) Heatmap showing normalized gene expression of differentially expressed genes in calcitriol-stimulated TH2 cells compared to WT TH2 cells. The heatmap represents standardized Z-scores per gene across samples, ranging from −2 to 2. Differential expression was analyzed using the limma package, which calculates p-values with an empirical Bayes-moderated t-test. Significance is determined at FDR < 0.05 (Benjamini-Hochberg correction) and FC > 1.5.
(C) Volcano plot showing significant DEGs in response to Vit-D stimulation. Dashed lines indicate the statistical thresholds for significance (FDR < 0.05 and FC > 1.5).
(D) Radial plot showing GO BP annotations enriched among significantly upregulated genes in Vit-D stimulated TH2 cells.
(E) Radial plot showing GO BP annotations enriched among significantly downregulated genes in Vit-D-stimulated TH2 cells. In (D–E), radial height represents fold enrichment, color scale represents −log10FDR, with significant terms defined at FDR < 0.05 using enrichGO in clusterProfiler (hypergeometric test with Benjamini-Hochberg correction), and circle size reflects the number of genes annotated per biological process.
(F) Asthma pathway, adapted from the KEGG pathways database (hsa05310), annotated to show downregulation of prominent asthma-related cytokines following Vit-D exposure. KEGG pathway enrichment was performed using enrichKEGG from clusterProfiler, with significant terms defined at FDR < 0.05 (hypergeometric test with BH correction).
To identify the specific biological processes associated with Vit-D exposure, we conducted GO BP enrichment analysis on the upregulated and downregulated genes in the calcitriol-stimulated TH2 cells (Table S5). Among the upregulated genes, we identified three predominant categories of enriched pathways: (1) regulation of cellular and cytosolic calcium homeostasis, (2) blood circulation and response to wounding, and (3) negative regulation of cytokine production (Figure 3D). Complementary to this, the downregulated genes highlighted a decreased immune response through enriched processes associated with positive regulation of inflammatory response, including IFN-α and IFN-γ production, as well as myeloid leukocyte differentiation and migration (Figure 3E). Additionally, sodium ion transport genes were observed to be downregulated in TH2 cells following Vit-D exposure, suggesting a role in modulating electrolyte balance and stabilizing cellular excitability, thereby reducing TH2 cell hyperactivation.
Pathways associated with calcium homeostasis included regulation of cytosolic calcium ion concentration (), cellular calcium ion homeostasis (), cellular divalent inorganic cation homeostasis (), calcium ion homeostasis (), and regulation of calcium ion transport (). DEGs annotated to calcium homeostasis comprised genes implicated in calcium channel regulator activity, including Hpcal4, Calm1, Tspan13, Gem, and Rrad, as well as genes involved in calcium ion transport, such as Atp2b1, Gna15, Tbxa2r, Ramp1, Pik3cg, Cracr2a, Cacna2d4, Ptgs2, Ubash3b, and Kel. Furthermore, we observed upregulation of genes encoding chemokine receptors associated with calcium signaling, namely Cxcr1, Ccr1, Ccr2, and Ccr5, as well as cell adhesion and communication molecules, including Itga1, Cd24a, Akap6, Ptprj, P2ry2, Lat2, Dmpk, Synpo, and Nmb. Conversely, we observed downregulation of sodium ion transport genes, including solute carrier family member genes (Slc4a7, Slc9a5, Slc9b2, Slc6a9, and Slc13a3) and ion transport-related genes (Plcb1, Nkain1, Sik1, P2rx7, Per1, Klhl3, Stom, Atp4a, and Fgf11). The resting membrane potential of cells is primarily maintained by the reciprocal balance of sodium (Na+) and potassium (K+) ion concentrations across the cell membrane.52
Calcium ions also play a crucial role in wound healing by activating several coagulation factors within the circulatory system.53 The upregulated processes related to blood circulation after calcitriol stimulation included blood circulation (), regulation of blood circulation (), and circulatory system process () (Figure 3D). Additionally, the processes related to the wound healing response corresponded to GO terms, including response to wounding (), positive regulation of cell-cell adhesion (), coagulation (), and hemostasis () (Table S5) among the top enriched processes. Genes associated with blood circulatory processes and wound healing included cell adhesion genes Ets1, Adam8, Adam19, Itgal, Jak2, Dpp4, Pik3r6, Ripor2, Sema3e, Chst2, Bmp7, and Sox4; coagulation and hemostasis genes such as Fgg, F2rl1, F2r, Entpd1, Fbln1, Fgl2, Hc, and Tgm2; and tissue remodeling genes such as Pla2g4a, Ptgs2, Adam8, Src, Lepr, Epha2, Lgr4, and Rassf2. The activation of cell adhesion processes helps immune cells migrate to the wound site, coagulation factors assist in forming a provisional fibrin matrix that aids tissue repair, and tissue remodeling processes coordinate dynamic changes in the composition and organization of the extracellular matrix to restore the native tissue architecture.54
DEGs annotated to negative regulation of cytokine production () encompassed key genes involved in immune tolerance, including Il-10, Il1r2, Pdcd4, Lilrb4a, Tgfb3, Tnfaip3, Tigit, Cd200r1, Trib2, and Rnf128. Il-10 exerts its anti-inflammatory role in resolving airway inflammation by activating anti-inflammatory T-regs and suppressing pro-inflammatory TH2, TH1, and TH17 cells through the inhibition of IL-1, TNF-, and IFN- cytokines.55,56 Similarly, TGF-β3 plays a role in suppressing effector TH cells and inflammatory cytokines, including IFN-γ, IL-2, and IL-4.57,58 Tigit (T cell immunoreceptor with immunoglobulin and ITIM domains) is an immune checkpoint receptor that directly inhibits T cell effector function via TCR signaling.59,60 Moreover, we observed an upregulation of receptor genes Ctla4 (cytotoxic T-lymphocyte-associated protein 4), Ctla2a, and Ctla2b. These co-receptors function as immune checkpoints by blocking TCR and CD28 interactions with co-stimulatory molecules present on APCs, thereby inhibiting the activation and proliferation of TH cells.61
A complementary response was observed in the biological processes associated with downregulated genes. The downregulated IFN-α- and IFN-γ-related processes mapped to genes encoding interferon-induced transmembrane proteins, such as Ifitm1, Ifitm2, Ifitm3, and Tgtp1, which restrict viral entry into cells. Additionally, several downregulated DEGs were associated with NF-κB signaling, including Tnf, Tnfsf11, Tnfsf10, Eda2r, Rel, Lurap1, Fasl, Ajuba, Irak2, and Plcgotated to NF-κB signaling. Furthermore, genes related to the NLRP3 inflammasome complex, such as Cptp, Eif2ak2, Plcg2, Trim30a, and Il18r1, were also downregulated following Vit-D stimulation in TH2 cells. Notably, prominent pro-inflammatory cytokines, such as Il1r1, Il1r2, Il2, Il3, Il9, Il13, Il18r1, Il22, Tnf, and Csf2, as well as transcription factors Tbx21, Rorc, and Nfkb2, were downregulated in response to calcitriol stimulation. Collectively, Vit-D stimulation promotes an anti-inflammatory transcriptional profile in TH2 cells, characterized by upregulation of anti-inflammatory markers and downregulation of pro-inflammatory gene signatures.
To further refine our understanding of the calcitriol-induced transcriptional changes in TH2 cells, we identified distinct patterns of transcription factor regulation that may contribute to the anti-inflammatory response and immune modulation. The upregulation of transcription factors such as Ikzf3 (Aiolos), Prdm1 (Blimp-1), Foxo4, Smad5, and Maf suggests enhanced regulatory capacity, whereas downregulation of Tbx21 (T-bet), Zbtb32, Fos, Nr4a2, Ikzf2, and Nfkb2 indicates a potential reduction in pro-inflammatory signaling, supporting the reprogramming of TH2 cells toward a more immune-tolerant phenotype.
We further explored the canonical pathway enrichment with KEGG pathway enrichment analysis. Among the 13 significant pathways () (Figure S3), we observed enrichment of asthma-related inflammation pathways, including asthma, NF-κB signaling, viral protein interaction with cytokine and cytokine receptor, TH17 cell differentiation, and cytokine-cytokine receptor interaction pathways. Enrichment of the asthma pathway was driven by downregulation of signature TH2 genes responsible for eosinophil activation, including Il-3, Il-9, Il-13, and TNF-α, and upregulation of anti-inflammatory cytokine Il-10 (Figure 3F). These findings suggest that Vit-D activation may suppress asthma-specific immune dysregulation by reprogramming TH2 pathways.
In conclusion, Vit-D serves a critical function in preserving calcium homeostasis and facilitating wound healing. Particularly in the context of asthma, stimulation with calcitriol confers protective attributes to TH2 cells by promoting anti-inflammatory responses.
Network modeling reveals regulatory dynamics of VDR–CYP24A1–PMCA axis is important for maintaining local calcium homeostasis and anti-inflammatory effects in TH2 cells
Calcitriol stimulation in TH2 cells triggered a localized Vit-D homeostasis response, marked by upregulation of Cyp24a1 and downregulation of Vdr and Rxra (Figure 3C). This finding is particularly noteworthy as it mirrors endocrine Vit-D metabolism at a cellular level, demonstrating the intrinsic capacity of TH2 cells to autonomously regulate VDR signaling and adapt to elevated Vit-D levels. To further investigate the regulatory mechanisms underlying these adaptations, we constructed a comprehensive network of signaling cascades involving VDR, TCR (mmu04660), and calcium (mmu04020) signaling pathways, integrating data from the KEGG pathways and supporting literature62 (STAR Methods, Figure 4A). In this network, nodes represent molecular entities, and directed edges denote causal interactions, reflecting positive or negative biochemical regulation from source pathways.63
Figure 4.

Discrete dynamical modeling of transcriptional regulation in Vit-D-stimulated TH2 cells reveals the regulatory dynamics of the VDR–CYP24A1–PMCA axis
(A) Schematic representation of network depicting pathways influenced by Vit-D stimulation in TH2 cells. Nodes represent molecular entities, and directed edges indicate causal interactions (positive or negative regulation). Created with BioRender.com.
(B–E) Heatmap displaying activity levels of entities within the Vit-D stimulation network under different model input conditions. (B) Baseline activity when Calcitriol is set to inactive (OFF) state. (C) Calcitriol is set to active (ON) and PMCA to inactive (OFF) state. (D). Calcitriol and PMCA are both set to active (ON) state. (E) CYP24A1 and Calcitriol are set to active (ON) state. In (B–E), TCR is set to active (ON) state. Node states were updated iteratively using logical rules (AND, OR, NOT) until a steady state was reached, defined as no further changes in node states. Each simulation was performed over 800 discrete time steps and averaged across 100 iterations to account for the stochasticity of a cell population. X-axis displays pseudo-timescale at an interval of 800 discrete update steps. Activity levels are visualized using a color gradient from blue (low activity) to red (high activity), reflecting relative changes as defined by the simulation rules. These visualizations allow for the analysis of the network’s behavior from initial conditions to a steady state under the influence of Calcitriol, PMCA, and CYP24A1.
We applied discrete dynamic modeling to trace signal propagation within our Vit-D stimulation network (STAR Methods, Table S6), providing insights into how biochemical signals propagate in nonlinear and feedback-driven molecular systems in response to external stimuli, such as calcitriol in our case. This approach abstracts complex biological systems into nodes representing molecular entities in active (ON) or inactive (OFF) states, with transitions governed by Boolean logical rules (AND, OR, NOT) based on upstream interactions. Starting from an initial input state, nodes were asynchronously updated in a random order according to predefined logic rules until a steady state was reached. To account for the stochasticity of a cell population, multiple iterations were executed and averaged to reveal key regulatory nodes and dynamic signaling patterns, serving as abstractions of the real biological system.
As calcitriol and Cyp24a1 exhibit contrasting effects on Vdr signaling, we performed simulations of signal propagation in the Vit-D stimulation network under these two input stimuli. We simulated active T cells by setting TCR (bold font denotes network nodes, and not gene names) to ON in the network model. In this setting, the TCR activation initiated the activation of ZAP-70 kinase, which in turn activated the p38 MAPK pathway and regulated the expression of VDR (Figure 4B). When Calcitriol was set to OFF in our model, the downstream VDRE genes were not activated, even in the presence of VDR. The downstream effects can be seen in the inactivity of nodes regulated by the VDR pathway, such as BLIMP-1, IL-10, and CYP24A1. Simultaneously, when TCR was activated (TCR = ON), ZAP-70 activated phospholipase C-gamma (PLCγ), which catalyzed the hydrolysis of phosphatidylinositol 4,5-bisphosphate (PIP2) into inositol trisphosphate (IP3) and diacylglycerol (DAG). This sequence of reactions triggered the release of calcium (Ca2+) from the endoplasmic reticulum (ER), leading to the activation of protein kinase C (PKC), followed by the activation of calmodulin (CALM1) and calcium/calmodulin-dependent protein kinase II (CaMKII) signaling. Ultimately, this cascade of events led to the activation of downstream transcription factors such as NFAT, NF-κB, and AP-1, critical for TH2 cell function and cytokine production, proportional to the activity of TCR node. Thus, the TCR signaling pathway maintained normal TH2 cell activity in the absence of VDR signaling. This represents the baseline activity of TH2 cell nodes for our network model.
Next, we investigated the effect of Vit-D by activating the Calcitriol node in our model under two distinct scenarios: one with inactive PMCA (Atp2b1) node (Figure 4C) and another with an active PMCA node (Figure 4D). PMCA is a plasma membrane calcium ATPase, which acts as a calcium efflux pump to counteract calcium overload within the cell. When Calcitriol was set to ON in our model, the activated VDR signaling pathway resulted in the activation of downstream VDRE genes—CYP24A1, CTLA4, BLIMP-1, and PLCγ. Notably, the expression of VDR target gene PLCγ led to enhanced IP3 activation, leading to an amplification of intracellular calcium signaling by triggering calcium release from the ER. This, in turn, increased the downstream activation of TH2 cytokines (IL-5, IL-4, IL-2). Simultaneously, the activation of VDR pathway also promoted IL-10 production compared to the baseline (Figure 4B). Furthermore, the expression of CYP24A1 catabolized calcitriol into less active Vit-D metabolites through a feedback mechanism, thereby regulating cytosolic calcium levels following Calcitriol activation. The balance between Calcitriol activity and breakdown ultimately determines the TH2 cytokine production in this state.
However, when PMCA was set to ON, we observed that calcitriol exerted control over calcium signaling by regulating the expression of the PMCA node, which is downstream of VDR. Activation of PMCA facilitated the extrusion of calcium ions, as observed through a decrease in PKC activity through CREB nodes in Figure 4D. This significantly reduced calcium signaling and the consequent activation of pro-inflammatory TH2 cytokines, IL-5, IL-4, and IL-2. Although pro-inflammatory cytokines exhibited decreased activity, VDR-mediated IL-10 maintained a similar activity level compared to the condition when PMCA was OFF (Figure 4C). The balance between VDR signaling and calcium extrusion would determine IL-10 production in this state. This suggests that PMCA activation, facilitated by VDR signaling, may serve as a mechanism for controlling for increased calcium signaling and adaptively managing immune responses in response to an elevated Calcitriol signal.
Next, when CYP24A1 was activated (CYP24A1 = ON) to simulate high activity in response to increased calcitriol signaling (Calcitriol = ON), we noticed a decline in Calcitriol activity and an increase in Vit-D catabolism, as evidenced by the elevated activity of Vit-D metabolites (Figure 4E). This led to a decrease in the activity of VDR pathway components, including PMCA and the system reverted to producing TH2 cytokines, primarily through TCR-mediated signaling, mirroring the conditions observed when Calcitriol was set to OFF (Figure 4B).
In conclusion, our network modeling offers valuable insights into the underlying mechanisms that explain the observed DE patterns following calcitriol stimulation. Vit-D stimulation in TH2 cells can enhance the influx of Ca2+ ions, which serves as a critical second messenger for downstream signaling cascades involved in cytokine production. Cytosolic calcium homeostasis is mediated by two key players: CYP24A1 and PMCA, both of which are regulated by Calcitriol through VDR signaling. CYP24A1 exerts feedback inhibition of calcitriol, whereas PMCA facilitates calcium extrusion. While CYP24A1 shuts down the VDR pathway, PMCA regulates cytosolic Ca2+ levels without compromising the production of VDR-targeted anti-inflammatory cytokines. Taken together, our findings identify the VDR-CYP24A1-PMCA axis as a regulatory pathway associated with calcitriol-stimulated TH2 cells, indicating potential regulatory effects on intrinsic calcium homeostasis and anti-inflammatory gene expression profile.
Vitamin D deficiency skews lineage commitment of TH2 cells toward a cytotoxic phenotype
Our previous findings in the VDAART cohort revealed a correlation between Vit-D deficiency and dysregulated immune responses, particularly TH2-related processes (Figure 2). To directly investigate the intrinsic effects of Vit-D deficiency on TH2 cells, we cultured TH2 cells from a second-generation hypovitaminosis mouse model (N = 7), generated through dietary deprivation of Vit-D and UV-free housing conditions, and compared them to WT control mice maintained on a normal Vit-D diet (N = 3) (STAR Methods, Figure 5A). DE analysis revealed significant transcriptional reprogramming, with 491 upregulated and 395 downregulated genes in Vit-D-deficient TH2 cells compared to WT cells () (Figure 5B, Table S7). Notably, in the absence of 1,25(OH)2D3 stimulus, Vit-D-deficient TH2 cells exhibited downregulation of Vdr and its downstream regulatory targets—Cyp11a1, Cyp1a1, Cyp2s1, Dusp10, Id1, and Il1rl1—indicating diminished priming and activity of Vdr signaling under Vit-D deficiency (Figure 5C).
Figure 5.

Vit-D deficiency drives TH2 transcriptional programming associated with cytotoxicity and immune dysregulation
(A) Experimental protocol for harvesting Vit-D-deficient TH2 cells from mice.
(B) Heatmap showing normalized gene expression of differentially expressed genes in Vit-D-deficient TH2 cells compared to WT TH2 cells. The heatmap represents standardized Z scores per gene across samples, ranging from −2 to 2. Differential expression was analyzed using the limma package, with an empirical Bayes-moderated t-test to calculate p values with significance defined at FDR < 0.05 (Benjamini-Hochberg correction) and FC > 1.5.
(C) Volcano plot displaying differentially expressed Vit-D target genes in Vit-D-deficient TH2 cells with respect to WT TH2 cells.
(D) Radial plot displaying GO BP annotations for significant upregulated processes in Vit-D-deficient TH2 cells. The radial height represents fold enrichment, the color scale represents −log10FDR calculated using the enrichGO function in clusterProfiler (hypergeometric test with Benjamini-Hochberg correction), and circles represent total number of genes annotated per biological process.
(E) Network graph displaying top five GO BPs associated with Vit-D-deficient TH2 cells as hub nodes. The size of each hub node corresponds to the total number of genes associated with the respective BP, and the edges display connections to peripheral nodes representing genes associated with each BP. The color scale of associated genes represents adjusted −log10FDR.
(F) Bar plot showing top enriched GO CC annotations mapped to Vit-D-deficient TH2 cells.
(G) Bar plot showing top enriched GO MF annotations mapped to Vit-D-deficient TH2 cells. Enrichment analysis in (F and G) was performed using enrichGO in clusterProfiler, with significance determined at FDR < 0.05 (hypergeometric test with Benjamini-Hochberg correction).
(H) Lollipop plot displaying statistically significant KEGG pathways that were found to be enriched in DE genes from Vit-D-deficient TH2 cells in mice, with lollipop size indicating the number of genes involved and color gradient showing significance level. KEGG pathway enrichment was conducted using enrichKEGG from clusterProfiler at FDR < 0.01 (hypergeometric test with Benjamini-Hochberg correction).
Upon activation, Vit-D-deficient TH2 cells exhibited upregulation of classical TH2 cytokines IL-3 (), IL-5 (), and IL-13 (), alongside downregulation of CD4 (), an essential co-receptor for TH2 cell activation. Notably, genes encoding Cd8a () and Cd8b1 (), alpha and beta subunits of Cd8 protein complex expressed on cytotoxic T cells, essential for recognition of antigen peptides presented by MHC class I molecules,64 were overexpressed. This observation suggests a hybrid phenotype characterized by an increased CD8-to-CD4 ratio, compared to the WT cells. The targeted isolation and purity assessment of naïve CD4+ T cells in our experimental protocol, coupled with their controlled differentiation into TH2 cells and IL-13 positive selection, ensure that the observed gene expressions are intrinsic to Vit-D deficiency within the TH2 cell lineage, eliminating the possibility of contamination (STAR Methods). The increased expression of CD8 receptor genes indicates a potential cellular adaptation toward a cytotoxic function, enabling direct engagement and destruction of target cells.
GO BP enrichment analysis of Vit-D-deficient TH2 cells revealed no significant processes among downregulated DEGs, whereas upregulated DEGs were enriched for processes related to cell-mediated immunity, cytotoxicity, and killing. Notably, the top enriched processes included cell killing (), natural-killer (NK)-cell-mediated cytotoxicity (), leukocyte-mediated cytotoxicity (), T-cell-mediated cytotoxicity (), and positive regulation of cell killing () (Figure 5D, Table S8). Interestingly, despite culturing only TH2 cells, the enriched processes resembled effector functions of CD8+ CTLs and NK cells. This is a noteworthy observation, considering the fundamental difference in the functional mechanisms of TH2 cells and killer cells. TH2 cells, a subset of helper cells, primarily secrete IL-4, IL-5, and IL-13 cytokines in response to foreign bodies,65 whereas killer cells directly induce cell death by releasing cytotoxic granules upon recognizing specific MHC class I molecules on infected target cells.66
Upregulated genes involved in cell-mediated cytotoxicity encoded key lytic molecules, including granzyme proteases (Gzmb, Gzmc, Gzmd, Gzmf, and Gzmg) and perforin (Prf1), with GO BP enrichment indicating an association with cytolysis () and granzyme-mediated programmed cell death signaling pathway () (Figure 5E; Table S8), highlighting their role in target cell destruction. Similarly, GO CC enrichment analysis (Table S8) identified these genes as localized to cytolytic granules () (Figure 5F), specialized secretory vesicles known to fuse with the plasma membrane of target cells following antigen recognition. The release of granule contents subsequently induces cell death through mechanisms involving pore formation, DNA degradation, and metabolic disruptions.67 Additionally, we observed significant upregulation of genes encoding Serpinb9 and Serpinb9b proteins, primarily expressed on CTLs and NK cells. These proteins serve as inhibitors of granzyme proteases to prevent collateral damage of surrounding healthy tissue during cytotoxic immune responses. Together, these findings suggest that Vit-D deficiency may drive the differentiation of precursor CD4+ T cells toward a killer cell response under TH2 differentiation stimulus through transcriptional regulation of cytotoxic processes.
Apart from cytolytic molecules, Vit-D deficiency induced transcriptional activation of distinct receptors that are uncharacteristic of TH2 cells. Prominent genes encoding MHC class I complex molecules—H2-D1, H2-K1, H2-Q7, H2-T-ps, H2-T10, H2-T3—corresponded to GO BP terms associated with antigen processing and presentation of endogenous peptide to CD8+ T cells, highlighting involvement of adaptive immune responses. Consistently, GO CC analysis localized these molecules to structures critical for antigen presentation, including luminal side of endoplasmic reticulum membrane (), endocytic vesicle membrane (), lumen side of endoplasmic reticulum membrane (), and MHC class I peptide loading complex () (Table S8). These cellular compartments are critical for the processing of intracellular antigens by the proteasome, their transport to the endoplasmic reticulum (ER) by transporter-associated with antigen processing (TAP) protein, and loading onto MHC class I molecules. This antigen presentation mechanism is pivotal for stimulating cytotoxic immune responses upon recognition by CD8+ T cells.
In alignment with these findings, GO MF functional enrichment analysis (Table S8) revealed significant enrichment in antigen-binding processes, including MHC protein binding (), peptide antigen binding (), MHC class I protein binding (), antigen binding (), CD8 receptor binding (), and beta-2-microglobulin binding () (Figure 5G). Beta-2-microglobulin ensures the stability and proper surface expression of MHC class I proteins. These enrichments suggest that Vit-D deficiency enhances the antigen presentation capacity of TH2 cells, reprogramming them toward enhanced antigen presentation and cytotoxic immune responses.
Finally, upregulated genes encoding pattern recognition receptors from the killer cell lectin-like receptor (KLR) family, such as Klra1, Klra13-ps, Klra3, Klra4, Klra7, Klrc1, Klrd1, and Klrk1 suggest the potential acquisition of innate-like capabilities. These receptors, predominantly expressed on NK cells, recognize MHC class I, non-classical MHC class I, or carbohydrate structures, indicating a shift toward cytotoxic and innate immune functions. Furthermore, genes typically associated with CTLs, including Crtam, Csf2, Emp2, Fcer1a, Havcr2, Ifng, Il2, Il6, Il12rb2, Il23a, Lta, Nkg7, Tbx21, and Tnfsf4, were upregulated, along with surface markers such as Ccl27a, Cxcr3, Ccl3, Ccl4, Cd46, Cd80, and Cd59a. Upregulation of tripartite motif (TRIM) family proteins (Trim2, Trim30a, Trim30d, Trim34a, Trim5, and Trim71) involved in antiviral defenses further emphasized this functional diversification. Collectively, these findings suggest that Vit-D deficiency may reprogram TH2 cells to exhibit additional cytotoxic and innate-like immune features, potentially contributing to immune dysregulation. Together, these findings suggest that Vit-D deficiency drives TH2 cells to acquire hybrid characteristics, incorporating elements of innate cytotoxic and antiviral responses.
To better understand transcriptional reprogramming in Vit-D-deficient TH2 cells, we identified upregulated transcription factors such as Tbx21 (T-bet), Ikzf2 (Helios), Klf10, Nupr1, and Prdm16, which align with enriched cytotoxic and inflammatory pathways. In contrast, the downregulation of key transcription factors, including Vdr, Klf2, Epas1, and Id1, highlights diminished regulatory capacity. These transcriptional changes suggest that Vit-D deficiency influences TH2 cells toward a hybrid phenotype characterized by cytotoxic and inflammatory features.
Further, KEGG enrichment analysis revealed 13 canonical pathways (), including six associated with autoimmune disease pathways, such as Graft-vs-host disease (), type 1 diabetes mellitus (), inflammatory bowel disease (), autoimmune thyroid disease (), and rheumatoid arthritis (). These findings indicate that Vit-D deficiency during TH2 cell differentiation may trigger shared molecular pathways implicated in autoimmunity (Figure 5H). Consistent with the GO functional analysis, enriched pathways for NK-cell-mediated cytotoxicity and antigen processing and presentation reinforce the cytotoxic phenotype of Vit-D-deficient TH2 cells.
In summary, our analysis suggests that Vit-D deficiency may modulate the lineage commitment of TH2 cells through transcriptional reprogramming, potentially resulting in acquisition of a cytotoxic phenotype. At the gene expression level, the functional enrichment analysis shows a hybrid phenotype skewed toward cytotoxic pathways, while retaining the expression of classical TH2 cytokines.
Discussion
Our study delineates the nuanced role of Vit-D in immune regulation, with a particular focus on its intracellular impact on TH2 cells—a facet previously overlooked in the broader context of asthma and allergic diseases. Findings from the VDAART cohort underscore the systemic implications of Vit-D on neonatal immunity, whereas in vitro analysis from mouse models provides a complementary, granular view of the cell-specific mechanisms influenced by Vit-D, extending beyond its classical role in calcium homeostasis and bone health. Together, the VDAART and murine TH2 transcriptome analysis converge on a shared hypothesis: Vit-D is essential for maintaining an anti-inflammatory TH2 phenotype and preventing immune dysregulation. The mouse models complement these findings by providing mechanistic insights, demonstrating that Vit-D is central to stabilizing TH2 identity and preventing a shift toward cytotoxic or pro-inflammatory states.
Our investigation reveals that maternal Vit-D is a crucial regulator of the neonatal immune system, influencing both innate and adaptive responses. Given the association between cord blood Vit-D levels and maternal Vit-D status,68 we analyzed cord blood samples obtained at birth from mothers who maintained either consistently high or low levels of Vit-D during pregnancy. Despite substantial evidence indicating a positive correlation between Vit-D deficiency during pregnancy and a higher likelihood of allergies, asthma, and autoimmune diseases in offspring later in life,69,70,71 the precise impact on cord blood transcriptomics is still lacking. Previous studies have primarily relied on epidemiological data and lack genomic characterization.72,73 By incorporating information about VDR target genes, we focused on a subgroup of samples exhibiting a correlation between maternal Vit-D status during pregnancy and VDR-related gene expression in the cord blood (Figure 1A) to uncover the molecular mechanisms underlying the effect of maternal Vit-D on the neonatal immune system.
Our analysis reveals that varying levels of maternal Vit-D trigger complex transcriptional programs in the cord blood of neonates. These programs are associated with T-cell-mediated defense against microbial invasion and chemotaxis responses related to neutrophil activation. The enriched processes in the low Vit-D group of mothers, related to T cell activity, receptor activity, phagocytosis, and neutrophils work together in a dynamic manner in the established pathophysiology of asthma. Particularly, activated neutrophils release web-like structures called neutrophil extracellular traps (NETs) composed of DNA, histones, and antimicrobial proteins, in response to infection or tissue damage.74 In adults, NET formation has been observed in the airways of patients with severe asthma and is positively correlated with disease severity and the number of neutrophils in sputum.75 This analysis suggests a potential direct link between low maternal Vit-D levels and increased asthma-related immune responses in cord blood, highlighting the importance of Vit-D in fetal immune system development.
Our unique approach of comparing TH2 cells derived from both wild-type and Vit-D-deficient mice, under conditions of calcitriol treatment and deficiency, has allowed us to dissect the intrinsic effects of Vit-D on these critical immune cells for the first time. While calcitriol impacts the immune pathways in TH2 cells by promoting anti-inflammatory effects, Vit-D deficiency alters the lineage commitment toward a cytotoxic phenotype (Figure 6). Consistent with the cord blood DE analysis in VDAART cohort, calcitriol stimulation in TH2 cells promotes immune tolerance by regulating prominent cytokines linked to asthma, resulting in suppression of inflammatory cytokines and elevation of anti-inflammatory cytokines. Anti-inflammatory cytokines such as Il-10, Tgf-β3, Tigit, and Ctla4 promote the suppression of inflammatory cytokines and support tissue repair. Particularly, TGF-β3 has been shown to be involved in the resolution of inflammation and tissue repair, by promoting the formation of extracellular matrix and stimulating the differentiation of fibroblasts into myofibroblasts during tissue remodeling.76
Figure 6.

Summary of TH2 cell transcriptional responses to Vit-D exposure and deficiency
Schematic representation of the differential effects of Vit-D exposure and deficiency on TH2 cell phenotype and function. The left side depicts TH2 cells under 1,25-Vit-D exposure, characterized by upregulation of anti-inflammatory genes (e.g., Il-10, Tgfβ) and transcription factors (e.g., Ikzf3, Prdm1, Maf), along with immune checkpoint receptors (e.g., Ctla2a, Ctla2b, Ctla4), along with enhanced calcium signaling mediated by Vdr and Cyp24a1. The right side illustrates TH2 cells under Vit-D deficiency, displaying a skewed phenotype, with upregulation of pro-inflammatory cytokines (e.g., Il-2, Il-3, Il-6, Il-13, Ifnγ), cytotoxic markers (e.g., Cd8, Gzmb, Gzmc, Prf1), and MHC class I molecules (e.g., H2-K1, H2-Q7, H2-D1). Vit-D deficiency also induces the expression of cytolytic granule proteins and innate immune receptors (e.g., Nkg7, KLRA family) and transcription factors (e.g., Tbx21, Ikzf2, Klf10, Prdm16, Nupr1), indicative of a hybrid cytotoxic phenotype. This figure summarizes the contrasting effects of Vit-D on TH2 cell lineage commitment and functional programming. Created with BioRender.com.
In addition to promoting anti-inflammatory cytokines, Vit-D stimulation also supports calcium ion homeostasis and wound healing, both of which are important for maintaining tissue integrity.53 In asthma, dysregulation of calcium ion homeostasis can contribute to airway hyperresponsiveness, airway smooth muscle contraction, and excessive mucus production.77 Similarly, impaired wound healing is associated with airway remodeling, a hallmark of the disease characterized by structural changes in the airways, including increased smooth muscle mass, subepithelial fibrosis, and mucus gland hyperplasia.76 Consistent with this, various genes contributing to different aspects of wound healing, including cell adhesion and the recruitment of TH2 cells to inflammatory sites, as well as the development, stabilization, and remodeling of the extracellular matrix after inflammatory insult, were upregulated in Vit-D-stimulated TH2 cells.
Moreover, network modeling of the calcitriol-stimulated TH2 signaling network revealed a complex synergy of processes involved in adaptation to calcitriol exposure. Our discrete dynamical modeling approach identified Vit-D catabolism and calcium extrusion as critical regulators of cell homeostasis after calcitriol exposure. The feedback mechanism involving Cyp24a1 and calcium extrusion through the PMCA channel plays a coordinated role in establishing optimal intracellular VDR signaling and maintaining a balance between pro-inflammatory and anti-inflammatory cytokines. Such computational models serve as simplified representations of biological systems, yet pinpoint critical nodes within the TH2 cell signaling network. This approach offers profound insights into pivotal junctures for intervention within these signaling cascades, substantially enhancing our understanding of TH2 cell behavior under calcitriol stimulation.
Our findings on the cytotoxic skewing of Vit-D-deficient TH2 cells suggest a new paradigm in the understanding of the role of Vit-D in TH2 cell plasticity. Vit-D deficiency leads to a complex transcriptional reprogramming of TH2 cells into hybrid CD4−CD8+ coexpressing cells that share features with killer cells (cytotoxic T cells and NK cells). These TH2 cells exhibit remarkable plasticity, and their differentiation potential extends beyond the typical constraints of CD4+ or CD8+ lineages. These cells undergo a transition from their conventional helper function to assuming the role of cytotoxic lymphocytes, hinging upon direct cellular interactions with target cells. This reprogramming is characterized by cytolytic granules and a non-archetypal TH2 surface receptor repertoire associated with recognition as well as presentation of antigens. These endogenous observations in the Vit-D-deficient TH2 cells underscore a potentially broader, previously unrecognized role of Vit-D in maintaining the functional integrity and lineage specificity of T helper cells.
Although previously believed to arise from the premature escape of thymocytes from the thymus, recent investigations have confirmed that double-positive thymocytes represent a mature T cell population in response to antigens.78,79,80 CD4+CD8+ T lymphocytes constitute a small proportion of circulating human T lymphocytes, and their induction and functional characterization remain poorly understood.81 Consistent with our findings, single-cell RNA sequencing (scRNA-seq) analysis has revealed that CD4loCD8hi cells exhibit CD8 CTL and innate-like properties, as evidenced by the expression of KLRC1, KLRB1, KIR2DL4, and NKG7 genes.82 Increased frequencies of CD4+CD8+ T cells have been reported in various autoimmune diseases, including multiple sclerosis, autoimmune thyroid disease, myasthenia gravis, rheumatoid arthritis, and systemic lupus erythematosus.83,84,85,86,87 Our analysis suggests that prolonged Vit-D deprivation may promote the differentiation of TH2 cells into CD4+CD8+ T cells, thereby increasing susceptibility to autoimmune diseases.
In general, cytotoxic cells play a crucial role in promoting airway inflammation and hyperresponsiveness by releasing various pro-inflammatory cytokines, chemokines, and cytotoxic molecules that can damage airway epithelial cells, leading to mucus production and airway smooth muscle contraction.88 These events contribute to airway remodeling and the gradual decline in lung function over time in asthma pathogenesis.89 However, the impact of CD4+CD8+ T lymphocytes has not been studied in the context of asthma. Our results indicate that Vit-D deprivation in naïve CD4+ T cells can drastically alter their differentiation trajectory and function, implying a crucial role of Vit-D in immune regulation and asthma pathogenesis.
In conclusion, understanding the cell-specific actions of Vit-D on TH2 cells opens new avenues for therapeutic interventions aimed at modulating Vit-D pathways to restore immune tolerance. This could lead to the development of targeted Vit-D-based therapies or dietary recommendations for individuals at risk of or suffering from TH2-cell-driven disorders, marking a significant advancement in personalized medicine approaches for immune-mediated diseases.
Limitations of the study
Our study provides valuable insights into the effects of Vit-D on TH2 cell function and lays the groundwork for future research, though several limitations— including the absence of functional assays and additional regulatory analyses— warrant acknowledgment. First, our conclusions are derived from transcriptomic analyses without protein-level validation, such as RT-qPCR, ELISA, or cytokine assays, which are necessary to confirm key gene expression changes at the protein level. Second, our in vitro (calcitriol-treated) and ex vivo (Vit-D-deficient) models focus on controlled environments to study intrinsic TH2 cell responses but do not fully replicate the complexity of in vivo immune dynamics or disease-specific contexts, such as asthma. Incorporating asthma-specific animal models in future studies would help connect these findings to physiological and pathological outcomes. For instance, allergen-induced asthma models, such as those using ovalbumin (OVA) or house dust mite (HDM) allergens, would allow investigation of how Vit-D supplementation or deficiency impacts TH2-driven airway inflammation, eosinophilic infiltration, mucus production, cytokine production, and airway hyperreactivity in a disease-relevant setting. Genetically modified mouse models, including Vdr-knockout mice or mice with tissue-specific Vdr deletions in TH2 cells, could provide critical insights into the mechanistic role of VDR signaling in asthma pathophysiology. Finally, although we identified transcriptional changes suggestive of Vit-D’s regulatory role, potential epigenetic and post-transcriptional mechanisms remain unexplored. Future research should address these aspects to provide a more comprehensive understanding of Vit-D’s impact on immune function. As such, although functional assays are beyond the scope of this current study, our findings lay the groundwork for these critical next steps.
Resource availability
Lead contact
Requests for further information and resources should be directed to and will be fulfilled by the lead contact, Vrushali D. Fangal (vrushali.fangal@channing.harvard.edu).
Materials availability
This study did not generate new unique reagents. All materials used in the study, including experimental reagents and computational resources, are commercially available.
Data and code availability
-
•
All relevant data are included in the paper and its Supplemental Information files. The VDAART Study data are available from the clinicaltrials.gov (NCT00920621). Mouse RNA-seq data are available in NCBI’s GEO repository under accession numbers GSE282941 (calcitriol-treated TH2 cells) and GSE283020 (Vit-D-deficient TH2 cells).
-
•
Code used for data analysis is available at https://github.com/vrushali-broad/Vit-D-Modulation.
-
•
Any additional information required for reanalysis of the data reported in this study is available from the lead contact upon reasonable request.
Acknowledgments
The VDAART trial was supported by National Heart, Lung, and Blood Institute (NHLBI) grant U01 HL091528 (S.T.W. and A.A.L.) and the National Research Service Award (NHLBI T32-HL007427, H.M.), along with additional NHLBI funding (L30-HL129467–01 and L30-HL129467-02A1, H.M.). Participant visits at Boston Medical Center were supported by the National Center for Advancing Translational Sciences (NCATS) grant U54TR001012. The NHLBI was not involved in the study design, data collection, analysis, interpretation, or the preparation and approval of this manuscript. The authors express their deep gratitude to the women who participated in the VDAART trial and to the study staff for their invaluable contributions to this research.
Author contributions
V.D.F. and S.T.W. conceptualized and supervised the study. S.T.W. is the principal investigator (PI) of the VDAART study. S.T.W., H.M., and A.A.L. contributed to the acquisition of VDAART data. V.D.F. analyzed the data, generated the figures, and drafted the manuscript. M.G.D. provided mouse strains, and A.K. conducted the mouse experiments. All authors participated in discussions, provided critical scientific feedback, edited the manuscript, and approved it prior to submission.
Declaration of interests
Scott T. Weiss and Augusto A. Litonjua receive royalties from UpToDate. Scott T. Weiss serves as a board member of Histolix, a digital pathology company. The remaining authors declare no competing interests.
STAR★Methods
Key resources table
| REAGENT or RESOURCE | SOURCE | IDENTIFIER |
|---|---|---|
| Antibodies | ||
| CD4 PerCPeFluor710 (clone: RM4-5) | eBiosciences | Cat# 46-0042-82 |
| CD44 FITC (clone: IM7) | BioLegend | Cat# 103006 |
| CD62L PE (clone: mel-14) | BioLegend | Cat# 104408 |
| Anti-CD3ε (clone: 145-2C11) | BD Biosciences | Cat# 553057 |
| Anti-CD28 (clone: 37.51) | BD Biosciences | Cat# 553296 |
| Anti-IFN-γ (clone: XMG1.2) | BD Biosciences | Cat# 554408 |
| Anti-IL-12 (clone: C15.6) | BD Biosciences | Cat# 551219 |
| Biological samples | ||
| Cord blood RNA samples | VDAART cohort (ClinicalTrials.gov) | NCT00920621 |
| Maternal blood and cord blood samples | VDAART cohort (ClinicalTrials.gov) | NCT00920621 |
| Murine splenic TH2 cells | This study | N/A |
| RNA extracted from mouse cells | Functional Genomics Lab, Harvard Medical School | N/A |
| Chemicals, peptides, and recombinant proteins | ||
| Vitamin D3 (4000 IU/day) (given to mothers) | Tishcon Corp | N/A |
| Multivitamins (400 IU/day vitamin D3) (given to mothers) | Tishcon Corp | N/A |
| Placebo (given to mothers) | Tishcon Corp | N/A |
| Calcitriol (1α,25-Dihydroxyvitamin D3) | Sigma-Aldrich | Cat# D1530 |
| Ethanol (vehicle for calcitriol) | Sigma-Aldrich | Cat# 459844 |
| Recombinant Mouse IL-4 Protein (rmIL-4) | PeproTech | Cat# 214-14 |
| Recombinant Mouse IL-2 Protein (rmIL-2) | PeproTech | Cat# 212-12 |
| RPMI 1640 medium | Sigma-Aldrich | Cat# R8758 |
| TRIzol™ Reagent | Invitrogen (Thermo Fisher Scientific) | Cat# 15596026 |
| Critical commercial assays | ||
| DiaSorin Liaison chemiluminescence immunoassay (for maternal Vit-D measurement) | DiaSorin | DiaSorin LIAISON® XL |
| Liquid Chromatography-Tandem Mass Spectrometry (LC-MS/MS) (For cord blood Vit-D measurement) | Mayo Clinic Department of Laboratory Medicine and Pathology (Applied Biosystems) | SCIEX Triple Quad™ 6500+ LC-MS/MS System |
| QIAGEN PAXgene Blood RNA Kit (RNA extraction for cord blood samples) | QIAGEN/PreAnalytiX | Cat# 762164 |
| TruSeq® Stranded Total RNA Library Prep Globin Kit (RNA-seq library prep) | Illumina | Cat# 20020612 |
| Naive CD4+ T cell Isolation Kit | Miltenyi Biotec | Cat# 130-104-453 |
| microRNeasy kit (RNA isolation for mouse TH2 cells) | QIAGEN | Cat# 217004 |
| NEXTflex™ Small RNA Sequencing Kit v3 | Bioo Scientific | Cat# NOVA-5132-05 |
| Nanodrop 8000 Spectrophotometer | Thermo Fisher Scientific | Model ND-8000-GL |
| Deposited data | ||
| VDAART cohort | ClinicalTrials.gov | NCT00920621 |
| VDR pathway gene data | WikiPathways and AmiGO 2 | WikiPathways: WP2877; AMIGO2: GO:0042359 |
| KEGG pathway data | KEGG Database | KEGG: mmu04660; KEGG: mmu04020 |
| Raw RNA-seq data | This study | Gene Expression Omnibus (GEO) accession: GSE282941 for calcitriol treated TH2 cells; GSE283020 for Vit-D-deficient TH2 cells |
| Human reference genome NCBI build 38 (GRCh38) | Genome Reference Consortium | http://www.ncbi.nlm.nih.gov/projects/genome/assembly/grc/human/ |
| Mouse reference genome (GRCm38) | Genome Reference Consortium | https://www.ncbi.nlm.nih.gov/datasets/genome/GCF_000001635.20/ |
| Experimental models: Organisms/strains | ||
| BALB/c mice (Age: 6–8 weeks) | Charles River Laboratories | Strain: BALB/c |
| C57BL/6 mice (Vit-D-deficient, UV-free environment) | MGH Animal Care Facility | Strain: C57BL/690 |
| Vit-D-deficient diet | Harlan Teklad | Cat# TD97340 |
| Software and algorithms | ||
| STAR RNA-seq aligner | Github (https://github.com/alexdobin/STAR) | Version: 2.7.3 |
| HTSeq | Github (https://github.com/htseq/htseq) | Version: 0.11.2 |
| edgeR | R/Bioconductor | Version: 3.36.0 |
| Limma (for differential expression analysis) | R/Bioconductor | Version: 3.50.3 |
| UMAP (for dimensionality reduction) | Python | Version: 0.5.3 |
| Seaborn (for heatmaps and visualization) | Python | Version: 0.12.1 |
| Scikit-learn (for clustering) | Python | Version: 1.0 |
| clusterProfiler (GO and KEGG analysis) | R/Bioconductor | Version: 4.2.2 |
| org.Hs.eg.db | R/Bioconductor | Version: 3.14.0 |
| org.Mm.eg.db | R/Bioconductor | Version: 3.14.0 |
| Pathview (KEGG pathway mapping) | R/Bioconductor | Version: 1.34.0 |
| enrichplot | R/Bioconductor | Version: 1.14.2 |
| KEGGREST | R/Bioconductor | Version: 1.42.0 |
| KEGGgraph | R/Bioconductor | Version: 1.62.0 |
| BoolNet (for discrete dynamical modeling) | R/Bioconductor | Version: 2.1.9 |
| Other | ||
| NextSeq 550 (Sequencing Platform) | Illumina | Model SY-415-1002 |
| Illumina HiSeq 2500 (Sequencing Platform) | Illumina | Cat# SY-401-2501 |
| Study Design and Coordination | Brigham and Women’s Hospital, Channing Division of Network Medicine, Harvard Medical School, Boston, MA | N/A |
| Study Approvals (Animal Care Committees) | Brigham and Women’s Hospital, Massachusetts General Hospital, Harvard Medical School, Boston, MA | Protocol# 2016N000357; 05115 |
Experimental model and study participant details
VDAART cohort
Trial design
VDAART is a multicenter, randomized, double-blind, placebo-controlled trial evaluating whether prenatal supplementation with Vit-D could prevent asthma and wheeze in young children.40 The supplementation aimed to raise the serum levels of 25-hydroxyvitamin D in the mothers to a target range, addressing the hypothesis that higher levels of Vit-D during pregnancy could reduce the risk of asthma and wheezing disorders in offspring during early childhood.91 The trial enrolled 881 pregnant participants, aged 18–39 years, within 10–18 weeks of gestation, who were non-smokers and had either a personal history of asthma, eczema, or allergic rhinitis or a partner with such a history. The participants were fluent in either English or Spanish. The study spanned three U.S. clinical sites: Boston Medical Center, Washington University in St. Louis, and Kaiser Permanente Southern California Region, with the Data Coordinating Center located at the Channing Division of Network Medicine, Brigham and Women’s Hospital, Boston. Participants were monitored monthly for adverse events throughout pregnancy and were allocated to one of two groups in a randomized manner: the intervention group received a daily dosage of 4000 IU of vitamin D3 in addition to a multivitamin containing 400 IU (equivalent to 100 g/day) of vitamin D3, while the control group was given a placebo alongside a multivitamin that provided 400 IU (corresponding to 10 g/day) of vitamin D3.
Cord blood samples were collected at birth from 443 neonates to assess immune responses. Maternal Vit-D levels were measured at three time points—first trimester (10–18 weeks), third trimester (32–38 weeks), and at birth (cord blood measurement). Based on consistent physiological Vit-D levels across these time points, a subset of 192 neonates was selected and classified into High Vit-D (≥ 25 ng/mL, N = 35) and Low Vit-D (< 25 ng/mL, N = 62) groups. From this subset, 97 cord blood transcriptomic profiles were analyzed to examine the Vit-D/VDR axis (Figure 1), with demographic details provided in Table S1.
Ethics and registration
The VDAART study protocol was sanctioned by the institutional review boards (IRBs) of all participating institutions, including Brigham and Women’s Hospital. These included IRBs from three clinical centers and the Data Coordinating Center, encompassing institutions such as Washington University in St. Louis, Kaiser Health Care San Diego, Boston Medical Center, and Brigham and Women’s Hospital in Boston. The VDAART study is supported by the National Heart, Lung, and Blood Institute (NHLBI), under the UO1 funding mechanism, a cooperative agreement facilitating collaboration between the NHLBI and the research investigators. Informed consent was duly procured from the participating pregnant women at their initial enrollment visit.
Mouse models
All animal studies were conducted in compliance with the NIH Guidelines for the Care and Use of Laboratory Animals and were approved by the Institutional Animal Care and Use Committees at Brigham and Women’s Hospital (protocol number 2016N000357), Massachusetts General Hospital (protocol number 2004N000113), and the Harvard Medical Area (protocol number 05115). Mice were maintained in a virus– and parasite– free animal facility under a 12-h light and 12-h dark cycle. The facility is AAALAC accredited (number 1729).
In the Vit-D supplementation model, BALB/c mice were selected due to their due to their prototypical type-2 immune bias (dominant TH2 response) and higher propensity for IgE-mediated allergy, providing an optimal system to assess asthma-related immune mechanisms and the potential protective effects of Vit-D against allergic responses.92 For the Vit-D-deficient model, we used C57BL/6 mice as they demonstrate higher viability in producing Vit-D-deficient offspring, allowing us to reliably study the effects of chronic Vit-D deficiency on TH2 cells.
TH2 cells derived from these mouse models were then subjected to in vitro experiments to explore two distinct scenarios: 1) acute receptor-mediated stimulation, where calcitriol was added to cultured TH2 cells from BALB/c mice to assess the direct effects of Vit-D via the VDR pathway, and 2) chronic multigenerational deficiency, where TH2 cells from C57BL/6 mice under chronic Vit-D-deficient conditions were analyzed to evaluate the long-term impact of Vit-D depletion. These complementary experiments provide mechanistic insights into the role of Vit-D in regulating TH2 cell biology.
Vit-D stimulation in TH2 cells
For the exploration of Vit-D exposure, male and female wild-type BALB/c mice (6-8 weeks old) were acquired from Charles River Laboratories and maintained on a standard rodent diet enriched with Vit-D. The experiments were conducted on first-generation (F1) mice without multigenerational breeding or dietary manipulation. To evaluate the impact of Vit-D on TH2 cells, we treated cells during in vitro polarization by dividing them into two experimental groups: a) Vehicle Control Group: Cultures (N = 11) received 2% ethanol, serving as the solvent for calcitriol, at both day 0 (start of polarization) and day 3 (induction of polarization). b) Calcitriol Group: Cultures (N = 11) were treated with 100 nM calcitriol (dissolved in ethanol) at the same time points. This approach evaluates the effects of calcitriol on TH2 differentiation across both early and late polarization phases.
This protocol was designed to elucidate the role of calcitriol, the active form of Vit-D, in activating the VDR pathway and modulating TH2 cell responses. The method isolates the effects of calcitriol in a controlled system, enabling the investigation of receptor-mediated mechanisms while maintaining normal physiological conditions.
Vit-D-deficient TH2 cells
To investigate the effects of Vit-D deficiency on TH2 cells, we established a C57BL/6 mouse model following established protocols.90 C57BL/6 male and female WT mice (N = 7) were reared and maintained within the MGH animal care facility. WT mice (N = 3) maintained on a regular Vit-D sufficient diet served as normal controls. To generate the Vit-D-deficient group, WT C57BL/6 breeding pairs (F0) were transitioned to a Vit-D-deficient diet (TD97340; Harlan Teklad) and housed in a UV-free environment, eliminating endogenous Vit-D synthesis. Their offspring (F1) were bred under the same conditions, and the F2 generation, characterized by non-detectable circulating 25-hydroxyvitamin D levels and functional VDR (VDR+/+), was used for experiments. This consistent deficiency across generations ensured that the observed effects were attributable to Vit-D depletion rather than genetic alterations. To mitigate severe developmental defects, the TD97340 diet was enriched with high calcium (2%) and lactose (20%) to promote calcium absorption through Vit-D independent pathways and prevent skeletal abnormalities such as rickets.
This protocol was designed to: 1) Investigate the intrinsic effects of chronic Vit-D deficiency on TH2 cell differentiation and function, isolating the role of ligand depletion (F2 Vit-D-deficient mice) and complementing findings from the VDAART cohort and calcitriol-stimulated TH2 cells. 2) Assess how Vit-D deficiency drives transcriptional and phenotypic changes in TH2 cells, linking these adaptations to immune plasticity and hybrid cytotoxic phenotypes.
Method details
VDAART sample collection
Maternal blood samples were collected during the first trimester (10–18 weeks) and the third trimester (32–38 weeks) of pregnancy, whereas cord blood samples were collected from each infant at delivery. Circulating 25-hydroxyvitamin D in maternal plasma samples was measured using the DiaSorin Liaison chemiluminescence immunoassay, while liquid chromatography-tandem mass spectrometry (LC-MS/MS) was employed for the analysis of cord blood samples.93 Maternal Vit-D levels were measured using radioimmunoassay (RIA), whereas cord blood levels were assessed using liquid chromatography-tandem mass spectrometry (LC-MS/MS). Although RIA and LC-MS/MS generally yield comparable measurements, cord blood contains Vit-D epimers, such as 3-epi-25-hydroxyvitamin D, which share structural similarities with vitamin D metabolites. These epimers interfere with RIA, leading to overestimated Vit-D levels. LC-MS/MS was chosen for its ability to differentiate between Vit-D metabolites and epimers, ensuring accurate and reliable Vit-D measurements in complex matrices like cord blood.
Total RNA was extracted from cord blood samples using the QIAGEN PAXgene Blood RNA Kit (PreAnalytiX), following the guidelines provided by the manufacturer. The integrity and concentration of the RNA were verified (RNA Integrity Number [RIN] > 7) using the NanoDrop 8000 spectrophotometer (Thermo Fisher Scientific). For RNA sequencing, the libraries were prepared using the TruSeq Stranded Total RNA Library Prep Globin Kit (Illumina) and the NEXTflex Small RNA sequencing Kit v3 (Bioo Scientific). Sequencing was performed on the Illumina NextSeq 550 sequencing platform.
In vitro polarization of TH2 cells
Spleens were excised and mononuclear cells were isolated using a syringe plunger and 100-μm cell strainers. Red blood cells were removed by hypotonic lysis. Tonicity was restored by adding RPMI 1640 (Sigma Aldrich). The resulting cell suspension was washed twice with PBS and used for the isolation of naïve CD4+ T cells according to the manufacturer’s instructions (Naïve T cell Isolation Kit II; Miltenyi Biotec). Naïve CD4+ T cell purity was assessed by staining for CD4 PerCPeFluor710 (clone: RM4-5), CD44 FITC (IM7), and CD62L PE (mel-14). Naïve T cells were activated with plate bound anti-CD3ε (5 μg/mL, clone: 145-2C11, BD Biosciences) and soluble anti-CD28 (0.5 μg/mL, clone: 37.51, BD Biosciences). TH subset polarization was induced by exposing naive CD4+ T cells to rmIL-4 (20 ng/mL; Peprotech), anti-IFN-γ (5 μg/mL; BD Biosciences), and anti-IL-12 (5 μg/mL; BD Biosciences for 3 days. Proliferation of TH2 cells was induced using rmIL-2 (20 ng/mL; Peprotech) in the presence of TH polarizing reagents for an additional 2 days. Polarization efficiency was verified by staining for intracellular IL-13 cytokine production, following protocols previously published by our group.94,95
RNA extraction in murine TH2 cells
On day 5 of both experiments, cells were harvested, washed, and RNA was isolated using the microRNeasy kit (QIAGEN). Subsequently, the RNA was extracted and sequenced using RNA-Seq, which was conducted at the functional genomics lab located at the Channing Division of Network Medicine, Harvard Medical School, Boston, MA. Total RNA was extracted employing the TRIzol Reagent (Invitrogen), following the protocol provided by the manufacturer. Quality control was performed using a Nanodrop 8000 spectrophotometer. For RNA-sequencing, libraries were prepared using the TruSeq Stranded Total RNA Library Prep Globin Kit by Illumina, and sequencing was conducted on an Illumina HiSeq 2500 system. Trimmed sequence reads were aligned to the mouse reference genome GRCm38 using STAR aligner.96 Gene expression read counts were quantified using the HTSeq software.97
Quantification and statistical analysis
Significance testing
In this study, ‘FDR’ denotes p-values adjusted for multiple testing via the Benjamini-Hochberg method to control the false discovery rate. Differential expression p-values were derived using a moderated t-test with empirical Bayes variance moderation (limma), and enrichment p-values were calculated via a hypergeometric test (clusterProfiler).
VDAART cord blood analysis
Extraction of VDR signaling genes
To identify genes involved in the VDR signaling pathway, we extracted data from AmiGO 298 and WikiPathways,99 focusing on the vitamin D metabolic process (GO term GO:0042359100,101 – https://amigo.geneontology.org/amigo/term/GO:0042359) and the VDR pathway (WP2877), respectively. We identified 16 genes from AmiGO 2. We utilized a Python script with the xml.etree.ElementTree parser module to analyze the WP2877 GPML file from WikiPathways. This script focused on ‘DataNode’ elements to extract the ‘TextLabel’ attribute, assembling a comprehensive list of genes essential to the VDR pathway. After removing duplicates, our approach identified 187 unique genes from WP2877. Consequently, we assembled a refined set of 201 essential genes for downstream VDR pathway-based clustering analysis.
RNA-seq data preprocessing and normalization
Following sequencing, reads were trimmed and aligned to the human reference genome GRCh38 using the Spliced Transcripts Alignment to a Reference (STAR) tool.96 Quantification of gene expression was performed using the HTSeq tool.97 The initial dataset comprised of 65,988 genes across expression profiles of 443 cord blood samples collected at birth. To account for variations in library sizes and to enhance the comparability of gene expression levels across samples, counts per million (CPM) were calculated using the cpm function from the edgeR (v3.36.0) package. A log transformation (log-CPM) was also applied to stabilize the variance across the range of counts. The filterByExpr function from the edgeR package was employed to filter out lowly expressed genes from the dataset, applying a minimum count threshold of 12 and grouping samples based on Vit-D levels binarized at 25 ng/mL across three time points. This filtering resulted in a refined dataset comprising 13,214 genes across 443 samples. The dataset was then subjected to normalization using the Trimmed Mean of M-values (TMM) method with the calcNormFactors function from edgeR, aimed at correcting compositional differences between libraries for reducing technical biases and ensuring that biological comparisons are meaningful. Profiles that lacked consistent Vit-D levels < 25 ng/mL or ≥ 25 ng/mL at three time points were excluded, resulting in a refined set of 192 expression profiles.
Clustering
Clustering was performed on normalized and log-transformed expression profiles of the curated 201 VDR signaling genes for the subset of 192 participants. For clustering, we applied the K-Means algorithm, where initial clusters were randomly assigned, to partition the samples into two distinct clusters using the scikit-learn (v1.0) library in Python. We subsetted the clusters to include Vit-D < 25 ng/mL (Low Vit-D group) in Cluster 1 (N = 62) and Vit-D ≥ 25 ng/mL (High Vit-D group) in Cluster 2 (N = 35), resulting in a subset of 97 profiles for downstream DE analysis. To visualize the clustering results and examine the distribution of samples within the identified clusters, we employed dimensionality reduction using Uniform Manifold Approximation and Projection (UMAP) implemented in the umap (v0.5.3) library in Python. This technique was chosen for its effectiveness in preserving both the global and local structure of high-dimensional data in a lower-dimensional space. The cord blood sample clusters were visualized by superimposing the K-Means embeddings on UMAP using the seaborn (v0.12.1) package in Python.
Differential expression analysis
Our differential expression analysis, conducted with the limma (v3.50.3) package in R, focused on a curated set of 97 profiles selected based on VDR signaling gene clusters and filtering according to Vit-D levels. Of these, 62 profiles belong to Low Vit-D group and 35 to the High Vit-D group. We constructed a design matrix to model gene expression against variables such as Vit-D status (High vs. Low), sample collection site, race, and ethnicity. The data were preprocessed using the voom function for log-CPM transformation and weight assignment, followed by model fitting with lmFit and application of defined contrasts to highlight differences between the High and Low Vit-D groups. The empirical Bayes method eBayes was employed to ascertain significant gene expression changes, with results extracted using topTable, applying a log-fold change threshold of 0.585 (1.5-fold) and an adjusted p-value cutoff of 0.05. p-values were corrected for multiple hypothesis testing using the Benjamini-Hochberg (BH) FDR adjustment. A heatmap of differentially expressed genes was generated as Z-score across each gene in seaborn (v0.12.1) package in Python. This comprehensive approach enabled the identification of differentially expressed genes significantly influenced by Vit-D levels during pregnancy.
Overrepresentation analysis
In our study, we performed Gene Ontology (GO) analysis on downregulated DEGs associated with Vit-D deficiency. The enrichment analysis was performed using the enrichGO function from the R package clusterProfiler (v4.2.2), targeting all three GO categories: Biological Process (BP), Cellular Component (CC), and Molecular Function (MF). The analysis was configured to use human gene annotations from the org.Hs.eg.db (v3.14.0) package, with gene IDs specified in ENSEMBL format. The background gene set for enrichment analysis was defined as the collection of genes retained after applying expression level filters to remove lowly expressed genes during the differential expression analysis. We applied a p-value cutoff of 0.01 and adjusted for multiple testing using the BH method, to identify significantly enriched GO terms.
For visualization, enriched GO term networks were constructed for each category using the emapplot function from enrichplot (v1.14.2) package in R, showcasing term relationships through shared genes. Given the extensive array of identified BP categories, we applied a stringent filter to retain terms with high statistical significance with a –log10-transformed adjusted p-value greater than 5, resulting in a focused set of 66 terms. This level of specificity was not applied to CC and MF categories, resulting in 36 and 29 terms, respectively. Pairwise term similarities were computed using the pairwise_termsim function from the enrichplot library to identify significant inter-term relationships, with log p-values adjusted for enhanced clarity in highlighting significant terms. This facilitated the creation of network visualizations that depicted enriched GO terms, distinguished by color and size to represent their significance levels and associated gene counts, respectively. Each GO category was tailored with specific color schemes and layout adjustments to improve interpretability.
KEGG enrichment analysis
Differentially expressed genes were used for KEGG enrichment analysis. Each gene was annotated with its corresponding ENTREZ gene ID, ensuring that the list was devoid of missing values (NAs) and sorted in decreasing order of logFC, as required by clusterProfiler (v4.2.2). The enrichKEGG function from clusterProfiler was configured with a p-value cutoff of 0.05 and adjusted for multiple testing using the BH method. The function was also set to consider gene sets with sizes ranging from 10 to 2000, ensuring a focused yet comprehensive analysis of pathway involvement. The resulting KEGG pathways were then made readable by converting KEGG IDs to gene symbols using the setReadable function, again employing the org.Hs.eg.db (v3.14.0) package for human gene annotations. Fold enrichment (FE) for each pathway was calculated by comparing the gene ratio in the pathway to the background gene ratio, while adjusted p-values were transformed to a –log10 scale to facilitate interpretation. Pathways were then ranked based on these metrics, highlighting those with the highest fold enrichment and significance levels.
Murine TH2 cell analysis
Differential expression analysis of 1,25-Vit-D stimulated cells
DE analysis was conducted using the same approach as the DE analysis in VDAART cord blood. To understand the effects of calcitriol stimulation on TH2 cells, we analyzed differential expression of TH2 cells subjected to calcitriol stimulation (N = 11) versus control (N = 11) conditions. The expression data comprised of 49,671 genes across 22 samples. We excluded 22,370 genes with zero counts across all samples, refining the dataset to 27,301 genes. We further excluded genes with low read counts using filterByExpr function in edgeR (v3.36.0) package to distill the dataset to 11,905 genes.
We normalized the data and transformed it to log2-counts per million (log-CPM) using the voom function from the limma package (v3.50.3), which also accounted for sample-specific variances to address the mean-variance relationship inherent in count data. A design matrix was constructed to model the experimental conditions, with calcitriol exposure as the primary variable. Linear models were applied to the voom-normalized data, followed by empirical Bayes moderation via the eBayes function in limma, enhancing the precision of log-fold change estimates. At an FC threshold of 1.5-fold and an FDR of 0.01, we identified 470 upregulated and 441 downregulated genes, highlighting the transcriptional impact of calcitriol. We set the FC and FDR criteria to narrow the list to approximately the top 1,000 differentially expressed genes.
Differential expression analysis of Vit-D-deficient cells
To explore the transcriptional consequences of Vit-D deficiency, we conducted a differential expression analysis comparing TH2 cells from Vit-D-deficient mice (N = 7) with those from wild-type controls (N = 3). The initial expression dataset encompassed 49,671 genes across 10 samples. We removed 12,219 genes that showed zero counts in all samples, focusing our analysis on 37,452 genes. Utilizing the filterByExpr function in the edgeR package (v3.36.0), we refined this to 14,013 genes based on expression levels, enhancing the data’s analytical clarity. Normalization and variance stabilization were performed akin to DE analysis of calcitriol-stimulated TH2 cells. We designed a matrix to model our experimental conditions, with Vit-D status as the primary variable, and included batch effects as covariates. To target the most biologically relevant changes, we applied thresholds to capture the top 1,000 differentially expressed genes. By applying a stringent 3-fold change threshold and an FDR of 0.01, we narrowed down to 491 upregulated and 395 downregulated genes, underscoring the transcriptional influence of Vit-D deficiency.
Enrichment analysis of murine TH2 cells
For mouse datasets, we performed GO overrepresentation test using the enrichGO function in the R package clusterProfiler (v4.2.2), setting the gene sets used for differential expression analysis as the background set. For GO BP, CC, and MF enrichment, we used the R annotation package org.Mm.eg.db (v3.14.0). To identify canonical pathways, we used the clusterProfiler function enrichKEGG to perform KEGG pathway enrichment on DE genes in each experiment. For plotting asthma KEGG pathway, pathview (v1.34.0) package was used. For all enrichment analyses, p-values were adjusted using BH correction to identify significantly enriched pathways.
Model construction and configuration of 1,25-Vit-D/VDR network model
The signaling network was constructed using nodes and interactions from the TCR signaling pathway (mmu04660) and the Calcium signaling pathway (mmu04020) from the KEGG database, along with VDR receptor signaling pathway.62 We extracted KEGG pathway information using R packages KEGGgraph (v1.62.0) and KEGGREST (v1.42.0) to generate 1,25-Vit-D/VDR signaling network model. We retrieved primary MGI gene symbols for pathway genes and identified nodes (genes) and edges (interactions) within these pathways. The interactions were restricted to include only DEGs in calcitriol-treated TH2 cells, as guided by expert knowledge. Each gene and interaction was annotated with MGI symbols for clarity, and all gene isoforms were consolidated into a single representative gene name for streamlined analysis.
Mathematical framework for discrete dynamical modeling
Discrete dynamical modeling (DDM) is a mathematical approach used to simulate the behavior of complex systems over time. In DDM, time progresses in discrete steps, and the system’s state at each step is determined by its state at the previous step, in accordance with a set of predefined rules or functions. In the context of cellular signaling networks, a system is represented as a collection of nodes and edges, where nodes correspond to molecular entities (e.g., proteins, receptors, metabolites) and edges represent interactions between these entities. The state of each node is discrete, representing different levels of molecular activity or concentration.
State transition rules
DDM employs logical rules to determine the state transitions of nodes. These rules, derived from experimental observations and literature, encapsulate the biological behavior of the system. The logic rules governing the state transitions incorporate basic logical operators (AND, OR, NOT) to model the regulatory interactions as follows.
-
(1)
AND indicates a node is activated only if all upstream activators are ON.
-
(2)
OR allows for a node to be activated if at least one of the upstream activators is ON.
-
(3)
NOT indicates a node is activated only if the upstream inhibitor is OFF.
These logical operations dictate state transitions from input signaling molecules to target transcription factors or proteins, reflecting the complex interplay of activation and inhibition within a network model.
Update scheme
Mathematically, the state of the system at time is a vector where is the state of the node at time , and is the total number of nodes. The state transition function maps the current state of the system to the next state, where k represents the maximum state value a node can take. To simulate the system, we start with an initial state vector and apply the state transition function iteratively to generate a sequence of states for time steps. The process continues until a steady state is reached, where , indicating that the system’s behavior has stabilized, or until a maximum number of time steps have been executed.
Conditions and state transitions in the 1,25-Vit-D stimulation network model
By systematically manipulating the activity states of Calcitriol, PMCA, and CYP24A1 across different cases, we aimed to delineate their individual and combined effects on TH2 cell signaling dynamics. We assessed the system under four distinct conditions, characterized by the binary states of Calcitriol, PMCA, and CYP24A1.
Each input node can exist in one of two states: ACTIVE (ON) or INACTIVE (OFF). The network incorporated a series of cases, each reflecting different conditions:
-
(1)
CASE I: Calcitriol was set to INACTIVE, simulating the absence of 1,25-Vit-D signaling.
-
(2)
CASE II: Calcitriol was set to ACTIVE, while PMCA remained INACTIVE, representing sufficient Vit-D signaling with disrupted calcium extrusion.
-
(3)
CASE III: Both Calcitriol and PMCA were set to ACTIVE, modeling normal Vit-D signaling and calcium regulation.
-
(4)
CASE IV: Both Calcitriol and CYP24A1 were set to ACTIVE, simulating active 1,25-Vit-D signaling with concurrent Vit-D catabolism.
The state transition rules governing the behavior of the 1,25-Vit-D stimulation are detailed in Table S6. Simulations were executed using the BoolNet (v2.1.9) package in R, which allows for the specification of complex networks with binary state representations. Each simulation consisted of 100 iterations, with each iteration spanning 800 time steps. Our 1,25-Vit-D stimulation model utilized a random order asynchronous update scheme, where the state of each node was updated based on a randomly determined sequence of nodes at each time step. Nodes were updated according to the logic rules in in Table S6 until the steady state was reached, a process repeated over 100 iterations to achieve a high confidence interval on node activities across all simulations. The final trajectory for each node was computed as the average of 100 trajectories (each of length 800) for a fixed input state, tracing the path from the input state to output transcription factors in a randomly determined sequence. Initially, the model entities exhibited transient behavior, with their values fluctuating between time steps. However, as the simulations progressed, the system gradually converged to a steady state.
Additional resources
VDAART is officially registered on ClinicalTrials.gov under the identifier NCT00920621 and is hosted at www.vdaart.com.
Published: February 26, 2025
Footnotes
Supplemental information can be found online at https://doi.org/10.1016/j.isci.2025.112117.
Supplemental information
Neonatal characteristics, stratified by low Vit-D (< 25 ng/mL, N = 62) and high Vit-D (≥ 25 ng/mL, N = 35) groups, include gender, race, ethnicity, and the site of cord blood collection. Samples were collected from three clinical sites: Kaiser Permanente Southern California Region (San Diego, CA), Boston Medical Center, and Washington University in St. Louis.
Genes significantly upregulated or downregulated in cord blood from the high Vit-D group (≥ 25 ng/mL, N = 35) compared to the low Vit-D group (< 25 ng/mL, N = 62) were identified using limma (FDR < 0.05, FC > 1.5).
Enriched GO terms were identified using clusterProfiler with the Benjamini-Hochberg method (FDR < 0.01). Cellular Component terms were identified for upregulated DEGs associated with Vit-D sufficiency, while Biological Process, Cellular Component, and Molecular Function terms were identified for downregulated DEGs associated with gestational Vit-D deficiency.
Genes significantly upregulated or downregulated in TH2 cells following calcitriol treatment, compared to WT TH2 cells, were identified using limma (FC > 1.5, FDR < 0.01).
Enriched GO Biological Process annotations were identified for upregulated and downregulated DEGs in calcitriol-stimulated TH2 cells using clusterProfiler with the Benjamini-Hochberg method (FDR < 0.05).
This table defines the Boolean state transition rules used to model the regulatory interactions of Calcitriol, PMCA, and CYP24A1 in TH2 cell signaling. Nodes represent molecular entities whose activation or inhibition is determined by logical operators (AND, OR, NOT) based on curated pathway interactions. Binary states (ON = 1, OFF = 0) were assigned to each input node across four experimental conditions: (I) Absence of 1,25-Vit-D signaling (Calcitriol = OFF), (II) Active Calcitriol with inactive PMCA (disrupted calcium extrusion), (III) Active Calcitriol and PMCA (normal calcium homeostasis), and (IV) Active Calcitriol and CYP24A1 (Vitamin D catabolism). State transition logic for each node defines how upstream regulators influence downstream molecular components. Simulations were performed iteratively until a steady state was reached, modeling the dynamic effects of Vit-D signaling on TH2 cell function.
Genes with significant differential expression (FDR < 0.01, FC > 3) in Vit-D-deficient TH2 cells were identified using limma with Benjamini-Hochberg correction.
Enriched Biological Process, Cellular Component, and Molecular Function annotations for upregulated DEGs in Vit-D-deficient TH2 cells were identified using clusterProfiler with the Benjamini-Hochberg method (FDR < 0.05).
References
- 1.Holgate S.T., Wenzel S., Postma D.S., Weiss S.T., Renz H., Sly P.D. Asthma. Nat. Rev. Dis. Primers. 2015;1 doi: 10.1038/nrdp.2015.25. [DOI] [PMC free article] [PubMed] [Google Scholar]
- 2.Venkatesan P. 2023 GINA report for asthma. Lancet Respir. Med. 2023;11:589. doi: 10.1016/S2213-2600(23)00230-8. [DOI] [PubMed] [Google Scholar]
- 3.Salmanpour F., Kian N., Samieefar N., Khazeei Tabari M.A., Rezaei N. Asthma and Vitamin D Deficiency: Occurrence, Immune Mechanisms, and New Perspectives. J. Immunol. Res. 2022;2022 doi: 10.1155/2022/6735900. [DOI] [PMC free article] [PubMed] [Google Scholar]
- 4.Ali N.S., Nanji K. A Review on the Role of Vitamin D in Asthma. Cureus. 2017;9:e1288. doi: 10.7759/cureus.1288. [DOI] [PMC free article] [PubMed] [Google Scholar]
- 5.Liu M., Wang J., Sun X. A Meta-Analysis on Vitamin D Supplementation and Asthma Treatment. Front. Nutr. 2022;9 doi: 10.3389/fnut.2022.860628. [DOI] [PMC free article] [PubMed] [Google Scholar]
- 6.Mehrabi S., Toghraee E. Association between serum 25-hydroxy vitamin D levels and severity of asthma. Clin. Nutr. ESPEN. 2022;49:197–200. doi: 10.1016/j.clnesp.2022.04.025. [DOI] [PubMed] [Google Scholar]
- 7.Sharif A., Haddad Kashani H., Sharif M.R. Association of 25-hydroxy vitamin D with asthma and its severity in children: a case-control study. Clin. Mol. Allergy. 2020;18:7. doi: 10.1186/s12948-020-00122-9. [DOI] [PMC free article] [PubMed] [Google Scholar]
- 8.Boonpiyathad T., Chantveerawong T., Pradubpongsa P., Sangasapaviliya A. Serum Vitamin D Levels and Vitamin D Supplement in Adult Patients with Asthma Exacerbation. J. Allergy. 2016;2016 doi: 10.1155/2016/4070635. [DOI] [PMC free article] [PubMed] [Google Scholar]
- 9.Bener A., Ehlayel M.S., Bener H.Z., Hamid Q. The impact of Vitamin D deficiency on asthma, allergic rhinitis and wheezing in children: An emerging public health problem. J. Family Community Med. 2014;21:154–161. doi: 10.4103/2230-8229.142967. [DOI] [PMC free article] [PubMed] [Google Scholar]
- 10.Maalmi H., Berraïes A., Tangour E., Ammar J., Abid H., Hamzaoui K., Hamzaoui A. The impact of vitamin D deficiency on immune T cells in asthmatic children: a case-control study. J. Asthma Allergy. 2012;5:11–19. doi: 10.2147/JAA.S29566. [DOI] [PMC free article] [PubMed] [Google Scholar]
- 11.Loeb M., Dang A.D., Thiem V.D., Thanabalan V., Wang B., Nguyen N.B., Tran H.T.M., Luong T.M., Singh P., Smieja M., et al. Effect of Vitamin D supplementation to reduce respiratory infections in children and adolescents in Vietnam: A randomized controlled trial. Influenza Other Respir. Viruses. 2019;13:176–183. doi: 10.1111/irv.12615. [DOI] [PMC free article] [PubMed] [Google Scholar]
- 12.Esfandiar N., Alaei F., Fallah S., Babaie D., Sedghi N. Vitamin D deficiency and its impact on asthma severity in asthmatic children. Ital. J. Pediatr. 2016;42:108. doi: 10.1186/s13052-016-0300-5. [DOI] [PMC free article] [PubMed] [Google Scholar]
- 13.Shi Y., Liu T., Yao L., Xing Y., Zhao X., Fu J., Xue X. Chronic vitamin D deficiency induces lung fibrosis through activation of the renin-angiotensin system. Sci. Rep. 2017;7:3312. doi: 10.1038/s41598-017-03474-6. [DOI] [PMC free article] [PubMed] [Google Scholar]
- 14.Bouillon R., Manousaki D., Rosen C., Trajanoska K., Rivadeneira F., Richards J.B. The health effects of vitamin D supplementation: evidence from human studies. Nat. Rev. Endocrinol. 2022;18:96–110. doi: 10.1038/s41574-021-00593-z. [DOI] [PMC free article] [PubMed] [Google Scholar]
- 15.Shen S.Y., Xiao W.Q., Lu J.H., Yuan M.Y., He J.R., Xia H.M., Qiu X., Cheng K.K., Lam K.B.H. Early life vitamin D status and asthma and wheeze: a systematic review and meta-analysis. BMC Pulm. Med. 2018;18:120. doi: 10.1186/s12890-018-0679-4. [DOI] [PMC free article] [PubMed] [Google Scholar]
- 16.Wolsk H.M., Chawes B.L., Litonjua A.A., Hollis B.W., Waage J., Stokholm J., Bønnelykke K., Bisgaard H., Weiss S.T. Prenatal vitamin D supplementation reduces risk of asthma/recurrent wheeze in early childhood: A combined analysis of two randomized controlled trials. PLoS One. 2017;12 doi: 10.1371/journal.pone.0186657. [DOI] [PMC free article] [PubMed] [Google Scholar]
- 17.Hao M., Xu R., Luo N., Liu M., Xie J., Zhang W. The Effect of Vitamin D Supplementation in Children With Asthma: A Meta-Analysis. Front. Pediatr. 2022;10 doi: 10.3389/fped.2022.840617. [DOI] [PMC free article] [PubMed] [Google Scholar]
- 18.Ao T., Kikuta J., Ishii M. The Effects of Vitamin D on Immune System and Inflammatory Diseases. Biomolecules. 2021;11 doi: 10.3390/biom11111624. [DOI] [PMC free article] [PubMed] [Google Scholar]
- 19.Wobke T.K., Sorg B.L., Steinhilber D. Vitamin D in inflammatory diseases. Front. Physiol. 2014;5:244. doi: 10.3389/fphys.2014.00244. [DOI] [PMC free article] [PubMed] [Google Scholar]
- 20.Rueter K., Siafarikas A., Palmer D.J., Prescott S.L. Pre- and Postnatal Vitamin D Status and Allergy Outcomes in Early Childhood. Biomedicines. 2022;10 doi: 10.3390/biomedicines10050933. [DOI] [PMC free article] [PubMed] [Google Scholar]
- 21.von Essen M.R., Kongsbak M., Schjerling P., Olgaard K., Odum N., Geisler C. Vitamin D controls T cell antigen receptor signaling and activation of human T cells. Nat. Immunol. 2010;11:344–349. doi: 10.1038/ni.1851. [DOI] [PubMed] [Google Scholar]
- 22.Sanlier N., Guney-Coskun M. Vitamin D, the immune system, and its relationship with diseases. Egypt Pediatr. Asso. 2022;70 [Google Scholar]
- 23.Bikle D.D. Vitamin D Metabolism, Mechanism of Action, and Clinical Applications. Chem. Biol. 2014;21:319–329. doi: 10.1016/j.chembiol.2013.12.016. [DOI] [PMC free article] [PubMed] [Google Scholar]
- 24.Sirbe C., Rednic S., Grama A., Pop T.L. An Update on the Effects of Vitamin D on the Immune System and Autoimmune Diseases. Int. J. Mol. Sci. 2022;23:9784. doi: 10.3390/ijms23179784. [DOI] [PMC free article] [PubMed] [Google Scholar]
- 25.Lin R. Crosstalk between Vitamin D Metabolism, VDR Signalling, and Innate Immunity. BioMed Res. Int. 2016;2016 doi: 10.1155/2016/1375858. [DOI] [PMC free article] [PubMed] [Google Scholar]
- 26.Carlberg C. Vitamin D and Its Target Genes. Nutrients. 2022;14:1354. doi: 10.3390/nu14071354. [DOI] [PMC free article] [PubMed] [Google Scholar]
- 27.Young K., Beggs M.R., Grimbly C., Alexander R.T. Regulation of 1 and 24 hydroxylation of vitamin D metabolites in the proximal tubule. Exp. Biol. Med. 2022;247:1103–1111. doi: 10.1177/15353702221091982. [DOI] [PMC free article] [PubMed] [Google Scholar]
- 28.Bikle D., Christakos S. New aspects of vitamin D metabolism and action - addressing the skin as source and target. Nat. Rev. Endocrinol. 2020;16:234–252. doi: 10.1038/s41574-019-0312-5. [DOI] [PubMed] [Google Scholar]
- 29.Veldman C.M., Cantorna M.T., DeLuca H.F. Expression of 1,25-dihydroxyvitamin D(3) receptor in the immune system. Arch. Biochem. Biophys. 2000;374:334–338. doi: 10.1006/abbi.1999.1605. [DOI] [PubMed] [Google Scholar]
- 30.Fisher S.A., Rahimzadeh M., Brierley C., Gration B., Doree C., Kimber C.E., Plaza Cajide A., Lamikanra A.A., Roberts D.J. The role of vitamin D in increasing circulating T regulatory cell numbers and modulating T regulatory cell phenotypes in patients with inflammatory disease or in healthy volunteers: A systematic review. PLoS One. 2019;14 doi: 10.1371/journal.pone.0222313. [DOI] [PMC free article] [PubMed] [Google Scholar]
- 31.Litonjua A.A., Weiss S.T. Is vitamin D deficiency to blame for the asthma epidemic? J. Allergy Clin. Immunol. 2007;120:1031–1035. doi: 10.1016/j.jaci.2007.08.028. [DOI] [PubMed] [Google Scholar]
- 32.Jeffery L.E., Burke F., Mura M., Zheng Y., Qureshi O.S., Hewison M., Walker L.S.K., Lammas D.A., Raza K., Sansom D.M. 1,25-Dihydroxyvitamin D-3 and IL-2 Combine to Inhibit T Cell Production of Inflammatory Cytokines and Promote Development of Regulatory T Cells Expressing CTLA-4 and FoxP3. J. Immunol. 2009;183:5458–5467. doi: 10.4049/jimmunol.0803217. [DOI] [PMC free article] [PubMed] [Google Scholar]
- 33.Fekrmandi F., Wang T.T., White J.H. The hormone-bound vitamin D receptor enhances the FBW7-dependent turnover of NF-kappa B subunits. Sci. Rep. 2015;5 doi: 10.1038/srep13002. [DOI] [PMC free article] [PubMed] [Google Scholar]
- 34.Chauss D., Freiwald T., McGregor R., Yan B., Wang L., Nova-Lamperti E., Kumar D., Zhang Z., Teague H., West E.E., et al. Autocrine vitamin D signaling switches off pro-inflammatory programs of TH1 cells. Nat. Immunol. 2022;23:62–74. doi: 10.1038/s41590-021-01080-3. [DOI] [PMC free article] [PubMed] [Google Scholar]
- 35.Carlberg C. Vitamin D Signaling in the Context of Innate Immunity: Focus on Human Monocytes. Front. Immunol. 2019;10 doi: 10.3389/fimmu.2019.02211. [DOI] [PMC free article] [PubMed] [Google Scholar]
- 36.Martens P.J., Gysemans C., Verstuyf A., Mathieu A.C. Vitamin D's Effect on Immune Function. Nutrients. 2020;12 doi: 10.3390/nu12051248. [DOI] [PMC free article] [PubMed] [Google Scholar]
- 37.Handono K., Sidarta Y.O., Pradana B.A., Nugroho R.A., Hartono I.A., Kalim H., Endharti A.T. Vitamin D prevents endothelial damage induced by increased neutrophil extracellular traps formation in patients with systemic lupus erythematosus. Acta Med. Indones. 2014;46:189–198. [PubMed] [Google Scholar]
- 38.Fletcher J., Bishop E.L., Harrison S.R., Swift A., Cooper S.C., Dimeloe S.K., Raza K., Hewison M. Autoimmune disease and interconnections with vitamin D. Endocr. Connect. 2022;11 doi: 10.1530/EC-21-0554. [DOI] [PMC free article] [PubMed] [Google Scholar]
- 39.Adorini L., Penna G. Control of autoimmune diseases by the vitamin D endocrine system. Nat. Clin. Pract. Rheum. 2008;4:404–412. doi: 10.1038/ncprheum0855. [DOI] [PubMed] [Google Scholar]
- 40.Litonjua A.A., Lange N.E., Carey V.J., Brown S., Laranjo N., Harshfield B.J., O'Connor G.T., Sandel M., Strunk R.C., Bacharier L.B., et al. The Vitamin D Antenatal Asthma Reduction Trial (VDAART): rationale, design, and methods of a randomized, controlled trial of vitamin D supplementation in pregnancy for the primary prevention of asthma and allergies in children. Contemp. Clin. Trials. 2014;38:37–50. doi: 10.1016/j.cct.2014.02.006. [DOI] [PMC free article] [PubMed] [Google Scholar]
- 41.Sammallahti S., Holmlund-Suila E., Zou R., Valkama S., Rosendahl J., Enlund-Cerullo M., Hauta-Alus H., Lahti-Pulkkinen M., El Marroun H., Tiemeier H., et al. Prenatal maternal and cord blood vitamin D concentrations and negative affectivity in infancy. Eur. Child Adoles Psy. 2023;32:601–609. doi: 10.1007/s00787-021-01894-4. [DOI] [PMC free article] [PubMed] [Google Scholar]
- 42.Wang X., Jiao X., Tian Y., Zhang J., Zhang Y., Li J., Yang F., Xu M., Yu X., Shanghai Birth Cohort Study Associations between maternal vitamin D status during three trimesters and cord blood 25(OH)D concentrations in newborns: a prospective Shanghai birth cohort study. Eur. J. Nutr. 2021;60:3473–3483. doi: 10.1007/s00394-021-02528-w. [DOI] [PubMed] [Google Scholar]
- 43.Kennel K.A., Drake M.T., Hurley D.L. Vitamin D deficiency in adults: when to test and how to treat. Mayo Clin. Proc. 2010;85:752–758. doi: 10.4065/mcp.2010.0138. quiz 757-758. [DOI] [PMC free article] [PubMed] [Google Scholar]
- 44.The Gene Ontology Consortium The Gene Ontology Resource: 20 years and still GOing strong. Nucleic Acids Res. 2019;47:D330–D338. doi: 10.1093/nar/gky1055. [DOI] [PMC free article] [PubMed] [Google Scholar]
- 45.Qi Q., Liu Y., Cheng Y., Glanville J., Zhang D., Lee J.Y., Olshen R.A., Weyand C.M., Boyd S.D., Goronzy J.J. Diversity and clonal selection in the human T-cell repertoire. Proc. Natl. Acad. Sci. USA. 2014;111:13139–13144. doi: 10.1073/pnas.1409155111. [DOI] [PMC free article] [PubMed] [Google Scholar]
- 46.Shah K., Al-Haidari A., Sun J., Kazi J.U. T cell receptor (TCR) signaling in health and disease. Signal Transduct. Tar. 2021;6 doi: 10.1038/s41392-021-00823-w. [DOI] [PMC free article] [PubMed] [Google Scholar]
- 47.Lambrecht B.N., Hammad H., Fahy J.V. The Cytokines of Asthma. Immunity. 2019;50:975–991. doi: 10.1016/j.immuni.2019.03.018. [DOI] [PubMed] [Google Scholar]
- 48.Audrito V., Messana V.G., Brandimarte L., Deaglio S. The Extracellular NADome Modulates Immune Responses. Front. Immunol. 2021;12 doi: 10.3389/fimmu.2021.704779. [DOI] [PMC free article] [PubMed] [Google Scholar]
- 49.West E.E., Kemper C. Complosome - the intracellular complement system. Nat. Rev. Nephrol. 2023;19:426–439. doi: 10.1038/s41581-023-00704-1. [DOI] [PMC free article] [PubMed] [Google Scholar]
- 50.Nguyen G.T., Green E.R., Mecsas J. Neutrophils to the ROScue: Mechanisms of NADPH Oxidase Activation and Bacterial Resistance. Front. Cell. Infect. Microbiol. 2017;7:373. doi: 10.3389/fcimb.2017.00373. [DOI] [PMC free article] [PubMed] [Google Scholar]
- 51.Kanehisa M., Furumichi M., Sato Y., Kawashima M., Ishiguro-Watanabe M. KEGG for taxonomy-based analysis of pathways and genomes. Nucleic Acids Res. 2023;51:D587–D592. doi: 10.1093/nar/gkac963. [DOI] [PMC free article] [PubMed] [Google Scholar]
- 52.Hogan P.G., Lewis R.S., Rao A. Molecular Basis of Calcium Signaling in Lymphocytes: STIM and ORAI. Annu. Rev. Immunol. 2010;28:491–533. doi: 10.1146/annurev.immunol.021908.132550. [DOI] [PMC free article] [PubMed] [Google Scholar]
- 53.Subramaniam T., Fauzi M.B., Lokanathan Y., Law J.X. The Role of Calcium in Wound Healing. Int. J. Mol. Sci. 2021;22 doi: 10.3390/ijms22126486. [DOI] [PMC free article] [PubMed] [Google Scholar]
- 54.Xue M., Jackson C.J. Extracellular Matrix Reorganization During Wound Healing and Its Impact on Abnormal Scarring. Adv. Wound Care. 2015;4:119–136. doi: 10.1089/wound.2013.0485. [DOI] [PMC free article] [PubMed] [Google Scholar]
- 55.Ogawa Y., Duru E.A., Ameredes B.T. Role of IL-10 in the resolution of airway inflammation. Curr. Mol. Med. 2008;8:437–445. doi: 10.2174/156652408785160907. [DOI] [PMC free article] [PubMed] [Google Scholar]
- 56.Smith L.K., Boukhaled G.M., Condotta S.A., Mazouz S., Guthmiller J.J., Vijay R., Butler N.S., Bruneau J., Shoukry N.H., Krawczyk C.M., Richer M.J. Interleukin-10 Directly Inhibits CD8(+) T Cell Function by Enhancing N-Glycan Branching to Decrease Antigen Sensitivity. Immunity. 2018;48:299–312.e5. doi: 10.1016/j.immuni.2018.01.006. [DOI] [PMC free article] [PubMed] [Google Scholar]
- 57.Oh S.A., Li M.O. TGF-beta: guardian of T cell function. J. Immunol. 2013;191:3973–3979. doi: 10.4049/jimmunol.1301843. [DOI] [PMC free article] [PubMed] [Google Scholar]
- 58.Yoshimura A., Wakabayashi Y., Mori T. Cellular and molecular basis for the regulation of inflammation by TGF-beta. J. Biochem. 2010;147:781–792. doi: 10.1093/jb/mvq043. [DOI] [PMC free article] [PubMed] [Google Scholar]
- 59.Yu X., Harden K., Gonzalez L.C., Francesco M., Chiang E., Irving B., Tom I., Ivelja S., Refino C.J., Clark H., et al. The surface protein TIGIT suppresses T cell activation by promoting the generation of mature immunoregulatory dendritic cells. Nat. Immunol. 2009;10:48–57. doi: 10.1038/ni.1674. [DOI] [PubMed] [Google Scholar]
- 60.Joller N., Hafler J.P., Brynedal B., Kassam N., Spoerl S., Levin S.D., Sharpe A.H., Kuchroo V.K. Cutting Edge: TIGIT Has T Cell-Intrinsic Inhibitory Functions. J. Immunol. 2011;186:1338–1342. doi: 10.4049/jimmunol.1003081. [DOI] [PMC free article] [PubMed] [Google Scholar]
- 61.Khan M.A. Regulatory T cells mediated immunomodulation during asthma: a therapeutic standpoint. J. Transl. Med. 2020;18 doi: 10.1186/s12967-020-02632-1. [DOI] [PMC free article] [PubMed] [Google Scholar]
- 62.Kongsbak M., Levring T.B., Geisler C., von Essen M.R. The vitamin d receptor and T cell function. Front. Immunol. 2013;4:148. doi: 10.3389/fimmu.2013.00148. [DOI] [PMC free article] [PubMed] [Google Scholar]
- 63.Wynn M.L., Consul N., Merajver S.D., Schnell S. Logic-based models in systems biology: a predictive and parameter-free network analysis method. Integr. Biol. 2012;4:1323–1337. doi: 10.1039/c2ib20193c. [DOI] [PMC free article] [PubMed] [Google Scholar]
- 64.Cole D.K., Laugel B., Clement M., Price D.A., Wooldridge L., Sewell A.K. The molecular determinants of CD8 co-receptor function. Immunology. 2012;137:139–148. doi: 10.1111/j.1365-2567.2012.03625.x. [DOI] [PMC free article] [PubMed] [Google Scholar]
- 65.Walker J.A., Mckenzie A.N.J. TH2 cell development and function. Nat. Rev. Immunol. 2018;18:121–133. doi: 10.1038/nri.2017.118. [DOI] [PubMed] [Google Scholar]
- 66.Golstein P., Griffiths G.M. An early history of T cell-mediated cytotoxicity. Nat. Rev. Immunol. 2018;18:527–535. doi: 10.1038/s41577-018-0009-3. [DOI] [PubMed] [Google Scholar]
- 67.Voskoboinik I., Smyth M.J., Trapani J.A. Perforin-mediated target-cell death and immune homeostasis. Nat. Rev. Immunol. 2006;6:940–952. doi: 10.1038/nri1983. [DOI] [PubMed] [Google Scholar]
- 68.Lee J.M., Smith J.R., Philipp B.L., Chen T.C., Mathieu J., Holick M.F. Vitamin D deficiency in a healthy group of mothers and newborn infants. Clin. Pediatr. 2007;46:42–44. doi: 10.1177/0009922806289311. [DOI] [PubMed] [Google Scholar]
- 69.Brehm J.M., Celedón J.C., Soto-Quiros M.E., Avila L., Hunninghake G.M., Forno E., Laskey D., Sylvia J.S., Hollis B.W., Weiss S.T., Litonjua A.A. Serum vitamin D levels and markers of severity of childhood asthma in Costa Rica. Am. J. Respir. Crit. Care Med. 2009;179:765–771. doi: 10.1164/rccm.200808-1361OC. [DOI] [PMC free article] [PubMed] [Google Scholar]
- 70.Sanguesa J., Sunyer J., Garcia-Esteban R., Abellan A., Esplugues A., Garcia-Aymerich J., Guxens M., Irizar A., Júlvez J., Luque-García L., et al. Prenatal and child vitamin D levels and allergy and asthma in childhood. Pediatr. Res. 2022;93:1745–1751. doi: 10.1038/s41390-022-02256-9. [DOI] [PubMed] [Google Scholar]
- 71.Erkkola M., Kaila M., Nwaru B.I., Kronberg-Kippilä C., Ahonen S., Nevalainen J., Veijola R., Pekkanen J., Ilonen J., Simell O., et al. Maternal vitamin D intake during pregnancy is inversely associated with asthma and allergic rhinitis in 5-year-old children. Clin. Exp. Allergy. 2009;39:875–882. doi: 10.1111/j.1365-2222.2009.03234.x. [DOI] [PubMed] [Google Scholar]
- 72.Morales E., Romieu I., Guerra S., Ballester F., Rebagliato M., Vioque J., Tardón A., Rodriguez Delhi C., Arranz L., Torrent M., et al. Maternal Vitamin D Status in Pregnancy and Risk of Lower Respiratory Tract Infections, Wheezing, and Asthma in Offspring. Epidemiology. 2012;23:64–71. doi: 10.1097/EDE.0b013e31823a44d3. [DOI] [PubMed] [Google Scholar]
- 73.Pacheco-Gonzalez R.M., Garcia-Marcos L., Morales E. Prenatal vitamin D status and respiratory and allergic outcomes in childhood: A meta-analysis of observational studies. Pediatr. Allergy Immunol. 2018;29:243–253. doi: 10.1111/pai.12876. [DOI] [PubMed] [Google Scholar]
- 74.Wang J. Neutrophils in tissue injury and repair. Cell Tissue Res. 2018;371:531–539. doi: 10.1007/s00441-017-2785-7. [DOI] [PMC free article] [PubMed] [Google Scholar]
- 75.Chen F., Yu M., Zhong Y., Wang L., Huang H. Characteristics and Role of Neutrophil Extracellular Traps in Asthma. Inflammation. 2022;45:6–13. doi: 10.1007/s10753-021-01526-8. [DOI] [PMC free article] [PubMed] [Google Scholar]
- 76.Moretti L., Stalfort J., Barker T.H., Abebayehu D. The interplay of fibroblasts, the extracellular matrix, and inflammation in scar formation. J. Biol. Chem. 2022;298 doi: 10.1016/j.jbc.2021.101530. [DOI] [PMC free article] [PubMed] [Google Scholar]
- 77.Mahn K., Ojo O.O., Chadwick G., Aaronson P.I., Ward J.P.T., Lee T.H. Ca(2+) homeostasis and structural and functional remodelling of airway smooth muscle in asthma. Thorax. 2010;65:547–552. doi: 10.1136/thx.2009.129296. [DOI] [PubMed] [Google Scholar]
- 78.Hess N.J., Turicek D.P., Riendeau J., McIlwain S.J., Contreras Guzman E., Nadiminti K., Hudson A., Callander N.S., Skala M.C., Gumperz J.E., et al. Inflammatory CD4/CD8 double-positive human T cells arise from reactive CD8 T cells and are sufficient to mediate GVHD pathology. Sci. Adv. 2023;9 doi: 10.1126/sciadv.adf0567. [DOI] [PMC free article] [PubMed] [Google Scholar]
- 79.Overgaard N.H., Jung J.W., Steptoe R.J., Wells J.W. CD4(+)/CD8(+) double-positive T cells: more than just a developmental stage? J. Leukoc. Biol. 2015;97:31–38. doi: 10.1189/jlb.1RU0814-382. [DOI] [PubMed] [Google Scholar]
- 80.Nascimbeni M., Shin E.C., Chiriboga L., Kleiner D.E., Rehermann B. Peripheral CD4(+)CD8(+) T cells are differentiated effector memory cells with antiviral functions. Blood. 2004;104:478–486. doi: 10.1182/blood-2003-12-4395. [DOI] [PubMed] [Google Scholar]
- 81.Clenet M.L., Gagnon F., Moratalla A.C., Viel E.C., Arbour N. Peripheral human CD4(+)CD8(+) T lymphocytes exhibit a memory phenotype and enhanced responses to IL-2, IL-7 and IL-15. Sci. Rep. 2017;7 doi: 10.1038/s41598-017-11926-2. [DOI] [PMC free article] [PubMed] [Google Scholar]
- 82.Choi S.M., Park H.J., Choi E.A., Jung K.C., Lee J.I. Cellular heterogeneity of circulating CD4(+)CD8(+) double-positive T cells characterized by single-cell RNA sequencing. Sci. Rep. 2021;11 doi: 10.1038/s41598-021-03013-4. [DOI] [PMC free article] [PubMed] [Google Scholar]
- 83.Waschbisch A., Sammet L., Schröder S., Lee D.H., Barrantes-Freer A., Stadelmann C., Linker R.A. Analysis of CD4(+)CD8(+) double-positive T cells in blood, cerebrospinal fluid and multiple sclerosis lesions. Clin. Exp. Immunol. 2014;177:404–411. doi: 10.1111/cei.12345. [DOI] [PMC free article] [PubMed] [Google Scholar]
- 84.Nguyen P., Melzer M., Beck F., Krasselt M., Seifert O., Pierer M., Rothe K., Wagner U. Expansion of CD4(+)CD8(+) double-positive T cells in rheumatoid arthritis patients is associated with erosive disease. Rheumatology. 2022;61:1282–1287. doi: 10.1093/rheumatology/keab551. [DOI] [PubMed] [Google Scholar]
- 85.Quandt D., Rothe K., Scholz R., Baerwald C.W., Wagner U. Peripheral CD4CD8 Double Positive T Cells with a Distinct Helper Cytokine Profile Are Increased in Rheumatoid Arthritis. PLoS One. 2014;9 doi: 10.1371/journal.pone.0093293. [DOI] [PMC free article] [PubMed] [Google Scholar]
- 86.Ugarte-Gil M.F., Sánchez-Zúñiga C., Gamboa-Cárdenas R.V., Aliaga-Zamudio M., Zevallos F., Tineo-Pozo G., Cucho-Venegas J.M., Mosqueira-Riveros A., Medina M., Perich-Campos R.A., et al. Circulating CD4+CD28null and extra-thymic CD4+CD8+double positive T cells are independently associated with disease damage in systemic lupus erythematosus patients. Lupus. 2016;25:233–240. doi: 10.1177/0961203315604910. [DOI] [PubMed] [Google Scholar]
- 87.Chang K., Na W., Liu C., Xu H., Liu Y., Wang Y., Jiang Z. Peripheral CD4+CD8+ double positive T cells: A potential marker to evaluate renal impairment susceptibility during systemic lupus erythematosus. J. Biomed. Res. 2022;37:59–68. doi: 10.7555/JBR.36.20220094. [DOI] [PMC free article] [PubMed] [Google Scholar]
- 88.Hilvering B., Hinks T.S.C., Stöger L., Marchi E., Salimi M., Shrimanker R., Liu W., Chen W., Luo J., Go S., et al. Synergistic activation of pro-inflammatory type-2 CD8(+) T lymphocytes by lipid mediators in severe eosinophilic asthma. Mucosal Immunol. 2018;11:1408–1419. doi: 10.1038/s41385-018-0049-9. [DOI] [PMC free article] [PubMed] [Google Scholar]
- 89.Doeing D.C., Solway J. Airway smooth muscle in the pathophysiology and treatment of asthma. J. Appl. Physiol. 2013;114:834–843. doi: 10.1152/japplphysiol.00950.2012. [DOI] [PMC free article] [PubMed] [Google Scholar]
- 90.Sakai Y., Kishimoto J., Demay M.B. Metabolic and cellular analysis of alopecia in vitamin D receptor knockout mice. J. Clin. Investig. 2001;107:961–966. doi: 10.1172/JCI11676. [DOI] [PMC free article] [PubMed] [Google Scholar]
- 91.Weiss S.T., Mirzakhani H., Carey V.J., O'Connor G.T., Zeiger R.S., Bacharier L.B., Stokes J., Litonjua A.A. Prenatal vitamin D supplementation to prevent childhood asthma: 15-year results from the Vitamin D Antenatal Asthma Reduction Trial (VDAART) J. Allergy Clin. Immunol. 2024;153:378–388. doi: 10.1016/j.jaci.2023.10.003. [DOI] [PMC free article] [PubMed] [Google Scholar]
- 92.Watanabe H., Numata K., Ito T., Takagi K., Matsukawa A. Innate immune response in Th1- and Th2-dominant mouse strains. Shock. 2004;22:460–466. doi: 10.1097/01.shk.0000142249.08135.e9. [DOI] [PubMed] [Google Scholar]
- 93.Litonjua A.A., Carey V.J., Laranjo N., Harshfield B.J., McElrath T.F., O'Connor G.T., Sandel M., Iverson R.E., Jr., Lee-Paritz A., Strunk R.C., et al. Effect of Prenatal Supplementation With Vitamin D on Asthma or Recurrent Wheezing in Offspring by Age 3 Years: The VDAART Randomized Clinical Trial. JAMA. 2016;315:362–370. doi: 10.1001/jama.2015.18589. [DOI] [PMC free article] [PubMed] [Google Scholar]
- 94.Kilic A., Santolini M., Nakano T., Schiller M., Teranishi M., Gellert P., Ponomareva Y., Braun T., Uchida S., Weiss S.T., et al. A systems immunology approach identifies the collective impact of 5 miRs in Th2 inflammation. JCI Insight. 2018;3:e97503. doi: 10.1172/jci.insight.97503. [DOI] [PMC free article] [PubMed] [Google Scholar]
- 95.Kilic A., Halu A., De Marzio M., Maiorino E., Duvall M.G., Bruggemann T.R., Rojas Quintero J.J., Chase R., Mirzakhani H., Sungur A.Ö., et al. Vitamin D constrains inflammation by modulating the expression of key genes on Chr17q12-21.1. Elife. 2024;12:RP89270. doi: 10.7554/eLife.89270. [DOI] [PMC free article] [PubMed] [Google Scholar]
- 96.Ngwa J., Wojciechowski R., Zack D.J., Beaty T., Ruczinski I. Differential Expression Analysis of Gene and Transcript Abundance for Single Cell RNA-Seq Data using STAR and HISAT Aligners. Invest. Ophth. Vis. Sci. 2017;58:1850. [Google Scholar]
- 97.Anders S., Pyl P.T., Huber W. HTSeq-a Python framework to work with high-throughput sequencing data. Bioinformatics. 2015;31:166–169. doi: 10.1093/bioinformatics/btu638. [DOI] [PMC free article] [PubMed] [Google Scholar]
- 98.Munoz-Torres M., Carbon S. Get GO! Retrieving GO Data Using AmiGO, QuickGO, API, Files, and Tools. Methods Mol. Biol. 2017;1446:149–160. doi: 10.1007/978-1-4939-3743-1_11. [DOI] [PubMed] [Google Scholar]
- 99.Rianne Fijten A.K., Kim de N., Kutmon M., Pico A., Ehrhart F., Hanspers K., Willighagen E., Weitz E. WikiPathways; 2021. Vitamin D Receptor Pathway (Homo sapiens) PW:0001013. [Google Scholar]
- 100.Ashburner M., Ball C.A., Blake J.A., Botstein D., Butler H., Cherry J.M., Davis A.P., Dolinski K., Dwight S.S., Eppig J.T., et al. Gene ontology: tool for the unification of biology. The Gene Ontology Consortium. Nat. Genet. 2000;25:25–29. doi: 10.1038/75556. [DOI] [PMC free article] [PubMed] [Google Scholar]
- 101.Gene Ontology Consortium, Aleksander S.A., Balhoff J., Carbon S., Cherry J.M., Drabkin H.J., Ebert D., Feuermann M., Gaudet P., Harris N.L., et al. The Gene Ontology knowledgebase in 2023. Genetics. 2023;224 doi: 10.1093/genetics/iyad031. [DOI] [PMC free article] [PubMed] [Google Scholar]
Associated Data
This section collects any data citations, data availability statements, or supplementary materials included in this article.
Supplementary Materials
Neonatal characteristics, stratified by low Vit-D (< 25 ng/mL, N = 62) and high Vit-D (≥ 25 ng/mL, N = 35) groups, include gender, race, ethnicity, and the site of cord blood collection. Samples were collected from three clinical sites: Kaiser Permanente Southern California Region (San Diego, CA), Boston Medical Center, and Washington University in St. Louis.
Genes significantly upregulated or downregulated in cord blood from the high Vit-D group (≥ 25 ng/mL, N = 35) compared to the low Vit-D group (< 25 ng/mL, N = 62) were identified using limma (FDR < 0.05, FC > 1.5).
Enriched GO terms were identified using clusterProfiler with the Benjamini-Hochberg method (FDR < 0.01). Cellular Component terms were identified for upregulated DEGs associated with Vit-D sufficiency, while Biological Process, Cellular Component, and Molecular Function terms were identified for downregulated DEGs associated with gestational Vit-D deficiency.
Genes significantly upregulated or downregulated in TH2 cells following calcitriol treatment, compared to WT TH2 cells, were identified using limma (FC > 1.5, FDR < 0.01).
Enriched GO Biological Process annotations were identified for upregulated and downregulated DEGs in calcitriol-stimulated TH2 cells using clusterProfiler with the Benjamini-Hochberg method (FDR < 0.05).
This table defines the Boolean state transition rules used to model the regulatory interactions of Calcitriol, PMCA, and CYP24A1 in TH2 cell signaling. Nodes represent molecular entities whose activation or inhibition is determined by logical operators (AND, OR, NOT) based on curated pathway interactions. Binary states (ON = 1, OFF = 0) were assigned to each input node across four experimental conditions: (I) Absence of 1,25-Vit-D signaling (Calcitriol = OFF), (II) Active Calcitriol with inactive PMCA (disrupted calcium extrusion), (III) Active Calcitriol and PMCA (normal calcium homeostasis), and (IV) Active Calcitriol and CYP24A1 (Vitamin D catabolism). State transition logic for each node defines how upstream regulators influence downstream molecular components. Simulations were performed iteratively until a steady state was reached, modeling the dynamic effects of Vit-D signaling on TH2 cell function.
Genes with significant differential expression (FDR < 0.01, FC > 3) in Vit-D-deficient TH2 cells were identified using limma with Benjamini-Hochberg correction.
Enriched Biological Process, Cellular Component, and Molecular Function annotations for upregulated DEGs in Vit-D-deficient TH2 cells were identified using clusterProfiler with the Benjamini-Hochberg method (FDR < 0.05).
Data Availability Statement
-
•
All relevant data are included in the paper and its Supplemental Information files. The VDAART Study data are available from the clinicaltrials.gov (NCT00920621). Mouse RNA-seq data are available in NCBI’s GEO repository under accession numbers GSE282941 (calcitriol-treated TH2 cells) and GSE283020 (Vit-D-deficient TH2 cells).
-
•
Code used for data analysis is available at https://github.com/vrushali-broad/Vit-D-Modulation.
-
•
Any additional information required for reanalysis of the data reported in this study is available from the lead contact upon reasonable request.