

Abstract
The kinetic mechanism of epoxide hydrolase (EC 3.3.2.3) from potato, StEH1 (Solanum tuberosum epoxide hydrolase 1), was studied by presteady-state and steady-state kinetics as well as by pH dependence of activity. The specific activities towards the different enantiomers of TSO (trans-stilbene oxide) as substrate were 43 and 3 μmol·min−1·mg−1 with the R,R- or S,S-isomers respectively. The enzyme was, however, enantioselective in favour of the S,S enantiomer due to a lower Km value. The pH dependences of kcat with R,R or S,S-TSO were also distinct and supposedly reflecting the pH dependences of the individual kinetic rates during substrate conversion. The rate-limiting step for TSO and cis- and trans-epoxystearate was shown by rapid kinetic measurements to be the hydrolysis of the alkylenzyme intermediate. Functional characterization of point mutants verified residues Asp105, Tyr154, Tyr235 and His300 as crucial for catalytic activity. All mutants displayed drastically decreased enzymatic activities during steady state. Presteady-state measurements revealed the base-deficient H300N (His300→Asn) mutant to possess greatly reduced efficiencies in catalysis of both chemical steps (alkylation and hydrolysis).
Keywords: active site, catalysis, epoxide hydrolase, rapid kinetics, StEH1, trans-stilbene oxide
Abbreviations: NPEP, 1,2-epoxy-3-(4-nitrophenoxy) propane; 4-NSO, 4-nitro styrene oxide; PO, phenanthrene-9,10-oxide; TSO, trans-stilbene oxide; R,R-TSO, R,R-trans-stilbene oxide; StEH1, Solanum tuberosum epoxide hydrolase 1
INTRODUCTION
Epoxide hydrolases (EC 3.3.2.3) catalyse the hydrolysis of epoxides producing the corresponding vicinal diols. These enzymes are found in various species of mammals, insects, fungi, bacteria and plants. In plants, epoxide hydrolase activities have been detected in e.g. mouse ear cress, spinach, soya bean, rape, tobacco and potato [1–8]. A suggested physiological role of the plant enzymes is through their involvement in the epoxide fatty acid metabolism and biosynthetic pathway of cutin [9]. The reaction mechanism of epoxide hydrolases from mammalian [10–12] and bacterial [13,14] sources have been thoroughly investigated through mutagenesis studies, kinetic analyses and solved three-dimensional structures of enzyme representatives from mouse [15], human [16], Agrobacterium radiobacter AD1 [17] and Aspergillus niger [18] (see [19] for a recent review). The canonical epoxide hydrolases belong to the structural class of α/β hydrolase fold enzymes. Although heterogeneous, this group of enzymes share features regarding overall structural fold as well as active-site architecture [20]. The enzyme active site contains a protein-derived nucleophilic group (aspartic acid) that has been shown in mammalian epoxide hydrolases to attack an electrophilic carbon of the bound substrate to form an alkylated enzyme intermediate [21,22]. A nearby acid (tyrosine phenol) facilitates ring opening of the oxirane oxygen [12,14]. The catalytic cycle is concluded by a subsequent nucleophilic attack on the alkylenzyme by solvent water activated by a histidine general base, linked to an assisting charge-relay residue (a carboxylate) and release of the diol product. A working model of the mechanism of enzyme-catalysed epoxide hydrolysis is illustrated in Scheme 1: where E is the enzyme, P the reaction product, S the substrate and ES, ES′ and EP the enzyme–substrate, alkylenzyme and enzyme–product complexes, respectively.
Scheme 1.

Although the majority of studies of the different aspects of function and mechanism have been carried out on mammalian and microbial epoxide hydrolases, limited information for plant enzymes is available. A fatty acid epoxide hydrolase from soya bean has been characterized and shown to be highly enantioselective with 9,10-epoxystearate as substrate [23–25]. Two other plant epoxide hydrolases, from cress and potato, displayed broad substrate specificity and were proposed to hydrolyse epoxides in a two-step chemical mechanism analogous to their mammalian counterparts [26].
In order to verify similarities and differences in functions and roles between plant and mammalian epoxide hydrolases, we have analysed the catalytic function during steady-state and presteady-state conditions of an epoxide hydrolase from potato, StEH1 (Solanum tuberosum epoxide hydrolase 1). An Escherichia coli expression system followed by a simple two-step protein purification facilitated the production of adequate amounts of C-terminally His5-tagged enzyme. The kinetic properties of recombinant StEH1-5H regarding substrate specificity, enantioselectivity and pH dependence have thus been characterized. Moreover, four candidate catalytic residues, Asp105, Tyr154, Tyr235 and His300, have been mutated into residues with non-ionizable functional groups in order to probe their suggested involvement in catalysis [26]. To improve on the understanding concerning the basis of the enantioselectivity as well as the contribution of catalytic residues, the kinetics during presteady state of wild-type and acid- or base-deficient mutant enzymes have been studied in more detail. This has allowed for a description of the ingoing catalytic steps, and assignment of roles for catalytic acids and base residues.
EXPERIMENTAL
Subcloning of potato epoxide hydrolase StEH1
The cDNA for potato soluble epoxide hydrolase was a gift from Professor M. Arand (Institut für Pharmakologie und Toxikologie, Zürich, Switzerland). The encoded protein is identical to GenBank® entry gi|7489254| [6], except for a G to A transition in nucleotide one of the first codon, resulting in a glutamic acid to lysine replacement. The protein is hereafter denoted as StEH1 in accordance with the naming of other plant epoxide hydrolases. The coding region of the StEH1 cDNA was amplified by PCR and ligated into the XhoI and SpeI sites of pGTDhlA-5H [27]. The plasmid construct was named pGTacStEH1-5H.
Site-directed mutagenesis of StEH1-5H
The mutants D105A (Asp105→Ala; GAC to GCC), H300A (CAC to GCC), H300N (CAC to AAC), H300Q (CAC to CAG), Y154F (TAT to TTC) and Y235F (TAC to TTC) were constructed by PCR-afforded mutagenesis using mutagenic primers. The PCR products were subcloned into pGTacStEH1-5H at appropriate restriction sites. All DNA constructs were sequenced in full.
Heterologous expression of wild-type and mutant forms of StEH-5H
Expression plasmids (pGTacStEH1-5H or mutant derivatives) were transformed into E. coli XL1-Blue by electroporation. A 15 ml culture of transformed cells grown at 30 °C overnight in 2TY [1% (w/v) tryptone, 1.6% (w/v) yeast extract and 0.5% (w/v) NaCl] fortified with 100 μg·ml−1 ampicillin, was used to inoculate 1.5 litres of 2TY medium containing 50 μg/ml ampicillin. The culture was grown at 30 °C until reaching a cell density corresponding to an A600 of 0.3, when 1 mM isopropyl β-D-thiogalactopyranoside was added. Incubation was continued for 17–20 h. Cells were collected by centrifugation at 5000 g for 15 min and subsequently resuspended in buffer A [10 mM sodium phosphate (pH 7.0) and 0.02% (w/v) sodium azide] with added protease inhibitor (Complete Mini EDTA-free). The resuspended cells were frozen and kept at −80 °C until purification of expressed protein. Bacterial lysate was prepared by ultrasonication of thawed cell suspension using a Vibra Cell Sonifier at power setting 7.5 for 3×30 s pulses interrupted by 30 s cooling at 0 °C. Insoluble debris was sedimented by centrifugation at 30000 g for 20 min.
Protein purification
The salt composition of E. coli lysate was adjusted by gel filtration chromatography on a Sephadex G-25 column equilibrated with buffer B (20 mM imidazole, 0.5 M NaCl and 10 mM sodium phosphate, pH 7.0). The protein-containing pool was added to a chelating Sepharose fast flow column equilibrated with buffer B and preloaded with Ni(II) ions. Weakly adsorbed proteins were washed off by a stepwise increase in imidazole concentration (50 and 100 mM in buffer B). Tightly bound proteins were eluted with 300 mM imidazole in buffer B. Eluted protein-containing fractions were pooled and concentrated to 2 ml by ultrafiltration. The concentrate was loaded on to HiPrep Sephacryl S-200 (16/60) column equilibrated with 0.1 M sodium phosphate (pH 7.4). Purity of eluted StEH1-5H was determined by SDS/PAGE stained with Coomassie Brilliant Blue R-250. Pure protein was stored at 4 °C and was stable for at least 4 months as judged from activity measurements. The enzyme concentration was determined by the UV absorbance at 280 nm using a molar absorbance coefficient (ϵ) of 59030 M−1·cm−1, calculated from the amino acid composition. The native size of the protein was determined by size exclusion chromatography on a Sephacryl S-200 column in the presence of marker proteins.
Enzyme assays
Epoxide hydrolase activity
The activity during the steady state was measured spectrophotometrically in 0.1 M sodium phosphate (pH 6.8) at 30 °C unless otherwise stated. Substances (Table 1) were dissolved in acetonitrile and added to reaction mixtures at a final concentration of 1% (v/v) acetonitrile. All compounds were commercially available unless stated otherwise and were of highest purity available. Hydrolysis of R,R-TSO (R,R-trans-stilbene oxide), S,S-TSO and racemic TSO were recorded as a decrease in absorption at 229 nm (Δϵ=−15 mM−1·cm−1) [28]. R,R-TSO and S,S-TSO were gifts from Dr P. I. Arvidsson, Department of Chemistry, Uppsala University. Hydrolysis of racemic 4-NSO (4-nitro styrene oxide) was recorded at 310 nm (Δϵ=−1 mM−1·cm−1) [29]. PO (phenanthrene 9,10-oxide) hydrolysis was assayed by following a decrease in absorbance at 290 nm (Δϵ=−5.25 mM−1·cm−1) [30]. PO was a gift from Dr A. Seidel (Professor Dr Gernot Grimmer-Foundation, Grosshansdorf, Germany). Hydrolysis of racemic 4-NPEP [1,2-epoxy-3-(4-nitrophenoxy) propane] was followed at 302 nm (Δϵ=−1.5 mM−1·cm−1) [29]. [14C]9,10-Epoxystearic acid was synthesized as described by Gardner and Hamberg [31]. Activity measurements of cis- and trans-9,10-epoxystearic acid were performed with a constant concentration of [14C]9,10-epoxystearic acid and varying concentrations of unlabelled cis- and trans-epoxide dissolved in ethanol to a final concentrations of 3% (v/v) ethanol. Samples were terminated by the addition of 1 vol. of acetonitrile and separated on a TLC plate in n-hexane/diethyl ether/acetic acid (70:29:1, by vol.). The fractions of diol and epoxide were analysed by phosphor-imaging.
Table 1. Substrate specificity of wild-type StEH1-5H.
The rate of wild-type StEH1-5H activity was measured in 0.1 M sodium phosphate (pH 7.4) in the presence of either 20 μM R,R-TSO, S,S-TSO, racemic (rac) TSO, 200 μM 4-NSO, 100 μM PO, 500 μM 4-NPEP and 10 μM cis- or trans-9,10-epoxystearate.
| Substrate | Structure | Measured rate (μmol·min−1·mg−1) |
|---|---|---|
| R,R-TSO | 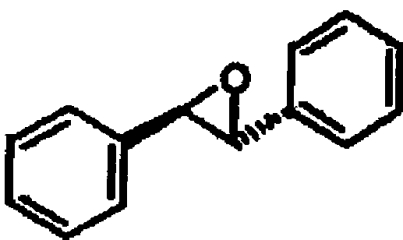 |
43±4 |
| S,S-TSO | 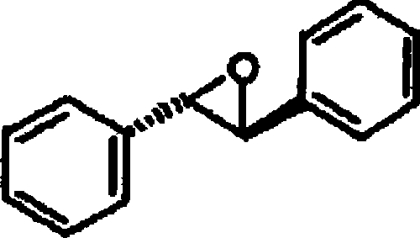 |
2.7±0.6 |
| rac-TSO | 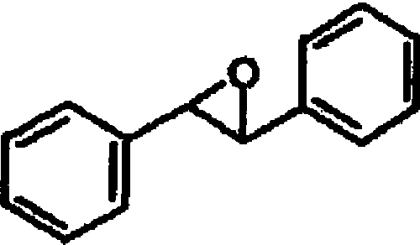 |
6.1±0.3 |
| rac-4-NSO | 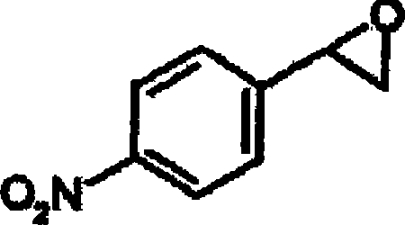 |
1.6±0.1 |
| PO | 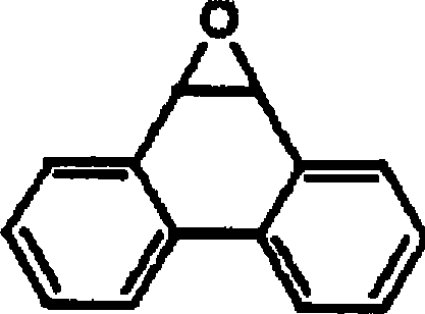 |
<0.002 |
| rac-4-NPEP | 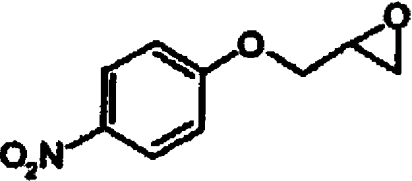 |
<0.002 |
| rac-cis-9,10-epoxystearate |  |
0.15 |
| rac-trans-9,10-epoxystearate |  |
0.15 |
Substrate saturation kinetics
Initial rates were recorded during steady state in the presence of R,R-TSO (5–40 μM), S,S-TSO (0.25–20 μM), racemic TSO (0.25–20 μM) and 4-NSO (20–200 μM). Kinetic parameters kcat and Km were extracted after fitting the Michaelis–Menten equation by nonlinear regression to the experimental data using the program MMFIT in the SIMFIT package (url:http://www.simfit.man.ac.uk). The specificity constants, kcat/Km, were extracted using RFFIT in the same program package after fitting eqn (1) to the determined initial rates.
 |
(1) |
Presteady-state kinetics
Kinetics was studied using an SX.18MV sequential stopped-flow spectrophotometer detecting either the transient change in intrinsic Trp fluorescence (excitation wavelength 290 nm) or by following the TSO hydrolysis measured as a decrease in absorbance at 229 nm. The fluorescence emission was recorded after passage through a 320 nm cut-off filter. Apparent rate constants were derived by fitting a single exponential, F=A exp (−kobst)+C, in which A is the amplitude of fluorescence change, kobs the observed rate constant and C the floating end point of the progression curve (average of 8–14 traces). Kinetic rate constants for steps up to enzyme alkylation were extracted after fitting eqn (2a) [32] or eqn (2b) using QNFIT in the SIMFIT package, for substrate saturation dependence, or eqn (2c) when no substrate saturation was reached (KS≫[S]). To discriminate between models for parameter extraction, F-tests were performed using the SIMSTAT program in the SIMFIT package. Association/dissociation rates of ES were assumed to be substantially faster than the chemical steps.
 |
(2a) |
 |
(2b) |
 |
(2c) |
The rate of hydrolysis, k3, was determined in single-turnover experiments by mixing equimolar amounts of enzyme and substrate (5–10 μM) and following the fluorescence recovery after the alkylation step. k3 was extracted from F=A exp(−k3t)+C.
Enzyme inhibition assays
The inhibition by meso-hydrobenzoin was determined in the presence of either 20 μM R,R-TSO or 5 μM S,S-TSO and 0–1.25 mM meso-hydrobenzoin in 0.1 M sodium phosphate (pH 6.8). The inhibitor concentration resulting in a 50% decrease in enzyme activity was defined as the IC50.
pH dependence of catalysis
Steady-state kinetic parameters for the different TSO enantiomers were determined from the catalysed initial rates in the following buffers: pH 4.5–6.3, 0.1 M sodium acetate; pH 6.3–8, 0.1 M sodium phosphate; pH 8–9.5, 0.1 M Tris/HCl. Equation (3) [32] was fitted to the determined kcat/Km and kcat values to extract pKa values. LH is the pH-dependent kinetic parameter, LH2A, LHA and LA are the amounts of the different protonation states of the reactant (free enzyme or enzyme–substrate complexes) and Ka1 and Ka2 the respective acid constants.
 |
(3) |
RESULTS
Protein expression and purification
In order to investigate the catalytic properties of StEH1 and to probe the role of proposed catalytic residues, expression plasmids for E. coli production of His-tagged wild-type and D105A, Y154F, Y235F, Y154F/Y235F, H300A, H300N and H300Q mutants were constructed. From the three-dimensional structure of StEH1-5H (S. Mowbray, Swedish University of Agricultural Sciences, Uppsala, Sweden), electron density for residues 3–321 of the protein has been identified. Thus virtually all residues of the protein were visible except the C-terminal Ser-Thr-His5 extension and the N-terminal lysine, demonstrating that the His tag did not interfere with the active site of the protein (results not shown). DNA sequencing revealed an additional K254E mutation in the H300Q mutant caused by an AAA→GAA transition introduced during PCR amplification. The substitution was judged as unlikely to interfere with catalysis since residue 245 is situated at the enzyme surface in the wild-type enzyme, interacting only with solvent water (results not shown). All protein variants were expressed efficiently at 30 °C with an average yield of 20–40 mg·l−1 batch culture. The proteins were homogeneous after a two-step purification procedure as judged by SDS/PAGE and existed as monomers in their native state (results not shown), with an apparent molecular mass of 39 kDa, in good agreement with that predicted from the primary structure (37.1 kDa).
Measured enzyme activities
For comparative purposes, relative enzyme activities were recorded at preset substrate concentrations and at a defined pH value (Table 1). Activity measurements of active-site mutants confirmed the importance of Asp105, Tyr154, Tyr235 and His300 for the catalytic function of the enzyme (Table 2). The catalysed rates with the different TSO enantiomers displayed by the mutants decreased in all cases to <1% of the wild-type enzyme activity. The overall relationships of activity with the different enantiomers followed the pattern of the wild-type enzyme, with a higher activity towards the R,R-enantiomer. No detectable activity was present in any of the mutants with the other epoxides tested.
Table 2. Enzyme activities of active-site mutants.
Rates were measured in the presence of substrates R,R-TSO, S,S-TSO and rac-TSO.
| Measured rate (nmol·min−1·mg−1) | |||
|---|---|---|---|
| Protein | R,R-TSO | S,S-TSO | rac-TSO |
| Wild-type | 43000±420 | 2700±580 | 6100±330 |
| D105A | <1 | <1 | <1 |
| Y154F | 60±12 | 10±2 | 21±2 |
| Y235F | 22±3 | 9.5±3.1 | 16±1 |
| Y154F/Y235F | <1 | <1 | <1 |
| H300A | 30±5 | 10±2 | 13±3 |
| H300N | 1.8±0.4 | <1 | <1 |
| H300Q | 10±1 | 2.4±0.3 | 3.8±0.5 |
Steady-state kinetics
The parameters kcat, Km and kcat/Km for hydrolysis of the different TSO isomers (and racemate) and 4-NSO were determined (Table 3). The catalytic centre activity for R,R-TSO was 10-fold higher when compared with the S,S-enantiomer whereas the Km value was 13-fold lower for S,S-TSO, resulting in a higher kcat/Km for the S,S enantiomer. StEH1-5H thus displayed a modest degree of enantioselectivity towards TSO, with an E value, (kcat/KmS,S)/(kcat/KmR,R), of approx. 2 in favour of the S,S-enantiomer. The kinetic parameters for the racemate were in the same range as the parameters for S,S-TSO, reflecting the low Km value for the S,S-enantiomer.
Table 3. Steady-state kinetic parameters of wild-type and mutant StEH1-5H.
| Enzyme | Substrate | kcat (s−1) | Km (μM) | kcat/Km (mM−1·s−1) |
|---|---|---|---|---|
| Wild-type | R,R-TSO | 23±2 | 10±1 | 2400±210 |
| Y154F | R,R-TSO | 0.08±0.008 | 21±4.8 | 4±0.5 |
| Y235F | R,R-TSO | 0.07±0.01 | 50±13 | 1.3±0.2 |
| H300A | R,R-TSO | 0.04±0.008 | 21±7 | 2±0.3 |
| H300Q | R,R-TSO | 0.02±0.007 | 66±34 | 0.3±0.05 |
| Wild-type | S,S-TSO | 2.6±0.1 | 0.7±0.2 | 3700±870 |
| Wild-type | rac-TSO | 3.9±0.2 | 1.6±0.3 | 2400±380 |
| Wild-type | 4-NSO | 3.1±0.5 | 510±110 | 6±2 |
Steady-state parameters for mutants were obtainable only with R,R-TSO (Y154F, Y235F, H300A and H300Q) as substrate (Table 3). All mutants showed drastically reduced catalytic efficiencies in R,R-TSO hydrolysis, with catalytic centre activities being the strongest affected parameters. The catalytic activities of mutants D105A, H300N and the double mutant Y154F/Y235F were too low to allow for reliable steady-state kinetic measurements.
Presteady-state kinetics of TSO
Rapid mixing of StEH1-5H and S,S- or R,R-TSO as substrates resulted in fast-transient decreases in intrinsic Trp fluorescence following a single exponential curve (Figure 1). The determined apparent rates (kobs) showed dependence of substrate concentration, allowing for the extraction of KS, k2 and k−2 for the reaction with S,S-TSO (inset in Figure 1A, Table 4). The substrate dependence of kobs in the reaction with R,R-TSO did not reach saturation within the tested substrate range. Therefore only k−2 and the ratio of k2/KS could be accurately determined (inset in Figure 1B, Table 4). The rates for enzyme–substrate association and dissociation were too rapid to be detected outside the dead time of the stopped-flow apparatus. Thus only their ratios (KS) could be extracted. The determined values of k2/KS were in agreement with those of kcat/Km, demonstrating that the E·TSO complexes were in equilibrium with the free enzyme and substrates. Hence, ES association/dissociation rates were ≫k2.
Figure 1. Tryptophan fluorescence traces.

Tryptophan fluorescence traces of (A) 0.5 μM StEH1-5H and 5 μM S,S-TSO or (B) 1 μM StEH1-5H and 20 μM R,R-TSO. The solid lines represent the fits of a single exponential decay applied to extract apparent rate constants kobs. The insets show the fits of eqn (2a) (A) or eqn (2c) (B) to the substrate dependences of kobs. (C) Single turnover experiments of 5 μM StEH1-5H and 4 μM R,R-TSO and 5 μM StEH1-5H and 4 μM S,S-TSO. All reactions were followed at 30 °C in 0.1 M sodium phosphate buffer (pH 6.8).
Table 4. Kinetic and equilibrium constants of wild-type StEH1-5H and mutant H300N.
| Enzyme | Substrate | KS (μM) | k2 (s−1) | k−2 (μM·s−1) | k2/KS (s−1) | k3 (s−1) |
|---|---|---|---|---|---|---|
| Wild-type | R,R-TSO | >30 | >100 | 47±6 | 2.7±0.3 | 24±3 |
| H300N | R,R-TSO | 60±40 | 0.3±0.06 | 0.13±0.02 | 0.005±0.002 | 0.003±0.0005 |
| Wild-type | S,S-TSO | 11±6 | 18±2 | 14±2 | 1.8±1.4 | 3±0.1 |
| H300N | S,S-TSO | >40 | >0.035 | 0.05±0.004 | 0.006±0.0002 | − |
The subsequent hydrolytic steps were analysed during single-turnover conditions, in which the rates of fluorescence recovery after the initial-burst decreases were analysed (Figure 1C). The rates obtained were with both enantiomers similar to those of the corresponding kcat values, supporting the notion that hydrolysis of the alkylenzyme were rate limiting.
The role of Tyr154 and Tyr235 in facilitating enzyme alkylation was reflected in the observation that neither of the corresponding phenylalanine mutants displayed burst kinetics with any of the TSO enantiomers. This was a strong indication that the rate-limiting step had been shifted from hydrolysis to alkylation by the replacements, resulting in no accumulation of detectable intermediates. For both mutants, the kcat values of R,R-TSO were below the value of k3 displayed by the wild-type enzyme (Table 3).
Hydrolysis of R,R-TSO and S,S-TSO catalysed by the H300N mutant resulted in a first-order decrease in the intrinsic fluorescence of the enzyme as observed in the wild-type enzyme (Figure 2). The Ks, k2 and k−2 parameters were obtained by fitting eqn (2a) to the experimental data with R,R-TSO and by fitting eqn (2c) to values extracted with S,S-TSO (inset in Figures 2A and 2B, Table 4). The disappearance of the epoxide in the same time period as the fluorescence burst was verified by mixing R,R-TSO and H300N and directly following the absorbance decrease at 229 nm (Figure 2C).
Figure 2. Tryptophan fluorescence traces.

Tryptophan fluorescence traces of (A) 1.1 μM H300N and 20 μM R,R-TSO and (B) 0.8 μM H300N and 5 μM S,S-TSO. The solid curves represent the fits of a single exponential decay applied to extract apparent rate constants kobs. The insets in (A) and (B) show the fits of eqns (2a) and (2c) respectively to the substrate dependence of kobs. (C) Hydrolysis of 20 μM R,R-TSO catalysed by 2.5 μM H300N, detected as disappearance of the epoxide at 229 nm. All reactions were followed at 30 °C in 0.1 M sodium phosphate buffer (pH 6.8).
Burst kinetics was also obtained when mixing StEH1-5H with cis- or trans-9,10-epoxystearate in the stopped-flow apparatus, indicating that hydrolyses of alkylenzyme were the rate-limiting steps with these substrates also (results not shown). The fluorescence signals were, however, too weak to allow for reliable extraction of individual rate constants.
Enzyme inhibition
The observed inhibition by the TSO hydrolysis product, meso-hydrobenzoin, in the presence of either of the TSO enantiomers was modest with IC50 values of 300 μM (R,R-TSO) and 700 μM (S,S-TSO). Although the IC50 values determined only provide semi-quantitative (inverse) measures of binding affinities, it can be concluded that the reaction product binds weakly to the enzyme active site.
pH dependence of catalysis
The pH titration curves of kcat and kcat/Km for the different TSO enantiomers are shown in Figure 3. The pH dependence of kcat for R,R-TSO followed a bell-shaped curve with an optimal pH range between 6 and 8 (Figure 3A). At acidic values, kcat decreased with pH in a manner corresponding to a single ionization event, as judged from the unit slope in the log kcat versus pH plot. Fitting eqn (3) to the pH dependence allowed for determination of apparent pKa values (Table 5). The pKa for the acidic inflection point (5.5) suggested that the identity of the titrated ionizable group was the imidazole of His300, which in its protonated form would be unable to activate a water molecule required for splitting the covalent alkylenzyme intermediate. Another, though more unlikely candidate, is the acidic form of Asp105, which would constitute a poor nucleophile required for the alkylation step. Fitting the basic part of the titration data with R,R-TSO resulted in a pKa value of 8.2. Although the value of this pKa is untypically low for a tyrosine phenol, it is plausible that it reflects ionization of Tyr154 and/or Tyr235.
Figure 3. Effects of pH on (A) kcat and (B) kcat/Km of StEH1-5H.

The effects of pH on (A) kcat and (B) kcat/Km of StEH1-5H were determined by measuring initial rates of the catalysed reactions at different pH values with R,R-TSO (○) or S,S-TSO (□) at 30 °C. The lines represent the fits of eqn (3) to the data yielding the pKa values (Table 5).
Table 5. Apparent kinetic acid constants for StEH1-5H.
| Substrate R,R-TSO | Substrate S,S-TSO | |||
|---|---|---|---|---|
| Parameter | pKa1 | pKa2 | pKa1 | pKa2 |
| kcat | 5.5±0.2 | 8.2±0.2 | 5.0±0.3 | 7.2±0.2 |
| kcat/Km | 6.1±0.5 | 7.8±0.5 | 5.4±0.5 | 8.3±0.8 |
The pH dependence of kcat for the hydrolysis of S,S-TSO displayed a more acidic pH optimum between 5.5 and 7 with ionization constants of pKa1=5.0 and pKa2=7.2 respectively. Hence, both pKa values were shifted towards more acidic values when compared with the R,R-enantiomer.
The titration of the free enzyme and substrate-forming product (pH dependences of kcat/Km) differed qualitatively from the pH dependences of kcat (Figure 3B). The curve obtained for R,R-TSO showed a narrower pH profile with an optimum at pH 7. The value of the acidic pKa tentatively assigned to involve His300 was 0.6 pH unit higher in the free enzyme when compared with the ES complex. The same behaviour was observed when the pKa values obtained for S,S-TSO hydrolysis were compared. The pKa values were raised by 0.4 and 1.1 pH units respectively in the free enzyme.
DISCUSSION
The purpose of the the present study was to investigate the catalytic mechanism of a plant epoxide hydrolase, potato StEH1. The results have clarified the kinetic mechanism and identified the amino acid residues involved and also characterized their functions.
Substrate specificity
Potato StEH1, similar to other characterized soluble epoxide hydrolases, has been suggested to have broad substrate specificity [26]. This notion is supported by the results of the present study testing different aromatic and fatty acid epoxides as candidate substrates. Of the epoxides tested, R,R-TSO was most efficiently hydrolysed by StEH1-5H as judged from apparent catalytic rates although the enzyme efficiency was higher with the S,S-enantiomer. Besides the enantioselectivity regarding TSO, StEH1-5H displayed activity with rac-4-NSO and the cis- and trans-isomers of 9,10-epoxystearate. A comparison of the steady-state kinetic parameters for rac-TSO and rac-4-NSO indicates that the additional phenyl substituent in TSO provides additional binding energy to the enzyme–substrate complex; the enzyme displayed comparable turnover rates but with a 300-fold larger Km for rac-4-NSO than for rac-TSO. The planar PO and NPEP were not hydrolysed to any detectable degree by StEH1-5H (Table 1). Further structural studies would be required to better understand these differences in specificity. Noteworthy, StEH1 expressed in E. coli in the present study displayed higher catalytic activity with the substrates tested when compared with the corresponding enzyme purified after expression in insect cells [26]. The reasons for these discrepancies are at present not known.
Hydrolysis is the rate-limiting step of StEH1-catalysed conversion of TSO
The scheme for the catalysed reaction is described by four consecutive steps including two chemical transformations (see Scheme 1 on p. 633). These steps, alkylation (ES→ES′) and hydrolysis (E→EP), have been demonstrated to be primarily responsible for the catalytic efficiency of rat microsomal epoxide hydrolase with glycidyl-4-nitrobenzoate as substrate and the A. radiobacter soluble epoxide hydrolase with styrene oxide as substrate. The alkylation step, with rate constant k2, was shown to be considerably slower than ES complex formation (k1) but much faster than the rate of hydrolysis (k3) [33,34]. Hence, the hydrolytic step is primarily setting the upper limit to the value of kcat in these enzymes. A plant (soya bean) epoxide hydrolase was shown to hydrolyse 9,10-epoxystearate through a similar catalytic mechanism involving the formation of an alkylenzyme intermediate. In contrast with the microsomal and bacterial enzymes, however, the soya bean enzyme was reported to display a fast hydrolytic step and the catalytic rate was thus limited by the alkylation [35]. In the present study, StEH1-5H, another plant epoxide hydrolase, displayed burst kinetics during catalysed hydrolysis of both TSO enantiomers and cis- or trans-9,10-epoxystearate, indicating accumulation of ES′ or EP and hence, hydrolysis or product release to influence catalytic centre activities. The combined results that the reaction product diol is a poor inhibitor, and that the rate of hydrolysis with both TSO enantiomers were close to those of kcat firmly established hydrolysis as the rate-limiting step in StEH1-5H.
The alkylation rate (k2) with either TSO enantiomer was considerably more rapid than k3, and hence does not influence the turnover rates to any major degree (Table 4). The rates of the reverse reaction, E-alkyl→E·TSO (k−2), presumably involves a general base-catalysed intramolecular nucleophilic attack by the free hydroxyl of the alkylenzyme expelling the Asp105 carboxylate, stabilized by the nearby His300 imidazole. Whether the catalytic base is provided by the enzyme or from the solvent is at present unknown. A consequence of the small differences in the rates of enzyme alkylation and intramolecular epoxidation with S,S-TSO is a lower steady-state concentration of the alkylenzyme when compared with the R,R-enantiomer at the assay pH.
The alkylation rates displayed by A. radiobacter epoxide hydrolase with styrene oxide and microsomal epoxide hydrolase with glycidyl-4-nitrobenzoate were higher (10–100-fold) than the rate of TSO alkylation of StEH1-5H [33,34]. Simultaneously, the dissociation constants (KS) of the two first enzymes were elevated at comparable magnitudes when compared with the KSTSO for StEH1-5H. However, the actual catalytic turnover rates for the three enzymes with their respective substrates are comparable. The higher rates in the initial substrate entrapments of the bacterial and microsomal enzymes may reflect as a primary function the rapid removal of harmful compounds by detoxification enzymes, following sequestration at the active site. The plant enzyme, in contrast, is believed to be primarily involved in the metabolism of endogenous substances and may therefore not have experienced the same evolutionary pressure for a rapid alkylation step.
StEH1 displays enantiomeric pH dependence of kcat
The pH dependence of TSO hydrolysis supported the notion that enzyme-contributed groups were involved in rate-determining steps following a titration of basic and acidic groups. Although pH-dependent conformational changes of the enzyme cannot be ruled out, the results suggest that chemical transformations involving acid/base catalysis are rate determining. The derived apparent acid constants were also in fair agreement with expected values for protonated histidine imidazoles and/or aspartic acid carboxylic acids and tyrosine phenols (Table 5). Notably, the dependence of kcat was enantiospecific with a more acidic pH profile for S,S-TSO. These differences are probably a reflection of the differences in microscopic rates during catalysis of the enantiomers determining the ratios of enzyme–substrate species (ES and ES′).
The pH dependence of kcat for rat microsomal epoxide hydrolase [36] with PO as substrate displayed a similar titration curve but was shifted towards more basic pH values and with an optimum at pH 8.5. The determined apparent pKa values for this rat enzyme were also more basic (6.7 and 9.8). The pH dependence of kcat/Km for epoxide hydrolase from A. radiobacter [14] also differed from the potato enzyme and displayed a broad pH optimum between pH 6 and 10.
Function of His300
As deduced from available crystal structures of mammalian and microbial epoxide hydrolases [15–18], the Nϵ of the catalytic imidazole interacts with the nucleophilic carboxylate whereas the Nδ is bound to the carboxylate of the charge-relay residue. The requirement of the imidazole base functionality was demonstrated by substitutions of the His300 side chain for either methyl (H300A), ethyl amide (H300N), a mimic of the positioning of the imidazole Nδ, or propyl amide (H300Q), a reasonable mimic of the imidazole Nϵ, which all drastically decreased the enzyme efficiency. The energetic loss in transition-state stabilization between wild-type and the H300A mutant was 18 kJ·mol−1 at pH 6.8, as calculated from the respective kcat/KmR,R−TSO values [ΔΔG=−RT ln(kcat/Km)Mut/(kcat/Km)WT], with the most affected kinetic parameter kcat being reduced 600-fold (WT is wild-type). If this decrease was solely due to a lowered hydrolysis rate, one would expect a concomitant lowering in Km. This was not observed in H300A or H300Q mutant suggesting that both alkylation and hydrolysis steps were affected in parallel by the substitutions. The underlying reason for the decrease in alkylation rates may be the loss of activation of the nucleophile Asp105 carboxylate due to the removal of the imidazole of His300.
Restoring the polarity and hydrogen bonding capacity of the histidine imidazole Nδ (H300N) also generated an enzyme with severely crippled catalytic power. The steady-state turnover level with R,R-TSO was at the level of escaping detection and only an initial burst of epoxide ring opening could be established with R,R-TSO (Figure 2A). In addition to the expected drop in hydrolysis rate, the rate of alkylation (k2=0.3 s−1) was also decreased to a value more than two orders of magnitude below the value of the wild-type enzyme (k2>100 s−1), presumably due to the mechanism described above. Furthermore, a comparision of the hydrolysis rates (k3) demonstrated that the H300N mutant was destabilized in the transition state of alkylenzyme hydrolysis by 29 kJ·mol−1 when compared with the wild-type enzyme (Table 4). The rate decrease can be explained by an anticipated shift in reacting nucleophile from hydroxyl ion to water, which is several orders of magnitude less nucleophilic in carbonyl reactions when compared with the hydroxyl ion [37]. In addition, the positive charge of a protonated imidazole is expected to stabilize a formed hydroxyl ion as well as a negatively charged transition state within the apolar environment of the enzyme active site. Interestingly, when the corresponding catalytic histidine was mutated in the epoxide hydrolase from rat microsomes, only the hydrolytic half-reaction was shown to be affected whereas the alkylation rate was retained [38].
Function of catalytic tyrosyls
Replacing the putative catalytic acids Tyr154 and Tyr235 for phenylalanine also caused dramatic decreases in enzyme efficiencies with R,R-TSO. In the single Tyr→Phe mutants, kcat values were decreased approx. 300-fold, and the Km values were simultaneously elevated 2–5-fold indicating a lower degree of alkylenzyme formation (Table 3). The precise role of these groups in the catalytic mechanism cannot be elucidated at this point, but it is clear that both tyrosine residues are required to retain reasonable catalytic efficiencies.
Acknowledgments
The generous contributions of Professor M. Arand, Dr P. I. Arvidsson and Dr A. Seidel to the present study are gratefully acknowledged. We also express gratitude to the Department of Medical Biochemistry and Microbiology, Uppsala, for providing access to the phosphoimager equipment. This work was supported by the Carl Trygger Foundation.
References
- 1.Kiyosue T., Beetham J. K., Pinot F., Hammock B. D., Yamaguchi-Shinozaki K., Shinozaki K. Characterization of an Arabidopsis cDNA for a soluble epoxide hydrolase gene that is inducible by auxin and water stress. Plant J. 1994;6:259–269. doi: 10.1046/j.1365-313x.1994.6020259.x. [DOI] [PubMed] [Google Scholar]
- 2.Croteau R., Kolattukudy P. E. Enzymatic epoxidation of 18-hydroxyoleic acid to 18-hydroxy-cis-9,10-epoxystearic acid by a particulate preparation from spinach (Spinacia oleracea) Arch. Biochem. Biophys. 1975;170:61–72. doi: 10.1016/0003-9861(75)90097-1. [DOI] [PubMed] [Google Scholar]
- 3.Blee E., Schuber F. Occurrence of fatty acid epoxide hydrolases in soybean (Glycine max). Purification and characterization of the soluble form. Biochem. J. 1992;282:711–714. doi: 10.1042/bj2820711. [DOI] [PMC free article] [PubMed] [Google Scholar]
- 4.Bellevik S., Zhang J., Meijer J. Brassica napus soluble epoxide hydrolase (BNSEH1) Eur. J. Biochem. 2002;269:5295–5302. doi: 10.1046/j.1432-1033.2002.03247.x. [DOI] [PubMed] [Google Scholar]
- 5.Guo A., Durner J., Klessig D. F. Characterization of a tobacco epoxide hydrolase gene induced during the resistance response to TMV. Plant J. 1998;15:647–656. doi: 10.1046/j.1365-313x.1998.00241.x. [DOI] [PubMed] [Google Scholar]
- 6.Stapleton A., Beetham J. K., Pinot F., Garbarino J. E., Rockhold D. R., Friedman M., Hammock B. D., Belknap W. R. Cloning and expression of soluble epoxide hydrolase from potato. Plant J. 1994;6:251–258. doi: 10.1046/j.1365-313x.1994.6020251.x. [DOI] [PubMed] [Google Scholar]
- 7.Gomi K., Yamamato H., Akimitsu K. Epoxide hydrolase: a mRNA induced by the fungal pathogen Alternaria alternata on rough lemon (Citrus jambhiri Lush) Plant Mol. Biol. 2003;53:189–199. doi: 10.1023/B:PLAN.0000009287.95682.24. [DOI] [PubMed] [Google Scholar]
- 8.Croteau R., Kolattukudy P. E. Biosynthesis of hydroxyfatty acid polymers. Enzymatic hydration of 18-hydroxy-cis-9,10-epoxystearic acid to threo 9,10,18-trihydroxystearic acid by a particulate preparation from apple (Malus pumila) Arch. Biochem. Biophys. 1975;170:73–81. doi: 10.1016/0003-9861(75)90098-3. [DOI] [PubMed] [Google Scholar]
- 9.Heredia A. Biophysical and biochemical characteristics of cutin, a plant barrier biopolymer. Biochim. Biophys. Acta. 2003;1620:1–7. doi: 10.1016/s0304-4165(02)00510-x. [DOI] [PubMed] [Google Scholar]
- 10.Pinot F., Grant D. F., Beetham J. K., Parker A. G., Borhan B., Landt S., Jones A. D., Hammock B. D. Molecular and biochemical evidence for the involvement of the Asp-333–His-523 pair in the catalytic mechanism of soluble epoxide hydrolase. J. Biol. Chem. 1995;270:7968–7974. doi: 10.1074/jbc.270.14.7968. [DOI] [PubMed] [Google Scholar]
- 11.Laughlin L. T., Tzeng H. F., Lin S., Armstrong R. N. Mechanism of microsomal epoxide hydrolase. Semifunctional site-specific mutants affecting the alkylation half-reaction. Biochemistry. 1998;37:2897–2904. doi: 10.1021/bi972737f. [DOI] [PubMed] [Google Scholar]
- 12.Yamada T., Morisseau C., Maxwell J. E., Argiriadi M. A., Christianson D. W., Hammock B. D. Biochemical evidence for the involvement of tyrosine in epoxide activation during the catalytic cycle of epoxide hydrolase. J. Biol. Chem. 2000;275:23082–23086. doi: 10.1074/jbc.M001464200. [DOI] [PubMed] [Google Scholar]
- 13.Rink R., Fennema M., Smids M., Dehmel U., Janssen D. B. Primary structure and catalytic mechanism of the epoxide hydrolase from Agrobacterium radiobacter AD1. J. Biol. Chem. 1997;272:14650–14657. doi: 10.1074/jbc.272.23.14650. [DOI] [PubMed] [Google Scholar]
- 14.Rink R., Kingma J., Spelberg J. H. L., Janssen D. B. Tyrosine residues serve as proton donor in the catalytic mechanism of epoxide hydrolase from Agrobacterium radiobacter. Biochemistry. 2000;39:5600–5613. doi: 10.1021/bi9922392. [DOI] [PubMed] [Google Scholar]
- 15.Argiriadi M. A., Morriseau C., Hammock B. D., Christianson D. W. Detoxification of environmental mutagens and carcinogens: structure, mechanism, and evolution of liver epoxide hydrolase. Proc. Natl. Acad. Sci. U.S.A. 1999;96:10637–10642. doi: 10.1073/pnas.96.19.10637. [DOI] [PMC free article] [PubMed] [Google Scholar]
- 16.Gomez G. A., Morisseau C., Hammock B. D., Christianson D. W. Structure of human epoxide hydrolase reveals mechanistic inferences on bifunctional catalysis in epoxide and phosphate ester hydrolysis. Biochemistry. 2004;43:4716–4723. doi: 10.1021/bi036189j. [DOI] [PubMed] [Google Scholar]
- 17.Nardini M., Ridder I. S., Rozeboom H. J., Kalk K. H., Rink R., Janssen D. B., Dijkstra B. W. The X-ray structure of epoxide hydrolase from Agrobacterium radiobacter AD1. J. Biol. Chem. 1999;274:14579–14586. [PubMed] [Google Scholar]
- 18.Zou J., Hallberg B. M., Bergfors T., Oesch F., Arand M., Mowbray S. L., Jones T. A. Structure of Aspergillus niger epoxide hydrolase at 1.8 Å resolution: implications for the structure and function of the mammalian microsomal class of epoxide hydrolases. Structure. 2000;8:111–122. doi: 10.1016/s0969-2126(00)00087-3. [DOI] [PubMed] [Google Scholar]
- 19.Morisseau C., Hammock B. D. Epoxide hydrolases: mechanisms, inhibitor designs, and biological roles. Annu. Rev. Pharmacol. Toxicol. 2005;45:311–333. doi: 10.1146/annurev.pharmtox.45.120403.095920. [DOI] [PubMed] [Google Scholar]
- 20.Fretland A. J., Omiecinski C. J. Epoxide hydrolases: biochemistry and molecular biology. Chem. Biol. Interact. 2000;129:41–59. doi: 10.1016/s0009-2797(00)00197-6. [DOI] [PubMed] [Google Scholar]
- 21.Lacourciere G. M., Armstrong R. N. The catalytic mechanism of microsomal epoxide hydrolase involves an ester intermediate. J. Am. Chem. Soc. 1993;115:10466–10467. [Google Scholar]
- 22.Borhan B., Jones D. A., Pinot F., Grant D. F., Kurth M. J., Hammock B. D. Mechanism of soluble epoxide hydrolase. J. Biol. Chem. 1995;270:26923–26930. doi: 10.1074/jbc.270.45.26923. [DOI] [PubMed] [Google Scholar]
- 23.Blee E., Schuber F. Regio- and enantioselectivity of soybean fatty acid epoxide hydrolase. J. Biol. Chem. 1992;267:11881–11887. [PubMed] [Google Scholar]
- 24.Blee E., Schuber F. Stereocontrolled hydrolysis of the linoleic acid monoepoxide regioisomers catalysed by soybean epoxide hydrolase. Eur. J. Biochem. 1995;230:229–234. doi: 10.1111/j.1432-1033.1995.tb20555.x. [DOI] [PubMed] [Google Scholar]
- 25.Summerer S., Hanano A., Utsumi S., Arand M., Schuber F., Blee E. Stereochemical features of the hydrolysis of 9,10-epoxystearic acid catalysed by plant and mammalian epoxide hydrolases. Biochem. J. 2002;366:471–480. doi: 10.1042/BJ20011778. [DOI] [PMC free article] [PubMed] [Google Scholar]
- 26.Morisseau C., Beetham J. K., Pinot F., Debernard S., Newman J. W., Hammock B. D. Cress and potato soluble epoxide hydrolases: purification, biochemical characterization, and comparison to mammalian enzymes. Arch. Biochem. Biophys. 2000;378:321–332. doi: 10.1006/abbi.2000.1810. [DOI] [PubMed] [Google Scholar]
- 27.Widersten M. Heterologous expression in Escherichia coli of soluble active-site random mutants of haloalkane dehalogenase from Xanthobacter autotrophicus GJ10 by coexpression of molecular chaperonins GroEL/ES. Protein Expr. Purif. 1998;13:389–395. doi: 10.1006/prep.1998.0913. [DOI] [PubMed] [Google Scholar]
- 28.Wixtrom R. N., Hammock B. D. Continuous spectrophotometric assays for cytosolic epoxide hydrolase. Anal. Biochem. 1988;174:291–299. doi: 10.1016/0003-2697(88)90548-9. [DOI] [PubMed] [Google Scholar]
- 29.Westkaemper R. B., Hanzlik R. P. Mechanistic studies of epoxide hydrolase utilizing a continuous spectophotometric assay. Arch. Biochem. Biophys. 1981;208:195–204. doi: 10.1016/0003-9861(81)90140-5. [DOI] [PubMed] [Google Scholar]
- 30.Armstrong R. N., Levin W., Jerina D. M. Hepatic microsomal epoxide hydrolase. J. Biol. Chem. 1979;255:4698–4705. [PubMed] [Google Scholar]
- 31.Gardner H. W., Hamberg M. Oxygenation of (3Z)-nonenal to (2E)-4-hydroxy-2-nonenal in the broad bean (Vicia faba L.) J. Biol. Chem. 1993;268:6971–6977. [PubMed] [Google Scholar]
- 32.Fersht A. New York: W. H, Freeman and Company; 1999. Structure and Mechanism in Protein Science. [Google Scholar]
- 33.Tzeng H.-F., Laughlin L. T., Lin S., Armstrong R. N. The catalytic mechanism of microsomal epoxide hydrolase involves reversible formation and rate-limiting hydrolysis of the alkyl-enzyme intermediate. J. Am. Chem. Soc. 1996;118:9436–9437. [Google Scholar]
- 34.Rink R., Janssen D. B. Kinetic mechanism of the enantioselective converion of styrene oxide by epoxide hydrolase from Agrobacterium radiobacter AD1. Biochemistry. 1998;37:18119–18127. doi: 10.1021/bi9817257. [DOI] [PubMed] [Google Scholar]
- 35.Blee E., Summerer S., Flenet M., Rogniaux H., Van Dorsselaer A., Schuber F. Soybean epoxide hydrolase: identification of the catalytic residues and probing of the reaction mechanism with secondary kinetic isotope effects. J. Biol. Chem. 2005;280:6479–6487. doi: 10.1074/jbc.M411366200. [DOI] [PubMed] [Google Scholar]
- 36.Armstrong R. N., Levin W., Jerina D. M. Hepatic microsomal epoxide hydrolase. J. Biol. Chem. 1979;255:4698–4705. [PubMed] [Google Scholar]
- 37.Swain C. G., Scott C. B. Quantitative correlation of relative rates. Comparison of hydroxide ion with other nucleophilic reagents toward alkyl halides, esters, epoxides and acyl halides. J. Am. Chem. Soc. 1953;75:141–147. [Google Scholar]
- 38.Tzeng H.-F., Laughlin L. T., Armstrong R. N. Semifunctional site-specific mutants affecting the hydrolytic half-reaction of microsomal epoxide hydrolase. Biochemistry. 1998;37:2905–2911. doi: 10.1021/bi9727388. [DOI] [PubMed] [Google Scholar]