

Abstract
Background:
Multiparametric MRI may cause overdiagnosis of clinically significant prostate cancer (csPCa) with the Prostate Imaging Reporting and Data System version 2.1 (PI-RADS v2.1).
Objectives:
To investigate the diagnostic performance of stiffness as a standalone and complementary marker to PI-RADS v2.1 for diagnosing csPCa.
Study Type:
Prospective.
Subjects:
147 participants with pathologically confirmed prostate lesions (≥ 1cm), including 71 with csPCa.
Field Strength/Sequence:
T1-weighted fast spin-echo, T2-weighted fast spin-echo, single-shot echo-planar diffusion-weighted imaging, fast 3D gradient-echo T1-weighted dynamic contrast-enhanced imaging, and 3D single-shot spin-echo based echo-planar MR elastography at 3.0T.
Assessment:
The PI-RADS v2.1 score was assessed by three radiologists independently. Lesion shear stiffness (SS) values at 60Hz and 90Hz were measured. A modified PI-RADS integrating stiffness with PI-RADS v2.1 was developed. Diagnostic performance for csPCa was compared between stiffness, PI-RADS v2.1 and the modified PI-RADS.
Statistical Test:
Spearman’s correlation, Fleiss κ and intraclass correlation, Pearson correlation, one-way analysis of variance, area under the receiver operating characteristic curve (AUC), and the Delong test. Significance level was P < 0.05.
Results:
In the peripheral zone, csPCa (n = 35) had significantly higher SS than non-csPCa at 60Hz (3.22 ± 0.66 kPa vs. 2.56 ± 0.56 kPa) and at 90Hz (5.64 ± 1.30 kPa vs. 4.48 ± 0.84 kPa). PI-RADS v2.1 showed 100% sensitivity, 58% specificity, and 0.79 AUC for detecting csPCa. SS achieved 97% sensitivity, 52% specificity, and 0.80 AUC at 60Hz, while SS had 63% sensitivity, 87% specificity, and 0.78 AUC at 90Hz. The modified PI-RADS, combing SS at 60Hz with PI-RADS v2.1, resulted in a significantly increased AUC (0.86) compared to that of PI-RADS v2.1, with a sensitivity of 97% and specificity of 75%.
Data Conclusion:
Stiffness can help identifying csPCa in the peripheral zone. Combining stiffness with the PI-RADS v2.1 improved the diagnostic accuracy and specificity for csPCa.
Keywords: clinically significant prostate cancer, elastography, Prostate Imaging Reporting and Data System
Plain Language Summary
This study aimed to improve the detection of clinically significant prostate cancer by combining tissue stiffness measurements with the existing Prostate Imaging Reporting System (PI-RADS). Researchers evaluated 147 patients using magnetic resonance elastography to measure tissue stiffness alongside standard imaging methods. In the peripheral zone of the prostate, cancerous tissues were stiffer than non-cancerous tissues. By adding stiffness measurements to PI-RADS, the accuracy and specificity of cancer diagnoses were improved compared to using PI-RADS alone. These findings suggest that integrating stiffness measurements with PI-RADS can enhance prostate cancer detection, offering a more effective diagnostic approach in clinical settings.
INTRODUCTION
Prostate cancer (PCa) remains one of the most prevalent malignancies globally, responsible for considerable mortality and morbidity among male populations (1). The clinical management of PCa relies on accurate detection and differentiation of benign and indolent lesions from clinically significant prostate cancer (csPCa), which exhibits aggressive behavior and the potential for metastasis (2). The multiparametric MRI based Prostate Imaging-Reporting and Data System version 2.1 (PI-RADS v2.1) is the current standard diagnostic approach for PCa diagnosis (3). However, despite its strengths, the specificity of PI-RADS for csPCa remains only moderate, leading to potential overdiagnosis and overtreatment of patients with indolent PCa or with benign prostatic lesions due to overlaps in conventional multiparametric MR imaging characteristics (3–6). There is therefore a need for additional diagnostic tools for lesion discrimination.
MR elastography (MRE) is a well-established noninvasive technique capable of quantifying tissue mechanical properties, such as stiffness, which may potentially serve as biomarkers reflecting the underlying physio-pathological state, including cell proliferation, extracellular matrix organization, and vascularization status (7–9). Increased lesion stiffness is associated with tumor aggressiveness in several malignancies, including hepatocellular carcinoma, renal cell carcinoma, and PCa (10–13). As an extension of conventional multiparametric MRI, MRE may provide additional insights for the differential diagnosis of prostatic lesions from a tissue biomechanical perspective. Previous studies have shown encouraging results, suggesting an important role for biomechanical properties in differentiating PCa from benign prostatic lesions (12, 14). However, the diagnostic efficacy and optimal cutoff values of MRE for identifying csPCa remain uncertain. Furthermore, the diagnostic performance of integrating MRE into the PI-RADS v2.1 is currently unclear.
Therefore, the aims of this study were to investigate the value of tissue stiffness, quantified by three-dimensional MRE, in the diagnosis of csPCa, and to evaluate the added value of incorporating stiffness into the PI-RADS v2.1 for csPCa detection.
MATERIALS AND METHODS
Participants
This prospective study was approved by the institutional review board and written informed consent was obtained from each participant (clinical trial registration: ChiCTR2300076464). From March 2022 to October 2023, patients suspected of PCa due to elevated prostate-specific antigen were consecutively enrolled for multiparametric MRI and MRE examination. The final inclusion criteria were (a) pathology from either biopsy, prostatectomy, or transurethral resection within three months of MR examination available, (b) patient did not receive any previous treatment for prostate cancer, and (c) lesion size ≥1 cm. Exclusion criteria included (a) poor MRI image quality due to severe artifact, (b) MRE failure due to a loose driver connection, and (c) participants with poor wave penetration as determined by the investigator (JC, with 6 years of experience in MRE) during image analyses.
Multiparametric MRI/ MRE Examination
The multiparametric MRI protocol was compliant with the PI-RADS version 2.1 recommendation and was performed using a 3.0T scanner with a 16-channel phased-array surface coil (Discovery MR 750, GE Healthcare, Waukesha, WI). No spasmolytics was administered. The MRI sequences included T1-weighted axial fast spin echo, T2-weighted fast spin-echo in axial, coronal, and sagittal planes, axial single-shot echo-planar diffusion-weighted imaging (DWI) with b values of 50, 800, 1000, and 1400 sec/mm2, and axial fast 3D gradient-echo T1-weighted dynamic contrast-enhanced (DCE) imaging. Detailed scan parameters are described in Supplement Table S1. Apparent diffusion coefficient (ADC) maps were calculated from b values of 50 and 800 sec/mm2 by using the mono-exponential model. A fixed dose (10 mL) of Gadodiamide (Omniscan; GE Healthcare) was administered to all participants.
For prostate MRE, a customized prostate driver (Mayo Clinic, Rochester Minnesota, US) was placed over the pubic symphysis and was secured using an elastic strap. 3D vector MRE data, sensitized along three orthogonal motion directions (3D MRE), were acquired using single-shot spin-echo based echo-planar imaging sequence at the mechanical vibration frequency of 60Hz and 90Hz before contrast agent administration. Detailed scan parameters were as follows: repeat time = 1600 msec, echo time = 63.4 msec, field of view = 240 mm×240 mm, matrix = 128×128, and slice thickness = 3.6 mm. All MRI examinations were conducted during free breathing. Post-processing of 3D MRE was conducted by using a 3D multimode direct inversion algorithm to generate corresponding wave images, phase images, magnitude images, and shear stiffness (SS) maps (15).
Image Analysis
Three radiologists (JY, JC and YC with 10-, 6- and 4-years of experience) independently assigned PI-RADS score according to PI-RADS 2.1. To improve interobserver agreement in PI-RADS scoring, three radiologists jointly reviewed 30 training cases which were not included in the study population. They reached a consensus-based PI-RADS score for each case consisting of T2-weighted image, DWI, and DCE. The three reviewers then reviewed all study images independently. All reviewers were blinded to clinical and pathological information during image analyses. After each reader performed their individual readings, a consensus-reached PI-RADS v2.1 score was determined in a further consensus-based reading session in cases with discrepancy between reviewers. The consensus-reached score was used for estimating the diagnostic performance with PI-RADS v2.1.Two reviewers (JC and YC) also measured lesion stiffness on 3D MRE, immediately after PI-RADS scoring. For MRE quantification, a single image showing the primary lesion at its largest cross-sectional extent was selected from the MRE magnitude images with reference to anatomic T2-weighted and diffusion weighted images. Where multiple lesions were present, the lesion most suspicious for PCa (the lesion with the highest PI-RADS score or with the largest diameter if PI-RADS scores were the same) was considered to be the primary lesion by all reviewers in consensus. Regions of interest were manually drawn in the lesions on the SS map showing the largest lesion cross-sectional area and on the two adjacent slices. ADC from DWI data was measured in the same three locations. Final ADC and stiffness measurements were calculated as the averages of 6 slices by the two reviewers.
Modified PI-RADS Scoring
To evaluate the added value of ADC and stiffness to PI-RADS v2.1 score in identifying csPCa, we introduced a modified PI-RADS scoring system (mPI-RADS) that incorporated separate ADC or stiffness measurements. Two modification rules were applied by using cutoffs corresponding to the maximum Youden-index and cutoffs corresponding to high sensitivity (≥ 95%), respectively. In mPI-RADS, lesions with an PI-RADS v2.1 score ≥4 was further evaluated using ADC or lesion stiffness, respectively. The score was downgraded to mPI-RADS 3 if the ADC exceeded the cutoff or stiffness was lower the cutoff. Lesions not meeting corresponding criteria retained their original PI-RADS score in mPI-RADS scoring system (Fig. 1).
Figure 1.

Schematic representation of the modified PI-RADS scoring system incorporating separate apparent diffusion coefficient (ADC), shear stiffness at 60Hz and 90Hz, respectively.
Pathology
Specimens for histopathologic analysis were obtained by 12-core plus X (targeted biopsy), transrectal US-guided trans-perineal prostate biopsy, radical prostatectomy, or transurethral resection. All specimens were reviewed by a pathologist (with 12 years’ experience in urogenital pathology). The final pathological diagnosis was recorded, as well as the Gleason score and the International Society of Urologic Pathology grade group (16–18), if applicable. PCa with a GS of 6 was defined as indolent PCa (17, 18).
Statistical Analysis
Statistical analysis was performed with software SPSS (version 18.0, SPSS) and R (version 3.4.3, R Foundation for Statistical Computing). Interobserver agreement of PI-RADS v2.1 was assessed with the Fleiss kappa (poor: < 0, slight: 0.00–0.20, fair: 0.21–0.40, moderate: 0.41–0.60, substantial: 0.61–0.80, almost perfect: 0.81–1.00) (19). Interobserver agreement of MRI measurements was assessed using intraclass correlation coefficients (ICC, poor: < 0.50, moderate: 0.50–0.75, good: 0.75–0.90, excellent: > 0.90) (20). Correlations between lesion stiffness and pathological characteristics were assessed using the Pearson correlation coefficient (r). Differences in clinical characteristics and MRI measurements between patients with benign prostatic lesions, indolent PCa, and csPCa were analyzed using a one-way analysis of variance followed by post hoc pairwise comparisons with Bonferroni correction or independent T-test. Area under the receiver operating characteristic (ROC) curve (AUC) was used to assess the diagnostic performance of each variable in identifying csPCa located at the peripheral zone and the transitional zone, respectively, if applicable. For the PI-RADS v2.1 score, a predetermined diagnostic cutoff of ≥ 4 was applied. The optimal cutoffs for ADC and stiffness value were determined based on the maximum Youden-index. Differences in AUCs were assessed using the Delong test. Bonferroni-corrected p values less than 0.05 were considered significant.
RESULTS
Participants
Among the 366 participants, 219 participants were excluded due to prior treatment (n = 68), absence of pathology within 3 months (n = 107), lesion < 1 cm (n = 24), technical failure of MRE (n = 19) and imaging artifact by air (n = 1) (Fig. 2). Finally, 147 participants (mean age, 67 ± 9 years) were included in analysis, including 71 participants with csPCa (mean age, 68 ± 9 years), 15 subjects with indolent PCa (mean age, 60 ±8 years), and 61 participants with benign prostatic lesions (mean age, 67 ±10 years). csPCa were in peripheral zone (n = 35), transitional zone (n = 13) and both zones (n = 23) while all indolent PCa were found in peripheral zone (n = 15). The demographic and clinical characteristics are summarized in Table 1.
Figure 2.
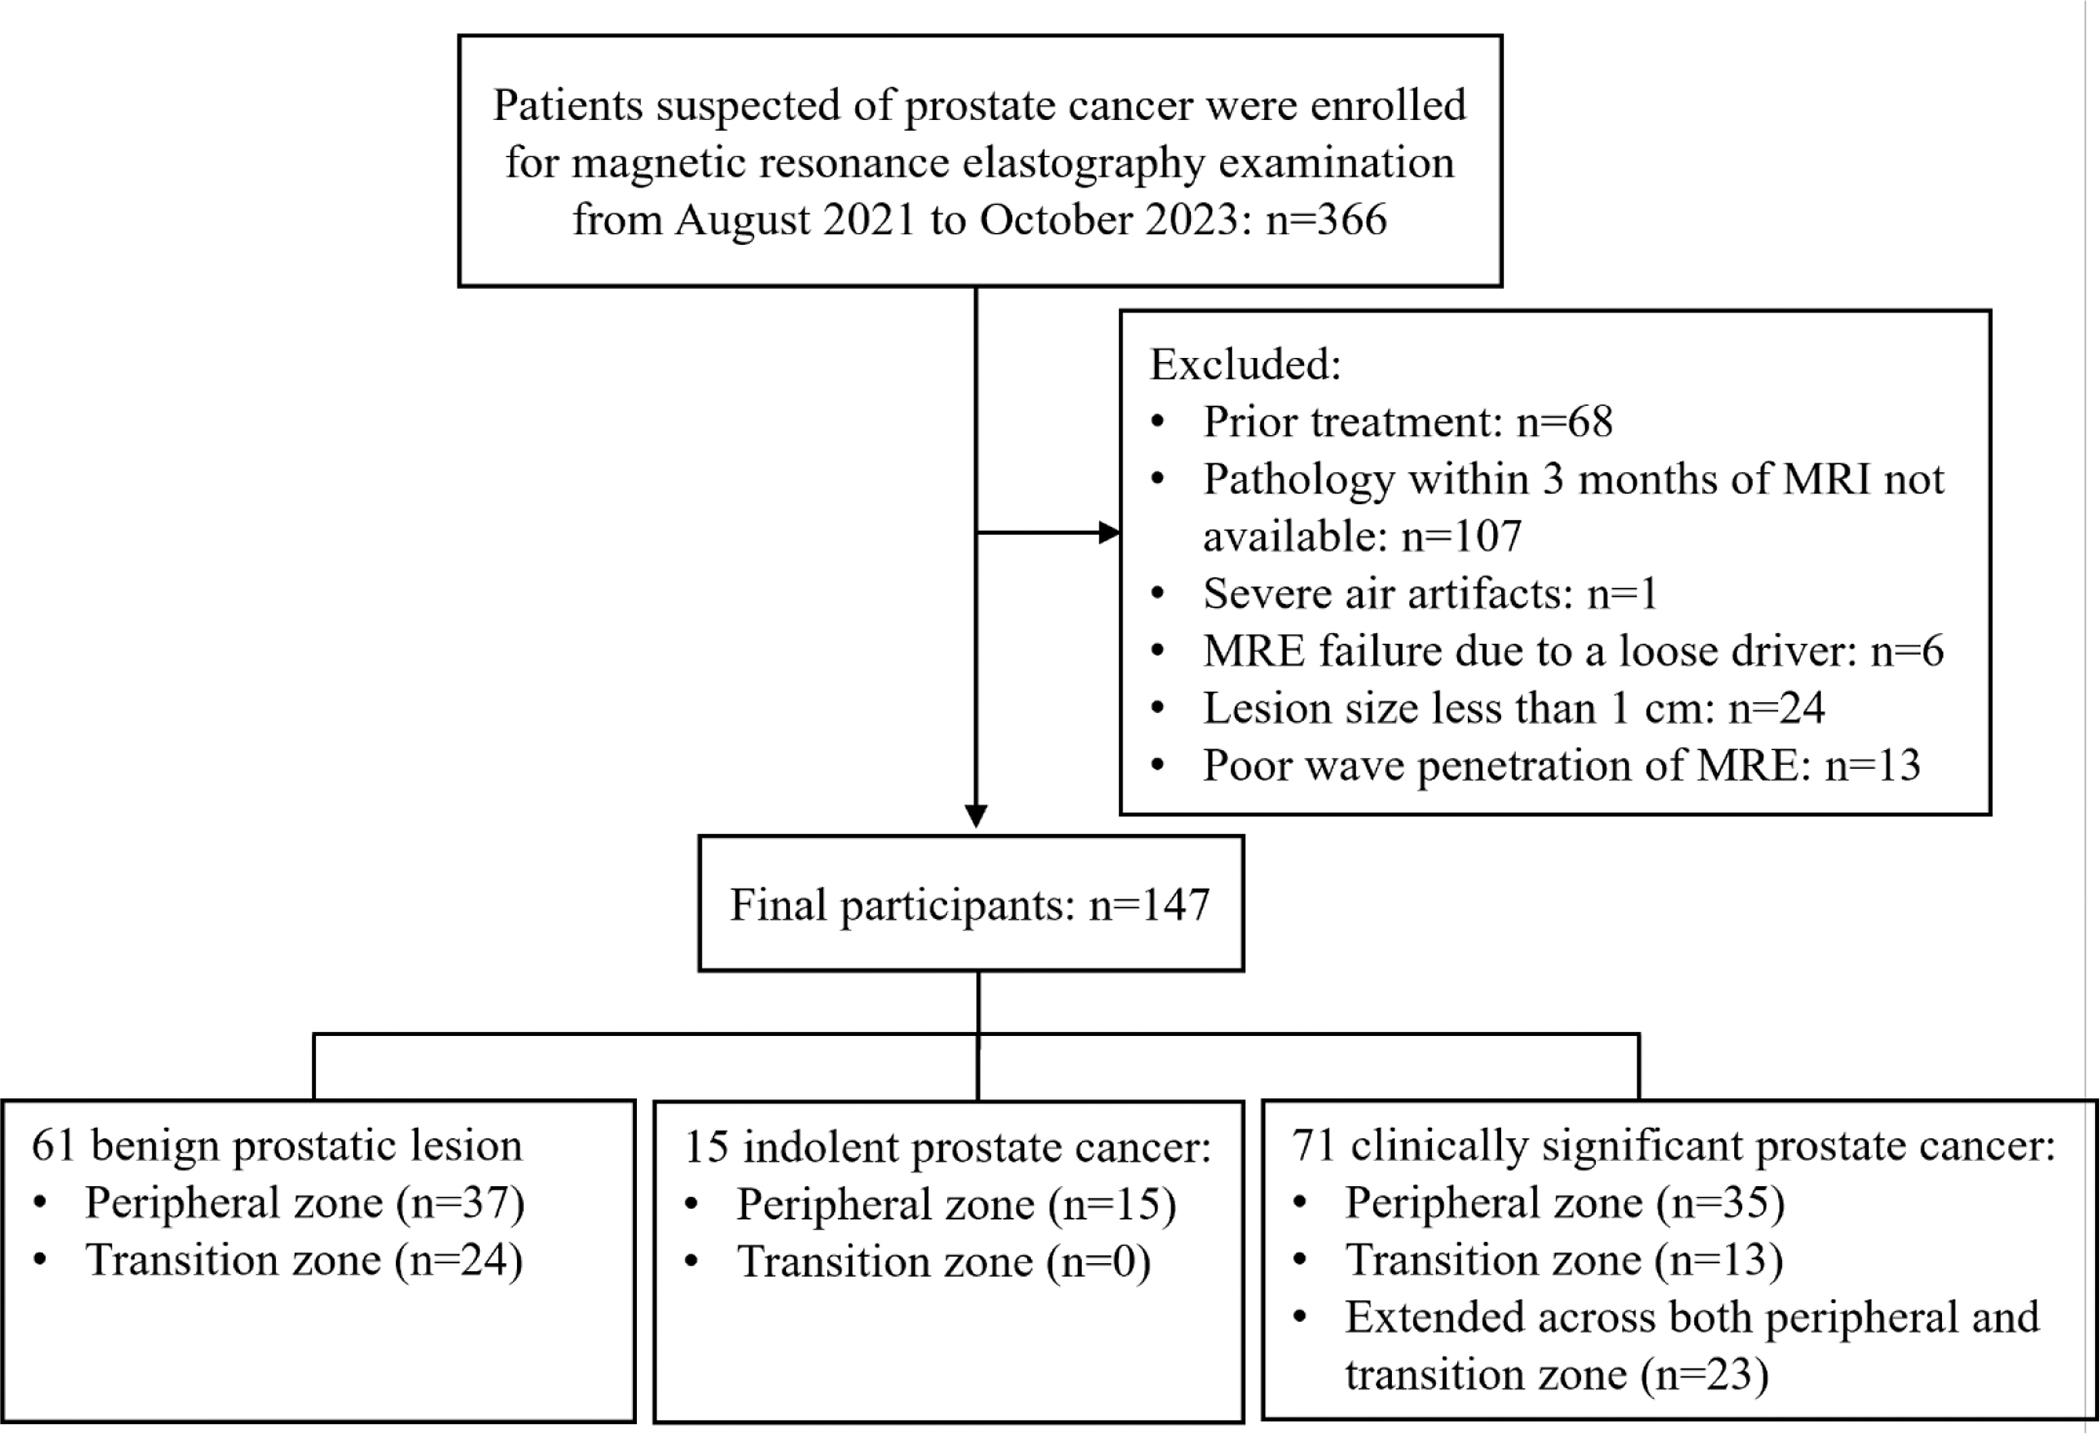
Flow chart of participants’ inclusion and exclusion.
Table1.
Demographic and clinical characteristics of study participants.
| Characteristics | Benign prostatic lesions (n=61) | Indolent prostate cancer (n=15) | Clinically significant prostate cancer (n=71) |
|---|---|---|---|
|
| |||
| Mean age (y) | 66.65 ± 10.56 | 60.66 ± 7.82 | 68.34 ± 8.62 |
| Total PSA (ng/mL) * | 8.96 (5, 13.2) | 5.79 (3.42, 9.06) | 26.1 (8.83, 100) |
| Lesion size (cm) | 1.65 ± 0.64 | 1.64 ± 0.47 | 2.75 ± 1.41 |
| Lesion location | |||
| Peripheral zone | 37 (61) † | 15 (100) | 35 (49) |
| Transitional zone | 24 (39) ‡ | 0 (0) | 13 (18) |
| Extends cross both zones | 0 (0) | 0 (0) | 23 (33) |
| PI-RADS v2.1 score | |||
| 1 | 6 (10) | 0 (0) | 0 (0) |
| 2 | 14 (23) | 2 (14) | 0 (0) |
| 3 | 26 (42) | 5 (33) | 0 (0) |
| 4 | 11 (18) | 3 (20) | 18 (25) |
| 5 | 4 (7) | 5 (33) | 53 (75) |
| Gleason score | |||
| 6 | 15 (100) | 0 (0) | |
| 7 | 0 (0) | 40 (56) | |
| 8 | 0 (0) | 13 (18) | |
| 9 | 0 (0) | 16 (23) | |
| 10 | 0 (0) | 2 (3) | |
| ISUP/WHO grade group | |||
| Group 1 | 15 (100) | 0 (0) | |
| Group 2 | 0 (0) | 15 (21) | |
| Group 3 | 0 (0) | 25 (35) | |
| Group 4 | 0 (0) | 13 (18) | |
| Group 5 | 0 (0) | 18 (26) | |
| Pathology type | |||
| Systemic biopsy | 48 (79) | 8 (53) | 23 (32) |
| Targeted biopsy | 11 (18) | 0 (0) | 14 (20) |
| Radical Prostatectomy | 0 (0) | 7 (47) | 30 (42) |
| Transurethral resection | 2 (3) | 0 (0) | 4 (6) |
Note: Data are mean ± standard deviation or numbers (percentages). PSA, prostate-specific antigen; PI-RADS v2.1, Prostate Imaging Reporting and Data System version 2.1; ISUP, International Society of Urology Pathology; WHO, World Health Organization.
Data are median values, with interquartile in parentheses.
Chronic prostatitis.
Benign prostatic hyperplasia.
Shear Stiffness of Prostate Lesions
csPCa showed significantly higher shear stiffness (SS) values than indolent PCa and benign prostatic lesions. In the peripheral zone, csPCa (n = 35) had significantly higher stiffness (3.22 ± 0.66 kPa and 5.64 ± 1.30 kPa at 60 and 90Hz) than indolent PCa (n = 15; 2.80 ± 0.63 kPa and 4.72 ± 0.70 kPa at 60 and 90Hz) and benign chronic prostatitis (n = 37; 2.46 ± 0.52 kPa and 4.38 ± 0.89 kPa at 60 and 90Hz) (Table 2, Figs. 3 and 4). No significant differences were found in stiffness values between indolent PCa and benign chronic prostatitis in the peripheral zone (p=0.202 at 60Hz, and p=0.892 at 90Hz) (Fig. 3). In the transitional zone, no significant differences were found in SS values between csPCa (n = 13, 3.33 ± 0.81 kPa and 6.42 ± 1.55 kPa at 60 and 90Hz) and benign prostate hyperplasia (n = 24, 3.66 ± 1.16 kPa at 60Hz, p=0.368; 5.91 ± 1.47 kPa at 90Hz, p=0.335). In addition, csPCa that extended across both peripheral and transitional zones showed significantly higher SS (n = 23, 4.40 ± 1.27 kPa and 7.64 ± 1.78 kPa at 60 and 90Hz) than those located exclusively at the peripheral zone and at the transitional zone. No significant difference in the SS of csPCa between the peripheral zone and the transitional zone was observed (p = 0.86 at 60Hz, and p = 0.69 at 90Hz). In addition, tumor stiffness positively correlated with lesion size (r=0.62, 95% confidence interval [CI]: 0.47–0.75 for SS at 60Hz; r=0.65, 95% CI: 0.46–0.76 for SS at 90Hz) and the total Gleason score (r=0.56, 95% CI: 0.43–0.71 for SS at 60Hz; r=0.61, 95% CI: 0.48–0.70 for SS at 90Hz). Tissue stiffness also correlated negatively with ADC values (r=−0.46, 95% CI: −0.29–−0.61 for SS at 60Hz; r=−0.42, 95% CI: −0.14–−0.59 for SS at 90Hz).
Table 2.
Mean (+/− SD) shear stiffness measurements in study participants.
| Diagnosis | Number of participants | SS at 60Hz (kPa) | p1* | p2† | SS at 90Hz (kPa) | p1* | p2† |
|---|---|---|---|---|---|---|---|
|
| |||||||
| Overall | |||||||
| Benign prostatic lesion | 61 | 2.93 ± 1.01* | 0.014 | 0.014 | 5.18 ± 1.55* | 0.001 | 0.001 |
| Indolent prostate cancer | 15 | 2.80 ± 0.63* | <0.001 | 4.72 ± 0.70* | <0.001 | ||
| Clinically significant prostate cancer | 71 | 3.62 ± 1.06 | 6.34 ± 1.74 | ||||
| Lesions located at Peripheral zone | |||||||
| Benign prostatic lesion | 37 | 2.46 ± 0.52* | <0.001 | 0.202 | 4.38 ± 0.89* | <0.001 | 0.892 |
| Indolent prostate cancer | 15 | 2.80 ± 0.63 | 0.076 | 4.72 ± 0.70* | 0.016 | ||
| Clinically significant prostate cancer | 35 | 3.22 ± 0.66 | 5.64 ± 1.30 | ||||
| Lesions located at transitional zone | |||||||
| Benign prostatic lesion | 24 | 3.66 ± 1.16 | 0.368 | 6.42 ± 1.55 | 0.335 | ||
| Clinically significant prostate cancer | 13 | 3.33 ± 0.81 | 5.91 ± 1.47 | ||||
Note:
p value of independent T-test or post hoc pairwise comparisons with Bonferroni correction when compared to values in clinically significant prostate cancer;
p value of independent T-test or post hoc pairwise comparisons with Bonferroni correction when compared to values in indolent prostate cancer. SS, shear stiffness.
Figure 3.

Boxplots of shear stiffness by MRE at 60Hz and 90Hz for benign prostatic lesions, indolent prostate cancer (PCa), and clinically significant PCa (csPCa) located at different anatomical regions.
Figure 4.

Representative axial T2-weighted images (T2WI), diffusion-weighted images (DWI) at b value of 1400 s/mm2, corresponding apparent diffusion coefficient (ADC) map, MR elastography magnitude image, and corresponding shear stiffness at 60Hz and 90Hz for three patients. A, a 77-year-old patient with chronic prostatitis. B, a 49-year-old patient with indolent prostate cancer with a Gleason score of 3+3. C, a 57-year-old patient with clinically significant prostate cancer with a Gleason score of 4+5.
Diagnostic Value of PI-RADS v2.1, Shear Stiffness and ADC for csPCa in the Peripheral Zone
The diagnostic performance of MRE and its combination with PI-RADS v2.1 for csPCa was evaluated solely for peripheral zone lesions, as stiffness differences between csPCa and benign prostatic hyperplasia in the transitional zone were insignificant. With consensus-reached PI-RADS, the AUC, sensitivity and specificity for csPCa were 0.79 (95% CI: 0.72–0.86), 100% (35/35), 58% (30/52), respectively. ADC (cutoff, ≤1.1 mm2/s) showed AUC of 0.87 (95% CI: 0.79–0.95) with sensitivity of 86% (30/35) and specificity of 81% (42/52). At 60Hz, SS (cutoff, ≥2.5 kPa) had AUC of 0.80 (95% CI: 0.72–0.89) with sensitivity and specificity of 97% (34/35) and 52% (27/52), respectively. At 90Hz, SS (cutoff, ≥5.2 kPa) showed sensitivity, specificity and AUC of 63% (22/35), 87% (45/52), and 0.78 (95% CI: 0.67–0.88), respectively. The ROC curves of PI-RADS v2.1, ADC, SS at 60 and 90 Hz are shown in Figure 5.
Figure 5.

Receiver operating characteristic curves for assessing diagnostic performance in identifying clinically significant prostate cancer located at the peripheral zone using the consensus-reached PI-RADS v2.1 score, apparent diffusion coefficient (ADC), shear stiffness at 60Hz mechanical frequency, and shear stiffness at 90Hz mechanical frequency.
mPI-RADS Incorporating ADC and SS Values in the Peripheral Zone
Diagnostic performance of the consensus-reached PI-RADS v2.1 score, SS and ADC measurements, and each mPI-RADS score in identifying csPCa in the peripheral zone are summarized in Table 3. Using the maximum Youden-index rule, mPI-RADS incorporating ADC achieved a sensitivity of 86% (30/35), specificity of 83% (43/52), and an AUC of 0.84 (95% CI: 0.76–0.92) which did not differ significantly from that achieved with unmodified PI-RADS v2.1 for csPCa detection in the peripheral zone (p=0.21). Additionally, mPI-RADS incorporating SS at 60Hz showed a sensitivity of 97% (34/35), specificity of 75% (39/52), and a significantly higher AUC of 0.86 (95% CI: 0.80–0.93) than unmodified PI-RADS, while mPI-RADS incorporating SS at 90Hz demonstrated a sensitivity of 63% (22/35), specificity of 98% (51/52), and an AUC of 0.81 (95% CI: 0.72–0.89) which was not significantly different to that of unmodified PI-RADS (p=0.76).
Table 3.
The diagnostic performance of the consensus-reached PI-RADS v2.1 score, apparent diffusion coefficient, stiffness, and the modified PI-RADS score in identifying clinically significant prostate cancer in the peripheral zone.
| Variables | Cutoff value | AUC | Sensitivity (%) | Specificity (%) | p-values§ |
|---|---|---|---|---|---|
|
| |||||
| PI–RADS v2.1 score | ≥4 | 0.79 [0.72–0.86] | 100 (35/35) [88–100] | 58 (30/52) [43–71] | |
| ADC (mm2/s) | ≤1.1* | 0.87 [0.79–0.95] | 86 (30/35) [69–95] | 81 (42/52) [67–90] | 0.05 |
| SS at 60Hz (kPa) | ≥2.5* | 0.80 [0.72–0.89] | 97 (34/35) [83–100] | 52 (27/52) [38–66] | 0.76 |
| SS at 90Hz (kPa) | ≥5.2* | 0.78 [0.67–0.88] | 63 (22/35) [45–78] | 87 (45/52) [74–94] | 0.88 |
| ADC (mm2/s) | ≤1.4† | 0.73 [0.65–0.81] | 94 (33/35) [79–99] | 52 (27/52) [38–66] | 0.15 |
| SS at 60Hz (kPa) | ≥2.5† | 0.75 [0.67–0.82] | 97 (34/35) [83–100] | 52 (27/52) [38–66] | 0.35 |
| SS at 90Hz (kPa) | ≥3.7† | 0.53 [0.48–0.58] | 97 (34/35) [83–100] | 10 (5/52) [4–22] | <0.001 |
| Modified PI–RADS score by cutoffs corresponding to maximum Youden–index ‡ | |||||
| mPI–RADS by ADC >1.1 mm2/s | ≥4 | 0.84 [0.76–0.92] | 86 (30/35) [69–95] | 83 (43/52) [69–91] | 0.21 |
| mPI–RADS by SS at 60Hz <2.5 kPa | ≥4 | 0.86 [0.80–0.93] | 97 (34/35) [83–100] | 75 (39/52) [61–86] | 0.02 |
| mPI–RADS by SS at 90Hz <5.2 kPa | ≥4 | 0.81 [0.72–0.89] | 63 (22/35) [45–78] | 98 (51/52) [88–100] | 0.76 |
| Modified PI–RADS score by cutoffs corresponding to ≥95% sensitivity ‡ | |||||
| mPI–RADS by ADC >1.4 mm2/s | ≥4 | 0.81 [0.73–0.88] | 97 (34/35) [83–100] | 67 (35/52) [53–79] | 0.50 |
| mPI–RADS by SS at 60Hz <2.5 kPa | ≥4 | 0.86 [0.80–0.93] | 97 (34/35) [83–100] | 75 (39/52) [61–86] | 0.02 |
| mPI–RADS by SS at 90Hz <3.7 kPa | ≥4 | 0.78 [0.71–0.86] | 97 (34/35) [83–100] | 60 (31/52) [45–73] | 0.79 |
Note: data in parentheses are numerators/denominators and values in brackets are 95% confidence intervals. AUC, area under the receiver operating characteristic curve; PI-RADS v2.1, Prostate Imaging Reporting and Data System version 2.1; ADC, apparent diffusion coefficient; SS, shear stiffness; mPI-RADS, modified PI-RADS based on the consensus-reached PI-RADS v2.1 score.
Cutoffs corresponding to maximum Youden-index;
cutoffs corresponding to ≥95% sensitivity;
Original PI-RADS scores ≥4 were set to score 3 in the mPI-RADS scoring system if the measurement exceeded the ADC cutoff or fell below the stiffness cutoff, respectively.
AUC values were compared to the AUC value of the unmodified PI-RADS v2.1 score using the Delong test.
Using the high sensitivity rule, the cutoff was set as >1.4 mm2/s for ADC, <2.5 kPa for SS at 60Hz, and <3.7 kPa for SS at 90Hz. The mPI-RADS incorporating ADC achieved a sensitivity of 97% (34/35), specificity of 67% (32/52), and an AUC of 0.81 (95% CI: 0.73–0.88) which was not significantly different to that of unmodified PI-RADS (p=0.50) for csPCa detection in the peripheral zone. Similarly, mPI-RADS incorporating SS at 60Hz yielded a sensitivity of 97% (34/35), specificity of 75% (39/52), and a significantly higher AUC of 0.86 (95% CI: 0.80–0.93) than unmodified PI-RADS, while mPI-RADS incorporating SS at 90Hz showed a sensitivity of 97% (34/35), specificity of 60% (31/52), and an AUC of 0.78 (95% CI: 0.71–0.86) which was not significantly different to unmodified PI-RADS (p=0.79). The diagnostic performance of the PI-RADS v2.1 score by each radiologist and the corresponding mPI-RADS score in identifying csPCa are summarized in Supplement Table S2.
Interobserver agreement
The Fleiss kappa for PI-RADS v2.1 score assessment by the 3 independent reviewers was 0.53 (95% CI: 0.46–0.61). The ICCs between two readers were 0.97 (95% CI: 0.94–0.99) for ADC, 0.98 (95% CI: 0.96–0.99) for SS at 60Hz and 0.99 (95% CI: 0.98–0.99) for SS at 90Hz. Bland-Altman plots showing the difference in ADC and stiffness between two reviewers are shown in Figure 6. The mean difference between two reviewers was 0.04 mm2/s for ADC (limits of agreement ranging from −0.11 to 0.19 mm2/s), 0.04 kPa for SS at 60Hz (limits of agreement ranging from −0.50 to 0.58 kPa), and 0.06 kPa for SS at 90Hz (limits of agreement ranging from −0.67 to 0.79 kPa).
Figure 6.

Bland-Altman plots showing inter-reviewer agreement of apparent diffusion coefficient (A), shear stiffness at 60Hz mechanical frequency (B) and shear stiffness at 90Hz mechanical frequency (C) from 2 readers in all participants. ICC, intraclass correlation coefficients; LOA, limit of agreement.
DISCUSSION
There is a clinical need to further improve the specificity for PCa diagnosis, especially for csPCa, to avoid overdiagnosis and overtreatment (3–5). Results of this study showed that MRE-derived stiffness had a moderate diagnostic performance for csPCa detection in the peripheral zone. The modified PI-RADS score incorporating stiffness in the PI-RADS v2.1 score significantly improved the diagnostic performance and increased specificity for csPCa with minimal impact on sensitivity.
The improved specificity for the detection of csPCa with the addition of biomechanical properties found in this study are in accordance with previous studies (12, 14, 21). While these have focused on the detection of PCa (12, 14, 21), the current study was specifically focused on the differentiation of csPCa from non-csPCa lesions and also included participants with indolent PCa. The AUC of tissue stiffness for csPCa in the current study was lower than that reported by Li et al. using tomoelastography (14). While there are technical distinctions between MRE and tomoelastography, this difference may also be attributed to the inclusion of indolent PCa in the current study, where the subject population represented the spectrum of patients attending for csPCa screening in clinical practice. The current study also demonstrated significant differences in transitional stiffness values between participants with benign chronic prostatitis and csPCa.
To date, few studies have investigated the diagnostic performance of MRE for csPCa, and data regarding diagnostic cutoffs in tumor stiffness are limited. The optimal cutoff introduced in the current study (5.2 kPa for SS at 90Hz) was lower than the cutoff of 5.96 kPa used by Wang et al (12), which might be explained by their inclusion of both chronic prostatitis at the peripheral zone and benign prostatic hyperplasia at the transitional zone in the non-csPCa group. The use of higher mechanical frequency results higher spatial resolution for MRE (22) and in the prostate, where high structure heterogeneity is present, this may lead to improved accuracy. Wang et al previously explored the diagnostic performance of high-frequency MRE for PCa detection in 35 patients using a modified intraurethral driver and reported AUC increasing from 0.58 at 60Hz to 0.94 at 150Hz (12). Although the overall diagnostic performance was similar at 60Hz and 90Hz in the current study, there was a trend towards higher specificity for csPCa with MRE at 90Hz compared with MRE at 60Hz using the pelvic driver placed over the pubic symphysis.
The ADC value is an important biomarker of PCa and has been extensively studied for its diagnostic utility (23–26). The finding of improved performance for detection of csPCa when incorporating ADC in the current study is in agreement with previous studies on ADC values (23, 24, 26). Interestingly, when aiming for high sensitivity, which is acceptable in clinical settings, the mPI-RADS score incorporating SS at 60Hz consistently demonstrated higher specificity compared to the mPI-RADS score incorporating ADC for all reviewers. Although the differences were not statistically significant, it might suggest a potential preference for MRE when feasible. Further studies are required to fully elucidate the optimal biomarker for improving the identification of csPCa.
Limitations
First, this study was conducted in a single center due to the limited availability of 3D MRE. Nonetheless, the inclusion of a comprehensive spectrum of disease severity, as indicated by PI-RADS v2.1 scores ranging from 1 to 5, mitigated selection bias within the study cohort. Second, to ensure reliable stiffness assessment, only lesions ≥ 1 cm were included in this study. This results in the high sensitivity of the PI-RADS v2.1 score for csPCa in this study and leaves the diagnostic value of MRE for smaller lesions unclear. Third, the small number of lesions exclusively located within the transitional zone has limited the statistical power in detecting any differences and assessing the performance of MRE for the differentiation of lesions located in that zone. Further study with larger sample size is required to fully investigate the role of MRE in characterizing lesions located in the transitional zone. Finally, 13 participants were excluded from analysis due to poor MRE quality resulting from inadequate wave penetration. Factors potentially affecting prostate MRE quality include BMI, prostate volume, and the frequency and amplitude of mechanical waves. Further research is needed to fully elucidate the influence of these physio-pathological and mechanical factors on prostate MRE quality.
Conclusion
Significantly increased stiffness is a property of prostate cancer in the peripheral zone, particularly clinically significant prostate cancer (csPCa). Tumor stiffness showed moderate diagnostic performances for csPCa in the peripheral zone. Integrating stiffness into the Prostate Imaging Reporting and Data System version 2.1 improved the diagnostic accuracy and specificity for csPCa and could potentially enable more precise exclusion of patients with csPCa in the peripheral zone and reduce unnecessary biopsies.
Supplementary Material
Conflicts of interest and sources of funding:
This study was supported by the National Nature Science Foundation of China (Grant number 82302155), the Post-Doctor Research Project, West China Hospital of Sichuan University (Grant number: 2021HXBH042), the 1.3.5 project for disciplines of excellence at West China Hospital, Sichuan University (Grant number ZYGD22004), the Post-Doctoral Station Development project of Sanya (Grant number 23CZ009), the Science and Technology Support Program of Sichuan Province (Grant number 2023YFS0010), the Department of Defense (DoD) award (Grant number W81XWH-19-1-0583), and the US National Institutes of Health (NIH) (Grant number R01 EB017197 & R37 EB001981). The Mayo Clinic and Jun Chen have intellectual property and a financial interest related to Magnetic resonance elastography technology in this work.
References
- 1.Bray F, Ferlay J, Soerjomataram I, Siegel RL, Torre LA, Jemal A: Global cancer statistics 2018: GLOBOCAN estimates of incidence and mortality worldwide for 36 cancers in 185 countries. CA Cancer J Clin 2018; 68:394–424. [DOI] [PubMed] [Google Scholar]
- 2.Litwin MS, Tan H-J: The Diagnosis and Treatment of Prostate Cancer: A Review. JAMA 2017; 317:2532–2542. [DOI] [PubMed] [Google Scholar]
- 3.Turkbey B, Rosenkrantz AB, Haider MA, et al. : Prostate Imaging Reporting and Data System Version 2.1: 2019 Update of Prostate Imaging Reporting and Data System Version 2. Eur Urol 2019; 76:340–351. [DOI] [PubMed] [Google Scholar]
- 4.Turkbey B, Purysko AS: PI-RADS: Where Next? Radiology 2023; 307:e223128. [DOI] [PMC free article] [PubMed] [Google Scholar]
- 5.Stabile A, Giganti F, Rosenkrantz AB, et al. : Multiparametric MRI for prostate cancer diagnosis: current status and future directions. Nat Rev Urol 2020; 17:41–61. [DOI] [PubMed] [Google Scholar]
- 6.Kawa SM, Stroomberg HV, Larsen SB, et al. : A Nationwide Analysis of Risk of Prostate Cancer Diagnosis and Mortality following an Initial Negative Transrectal Ultrasound Biopsy with Long-Term Followup. J Urol 2022; 208:100–108. [DOI] [PMC free article] [PubMed] [Google Scholar]
- 7.Kostallari E, Wei B, Sicard D, et al. : Stiffness is associated with hepatic stellate cell heterogeneity during liver fibrosis. Am J Physiol Gastrointest Liver Physiol 2022; 322:G234–G246. [DOI] [PMC free article] [PubMed] [Google Scholar]
- 8.Ehman RL: Magnetic resonance elastography: from invention to standard of care. Abdom Radiol N Y 2022; 47:3028–3036. [DOI] [PMC free article] [PubMed] [Google Scholar]
- 9.Hu X, Zhou J, Li Y, et al. : Added Value of Viscoelasticity for MRI-Based Prediction of Ki-67 Expression of Hepatocellular Carcinoma Using a Deep Learning Combined Radiomics (DLCR) Model. Cancers 2022; 14:2575. [DOI] [PMC free article] [PubMed] [Google Scholar]
- 10.Wang J, Shan Q, Liu Y, et al. : 3D MR Elastography of Hepatocellular Carcinomas as a Potential Biomarker for Predicting Tumor Recurrence: HCC Evaluation With MR Elastography. J Magn Reson Imaging 2019; 49:719–730. [DOI] [PMC free article] [PubMed] [Google Scholar]
- 11.Zhang H-M, Wen D-G, Chen J, et al. : A diagnostic test of three-dimensional magnetic resonance elastography imaging for preoperative prediction of microvascular invasion in patients with T1 stage clear cell renal carcinoma. Transl Androl Urol 2023; 12:466–476. [DOI] [PMC free article] [PubMed] [Google Scholar]
- 12.Deng Y, Yi Z, Zhang T, et al. : Magnetic resonance elastography of the prostate in patients with lower urinary tract symptoms: feasibility of the modified driver at high multi-frequencies. Abdom Radiol 2022; 47:399–408. [DOI] [PMC free article] [PubMed] [Google Scholar]
- 13.Hu B, Deng Y, Chen J, et al. : Evaluation of MR elastography for prediction of lymph node metastasis in prostate cancer. Abdom Radiol 2021; 46:3387–3400. [DOI] [PMC free article] [PubMed] [Google Scholar]
- 14.Li M, Guo J, Hu P, et al. : Tomoelastography Based on Multifrequency MR Elastography for Prostate Cancer Detection: Comparison with Multiparametric MRI. Radiology 2021; 299:362–370. [DOI] [PubMed] [Google Scholar]
- 15.Silva AM, Grimm RC, Glaser KJ, et al. : Magnetic resonance elastography: evaluation of new inversion algorithm and quantitative analysis method. Abdom Imaging 2015; 40:810–817. [DOI] [PubMed] [Google Scholar]
- 16.van Leenders GJLH, van der Kwast TH, Grignon DJ, et al. : The 2019 International Society of Urological Pathology (ISUP) Consensus Conference on Grading of Prostatic Carcinoma. Am J Surg Pathol 2020; 44:e87–e99. [DOI] [PMC free article] [PubMed] [Google Scholar]
- 17.Samaratunga H, Egevad L, Yaxley J, et al. : Gleason score 3+3=6 prostatic adenocarcinoma is not benign and the current debate is unhelpful to clinicians and patients. Pathology (Phila) 2024; 56:33–38. [DOI] [PubMed] [Google Scholar]
- 18.Talwar R, Akinsola O, Penson DF: What is cancer? A focus on Grade Group 1 prostate cancer. BJU Int 2024; 133:360–364. [DOI] [PubMed] [Google Scholar]
- 19.Landis JR, Koch GG: The Measurement of Observer Agreement for Categorical Data. Biometrics 1977; 33:159–174. [PubMed] [Google Scholar]
- 20.Koo TK, Li MY: A Guideline of Selecting and Reporting Intraclass Correlation Coefficients for Reliability Research. J Chiropr Med 2016; 15:155–163. [DOI] [PMC free article] [PubMed] [Google Scholar]
- 21.Sahebjavaher RS, Nir G, Honarvar M, et al. : MR elastography of prostate cancer: quantitative comparison with histopathology and repeatability of methods. NMR Biomed 2015; 28:124–139. [DOI] [PubMed] [Google Scholar]
- 22.Reiter R, Majumdar S, Kearney S, et al. : Investigating the heterogeneity of viscoelastic properties in prostate cancer using MR elastography at 9.4T in fresh prostatectomy specimens. Magn Reson Imaging 2022; 87:113–118. [DOI] [PubMed] [Google Scholar]
- 23.Pepe P, D’Urso D, Garufi A, et al. : Multiparametric MRI Apparent Diffusion Coefficient (ADC) Accuracy in Diagnosing Clinically Significant Prostate Cancer. Vivo Athens Greece 2017; 31:415–418. [DOI] [PMC free article] [PubMed] [Google Scholar]
- 24.Tavakoli AA, Hielscher T, Badura P, et al. : Contribution of Dynamic Contrast-enhanced and Diffusion MRI to PI-RADS for Detecting Clinically Significant Prostate Cancer. Radiology 2023; 306:186–199. [DOI] [PubMed] [Google Scholar]
- 25.Fennessy FM, Maier SE: Quantitative diffusion MRI in prostate cancer: Image quality, what we can measure and how it improves clinical assessment. Eur J Radiol 2023; 167:111066. [DOI] [PMC free article] [PubMed] [Google Scholar]
- 26.Nagel KNA, Schouten MG, Hambrock T, et al. : Differentiation of prostatitis and prostate cancer by using diffusion-weighted MR imaging and MR-guided biopsy at 3 T. Radiology 2013; 267:164–172. [DOI] [PubMed] [Google Scholar]
Associated Data
This section collects any data citations, data availability statements, or supplementary materials included in this article.