

Abstract
Metabolic syndrome is leading to an increased risk of diabetes and cardiovascular disease. Our study developed a model using retinal image data from fundus photographs taken during comprehensive health check-ups to classify metabolic syndrome. The model achieved an AUC of 0.7752 (95% CI: 0.7719–0.7786) using retinal images, and an AUC of 0.8725 (95% CI: 0.8669–0.8781) when combining retinal images with basic clinical features. Furthermore, we propose a method to improve the interpretability of the relationship between retinal image features and metabolic syndrome by visualizing metabolic syndrome-related areas in retinal images. The results highlight the potential of retinal images in classifying metabolic syndrome.
Subject terms: Machine learning, Optical imaging, Bioinformatics
Introduction
The prevalence of metabolic syndrome is on an increasing trend worldwide, regardless of social and economic differences among countries1. In countries such as Australia, France, and Mauritius, the prevalence of metabolic syndrome in adult men is estimated to be 17% on average, and that of metabolic syndrome in adult women is estimated to be 13% on average2. Lifestyle and overnutrition are primary contributors to this condition1. Specifically, in South Korea, the prevalence of metabolic syndrome has notably increased following lifestyle and dietary changes triggered by the COVID-19 pandemic3. Metabolic syndrome is defined as the set of factors that increase the risk of cardiovascular disease and diabetes, such as hypertension, central obesity, insulin resistance, and atherogenic dyslipidemia4,5. Individuals with metabolic syndrome are twice as likely to develop cardiovascular diseases and five times more likely to develop type 2 diabetes than those without metabolic syndrome6.
Predicting and diagnosing metabolic syndrome can significantly reduce the risk of cardiovascular diseases and diabetes. Recent advances in machine learning have facilitated metabolic syndrome prediction using increasing amounts of clinical data7–11. However, most studies have primarily focused on clinical features, with limited exploration of other modalities. Our study demonstrates the potential of using retinal images for metabolic syndrome classification. Fundoscopy test is a non-invasive tool traditionally used to monitor ocular symptoms in diabetic participants. Recently, retinal image data has been accumulated because it has been widely used for the purpose of screening in a comprehensive health check-up. In addition, the clinical importance of retinal images has been increased, providing information on the characteristics of various diseases12. Retinal microvascular abnormalities, such as focal arteriolar narrowing and arteriovenous nicking, often indicate microcirculatory damage caused by hypertension or aging13 and are associated with diabetes-related retinopathy and other microvascular diseases14. Notably, even in the absence of hyperglycemia or hypertension, retinal microvascular abnormalities can emerge due to dyslipidemia or obesity15. Metabolic syndrome, in particular, is known to be associated with atherosclerosis disease16. Individuals with metabolic syndrome, regardless of age, gender, or race, exhibit more retinopathy, arteriovenous nicking, focal arteriolar narrowing, smaller retinal diameters, and larger retinal venular diameters15.
Recent studies have focused on using retinal images and deep learning models to predict and classify diseases like diabetes and cardiovascular disease17–25. However, the studies classifying metabolic syndrome through retinal images are insufficient. Therefore, our study aims to classify metabolic syndrome using retinal images and enhance the interpretability of these classifications by visualizing metabolic syndrome-related areas within the retinal images. Additionally, we incorporated basic demographic features, such as age and gender, into our analysis. Furthermore, given that Body Mass Index (BMI) is a highly relevant factor for metabolic syndrome8, we investigated the impact of including or excluding BMI in our analysis.
Results
Study population characteristics
We developed a model by fine-tuning a pretrained Vision Transformer-based model, RETFound, using a dataset collected from 3000 individuals who underwent comprehensive health check-ups at Seoul National University Hospital Gangnam Center. The dataset includes retinal images from both the left and right eyes of each participant, comprising 2972 retinal images from 1486 individuals with metabolic syndrome and 3028 retinal images from 1514 normal cases. We assessed the model’s performance using 5-fold cross-validation, using 80% of the data (N = 2400) for training and validation, and the remaining 20% (N = 600) for testing at each run. Specifically, 2424 retinal images from metabolic syndrome cases and 2376 retinal images from normal cases were used for training and validation, while 596 retinal images from metabolic syndrome cases and 604 retinal images from normal cases were used for testing. The baseline characteristics of the study population are detailed in Table 1.
Table 1.
Baseline characteristics of the study participants
| Total set (N = 3000) | Train/validation set (N = 2400) | Test set (N = 600) | ||
|---|---|---|---|---|
| Age | 51.8 8.7 | 51.9 8.8 | 51.68.3 | |
| Gender | Male | 1014 (33.8%) | 814 (33.9%) | 200 (33.3%) |
| Female | 1986 (66.2%) | 1586 (66.1%) | 400 (66.7%) | |
| Body mass index (kg/m²) | 24.4 3.3 | 24.3 3.2 | 24.4 3.4 | |
| Waist circumference (cm) | 86.3 9.4 | 86.3 9.4 | 86.5 9.4 | |
| Metabolic syndrome | Yes | 1486 (49.5%) | 1188 (49.5%) | 298 (49.7%) |
| No | 1514 (50.5%) | 1212 (50.5%) | 302 (50.3%) | |
| Hypertension diagnosis | Yes | 791 (26.4%) | 613 (25.5%) | 178 (29.7%) |
| No | 2209 (73.6%) | 1787 (74.5%) | 422 (70.3%) | |
| Glucose level (mg/dL) | 104.0 21.5 | 103 21.5 | 104.3 21.7 | |
| Diabetes diagnosis | Yes | 235 (7.8%) | 194 (8.1%) | 41 (6.8%) |
| No | 2765 (92.2%) | 2206 (91.9%) | 559 (93.2%) | |
| Triglycerides (mg/dL) | 137.3 91.1 | 137.1 91.8 | 138.0 88.6 | |
| HDL Cholesterol (mg/dL) | 51.1 12.2 | 51.1 12.2 | 50.9 12.2 | |
| Dyslipidemia diagnosis | Yes | 570 (19.0%) | 453 (18.9%) | 117 (19.5%) |
| No | 2430 (81.0%) | 1947 (81.1%) | 483 (80.5%) | |
Metabolic syndrome classification performance
To evaluate the effectiveness of integrating clinical features with retinal images in metabolic syndrome classification, we compared the performances with and without retinal image features, as detailed in Table 2. Retinal image features were extracted using RETFound20 and combined from both left and right eyes. We employed Logistic Regression to analyze clinical features such as age, gender, and BMI, and a combination of these features with retinal image features extracted by RETFound to classify metabolic syndrome, as illustrated in Fig. 1.
Table 2.
Performance comparison of metabolic syndrome classification using basic clinical features (age, gender, BMI) and retinal image features
| Features | Precision | Sensitivity | Specificity | F1 score | Accuracy | AUC |
|---|---|---|---|---|---|---|
| Age, Gender | 0.6194 (0.0023) | 0.7906 (0.0237) | 0.5205 (0.0180) | 0.6945 (0.0081) | 0.6547 (0.0034) | 0.6872 (1.9e-5) |
| Retinal images | 0.6966 (0.0095) | 0.7295 (0.0298) | 0.6861 (0.0264) | 0.7124 (0.0099) | 0.7077 (0.0038) | 0.7752 (0.0034) |
| Age, Gender, Retinal images | 0.6968 (0.0090) | 0.7289 (0.0285) | 0.6868 (0.0249) | 0.7122 (0.0096) | 0.7077 (0.0038) | 0.7755 (0.0037) |
| BMI | 0.7629 (0.0075) | 0.7792 (0.0104) | 0.7609 (0.0125) | 0.7709 (0.0030) | 0.7700 (0.0029) | 0.8605 (1.1e-16) |
| Age, Gender, BMI | 0.7696 (0.0046) | 0.7799 (0.0109) | 0.7695 (0.0085) | 0.7747 (0.0041) | 0.7747 (0.0027) | 0.8640 (0.0005) |
| Age, Gender, BMI, Retinal images | 0.7718 (0.0048) | 0.8013 (0.0093) | 0.7662 (0.0068) | 0.7863 (0.0052) | 0.7837 (0.0046) | 0.8725 (0.0041) |
The mean performance values with 95% confidence intervals were obtained through 5-fold cross-validation. All results were achieved using Logistic Regression, leveraging combined features from the left and right retinal images extracted with RETFound (Retinal), as detailed in Supplementary Table 2.
The best performance for each evaluation metric among the models using different features is highlighted in bold.
Fig. 1. Model architecture.

The left and right retinal images of each participant were learned separately using RETFound20, a Vision Transformer (ViT)72-based model, to extract image features. These features are then concatenated with clinical features, and the combined features are used to classify them as either having metabolic syndrome or being normal through Logistic Regression. The model also employs a transformer-based explainability method27 to visualize which parts of the images are most indicative of metabolic syndrome, enhancing the interpretability of our model.
Using only basic demographic features, such as age and gender, resulted in an AUC of 0.6872 1.9e-5 (95% CI). When these were combined with the retinal image features, the AUC improved to 0.7755 (95% CI: 0.7719–0.7792) ( 0.01). Interestingly, the performance based solely on retinal image features was comparable, with an AUC of 0.7752 (95% CI: 0.7719–0.7786) ( = 0.87), suggesting that while age and gender have a marginal impact on metabolic syndrome classification, retinal image features contribute substantially to performance improvements.
Further analysis, including BMI, a factor strongly associated with metabolic syndrome, revealed that using BMI alone achieved an AUC of 0.8605 1.1e-16 (95% CI). When BMI was combined with age and gender, the AUC slightly increased to 0.8640 (95% CI: 0.8635–0.8645). Performance improved further to an AUC of 0.8725 (95% CI: 0.8669–0.8781) when these clinical features were combined with retinal images, indicating statistical significance ( = 0.003). These findings clearly demonstrate that our model, which incorporates retinal images with clinical features, accurately classifies metabolic syndrome.
Obesity-based subgroup analysis
In Fig. 2, we illustrate the BMI distribution of the test set (N = 600), categorizing individuals into four groups based on their classification outcomes. This comparison shows the performance of models using clinical features such as age, gender, and BMI against those combined with retinal images and clinical features. Additional findings from the other four folds can be found in Supplementary Fig. 1. Notably, while metabolic syndrome was primarily grouped with the obese group (BMI 25 kg/m2) and normal status with the non-obese group (BMI 25 kg/m2), exceptions were observed. Accordingly, we performed a subgroup analysis according to BMI-based obesity. We demonstrated the utility of retinal image features for classifying metabolic syndrome in the obese group and the non-obese group, respectively. For example, Group D includes non-obese cases misclassified by clinical features but correctly classified with retinal images, suggesting that retinal images can improve classification performance for challenging cases. Conversely, Group C suggests that retinal image features might occasionally lead to misclassifications in less challenging cases.
Fig. 2. BMI distribution for normal and metabolic syndrome participants, categorized into four groups based on their classification outcomes.
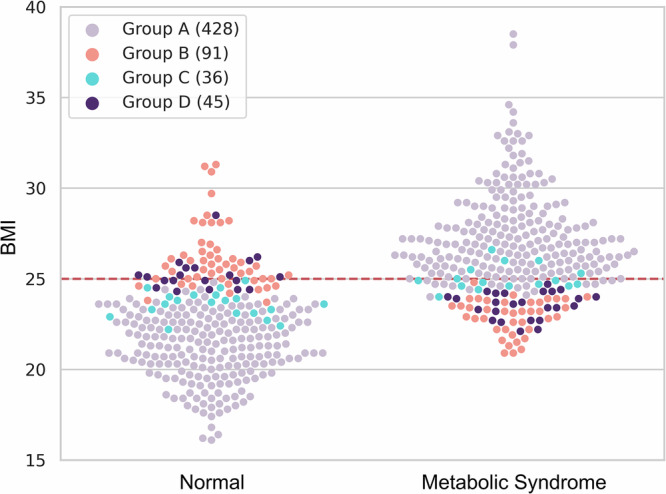
Group A is participants who were correctly classified both when using clinical features alone and when using combined clinical and retinal image features. Group B is participants misclassified both when using only clinical features and when using the combined clinical and retinal image features. Group C are participants correctly classified when using only clinical features but misclassified when using combined clinical and retinal image features. Group D are participants correctly classified when using combined features but misclassified when using only clinical features. The red line indicates a BMI of 25 kg/m².
Figure 3 displays the feature importance scores for predicting normal or metabolic syndrome in four representative individuals using Shapley Additive Explanations (SHAP)26. It compares the influence of retinal images on metabolic syndrome with other clinical features, showing the possibility that retinal images can be used as a biomarker. Although BMI remained a significant predictor, retinal image features emerged as particularly influential in cases where BMI showed a negative correlation with metabolic status. Notably, in predicting metabolic syndrome among obese individuals, both BMI and retinal images positively impacted classification, with retinal images being more influential. These findings showed the benefit of integrating retinal images with clinical features to improve classification performance in challenging cases, especially for non-obese individuals.
Fig. 3. Feature importance scores for predicting normal or metabolic syndrome in four representative individuals.

Feature importance is expressed as the sum of SHAP values for each feature. A positive SHAP value indicates a positive correlation with the ground truth, while a negative SHAP value indicates a negative correlation. Information outside the plot represents the participant’s BMI, ground truth, and the results and probabilities predicted by the model (Pred: Prediction, Pred Prob: Prediction Probability). The red line indicates a BMI of 25 kg/m².
Performance analysis on associated diseases
Metabolic syndrome is associated with an increased risk of developing conditions such as hypertension, diabetes, and dyslipidemia. To explore this association, we used retinal image features trained to classify metabolic syndrome to classify these associated diseases. Figure 4 shows the classification performance for hypertension, diabetes, and dyslipidemia using retinal image features alone, clinical features (age, gender, BMI) alone, and a combination of both.
Fig. 4. Classification performance for associated diseases using clinical and retinal image features.

Classification of diseases associated with metabolic syndrome (hypertension, diabetes, dyslipidemia) was performed using clinical and retinal image features. The classification performances were evaluated using AUC. The -value was used to show the statistical significance of combining clinical and retinal features, comparing the AUCs of models using retinal features alone, clinical features alone, and the combined model.
Our model demonstrated the potential to enhance classification accuracy for these related diseases. Notably, the combination of retinal images and clinical features improved performance for all three diseases compared to using clinical features alone ( 0.01). In the case of diabetes, retinal image features alone performed slightly better than the combination ( = 0.43), indicating a unique contribution of retinal images in diabetes. However, for hypertension and dyslipidemia, the performance using both clinical and retinal image features together showed improvements over using retinal image features alone ( 0.01). These results indicate that retinal image features related to metabolic syndrome can contribute to the accurate diagnosis of these closely associated diseases.
Explainable visualization
Figure 5 illustrates the explanation results obtained through the classification performance of RETFound from 224×224 retinal images (AUC = 0.7401 0.0081) as detailed in Supplementary Table 2. These results were generated using a transformer-based explainability method27. The visualization highlights areas in the retinal images associated with metabolic syndrome versus normal conditions. The left column represents retinal images from normal participants, and the right column represents those from participants with metabolic syndrome. Each row corresponds to retinal images from five representative individuals from the normal and metabolic syndrome groups, respectively. For each participant, the left and right retinal images are shown alongside their corresponding explanation maps. In these maps, bluer areas indicate regions less associated with the participant’s condition (normal or metabolic syndrome), whereas redder areas indicate regions more strongly associated with the condition.
Fig. 5. Explainable visualizations of normal and metabolic syndrome.

Results were generated using the transformer-based explainability method27. Each row shows a participant’s retinal images (left and right) and their explainable visualizations according to normal (a–e) or metabolic syndrome (f–j). The redder regions correspond to the greater relevance of each participant’s condition.
We observed that while there are differences between individuals, the optic disc and vessels around the optic disc regions of the retinal images generally receive relatively larger attention in metabolic syndrome participants in the explanation maps. This suggests that changes or abnormalities in these areas could be indicative of a participant’s condition. Specifically, in the normal retinal images (a–e), most regions show blue areas in the explanation, indicating fewer regions associated with normal conditions. In contrast, the metabolic syndrome retinal images (f–j) exhibit more red areas, particularly around the optic disc or retinal vessel, suggesting these regions may play a critical role in distinguishing between normal and metabolic syndrome conditions. Additionally, individuals represented in rows (a), (b), (c), (d), (g), (h), and (i) have different explanation results for their left and right retinal images. This discrepancy highlights the importance of analyzing both left and right retinal images together for better classification performance of metabolic syndrome. Overall, these observations suggest that specific regions of retinal images may contribute to improved diagnosis of metabolic syndrome.
Discussion
In this study, we conducted experiments and analyses on the feasibility of predicting metabolic syndrome using retinal images. Our approach achieved an AUC of 0.8725 (0.0041), outperforming the model that relied solely on basic clinical features. These results highlight the potential of retinal images as a useful biomarker in this context.
Given that BMI is a significant factor for metabolic syndrome, we targeted challenging cases where BMI contradicts metabolic syndrome. Our hypothesis is that while BMI serves as a dominant factor in predicting metabolic syndrome, different subgroups may be influenced by distinct clinical risk factors, including latent retinal image features that are not captured by traditional markers. This is relevant in cases where BMI alone does not align with metabolic syndrome diagnosis, such as individuals with obesity (BMI ≥ 25 kg/m²) who are not diagnosed with metabolic syndrome and those who are non-obese (BMI < 25 kg/m²) but have metabolic syndrome. The advantage of our model becomes especially evident in these challenging cases. Additionally, we found that retinal image features associated with metabolic syndrome also correlate with diseases like hypertension, diabetes, and dyslipidemia. This study not only improved metabolic syndrome classification performance but also provided interpretable visual evidence demonstrating the advantages of using retinal images.
Our study demonstrated that retinal image representations learned by a Vision Transformer-based model contribute to the classification of metabolic syndrome, when combined with clinical features. Previous studies predicting metabolic syndrome have primarily relied on patients’ clinical information from health check-ups or genetic information, using conventional machine learning methods such as Random Forest, SVM and Decision Tree7–11 However, these approaches often involve invasive features and require additional data collection effort. In contrast, retinal images offer a non-invasive and efficient alternative. Studies leveraging retinal images and deep learning for disease classification have demonstrated high performance, highlighting the significance of retinal images as biomarkers22,25,28. Our findings confirm the potential of retinal images as non-invasive biomarkers for metabolic syndrome. This expands our understanding of how retinal images can be used to detect and monitor various systemic health conditions.
This study suggests the potential utility of secondary findings derived from non-invasive fundoscopy, a tool commonly used in large-scale population screening health check-ups. Incorporating such findings without additional costs may add value to existing screening tests. While further validation is needed, this approach could contribute to improved risk stratification and support preventive healthcare efforts, potentially benefiting patient outcomes on a broader scale. In population screening, where the prevalence of the target disease is low, even small improvements in performance metrics such as sensitivity and specificity can influence outcomes29. High sensitivity reduces the likelihood of false negatives, while high specificity helps minimize false positives, potentially reducing unnecessary follow-ups and overtreatment. Incremental performance gains, while modest, could enhance the accuracy and reliability of screening tests in large populations. Secondary findings from fundoscopy may offer additional insights that warrant further investigation to explore their potential in improving risk management and patient care outcomes.
Fundoscopy is a useful clinical tool that allows visual inspection of the central nervous system30,31, retinal vasculature32, and other aspects of the eye through a non-invasive method. It provides a wealth of information, making it clinically very useful33. For example, it can reveal signs of an increase in intracranial pressure30,31, evidence of end-organ damage arising from hypertension or diabetes34,35, and the risk of stroke36,37. It can also serve as biomarkers for diseases such as Alzheimer’s disease38, cardiovascular disease39, and heart failure40. Since metabolic syndrome is known to be a risk factor for cerebrocardiovascular disease, if metabolic syndrome can be classified through fundoscopy, it is expected to help prevent various diseases41. Despite its clinical benefits, funduscopy images are not commonly used by general physicians, clinicians42, or community hospitals43. The use of fundoscopy may be uncommon, and if not interpreted by an expert, the results may not be reliable33. Training for fundoscopy is quite challenging, as it is considered one of the more difficult medical skills44. Even experienced ophthalmologists mainly focus on things that are confined to ophthalmic diseases, so it is difficult to reach the point of applying important clinical information, such as metabolic syndrome, that is imposed on the acquired fundoscopy image in the clinic. While studies on radiomics applying artificial intelligence to fundoscopy images are actively underway, they are generally focused on ophthalmic diseases such as retinopathy45,46, glaucoma28,47, or neurological diseases related to the CNS48, papilledema49. However, it has also shown capability in predicting systemic diseases such as cardiovascular diseases, Parkinson’s disease17,20,22.
In this study, we extracted retinal features related to metabolic syndrome from the retinal images of both eyes of each participant. We compared the performance of using a participant’s two retinal images separately versus together and found that using both the left and right retinal images together resulted in better performance. We used 224 × 224 retinal images, treating each image as an independent case in the RETFound model, achieving an AUC of 0.7401 (0.0081) (Supplementary Table 2). By incorporating Logistic Regression as the final classifier on the extracted features, the performance improved to an AUC of 0.7575 (0.0093). Further improvement was achieved by concatenating the retinal image features from both eyes of each participant and applying Logistic Regression, which resulted in an AUC of 0.7752 (0.0034) (Table 2). The different impact of the left and right eyes is also evident in the visual explanation in Fig. 5. It showed that the predictive impact of retinal images varied for each participant, with metabolic syndrome-related areas differing between the two eyes even in the same participant. This suggests that features related to metabolic syndrome obtained from both eyes may differ, which can contribute to improved metabolic syndrome classification.
Additionally, we conducted further analysis using higher-resolution 512 × 512 retinal images. The results showed that using 512 × 512 images for training led to lower performance compared to using 224 × 224 images (Supplementary Table 2). We hypothesize that this result may be attributed to the pretraining process of RETFound, which utilized 224 × 224 input images.
To objectively evaluate the classification performance of Logistic Regression, we compared it with conventional machine learning models, including Decision Tree, Random Forest, XGBoost, and SVM, as well as deep learning models incorporating fully connected layers with batch normalization and dropout (Supplementary Table 4). The parameters were selected using a grid search based on the AUC. Logistic Regression was tuned by combining the parameters C, penalty, and solver. Specifically, L1 regularization was utilized to enhance feature selection, and the saga solver was employed to ensure stable optimization. SVM was tuned by exploring combinations of kernel, C, degree, and gamma. Various kernel types, as well as multiple degrees, were explored to optimize the model. XGBoost was tuned using combinations of learning rate, number of estimators, max depth, and subsample ratio. For Decision Tree, the parameters max depth and criterion were explored to determine the optimal tree structure. Random Forest was optimized by adjusting the number of estimators and the max depth. The result demonstrated that Logistic Regression showed slightly better performance compared to the other classifiers across most of the evaluation metrics. This result suggests that the robust feature extraction capabilities of RETFound, which leverages its Vision Transformer (ViT) architecture pretrained on a large-scale retinal image dataset, effectively capture the complex, non-linear patterns inherent in retinal images, enabling a simple linear model like Logistic Regression to serve as an effective final classifier. Additionally, Logistic Regression, combined with regularization, provided an effective method to handle the 2,048 image features (1024 per retinal image) along with clinical features. This approach minimized redundancy and enabled streamlined learning. Since each of the two retinal images corresponds to clinical data for the same patient, using a simpler classifier prevented unnecessary re-learning of clinical information when combining retinal and clinical features.
To evaluate the effectiveness of RETFound in metabolic syndrome classification, we compared its performance with models pretrained on retinal image datasets (Supplementary Table 3). First, we assessed VGG16, which was pretrained on 143,669 retinal images augmented from the EyePACS, APTOS, and MESSIDOR datasets (https://www.kaggle.com/code/jameelsawafta/diabetic-retinopathy-using-vgg16-custom-model/output). After fine-tuning these weights on our dataset, we obtained an AUC of 0.6669 (0.0317) for metabolic syndrome classification. Second, we used the weights from FLAIR50, a Contrastive Language-Image Pretraining (CLIP)-based model that utilizes both retinal images and text. While FLAIR employs ResNet50 as the image encoder, it also includes weights for processing text. For our study, we excluded the text encoder and used only the image encoder. FLAIR was pretrained on 284,660 retinal images from 37 open-access datasets, including EyePACS, APTOS, MESSIDOR, and IDRID. We fine-tuned FLAIR weights on our dataset and achieved an AUC of 0.6682 (0.0267). In comparison, the AUC of RETFound was 0.7401 (0.0081), outperforming both VGG16 and FLAIR. These results suggest that the enhanced performance of RETFound in metabolic syndrome classification is attributable to its pretraining on a much larger and more diverse retinal image dataset. Additionally, the findings highlight that Vision Transformer (ViT)-based models, such as RETFound, exhibit enhanced learning capabilities for metabolic syndrome compared to CNN-based models like VGG16 and ResNet50. Regarding the architectural differences between the models, while CNN-based models like ResNet50 and VGG16 are effective at capturing localized features through convolutional operations, they have limitations in learning long-range dependencies within images, which are often important for complex medical imaging tasks. In contrast, ViT models process images as sequences of patches instead of relying on localized convolution operations. By leveraging self-attention mechanisms, ViTs assess the relative importance of each patch within the image, enabling it to capture global dependencies and offering a more comprehensive understanding of retinal images51. Accordingly, RETFound has the advantage of identifying major anatomical structural changes in retinal images, including the optic nerve and large vessels20, compared to CNN-based models.
We observed that the optic disc and the surrounding vessels were predominantly highlighted in the explanatory visualization (Fig. 5). Moreover, we recognize the potential importance of identifying specific vascular characteristics, such as arteriolar narrowing or venular dilation, which have been associated with systemic conditions13,52. The association between retinal image features and vascular health is supported by prior studies that have demonstrated links between retinal status and cardiovascular disease22,23,53–55. Our findings are consistent with this evidence, particularly in showing that fundoscopy-derived features used for predicting metabolic syndrome are also associated with cardiovascular disease. These results align with earlier research highlighting the connections between retinal image features, vascular disease, and metabolic syndrome15,56–58. Therefore, as an indirect method to explore the association between retinal image features extracted from RETFound and vascular status, we analyzed the relationship between these image features and vascular-health indicators. Since our data were collected from participants undergoing comprehensive health evaluations, we included coronary vascular features in our analysis. The evaluation of coronary atherosclerosis was conducted through coronary CT angiography, which allowed for the identification of plaques or stenosis in the coronary arteries59. This process enabled the acquisition of data on coronary vascular changes. Also, we found that metabolic syndrome is related to erythrocyte parameters57,60, and erythrocyte parameters are related to vascular caliber61. Therefore, we analyzed the correlation between retinal image features and coronary vascular changes, as well as erythrocyte parameters such as hematocrit, hemoglobin, and red blood cell count.
To explore the potential link between retinal image features and vascular health, we first utilized RETFound to concatenate 1024 retinal image features obtained from the left and right retinal images, resulting in a total of 2048 features. These features were then reduced to a single dimension through PCA, and their correlations with vascular-health-related variables, such as coronary vascular changes, hematocrit, hemoglobin, and red blood cell coun,t were analyzed using the Pearson correlation analysis (Supplementary Table 5). The analysis showed a coefficient of −0.2627 ( = 0.0023) for coronary artery vascular changes. The coefficient of −0.4960 ( = 3.94 × 10⁻²³) for hematocrit, −0.5616 ( = 1.75 × 10⁻³⁰) for hemoglobin, and −0.4759 ( = 3.48 × 10⁻²¹) for red blood cell count, confirming a marginal but generally negative correlation between vascular-health-related features and retinal image features. These findings suggest that features derived from retinal images provide weak but statistical evidence of their relevance to vascular health. Consequently, this study highlights the potential relevance of considering vascular health in patients identified through retinal image analysis as being at risk for metabolic syndrome. Encouraging lifestyle modifications that support vascular health may offer additional benefits in such cases. Additionally, further exploration into the incorporation of vascular status assessments in screening protocols, taking into account patient age and underlying conditions, could provide insights into improving preventive strategies and patient outcomes.
In addition, we found that metabolic syndrome is related to creatinine62,63, and uric acid63–65. Therefore, we analyzed the correlation between retinal image features and creatinine and uric acid using the same method as in the vascular-health correlation check. They showed coefficients of −0.4804 ( = 1.32 × 10⁻²¹) and −0.4921 ( = 9.47 × 10⁻²³), respectively (Supplementary Table 6), elucidating the association between retinal image features and creatinine as well as uric acid.
While metabolic syndrome-related retinal image features improved classification performance, some participants could be adequately classified using only clinical features. In such cases, retinal features occasionally introduced noise, which may have impacted the model’s performance. Although the RETFound model performed well without extensive image preprocessing, the use of advanced processing techniques could potentially enhance performance, particularly for participants whose retinal features are crucial for accurately diagnosing metabolic syndrome.
Additionally, we acknowledge the limitation of using a non-mydriatic approach, as the pupil size may impact image quality and field of view, potentially restricting the full generalizability of our results. However, this non-mydriatic method enhances accessibility in non-specialist settings, such as primary care clinics or health check-up centers, supporting broader applicability outside of ophthalmic clinics.
We provided a visual explanation showing that specific regions in retinal images can be relevant to the diagnosis of metabolic syndrome. However, explanation methods originally designed for natural images may have limitations in understanding the features of medical images, including retinal images. Therefore, advanced explanation methods specifically designed for medical images need further study. As the regions related to metabolic syndrome showed different impacts between individuals, personalized explanation methods should also be explored for future medical applications.
Another limitation of our study is that it utilized a Korean cohort, which may limit the generalizability of our findings. Accordingly, additional performance comparisons of various classifier models are required through the optimization of classifier models, and the final selection of the classifier model must be made carefully. Future research should include diverse cohorts, encompassing different races and ethnicities, to validate the applicability of our approach across various populations. In this respect, there is a need for more extensive retinal image datasets to conduct active research on retinal image analysis. Access to a larger and more diverse dataset would allow for more robust and comprehensive studies, enhancing the reliability and utility of retinal images in diagnosing metabolic syndrome and related diseases. This study relied on a minimal set of health check-up information, which is expected to facilitate future dataset expansion.
Our study demonstrates marginal incremental improvements in performance metrics. Retrospective metrics alone do not fully capture the challenges of integrating these findings into clinical workflows. Therefore, future studies should include prospective clinical trials and real-world validations to assess their practical applicability. Additionally, cost-effectiveness studies or decision curve analyses should be conducted as the next steps to better illustrate how these performance differences might impact patient outcomes and healthcare budgets.
Overall, our study highlights the potential of using a Vision Transformer-based model to enhance the diagnosis of metabolic syndrome and related diseases by integrating retinal images with clinical features. By providing interpretable visual evidence and effectively addressing challenging cases, our approach contributes to more accurate and comprehensive diagnostic tools in the medical field. Future research should focus on refining image processing techniques and exploring more sophisticated models to fully utilize the potential of retinal image features in medical diagnosis.
Methods
Ethics statement
The Institutional Review Board of Seoul National University Hospital approved the study protocol (H-2209-005-1354), and the study was conducted in accordance with the Helsinki Declaration. Informed consent was waived by the board.
Dataset
The data used in this study were obtained from Korean participants of a comprehensive health check-up at Seoul National University Hospital Gangnam Center between 2014 and 2016. The details of the health check-up system are described elsewhere66. Briefly, individuals have comprehensive health screening tests such as anthropometric tests, laboratory tests, imaging tests, and fundus photography using 45° digital non-mydriatic fundus camera (TRC-NW8, Topcon Inc.)67. Images were captured in a darkened room to facilitate natural dark adaptation and adequate pupil dilation without the use of pharmacological agents. The right eye was imaged first, followed by a brief pause to allow the left pupil to regain optimal size before capturing the image.
The data preprocessing strategy was designed with several considerations. First, the approach of generating synthetic data through augmentation prior to the training process was excluded due to concerns about the potential reuse of patient information. Such practices could compromise the interpretability and reliability of the results from a clinical perspective. To address data imbalance, we employed random undersampling, selecting participants from the majority class to match the size of the smaller classes. This approach ensured the authenticity of the dataset while maintaining clinical validity. Additionally, participants with low retinal image quality were excluded. The RETFound model, pretrained on a large-scale retinal image dataset, effectively captures the general visual features of retinal images. This pretraining enables the model to deliver robust performance even with a relatively small but balanced dataset.
As a result, among 8225 participants with retinal images, 3000 participants were selected. Of these, 1514 were normal, and 1486 had metabolic syndrome. The participants used in the study have both left and right retinal images, so the total number of retinal images used for learning is 6000. The labeling of whether a participant has metabolic syndrome in the dataset is determined as positive for metabolic syndrome if there are three or more clinical features that exceed the standards specified for Waist Circumference (WC), Triglycerides (TG), HDL cholesterol (HDL), Hypertension (HTN), and Glucose. Waist circumference should be equal to or greater than 90 cm for males, or equal to or greater than 85 cm for females. Triglyceride (TG) levels should be equal to or greater than 150 mg/dl. For males, HDL cholesterol levels should be less than 40 mg/dl, and for females, less than 50 mg/dl. Fasting plasma glucose levels should be equal to or greater than 100 mg/dl, or indicative of diabetes. Blood pressure should be equal to or greater than 130/85 mmHg (or being treated for hypertension). In addition to metabolic syndrome, our data includes participants with diseases such as cataract, drusen, fatty liver, breast cancer, colorectal cancer, gastric cancer, liver cancer, lung cancer, prostate cancer, renal cancer, and thyroid cancer.
Image preprocessing
The original image we used is distributed in various sizes, with the smallest size being 1382 × 1382 and the largest size being 2150 × 2150. The original images were resized to 350 × 350 and then center-cropped to 224 × 224, with the intent to concentrate on the interior details of the retinal image. Furthermore, to investigate the performance differences arising from variations in retinal image resolution, we also examined the results of training the model using retinal images that were resized to 775 × 775 and then center-cropped to 512 × 512 from the original images. Also, we converted the original image from NPY format to PNG. We applied auto augmentation (rand-m9-mstd0.5-inc1) of the timm library (version 0.3.2, Hugging Face, USA) during the training process to enhance image variability. Additionally, random image regions were erased with a 25% probability and filled with black during the learning process.
Model development
In this study, the RETFound model, a ViT-based deep learning framework, was employed for metabolic syndrome prediction from retinal images. This model leverages a self-supervised learning approach using Masked AutoEncoder (MAE)68, which is trained without human-crafted labels. It learns patterns or structural features of the image by masking patches of the input image and encouraging the model to reconstruct the original image. The image features obtained through this self-supervised learning significantly improve the model’s classification performance. The RETFound was initially trained on the ImageNet-1K dataset and further trained on 904,170 retinal images sourced from MEH-MIDAS and Kaggle EyePACS20. This retinal-specific pretraining allows RETFound to outperform standard ImageNet-pretrained models by better capturing anatomical features of the fundus. RETFound demonstrated high performance in classifying ophthalmic conditions such as glaucoma and wet age-related macular degeneration (AMD). Furthermore, it proved its enhanced performance compared to other models trained using the same method through external validation, which involved fine-tuning the model on one of three retinal image datasets related to diabetic retinopathy severity (APTOS-2019, IDRID, MESSIDOR) and evaluating it on the other datasets. Given RETFound’s outstanding performance on large-scale datasets and its ability to effectively handle various diseases, we selected it as the training model for metabolic syndrome classification.
We conducted a comparative analysis of RETFound’s performance against other CNN-based models pretrained on ImageNet-1k, with both RETFound and the CNN-based models being fine-tuned on our dataset (Supplementary Table 2). This demonstrates the performance and significance of models trained using large-scale retinal images. Then the features extracted by each image model from retinal images of both eyes were combined with clinical features and used to classify metabolic syndrome using Logistic Regression. Other conventional machine learning models were also evaluated for comparison, as shown in Supplementary Table 4. Fine-tuning of RETFound involved 50 epochs of training on our specific dataset. The learning rate began at 8e-5 and was increased through warmup for the first 10 epochs before being decreased according to a scheduler that periodically decreases the learning rate using the cosine function. The batch size was 16, the model training was based on cross-entropy loss, and the AdamW optimizer. Computations were performed using an NVIDIA RTX A6000 GPU. The Logistic Regression classifier used for the final classification employed an L1 regularization, with an inverse regularization strength (C) of 0.03, and the solver used was saga.
Model evaluation
We applied 5-fold cross-validation to estimate the generalization performance of our model for classifying participants with and without metabolic syndrome. The model’s performance was evaluated using precision, sensitivity, specificity, F1 score, accuracy, and AUC. Additionally, we obtained 95% confidence intervals through cross-validation and conducted a t-test to determine the statistical significance of our results. These p-values validated the effectiveness of using retinal images by comparing the performance of models using basic clinical features alone versus models combining them with retinal images. This process also demonstrated the model’s capability in classifying diseases related to metabolic syndrome, such as hypertension, diabetes, and dyslipidemia.
Model interpretation
We interpreted the metabolic syndrome prediction results of our proposed model using SHAP and a transformer-based explainability method. SHAP quantifies the importance of individual features in a predictive model using Shapley values from cooperative game theory. It calculates the average marginal contribution of each feature across all possible combinations of features, providing a fair allocation of each feature’s contribution to the prediction. This method offers insights into how each feature influences the model’s predictions independently26. In Fig. 3, the SHAP values of age and gender are combined, and in the case of retinal features, the SHAP values from all features extracted from the left and right retinal images are aggregated. This approach allowed us to discern the significance of each feature in our interpretable analysis.
The role of the transformer-based explainability method parallels that of GradCAM69 in the context of interpreting CNN-based models. While GradCAM provides visual explanations by highlighting important regions in the input for CNNs, the transformer-based explainability method is specifically designed for Vision Transformer(ViT) models. This method, derived from the attention rollout method70, offers more advanced interpretability. The attention rollout method uses the average of the attention heads to get a visualization of the results, but has the drawback of oversimplifying different attention head values and ignoring other parts of the network, such as activations and linear styles. The transformer-based explainability method addresses these shortcomings by using Layer-wise Relevance Propagation (LRP)71.
This method offers more nuanced interpretability for ViT architectures, such as RETFound, which demonstrate improved performance compared to traditional CNN-based models (Supplementary Tables 2 and 3). Consequently, the transformer-based explainability method is well-suited to elucidate the results of RETFound, leveraging the inherent strengths of transformer models to deliver clearer and more insightful interpretations of their high performance.
Supplementary information
Acknowledgements
This research was partly supported by the Institute for Information & Communications Technology Planning & Evaluation(IITP) under the Artificial Intelligence Convergence Innovation Human Resources Development(IITP-2025-RS-2023-00255968) grant and also by the National Research Foundation of Korea (NRF) grant (NRF-2022R1A2C1007434, NRF-2022R1C1C1012060), funded by the Korea government (MSIT).
Author contributions
TK.L, SY.K, EK.C and KA.S designed the study. HJ.C and EK.C prepared the datasets used in this study. EK.C and TK.L conducted the data preprocessing. TK.L implemented the idea and performed the experiments. All authors developed the idea and reviewed the results. TK.L, SY.K, EK.C and KA.S drafted the initial manuscript. All authors revised and approved the final manuscript.
Data availability
The original raw data are not publicly available due to restrictions (institutional policy to protect the privacy of research participants) but are available from the corresponding author upon reasonable request. All other data from the analysis are included in the article and its supplementary information or are available upon reasonable request.
Code availability
We used Python (version 3.7.12, Python Software Foundation, Wilmington, DE, USA) and PyTorch (version 1.8.1+cu111, Meta AI, Menlo Park, CA, USA) to train the deep learning models. We fine-tuned our dataset using weights pretrained with RETFound at https://github.com/rmaphoh/RETFound_MAE. The code for the overall pipeline is available for use with the permission of the corresponding author and institution upon reasonable request.
Competing interests
The authors declare no competing interests.
Footnotes
Publisher’s note Springer Nature remains neutral with regard to jurisdictional claims in published maps and institutional affiliations.
These authors contributed equally: Tae Kwan Lee, So Yeon Kim.
Contributor Information
Eun Kyung Choe, Email: choe523@gmail.com.
Kyung-Ah Sohn, Email: kasohn@ajou.ac.kr.
Supplementary information
The online version contains supplementary material available at 10.1038/s41746-025-01588-0.
References
- 1.Teramoto, T. et al. Metabolic syndrome. J. Atheroscler. Thromb.15, 1–5 (2008). [DOI] [PubMed] [Google Scholar]
- 2.Alberti, K. G. M. M., Zimmet, P. & Shaw, J. Metabolic syndrome—a new world-wide definition. A consensus statement from the international diabetes federation. Diabet. Med.23, 469–480 (2006). [DOI] [PubMed] [Google Scholar]
- 3.Choi, J. E. et al. Increase of prevalence of obesity and metabolic syndrome in children and adolescents in Korea during the COVID-19 pandemic: A cross-sectional study using the KNHANES. Children10, 1105 (2023). [DOI] [PMC free article] [PubMed] [Google Scholar]
- 4.Rochlani, Y., Pothineni, N. V., Kovelamudi, S. & Mehta, J. L. Metabolic syndrome: pathophysiology, management, and modulation by natural compounds. Ther. Adv. Cardiovasc. Dis.11, 215–225 (2017). [DOI] [PMC free article] [PubMed] [Google Scholar]
- 5.Kassi, E., Pervanidou, P., Kaltsas, G. & Chrousos, G. Metabolic syndrome: definitions and controversies. BMC Med.9, 48 (2011). [DOI] [PMC free article] [PubMed] [Google Scholar]
- 6.Grundy, S. M. Metabolic syndrome pandemic. Arterioscler. Thromb. Vasc. Biol.28, 629–636 (2008). [DOI] [PubMed] [Google Scholar]
- 7.Shin, H., Shim, S. & Oh, S. Machine learning-based predictive model for prevention of metabolic syndrome. PLoS One18, e0286635 (2023). [DOI] [PMC free article] [PubMed] [Google Scholar]
- 8.Choe, E. K. et al. Metabolic syndrome prediction using machine learning models with genetic and clinical information from a nonobese healthy population. Genomics Inform.10.5808/GI.2018.16.4.e31 (2018). [DOI] [PMC free article] [PubMed]
- 9.Mohseni-Takalloo, S., Mozaffari-Khosravi, H., Mohseni, H., Mirzaei, M. & Hosseinzadeh, M. Metabolic syndrome prediction using non-invasive and dietary parameters based on a support vector machine. Nutr. Metab. Cardiovasc. Dis.34, 126–135 (2024). [DOI] [PubMed] [Google Scholar]
- 10.Worachartcheewan, A. et al. Predicting metabolic syndrome using the random forest method. Sci. World J.10.1155/2015/581501 (2015). [DOI] [PMC free article] [PubMed]
- 11.Hu, X. et al. Predictive modeling the probability of suffering from metabolic syndrome using machine learning: a population-based study. Heliyon10.1016/j.heliyon.2022.e12343 (2022). [DOI] [PMC free article] [PubMed] [Retracted]
- 12.Shin, D. W., Cho, J., Park, J. H. & Cho, B. National General Health Screening Program in Korea: history, current status, and future direction. Precis. Future Med.6, 9–31 (2022). [Google Scholar]
- 13.Wong, T. Y. et al. Retinal microvascular abnormalities and their relationship with hypertension, cardiovascular disease, and mortality. Surv. Ophthalmol.46, 59–80 (2001). [DOI] [PubMed] [Google Scholar]
- 14.Klein, R. et al. Are retinal arteriolar abnormalities related to atherosclerosis? The Atherosclerosis Risk in Communities Study. Arterioscler. Thromb. Vasc. Biol.20, 1644–1650 (2000). [DOI] [PubMed] [Google Scholar]
- 15.Wong, T. Y. et al. Associations between the metabolic syndrome and retinal microvascular signs: the Atherosclerosis Risk In Communities study. Invest. Ophthalmol. Vis. Sci.45, 2949–2954 (2004). [DOI] [PubMed] [Google Scholar]
- 16.Golden, S. H. et al. Risk factor groupings related to insulin resistance and their synergistic effects on subclinical atherosclerosis: the atherosclerosis risk in communities study. Diabetes51, 3069–3076 (2002). [DOI] [PubMed] [Google Scholar]
- 17.Al-Absi, H. R., Islam, M. T., Refaee, M. A., Chowdhury, M. E. & Alam, T. Cardiovascular disease diagnosis from DXA scan and retinal images using deep learning. Sensors22, 4310 (2022). [DOI] [PMC free article] [PubMed] [Google Scholar]
- 18.Dutta, S., Manideep, B., Basha, S. M., Caytiles, R. D. & Iyengar, N. Classification of diabetic retinopathy images by using deep learning models. Int. J. Grid Distrib. Comput.11, 89–106 (2018). [Google Scholar]
- 19.Butt, M. M., Iskandar, D. A., Abdelhamid, S. E., Latif, G. & Alghazo, R. Diabetic retinopathy detection from fundus images of the eye using hybrid deep learning features. Diagnostics12, 1607 (2022). [DOI] [PMC free article] [PubMed] [Google Scholar]
- 20.Zhou, Y. et al. A foundation model for generalizable disease detection from retinal images. Nature622, 156–163 (2023). [DOI] [PMC free article] [PubMed] [Google Scholar]
- 21.Abbood, S. H. et al. Hybrid retinal image enhancement algorithm for diabetic retinopathy diagnostic using deep learning model. IEEE Access10, 73079–73086 (2022). [Google Scholar]
- 22.Lee, Y. C. et al. Multimodal deep learning of fundus abnormalities and traditional risk factors for cardiovascular risk prediction. npj Dig. Med.6, 14 (2023). [DOI] [PMC free article] [PubMed] [Google Scholar]
- 23.Poplin, R. et al. Prediction of cardiovascular risk factors from retinal fundus photographs via deep learning. Nat. Biomed. Eng.2, 158–164 (2018). [DOI] [PubMed] [Google Scholar]
- 24.Zhang, L. et al. Prediction of hypertension, hyperglycemia and dyslipidemia from retinal fundus photographs via deep learning: A cross-sectional study of chronic diseases in central China. PLoS ONE15, e0233166 (2020). [DOI] [PMC free article] [PubMed] [Google Scholar]
- 25.Mohanty, C. et al. Using deep learning architectures for detection and classification of diabetic retinopathy. Sensors23, 5726 (2023). [DOI] [PMC free article] [PubMed] [Google Scholar]
- 26.Lundberg, S. M. & Lee, S.-I. A unified approach to interpreting model predictions. Adv. Neural Inf. Process. Syst.10.48550/arXiv.1705.07874 (2017).
- 27.Chefer, H., Gur, S. & Wolf, L. Transformer interpretability beyond attention visualization. In Proceedings of the IEEE/CVF Conference on Computer Vision and Pattern Recognition, 782–791 (IEEE Computer Society, 2021).
- 28.Juneja, M. et al. Deep learning-based classification network for glaucoma in retinal images. Comput. Electr. Eng.101, 108009 (2022). [Google Scholar]
- 29.Trevethan, R. Sensitivity, specificity, and predictive values: foundations, pliabilities, and pitfalls in research and practice. Front. public health5, 307 (2017). [DOI] [PMC free article] [PubMed] [Google Scholar]
- 30.Sinclair, A. J. et al. Rating papilloedema: an evaluation of the Frisén classification in idiopathic intracranial hypertension. J. Neurol.259, 1406–1412 (2012). [DOI] [PubMed] [Google Scholar]
- 31.Jacks, A. S. & Miller, N. Spontaneous retinal venous pulsation: aetiology and significance. J. Neurol. Neurosurg. Psychiatry74, 7–9 (2003). [DOI] [PMC free article] [PubMed] [Google Scholar]
- 32.Jebaseeli, T. J., Durai, C. A. D. & Peter, J. D. Extraction of retinal blood vessels on fundus images by Kirsch’s template and fuzzy C-means. J. Med. Phys.44, 21–26 (2019). [DOI] [PMC free article] [PubMed] [Google Scholar]
- 33.Dunn, H. P. et al. Perceived usefulness and ease of use of fundoscopy by medical students: a randomised crossover trial of six technologies (eFOCUS 1). BMC Med. Educ.21, 1–9 (2021). [DOI] [PMC free article] [PubMed] [Google Scholar]
- 34.Klein, R. et al. The association of atherosclerosis, vascular risk factors, and retinopathy in adults with diabetes: the atherosclerosis risk in communities study. Ophthalmology109, 1225–1234 (2002). [DOI] [PubMed] [Google Scholar]
- 35.Fraser-Bell, S., Symes, R. & Vaze, A. Hypertensive eye disease: a review. Clin. Exp. Ophthalmol.45, 45–53 (2017). [DOI] [PubMed] [Google Scholar]
- 36.Wong, T. Y. et al. Cerebral white matter lesions, retinopathy, and incident clinical stroke. Jama288, 67–74 (2002). [DOI] [PubMed] [Google Scholar]
- 37.Yatsuya, H. et al. Retinal microvascular abnormalities and risk of lacunar stroke: Atherosclerosis Risk in Communities Study. Stroke41, 1349–1355 (2010). [DOI] [PMC free article] [PubMed] [Google Scholar]
- 38.García-Bermúdez, M. Y. et al. Potential retinal biomarkers in Alzheimer’s disease. Int. J. Mol. Sci.24, 15834 (2023). [DOI] [PMC free article] [PubMed] [Google Scholar]
- 39.Guo, S. et al. Association between caliber of retinal vessels and cardiovascular disease: a systematic review and meta-analysis. Curr. Atheroscler. Rep.22, 1–13 (2020). [DOI] [PubMed] [Google Scholar]
- 40.Chaikijurajai, T., Ehlers, J. P. & Tang, W. W. Retinal microvasculature: a potential window into heart failure prevention. JACC Heart Fail.10, 785–791 (2022). [DOI] [PubMed] [Google Scholar]
- 41.Hayden, M. R. Overview and new insights into the metabolic syndrome: risk factors and emerging variables in the development of type 2 diabetes and cerebrocardiovascular disease. Medicina59, 561 (2023). [DOI] [PMC free article] [PubMed] [Google Scholar]
- 42.Roberts, E., Morgan, R., King, D. & Clerkin, L. Funduscopy: a forgotten art?. Postgrad. Med. J.75, 282–284 (1999). [DOI] [PMC free article] [PubMed] [Google Scholar]
- 43.Bruce, B. B. et al. Feasibility of nonmydriatic ocular fundus photography in the emergency department: phase I of the FOTO-ED study. Acad. Emerg. Med.18, 928–933 (2011). [DOI] [PMC free article] [PubMed] [Google Scholar]
- 44.Talley, N. O’Connor’s clinical examination. (Elsevier Australia, Chatswood, 2018).
- 45.Lim, J. I. et al. Artificial intelligence detection of diabetic retinopathy: subgroup comparison of the EyeArt system with ophthalmologists’ dilated examinations. Ophthalmol. Sci.3, 100228 (2023). [DOI] [PMC free article] [PubMed] [Google Scholar]
- 46.Tokuda, Y. et al. Automatic diagnosis of diabetic retinopathy stage focusing exclusively on retinal hemorrhage. Medicina58, 1681 (2022). [DOI] [PMC free article] [PubMed] [Google Scholar]
- 47.Haja, S. A. & Mahadevappa, V. Advancing glaucoma detection with convolutional neural networks: a paradigm shift in ophthalmology. Rom. J. Ophthalmol.67, 222 (2023). [DOI] [PMC free article] [PubMed] [Google Scholar]
- 48.Suh, A. et al. Retina oculomics in neurodegenerative disease. Ann. Biomed. Eng.51, 2708–2721 (2023). [DOI] [PubMed] [Google Scholar]
- 49.Anandi, L., Budihardja, B. M., Anggraini, E., Badjrai, R. A. & Nusanti, S. The use of artificial intelligence in detecting papilledema from fundus photographs. Taiwan J. Ophthalmol.13, 184–190 (2023). [DOI] [PMC free article] [PubMed] [Google Scholar]
- 50.Silva-Rodriguez, J., Chakor, H., Kobbi, R., Dolz, J. & Ayed, I. B. A foundation language-image model of the retina (flair): encoding expert knowledge in text supervision. Med. Image Anal.99, 103357 (2025). [DOI] [PubMed] [Google Scholar]
- 51.Rūta J. et al. Exploring the effectiveness of vision transformers in diabetic retinopathy identification via retinal imaging. In IEEE Open Conference of Electrical, Electronic and Information Sciences 1–4 10.1109/eStream61684.2024.10542586 (2024).
- 52.Lima-Fontes, M., Barata, P., Falcão, M. & Carneiro, Å. Ocular findings in metabolic syndrome: a review. Porto Biomed. J.5, 104 (2020). [DOI] [PMC free article] [PubMed] [Google Scholar]
- 53.Chikumba, S., Hu, Y. & Luo, J. Deep learning-based fundus image analysis for cardiovascular disease: a review. Ther. Adv. Chronic Dis.14, 20406223231209895 (2023). [DOI] [PMC free article] [PubMed] [Google Scholar]
- 54.Gupta, K. & Reddy, S. Heart, eye, and artificial intelligence: a review. Cardiol. Res.12, 132 (2021). [DOI] [PMC free article] [PubMed] [Google Scholar]
- 55.Cho, B. -J. et al. Prediction of white matter hyperintensity in brain MRI using fundus photographs via deep learning. J. Clin. Med.11, 3309 (2022). [DOI] [PMC free article] [PubMed] [Google Scholar]
- 56.Chopra, R., Chander, A. & Jacob, J. J. Ocular associations of metabolic syndrome. Indian J. Endocrinol. Metab.16, S6–S11 (2012). [DOI] [PMC free article] [PubMed] [Google Scholar]
- 57.Ghenciu, L. A. et al. Retinal imaging-based oculomics: artificial intelligence as a tool in the diagnosis of cardiovascular and metabolic diseases. Biomedicines12, 2150 (2024). [DOI] [PMC free article] [PubMed] [Google Scholar]
- 58.Nguyen, T. T. & Wong, T. Y. Retinal vascular manifestations of metabolic disorders. Trends Endocrinol. Metab.17, 262–268 (2006). [DOI] [PubMed] [Google Scholar]
- 59.Mu, D. et al. Calcium scoring at coronary CT angiography using deep learning. Radiology302, 309–316 (2022). [DOI] [PubMed] [Google Scholar]
- 60.Wu, S. et al. Association between erythrocyte parameters and metabolic syndrome in urban Han Chinese: a longitudinal cohort study. BMC Public Health13, 1–8 (2013). [DOI] [PMC free article] [PubMed] [Google Scholar]
- 61.Liew, G., Wang, J. J., Rochtchina, E., Wong, T. Y. & Mitchell, P. Complete blood count and retinal vessel calibers. PLoS ONE9, e102230 (2014). [DOI] [PMC free article] [PubMed] [Google Scholar]
- 62.Wang, J. et al. Serum creatinine levels and risk of metabolic syndrome in a middle-aged and older Chinese population. Clin. Chim. acta440, 177–182 (2015). [DOI] [PubMed] [Google Scholar]
- 63.Cao, T. et al. Serum uric acid to creatinine ratio and metabolic syndrome in middle-aged and elderly population: based on the 2015 CHARLS. Nutr. Metab. Cardiovasc. Dis.33, 1339–1348 (2023). [DOI] [PubMed] [Google Scholar]
- 64.Raya-Cano, E. et al. Association between metabolic syndrome and uric acid: a systematic review and meta-analysis. Sci. Rep.12, 18412 (2022). [DOI] [PMC free article] [PubMed] [Google Scholar]
- 65.Lin et al. The Association between uric acid and metabolic syndrome in a middle-aged and elderly Taiwanese Population: a community-based cross-sectional study. Healthcare10.3390/healthcare12010113 (2024) [DOI] [PMC free article] [PubMed]
- 66.Lee, C. et al. Health and Prevention Enhancement (H-PEACE): a retrospective, population-based cohort study conducted at the Seoul National University Hospital Gangnam Center, Korea. BMJ Open8, e019327 (2018). [DOI] [PMC free article] [PubMed] [Google Scholar]
- 67.Kim, Y. W., Yun, Y. I. & Choi, H. J. Screening fundus photography predicts and reveals risk factors for glaucoma conversion in eyes with large optic disc cupping. Sci. Rep.13, 81 (2023). [DOI] [PMC free article] [PubMed] [Google Scholar]
- 68.He, K. et al. Masked Autoencoders Are Scalable Vision Learners. In Proceedings of the IEEE/CVF Conference on Computer Vision and Pattern Recognition, 16000–16009 (IEEE Computer Society, 2022).
- 69.Selvaraju, R. R. et al. Grad-cam: Visual explanations from deep networks via gradient-based localization. In Proceedings of the IEEE International Conference on Computer Vision, 618–626 (IEEE Computer Society, 2017).
- 70.Abnar, S. & Zuidema, W. Quantifying Attention Flow in Transformers. In Proceedings of the 58th Annual Meeting of the Association for Computational Linguistics, 4190–4197 (Association for Computational Linguistics, 2020).
- 71.Binder, A., Montavon, G., Lapuschkin, S., Müller, K.-R. & Samek, W. Layer-wise Relevance Propagation for Neural Networks with Local Renormalization Layers. Artificial Neural Networks and Machine Learning–ICANN 2016, Lecture Notes in Computer Science, vol 9887, 63–71 (2016).
- 72.Dosovitskiy, A. et al. An Image is Worth 16x16 Words: Transformers for Image Recognition at Scale. In International Conference on Learning Representations (ICLR), OpenReview.net (2021).
Associated Data
This section collects any data citations, data availability statements, or supplementary materials included in this article.
Supplementary Materials
Data Availability Statement
The original raw data are not publicly available due to restrictions (institutional policy to protect the privacy of research participants) but are available from the corresponding author upon reasonable request. All other data from the analysis are included in the article and its supplementary information or are available upon reasonable request.
We used Python (version 3.7.12, Python Software Foundation, Wilmington, DE, USA) and PyTorch (version 1.8.1+cu111, Meta AI, Menlo Park, CA, USA) to train the deep learning models. We fine-tuned our dataset using weights pretrained with RETFound at https://github.com/rmaphoh/RETFound_MAE. The code for the overall pipeline is available for use with the permission of the corresponding author and institution upon reasonable request.