

Abstract
INTRODUCTION
Leveraging routinely collected electronic health records (EHRs) from multiple health‐care institutions, this approach aims to assess the feasibility of using federated learning (FL) to predict the progression from mild cognitive impairment (MCI) to Alzheimer's disease (AD).
METHODS
We analyzed EHR data from the OneFlorida+ consortium, simulating six sites, and used a long short‐term memory (LSTM) model with a federated averaging (FedAvg) algorithm. A personalized FL approach was used to address between‐site heterogeneity. Model performance was assessed using the area under the receiver operating characteristic curve (AUC) and feature importance techniques.
RESULTS
Of 44,899 MCI patients, 6391 progressed to AD. FL models achieved a 6% improvement in AUC compared to local models. Key predictive features included body mass index, vitamin B12, blood pressure, and others.
DISCUSSION
FL showed promise in predicting AD progression by integrating heterogeneous data across multiple institutions while preserving privacy. Despite limitations, it offers potential for future clinical applications.
Highlights
We applied long short‐term memory and federated learning (FL) to predict mild cognitive impairment to Alzheimer's disease progression using electronic health record data from multiple institutions.
FL improved prediction performance, with a 6% increase in area under the receiver operating characteristic curve compared to local models.
We identified key predictive features, such as body mass index, vitamin B12, and blood pressure.
FL shows effectiveness in handling data heterogeneity across multiple sites while ensuring data privacy.
Personalized and pooled FL models generally performed better than global and local models.
Keywords: Alzheimer's disease, federated learning, long short‐term memory, mild cognitive impairment
1. BACKGROUND
Alzheimer's disease (AD) is a significant public health concern as a progressive neurodegenerative disorder affecting millions worldwide, leading to a gradual decline in cognitive functions, including memory and problem‐solving abilities. 1 , 2 Mild cognitive impairment (MCI) serves as a transitional state between normal cognitive function and dementia, characterized by diverse cognitive profiles and clinical progression patterns, making it challenging to predict outcomes and progression in MCI patients. 3 , 4 An estimated 10% to 15% of individuals with MCI develop dementia annually, with approximately one third of those with MCI due to AD progressing to dementia within 5 years. 5 , 6 Identifying high‐risk MCI patients is key for early prevention, trial stratification, and personalized management. 7
Various data modalities have been explored to predict the progression from MCI to AD, including biomarkers, 8 neuroimaging, 9 , 10 neuropsychological tests, clinical measures, 11 genetic data, 12 digital health data, demographic and lifestyle variables, as well as their combinations. 7 , 11 , 13 However, these data sources are often difficult to obtain and not routinely collected, which may lead to delayed disease awareness and diagnosis.
In contrast, routinely collected clinical data from electronic health records (EHRs) reflect real‐world evidence and contain a wealth of information that can be leveraged to predict AD. EHRs include longitudinal patient data that help track cognitive decline. Over the past decades, several studies have been conducted to predict AD using EHRs. Li et al. 14 used machine learning (ML) with EHRs to identify factors predicting early AD onset. Park et al. 15 explored using ML and large‐scale health data to predict AD. Moreover, researchers have also focused on predicting the transition from MCI to AD. Fouladvand et al. 16 used ML algorithms incorporating structured EHRs and unstructured notes to forecast the conversion from MCI to AD. Pang et al. 17 used National Alzheimer's Coordinating Center (NACC) 18 data to predict progression from normal cognition to MCI and AD. Despite promising results, these models are often tested on region‐specific datasets. This limitation can hinder the generalizability of the results, as the models might not perform consistently when applied to data from diverse demographic or geographic backgrounds. Thus, the findings may not be generally applicable across varied health‐care settings.
Although EHRs are relatively easy to collect, coordinating EHRs across diverse health‐care institutions presents major challenges, compounded by the need to protect health information and concerns over patient privacy and data security. These challenge hinder traditional centralized data analysis methods. Federated learning (FL) offers a solution, allowing private, secure model training across sites without sharing raw data. 19 , 20 , 21 FL has been successfully applied to various tasks, including patient similar learning, 22 , 23 phenotyping, 24 , 25 mortality prediction, 26 , 27 hospitalization prediction, 19 disease prediction, 28 , 29 and across different disease domains such as COVID‐19, 27 , 30 cardiovascular disease, 31 , 32 cancer, 33 , 34 kidney diseases, 35 , 36 diabetes, 37 and AD, 38 , 39 , 40 , 41 , 42 , 43 , 44 , 45 , 46 among others. These studies confirm FL's effectiveness in enhancing prediction and detection. However, there is limited research on FL's use in predicting MCI to AD progression with EHRs from various institutions.
In this paper, we used EHRs from OneFlorida+ and partitioned the data by location to collaboratively train a model for predicting the progression from MCI to AD. We used a long short‐term memory (LSTM) model 47 to capture the temporal dependencies in the data. To account for heterogeneity in data distributions among different sites, we adopted a personalized FL approach. This involved fine‐tuning a global model with local data to capture site‐specific traits. To validate whether the model exploits the heterogeneity of data distribution across sites, we assessed the importance of different features using Shapley additive explanation (SHAP) values. 48 Additionally, we also explored the permutation feature importance (PFI) 49 by comparing the effect of each feature on the model's area under the receiver operating characteristic curve (AUC). By combining LSTM and FL, our approach aims to provide a robust and privacy‐preserving method for predicting the progression of MCI to AD across diverse health‐care settings.
2. METHODS
2.1. Data collection and processing
2.1.1. Data source and study population
Our study used a large repository of EHRs from the OneFlorida+ Clinical Research Consortium. 50 This consortium is a member of the National Patient‐Centered Clinical Research Network (PCORnet) and represents a collaborative effort among 14 health organizations. These organizations span academic health centers, community health systems, and clinics, collectively covering ≈ 20 million patients across Florida (≈ 18 million), Georgia (≈ 1 million), and Alabama (≈ 2.1 million). The OneFlorida+ dataset adheres to the PCORnet Common Data Model (CDM), encompassing comprehensive patient information, such as demographics, enrollment status, vital signs, conditions, encounters, diagnoses, procedures, prescriptions, dispensing, and laboratory results.
To simulate a FL environment and account for heterogeneity between hospitals due to geographic differences, we partitioned the dataset into six sites based on state and geographic areas, as shown in Figure 1: in Florida, the data were further segmented into four regions: North Florida (e.g., University of Florida Health), Central Florida (e.g., Tampa, Orlando), South Florida (e.g., Miami), and an additional site comprising linked data with unspecified location information in Florida and two other states including Georgia (i.e., Emory University) and Alabama (i.e., University of Alabama at Birmingham).
FIGURE 1.
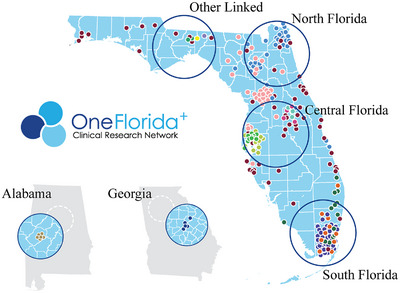
Federated learning scenario: simulation of data‐restricted areas in North Florida, Central Florida, South Florida, Georgia, Alabama, and Other Linked Data Regions.
RESEARCH‐IN‐CONTEXT
Systematic review: We reviewed the existing literature using traditional sources, such as PubMed, alongside conference abstracts, presentations, and other relevant materials. While the use of electronic health record (EHR) data to predict the transition from mild cognitive impairment (MCI) to Alzheimer's disease (AD) is still an emerging area of research, recent studies have explored the clinical aspects of this approach, with all pertinent references accurately cited.
Interpretation: Our study demonstrates the potential of federated learning (FL) using real‐world EHR data to predict the progression from MCI to AD, despite several limitations. FL's ability to integrate data across institutions and adapt to data heterogeneity offers promising results for future clinical applications.
Future directions: To improve the robustness of FL models, future research should focus on enhancing data quality, addressing inconsistencies in diagnostic coding and incorporating additional data modalities, such as clinical notes. Expanding the dataset to include diverse populations from more sites across various geographic areas and using more advanced modeling techniques will increase generalizability. Additionally, integrating FL‐based prediction tools into clinical workflows, such as shared decision‐making apps, could help personalize risk assessments and support patient–physician decisions.
The following criteria were used to determine research participants’ eligibility: (1) an MCI diagnosis made after January 2012, (2) being ≥ 50 years of age at the time of the first MCI diagnosis, and (3) having at least 1 year of data available from the first MCI diagnosis. The study excluded patients who had been diagnosed with AD prior to the MCI diagnosis. Instances of MCI were identified using International Classification of Diseases (ICD) codes 331.83 and 294.9 from ICD‐9, and G31.84 and F09 from ICD‐10. AD was identified using ICD codes 331.0 (ICD‐9) and G30.* (ICD‐10). The characteristics of the study cohort are shown in Table 1.
TABLE 1.
Characteristics of the study cohort.
| Characteristics | Total (N = 44,899) | North Florida (N = 6765) | Central Florida (N = 5888) | South Florida (N = 3129) | Alabama (N = 11,239) | Georgia (N = 3151) | Other (N = 14,727) |
|---|---|---|---|---|---|---|---|
| Age, mean ± std | 71.5 ± 10.3 | 72.4 ± 9.8 | 72.5 ± 10.7 | 70.7 ± 10.0 | 71.5 ± 10.5 | 73.4 ± 9.5 | 70.5 ± 10.4 |
| Female, N (%) | 23,708 (52.8) | 3226 (47.7) | 3050 (51.8) | 1558 (49.8) | 6182 (55.0) | 1709 (54.2) | 7983 (54.2) |
| Hispanic, N (%) | |||||||
| Hispanic | 4189 (9.3) | 223 (3.2) | 515 (8.7) | 1136 (36.3) | 57 (0.5) | 50 (1.6) | 2208 (15.0) |
| Not Hispanic | 36,114 (80.4) | 6429 (95.0) | 4324 (73.4) | 1837 (58.7) | 10,274 (91.4) | 1879 (59.6) | 11,371 (77.2) |
| Unknown | 4596 (10.2) | 113 (1.7) | 1049 (17.8) | 156 (5.0) | 908 (8.1) | 1222 (38.8) | 1148 (7.8) |
| Race, N (%) | |||||||
| American Indian or Alaska Native | 75 (0.2) | 9 (0.1) | 21 (0.4) | 3 (0.1) | 11 (0.1) | 4 (0.1) | 27 (0.2) |
| Asian | 516 (1.1) | 0 (0.0) | 77 (1.3) | 32 (1.0) | 181 (1.6) | 46 (1.5) | 180 (1.2) |
| Black or African American | 6813 (15.1) | 613 (9.1) | 487 (8.3) | 178 (5.7) | 2243 (20.0) | 960 (30.5) | 2332 (15.8) |
| Native Hawaiian or Other Pacific Islander | 25 (0.1) | 1 (0.0) | 3 (0.1) | 1 (0.0) | 1 (0.0) | 1 (0.0) | 18 (0.1) |
| White | 34,129 (76.0) | 5773 (85.3) | 4523 (76.8) | 2690 (86.0) | 8143 (72.5) | 1739 (55.2) | 11,261 (76.5) |
| Multiple race | 91 (0.2) | 23 (0.3) | 21 (0.4) | 0 (0.0) | 0 (0.0) | 0 (0.0) | 47 (0.3) |
| Unknown | 3250 (7.2) | 346 (5.1) | 756 (12.8) | 225 (7.2) | 660 (5.9) | 401 (12.7) | 862 (5.9) |
| Conversion and encounters, N (%) | |||||||
| # Convert from MCI to AD | 6391 (14.2) | 846 (12.5) | 721 (12.2) | 286 (9.1) | 1847 (16.4) | 380 (12.1) | 2311 (15.7) |
| # Average convert days (days) | 723.6 | 716.5 | 602.5 | 671 | 688.5 | 225 | 873.6 |
| # Median convert days (days) | 490.5 | 564 | 388 | 479 | 425 | 193 | 671 |
| # Do not convert | 38,508 (85.8) | 5919 (87.5) | 5167 (87.8) | 2843 (90.9) | 9392 (83.6) | 2771 (87.9) | 12,416 (84.3) |
| # Average encounters | 139.6 | 111.6 | 37.1 | 154.9 | 57.3 | 54.9 | 271 |
| # Average encounter length (days) | 2099.5 | 1941.1 | 1656.2 | 2232.4 | 2089.7 | 470.9 | 2677.2 |
| Related disease, N (%) | |||||||
| Other cerebral degenerations | 29,133 (64.9) | 3715 (54.9) | 4099 (69.6) | 1994 (63.7) | 7031 (62.6) | 2855 (90.6) | 9439 (64.1) |
| Essential hypertension | 24,942 (55.6) | 3560 (52.6) | 3435 (58.3) | 706 (22.6) | 6179 (55.0) | 1254 (39.8) | 9808 (66.6) |
| Hyperlipidemia | 18,999 (42.3) | 2786 (41.2) | 2696 (45.8) | 397 (12.7) | 4685 (41.7) | 636 (20.2) | 7799 (53.0) |
| Neurological disorders | 16,931 (37.7) | 3232 (47.8) | 1645 (27.9) | 342 (10.9) | 5033 (44.8) | 497 (15.8) | 6182 (42.0) |
| Hypertension | 15,252 (34.0) | 2384 (35.2) | 2097 (35.6) | – | 4235 (37.7) | – | 6536 (44.4) |
| Disorders of lipoid metabolism | 12,088 (26.9) | 1912 (28.3) | 1601 (27.2) | – | 3362 (29.9) | – | 5213 (35.4) |
| Malaise and fatigue | 11,983 (26.7) | 2012 (29.7) | 1327 (22.5) | 274 (8.8) | 3019 (26.9) | 308 (9.8) | 5043 (34.2) |
| Memory loss | 11,794 (26.3) | 1881 (27.8) | 1652 (28.1) | 586 (18.7) | 3137 (27.9) | 629 (20.0) | 3909 (26.5) |
| Pain in joint | 11,649 (25.9) | 1902 (28.1) | 1002 (17.0) | 377 (12.1) | 3093 (27.5) | 302 (9.6) | 4973 (33.8) |
| GERD | 11,615 (25.9) | 1704 (25.2) | 1321 (22.4) | 266 (8.5) | 2985 (26.6) | 306 (9.7) | 5,033 (34.2) |
| Related drugs, N (%) | |||||||
| Other analgesics and antipyretics | 15,085 (33.6) | 2562 (37.9) | 2174 (36.9) | 373 (11.9) | 3270 (29.1) | 233 (7.4) | 6473 (44.0) |
| Antidepressants | 13,325 (29.7) | 2233 (33.0) | 1072 (18.2) | 862 (27.6) | 4047 (36.0) | 506 (16.1) | 4605 (31.3) |
| Stemmatological preparations | 13,180 (29.4) | 2447 (36.2) | 1571 (26.7) | 489 (15.6) | 2966 (26.4) | 223 (7.1) | 5484 (37.2) |
| Opioids | 12,594 (28.1) | 2219 (32.8) | 1582 (26.9) | 359 (11.5) | 2716 (24.2) | 222 (7.1) | 5496 (37.3) |
| Lipid modifying agents, plain | 11,969 (26.7) | 2299 (34.0) | 1156 (19.6) | 445 (14.2) | 2964 (26.4) | 427 (13.6) | 4678 (31.8) |
| I.V. solution additives | 11,947 (26.6) | 2702 (39.9) | 1491 (25.3) | 287 (9.2) | 2444 (21.8) | 91 (2.9) | 4932 (33.5) |
| Antithrombotic agents | 11,611 (25.9) | 2382 (35.2) | 1688 (28.7) | 201 (6.4) | 2145 (19.1) | 222 (7.1) | 4973 (33.8) |
| Decongestants and other nasal preparations for topical use | 11,460 (25.5) | 2374 (35.1) | 1154 (20.0) | 605 (19.3) | 2555 (22.7) | 188 (6.0) | 4584 (31.1) |
| Agents for treatment of hemorrhoids and anal fissures for topical use | 11,408 (25.4) | 2419 (35.8) | 1241 (21.1) | 583 (18.6) | 2260 (20.1) | 173 (5.5) | 4732 (32.1) |
| Anti‐infectives | 11,298 (25.2) | 1958 (28.9) | 1213 (20.6) | 569 (18.2) | 2660 (23.7) | 104 (3.3) | 4794 (32.6) |
Abbreviations: AD, Alzheimer's disease; GERD, gastroesophageal reflux disease; I.V., intravenous; MCI, mild cognitive impairment.
2.1.2. Temporal trajectory composition and processing
As mentioned previously, EHRs encompass a variety of data points such as medication usage, laboratory results, and diagnoses. This rich information becomes even more valuable when organized temporally. To harness this potential, we created temporal trajectories from each patient's data, starting from their initial MCI diagnosis and extending until their first AD diagnosis. These generated temporal trajectories are described in the input data module of Figure 2A.
FIGURE 2.
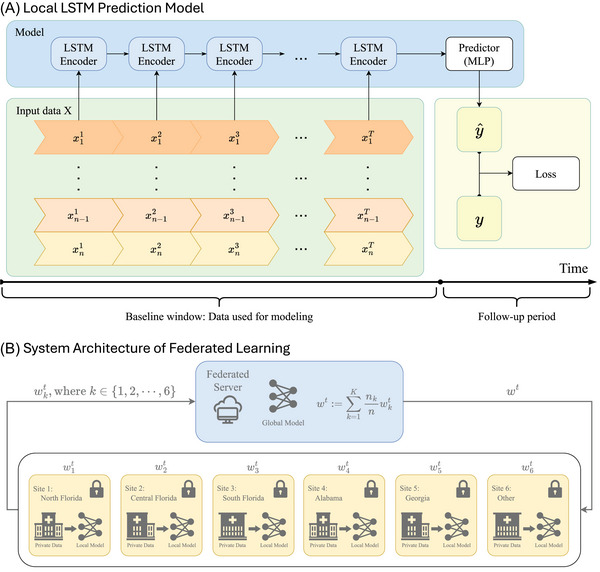
Local model and federated learning system. Local LSTM prediction model (A). This architecture includes two key parts: input data and model. The input data part contains temporal trajectories of EHRs for 𝑛 patients, represented as 𝑥𝑡 𝑖, where 𝑖 ∈ {1, 2, …, 𝑛} and 𝑡 represents time points. The model part features a combination of LSTM layers to encode temporal trajectories and an MLP predictor to forecast whether patients will convert to AD based on the EHRs. System architecture of federated learning (B). The federated learning process starts with the generation of an initial global model on the federation server. Each participating site receives this model and trains it locally using its private data. After a specified number of training epochs, each site sends its local model weights back to the server. The server then applies the FedAvg algorithm to synthesize these weights into an updated global model, which is subsequently redistributed to each site, replacing the initial weights. AD, Alzheimer's disease; EHRs, electronic health records; FedAvg, federated averaging; LSTM, long short‐term memory; MLP, multilayer perceptron.
To provide a mathematical framework for understanding the composition of our dataset, we describe it as a three‐dimensional tensor 𝜒, with dimensions 𝑛 × 𝑇 × 𝑑, where 𝑛 represents the total number of patients included in the dataset, each of whom is represented by an independent trajectory; 𝑇 signifies the number of time points recorded within the specified time window, reflecting the number of records commonly shared across most patient trajectories; and 𝑑 denotes the number of features recorded at each time point. Specifically, for any given patient 𝑖, where 𝑖 ∈ {1, 2, …, 𝑛}, their data are represented by the matrix 𝑋𝑖, where 𝑋𝑖 is a matrix of dimensions 𝑇 × 𝑑. Each row, 𝑥𝑡 𝑖, where 𝑡 ∈ {1, 2, …, 𝑇}, within this matrix corresponds to the 𝑑‐dimensional feature vector at that time point. Hence, the entire dataset 𝜒 can be expressed as Eq. (1):
| (1) |
In this framework, each 𝑋𝑖 not only captures the patient's status at specific points in time but also encapsulates the evolution of the patient's state over time.
We applied the same data processing method across all sites. For continuous data, we preserved the original values after filtering out outliers and filled missing data with the average value of the feature. For discrete data, following the approach of Xu et al., 51 we used one‐hot encoding to encode discrete variables within our dataset. Given the diversity and complexity of discrete data features such as diagnosis codes and drug codes, encoding them could be challenging. To streamline the process and reduce complexity, we categorized these features: Diagnostic codes were mapped to Phecodes, allowing us to group complex diagnoses into several broad categories. This method was based on the system described in Bastarache. 52 Drug codes were matched to level 3 of the Anatomical Therapeutic Chemical (ATC) categorization system, including National Drug Codes (NDCs) and RxNorm. 53 Using this categorization, drug data might be standardized according to chemical, pharmacological, and therapeutic qualities. After categorization, these features could be concatenated in a binary way by one‐hot encoding.
Inspired by Mao et al., 54 we filtered the processed data into four cohort groups based on the time it took for their MCI to progress to AD. These groups were defined as progressing within 6 months, within 12 months, within 24 months, and without a time limit. Each group had specific requirements: subjects in the 6 month group needed at least 6 months of records after their initial MCI diagnosis, those in the 12 month group required at least 12 months of records, subjects in the 24 month group needed at least 24 months, and those in the “no time limit” group also needed a minimum of 24 months of records. The group information is shown in Table 2.
TABLE 2.
Total and case patients (i.e., converted to Alzheimer's disease) included across various follow‐up periods (i.e., 6 months, 12 months, 24 months, and no restrictions) at different sites.
|
Total (cases) |
North Florida (cases) | Central Florida (cases) | South Florida (cases) | Alabama (cases) |
Georgia (cases) |
Other (cases) |
|
|---|---|---|---|---|---|---|---|
| In 6 months | |||||||
| # Patients | 18,060 (454) | 2555 (71) | 1994 (48) | 1380 (21) | 4314 (119) | 179 (4) | 7638 (191) |
| # Average convert days * | – (89.7) | – (92.3) | – (81.2) | – (105.4) | – (91.8) | – (129) | – (87.1) |
| # Average encounters | 209.8 (194.2) | 181.5 (152.7) | 55.6 (64.0) | 234.7 (202.5) | 90.4 (87.9) | 87.8 (106.2) | 325.4 (310.0) |
| # Average encounter days | 2979.7 (2865.6) | 2930.8 (2836.6) | 2584.2 (2521.4) | 2930.4 (2581.8) | 3030.2 (2983.6) | 763.5 (762.0) | 3131.8 (2964.6) |
| In 12 months | |||||||
| # Patients | 15,468 (719) | 2194 (100) | 1621 (76) | 1224 (40) | 3729 (198) | 37 (1) | 6663 (304) |
| # Average convert days | – (175.3) | – (164.3) | – (169.4) | – (198.1) | – (185.5) | – (134) | – (171) |
| # Average encounters | 223.9 (201.0) | 190.8 (168.6) | 56.4 (59.3) | 245.5 (251.2) | 94.1 (84.7) | 94.8 (149.0) | 345.0 (316.4) |
| # Average encounter days | 3093.5 (2954.6) | 3036.3 (3011.8) | 2719.7 (2573.4) | 3021.6 (2834.4) | 3124.7 (3011.9) | 811.3 (819.0) | 3211.6 (3016.6) |
| In 24 months | |||||||
| # Patients | 11,671 (911) | 1703 (146) | 1148 (92) | 948 (45) | 2759 (235) | 0 | 5113 (393) |
| # Average convert days | – (340.2) | – (354.5) | – (302.2) | – (374.4) | – (348.7) | – | – (334.7) |
| # Average encounters | 245.9 (225.3) | 203.8 (184.8) | 58.8 (62.3) | 256.1 (211.2) | 100.3 (81.8) | – | 378.7 (366.0) |
| # Average encounter days | 3241.8 (3081.3) | 3210.0 (3093.8) | 2872.9 (2760.2) | 3187.4 (3083.9) | 3276.2 (3054.0) | – | 3326.7 (3167.9) |
| No restrictions | |||||||
| # Patients | 12,648 (1888) | 1841 (284) | 1229 (173) | 988 (85) | 3005 (481) | 0 | 5585 (865) |
| # Average convert days | – (876.7) | – (791.6) | – (772.7) | – (832.5) | – (893.6) | – | – (920.4) |
| # Average encounters | 245.9 (235.5) | 206.5 (211.0) | 57.9 (53.9) | 253.4 (201.0) | 99.1 (84.2) | – | 377.8 (367.5) |
| # Average encounter days | 3249.0 (3212.6) | 3219.7 (3213.1) | 2976.5 (2838.7) | 3197.6 (3251.7) | 3281.5 (3200.9) | – | 3332.2 (3289.8) |
Average convert days: the average number of days that patients transition from mild cognitive impairment to Alzheimer's disease; “–”: N/A.
2.2. Models and experiment setting
In this subsection, we explain the workings of the LSTM and FL models, followed by a description of the experimental settings.
2.2.1. LSTM model for predicting MCI to AD conversion
To more accurately analyze these temporal trajectories, we have adopted a deep learning neural network based on LSTM. As shown in Figure 2A, the model is composed of two parts: a sequence of LSTM encoders and a predictor powered by a multilayer perceptron (MLP). As a classic time series algorithm, the sequence of LSTM encoders can gradually process patients’ EHRs through “memory cells” and store key information for a long time. This allows it to effectively capture dynamic changes in health status and predict disease progression from EHR data. 55 After the data are extracted by a series of LSTM encoders, the extracted information is fed into the predictor to forecast whether the patient will eventually have AD. By minimizing the discrepancy between the ground truth and the predicted labels, the model undergoes continuous refinement until it converges.
2.2.2. Federated model aggregation
For FL systems, as shown in Figure 2B, we begin by generating a model with initial weights in the federation server, which is then distributed to each participating site machine. Each site then trains the LSTM model using its own private data. Upon completing 10 epochs, each site uploads its model weights back to the server. The server uses the federated averaging algorithm (FedAvg) 56 to synthesize all the uploaded weights and redistribute the aggregated weights back to each site machine, replacing the original weights. This cycle constitutes one training round, and multiple rounds are run until the model converges.
2.2.3. Experiments setting
In this study, we established four experimental set‐ups across four distinct cohort groups. For the data, except for Georgia, we split the data from all sites according to the following ratios: training:validation:testing = 70:15:15. Due to the limited amount of data, all data from the Georgia site were used exclusively for testing. All experimental models used the best‐performing model from the validation process for subsequent testing. The prediction performance was measured using AUC. We implemented all models using Tensorflow 2.10.1, Tensorflow Federated Learning 0.40.0, and CUDA 11.6 by using a single NVIDIA A100 GPU with 40 GB RAM and 3 CPU cores.
Local model (baseline). This set of experiments used a single‐layer LSTM model with 64 hidden nodes, and the predictor consisted of one fully connected layer with sigmoid activation function. Each site used its unique private data for training and validation. We set the training duration for each site at 300 epochs to ensure comprehensive learning and model convergence. The training used binary cross‐entropy loss and an Adam optimizer with a learning rate of 0.001. After completion of training, each model was separately evaluated using its respective test set.
Pooling model. The pooling model was similar to the local model but combined the training and validation sets from all six sites. After training for 300 epochs, the model was independently tested on each of the six different test sets.
Global model. FL operated with both a global and a personalized model. As mentioned in section 2.2.2, one round involved downloading the weights, conducting local training for 10 epochs, and then uploading the weights to the server where they were aggregated using the FedAvg algorithm. After 200 rounds of training within the FL framework, the global model was obtained from the central server and tested on the six‐site test sets.
Personalized model. The personalized model was based on the global model. This set of experiments built on the global model by reintegrating the parameters into the LSTM models at each of the six sites. These models were then fine‐tuned through an additional 50 epochs of training and validation before being tested.
2.3. Evaluating feature importance across sites using SHAP and PFI analyses
We chose the two most populated sites, Alabama and Other Linked Data Regions, to assess feature importance across two distinct cohort groups: within 24 months and without restrictions. This analysis aimed to verify the models’ ability to handle diverse data characteristics by calculating the SHAP values. SHAP values were calculated based on Shapley values from game theory and represent the average contribution of a feature across all possible combinations of features. Essentially, the SHAP value was determined by comparing the models’ predictions with and without a particular feature. Because SHAP is not suitable for LSTM models, we used information from a single time point, the first MCI diagnose date, for each patient and applied XGBoost to calculate the SHAP values for the features in this dataset.
To further assess whether these features remain significant in the context of time‐series data, we applied PFI. Specifically, we evaluated feature relevance by comparing AUC values before and after permuting the data for individual features in both global and personalized models. Furthermore, we identified temporally important features and arranged them chronologically to present the trend of these features over time.
3. RESULTS
We identified a total of 44,899 patients from six sites, with a statistical summary presented in Table 1. The candidate cohort had an average age of 71.5 years, with 52.8% being women. Among the cohort, 80.4% were non‐Hispanic, and 76% were White. Population characteristics was generally similar across locations; however, two sites, South Florida and Georgia, had a higher percentage of Hispanic individuals (40%), compared to North Florida (5%). Racially, Georgia had a notably lower percentage of Whites (55%) than the other sites.
Among the study population, 14.2% (6391 patients) progressed from MCI to AD, while 85.8% (38,508 patients) remained in the MCI state throughout the study. In the South Florida site, only 9.1% MCI patients transitioned to AD, while other sites had a conversion rate of ≈ 14%, consistent with previous studies. 5 , 6 On average, patients had ≈ 140 encounters over ≈ 2100 days with notable variation in encounter frequencies and durations across different sites. We also documented the top 10 prevalent diseases and medications in Table 1. Predominantly, patients suffered from primary hypertension, hyperlipidemia, and neurological disorders, though the prevalence of these conditions was 10% to 30% lower in South Florida and Georgia compared to the general population, a trend also reflected in medication usage.
The patient counts for each follow‐up cohort are presented in Table 2. The “other linked sites” group had the largest population. Georgia, which only contains data from Emory University, has the smallest population, with no patients in the 24 month and “no time limit” groups. Additionally, the data indicated that as the follow‐up period increased, both the average number of encounters and the average days per encounter increased.
Table 3 presents the experimental results for various models predicting the progression from MCI to AD by site. As predicted, the personalized and pooled models performed best, followed by the global model, with the local model performing the poorest. The personalized and pooled models achieved the highest AUC scores (≈ 0.672 and ≈ 0.668, respectively), outperforming the global model (≈ 0.648) and the local model (≈ 0.619). Additionally, the uniformity in the findings across different cohort groups for each of the four datasets underscores the robust generalizability of the model. The consistency in results across different cohort groups for the four datasets underscores the robustness and generalizability of the models, highlighting their adaptability to different data characteristics.
TABLE 3.
AUC performance of different models for MCI to AD prediction by sites. Numbers in bold font represent the best performance, and numbers in italic font represent the second‐best performance. All available data from the Georgia site are used for testing due to data limitations.
| Model | North Florida | Central Florida | South Florida | Alabama | Georgia | Other | |
|---|---|---|---|---|---|---|---|
| In 6 months | Local | 0.729 | 0.579 | 0.533 | 0.690 | – | 0.655 |
| Pooled | 0.693 | 0.616 | 0.637 | 0.721 | 0.784 | 0.712 | |
| Global | 0.785 | 0.622 | 0.57 | 0.715 | 0.531 | 0.662 | |
| Personalized | 0.794 | 0.651 | 0.606 | 0.712 | – | 0.679 | |
| In 12 months | Local | 0.554 | 0.447 | 0.616 | 0.611 | – | 0.625 |
| Pooled | 0.739 | 0.439 | 0.717 | 0.714 | 0.778 | 0.629 | |
| Global | 0.598 | 0.438 | 0.617 | 0.637 | 0.611 | 0.637 | |
| Personalized | 0.643 | 0.525 | 0.659 | 0.664 | – | 0.635 | |
| In 24 months | Local | 0.580 | 0.532 | 0.820 | 0.692 | – | 0.642 |
| Pooled | 0.593 | 0.638 | 0.811 | 0.723 | – | 0.657 | |
| Global | 0.609 | 0.637 | 0.837 | 0.755 | – | 0.652 | |
| Personalized | 0.572 | 0.621 | 0.836 | 0.763 | – | 0.657 | |
| No restrictions | Local | 0.614 | 0.566 | 0.615 | 0.661 | – | 0.623 |
| Pooled | 0.707 | 0.607 | 0.765 | 0.668 | – | 0.653 | |
| Global | 0.655 | 0.636 | 0.726 | 0.666 | – | 0.658 | |
| Personalized | 0.682 | 0.647 | 0.744 | 0.649 | – | 0.638 |
Abbreviations: AD, Alzheimer's disease; AUC, area under the receiver operating characteristic; MCI, mild cognitive impairment.
Figure 3 visualizes the importance of features across the two most populated sites and cohort groups using SHAP values. Each subplot shows the top 15 variables with the highest average SHAP values on the left, while the right‐side plot displays SHAP values for each feature for each sample, illustrating whether the feature is positively or negatively correlated with model predictions. Features such as body mass index (BMI), vitamin B12, systolic and diastolic blood pressure (BP), cholesterol, and high‐density lipoprotein (HDL) appeared consistently across the four data sets. These features were validated by PFI, as shown in Figure 4. On average, disrupting these features reduced the AUC by 1%, with the largest decrease observed in vitamin B12, for which the AUC dropped nearly 10% in both global and personalized models. Figure 5 presents the temporal trends of these six key features, with mean and standard deviation (SD) calculated every 3 months. The red line represents the case group (patients who transitioned from MCI to AD), while the blue line corresponds to the control group (patients who remained in the MCI stage). Notable differences in BMI, systolic and diastolic BP, and HDL levels were observed between the two groups, highlighting their potential role in the progression from MCI to AD. In contrast, vitamin B12 and cholesterol levels showed no substantial variations, particularly in Other Linked Data Regions.
FIGURE 3.
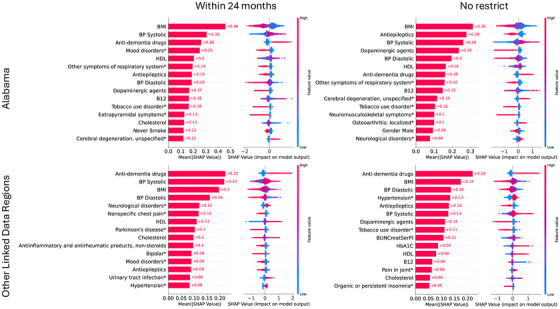
The average Shapley additive explanation (SHAP) values of various health indicators and disease conditions on model outputs in different regions (Alabama and others) and under two conditions (within 24 months and unrestricted). The SHAP values indicate the relative importance and direction of influence of each feature in model decisions. The left subfigures represent the mean of numerical values, while the right subfigures have red portions representing high impacts and blue portions representing low impacts, with the specific values demonstrating the magnitude of the average impacts. B12, vitamin B12; BMI, body mass index; BP, blood pressure; HDL, high‐density lipoprotein.
FIGURE 4.
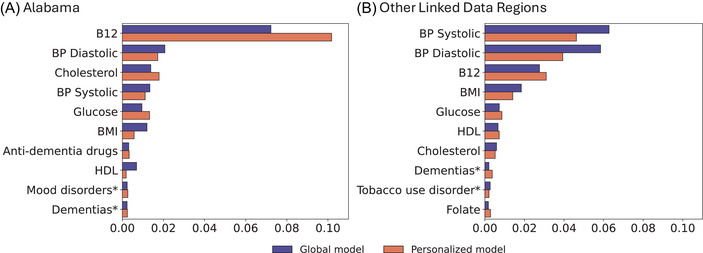
Comparison of feature temporal importances in global and personalized models across different regions: (A) Alabama and (B) Other Linked Data Regions. Each bar represents the difference of AUC by disrupting a feature of data, with the global model shown in blue and the personalized model in orange. AUC, area under the receiver operating characteristic curve; B12, vitamin B12; BMI, body mass index; BP, blood pressure; HDL, high‐density lipoprotein.
FIGURE 5.
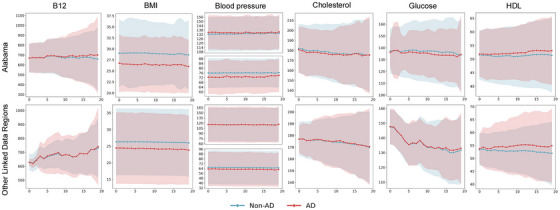
Tendency of key biomarkers in Alabama and Other Linked Data Regions. This figure illustrates the trends over time for six biomarkers: B12, BMI, blood pressure (systolic and diastolic), cholesterol, and HDL. Data were collected every 3 months, with the mean values plotted. The solid red line represents the mean for patients who progressed from MCI to AD, and the solid blue line represents the mean for patients who remained stable at the MCI stage, while the shaded areas indicate one standard deviation. AD, Alzheimer's disease; B12, vitamin B12; BMI, body mass index; BP, blood pressure; HDL, high‐density lipoprotein; MCI, mild cognitive impairment.
4. DISCUSSION
We aimed to demonstrate the feasibility of FL in predicting the transition from MCI to AD using EHRs and LSTM models. This approach not only protects data privacy but also uses decentralized data sources to improve model generalization and leverages the properties of time series models to enhance the ability to capture data. By reducing the requirement to send protected health information, we were able to avoid possible privacy and data governance restrictions in multicenter research by adopting a streamlined two‐way cooperation approach. Mitigating these difficulties by the implementation of FL helped speed the process of ethical and regulatory evaluation while maintaining patient privacy. 57 Given that EHRs include patient treatment data at multiple time points, including clinical records, laboratory testing, and medication usage, the local model of LSTM allows for the concatenation of data from these time points, resulting in additional information.
In this study, our FL model demonstrated outstanding efficacy across the four different follow‐up periods, with overall performance comparable to the pooled model and better than any of the local models. This indicates that the FL model has been effective in predicting AD; at the same time, the FL model is able to profit from the data collected by each local model, all without the need for data merging, which considerably decreases the training cost.
In addition, our demographic analyses uncovered regional variations that are crucial for interpreting the study results. For instance, the proportion of non‐Hispanic individuals in North Florida reaches as high as 95%, in stark contrast to ≈ 60% in South Florida and Georgia. Moreover, the rate of MCI conversion to AD varied regionally, with rates as low as 9.1% in South Florida and ≈ 14% in other areas.
Six features (i.e., BMI, vitamin B12, systolic/diastolic BP, cholesterol, and HDL) in Figure 3 and Figure 4 were identified as having significant effects on the model across the four settings. Of these, BMI, diastolic BP, vitamin B12, and cholesterol were negatively associated with the transition from MCI to AD, whereas HDL and systolic BP were positively associated. These correlations align with existing research: Low BMI may reflect malnutrition or metabolic problems in the body, which are potential risk factors for AD. 58 Similarly, low vitamin B12 levels may lead to reduced neurological function, 59 and low diastolic BP may be associated with reduced blood flow to the brain. 60 Abnormal cholesterol levels may affect the structure and function of nerve cells. 61 Higher HDL is often seen as a marker of cardiovascular health, but in the context of AD, it may reflect a complex imbalance in metabolic regulation associated with the disease. 62 Higher systolic BP may indicate the presence of ongoing cardiovascular stress or other factors that may accelerate cognitive deterioration by affecting brain structure and function. 60 In addition, different variables may interact in complex ways. For instance, low BMI is often accompanied by weight loss, which has been strongly associated with vitamin B12 deficiency and neurodegenerative changes. 63 Therefore, rather than simply reflecting malnutrition, low BMI may also indicate metabolic abnormalities that accelerate neurodegeneration. 63 Likewise, the interplay between high systolic BP and elevated HDL levels may significantly impact neurodegenerative processes. Research suggests that hypertension and hypercholesterolemia not only increase the risk of dementia by inducing atherosclerosis and impairing blood flow but may also directly contribute to neurodegeneration in AD. 64 In Figure 5, we can observe the temporal trends of these features. Because we used mean values to impute missing data and the SD is large, the trends between case and control groups might appear similar, especially for features with a high rate of missing values. This could explain the lack of significant differences in vitamin B12 and cholesterol levels in Other Linked Data Regions, as mentioned in the Results section. It may also contribute to the relatively modest AUC values observed in our models.
There are several limitations to this study. The first is its reliance on EHR data, which inherently comes with certain constraints. EHRs are primarily collected for clinical purposes rather than research, often leading to incomplete or inconsistent data. Variability in how health‐care providers document information, along with missing data or miscoded diagnoses, can introduce biases. Additionally, temporal gaps in EHR data may affect the accuracy of recorded disease progression or treatment outcomes, as patient follow‐up schedules vary. These factors could skew research results, reducing robustness and potentially impacting generalizability. In terms of data, we used diagnostic codes to identify patients with MCI and AD. However, MCI is an intermediate stage between normal cognitive function and AD, and its progression varies between individuals. Before 2010, AD diagnoses were typically not given unless clear dementia symptoms were present. 65 With the advent of in vivo biomarkers, physicians have begun to separate disease severity (or syndrome) from disease etiology. 65 For example, MCI progressing to dementia should now be specified as dementia due to AD. Although clinical coding is gradually adapting to this conceptual shift, many systems still retain pre‐2010 terminology, equating AD with dementia, as seen in ICD codes and the Diagnostic and Statistical Manual of Mental Disorders (DSM). 66 This may lead to misclassification of patients as having either MCI or AD. Additionally, certain features used in our analysis may introduce bias. For instance, BMI was treated as a continuous variable, which may have influenced the results. A large body of literature suggests a U‐shaped association between BMI and dementia risk, where both abnormally low and high BMI are linked to increased risk. 67 Treating BMI as a continuous variable might have obscured this non‐linear relationship and impacted our findings. Furthermore, our study was limited to data from OneFlorida+, which primarily includes data from Florida, Alabama, and Georgia (with a relatively small contribution from Georgia). The geographic restriction may limit the generalizability of our findings to populations with different demographics. Moreover, our study was limited to structured data, potentially overlooking nuanced insights from physicians that could be captured in unstructured modality like clinical notes. Last, our modeling approach used a single‐layer LSTM model as the local model. While effective in capturing sequential patterns, this simple architecture may not have been sufficient to fully extract complex relationships within the data.
5. CONCLUSION
This study demonstrates the potential efficacy of FL using real‐world EHR data from patients with MCI and AD, collected from six regional sites across four different settings. FL technology provides a promising approach to maintaining patient privacy while enabling data integration across multiple organizations. Additionally, it allows for an assessment of how data heterogeneity across different regions influences model performance. The findings suggest that FL could be a valuable tool for clinical analysis of AD, with potential applications on a global scale. Further research is needed to deepen our understanding of AD mechanisms and to explore early diagnostic and preventive strategies.
AUTHOR CONTRIBUTIONS
Jinqian Pan and Jie Xu were responsible for the overall design, development, and evaluation of this study. Jinqian Pan, Zhengkang Fan, and Jie Xu did the initial drafts of the manuscript. Zhengkang Fan was responsible for running all experiments and creating SHAP plots. All authors reviewed and revised the manuscript critically for scientific content.
CONFLICT OF INTEREST STATEMENT
The authors declare no competing interests. Author disclosures are available in the supporting information.
CONSENT STATEMENT
The study has been approved and the requirement to obtain any informed consent has been waived by the University of Florida Institutional Review Board (protocol no. IRB202202820). The research does not involve greater than minimal risk for participation. Analyses only involve the secondary analysis of data that are either limited data sets or de‐identified. Our research team has no direct contact with human subjects. All methods were carried out in accordance with relevant guidelines and regulations.
Supporting information
Supporting information
ACKNOWLEDGMENTS
This work was partially supported by a grant from the Ed and Ethel Moore Alzheimer's Disease Research Program of the Florida Department of Health (FL DOH #23A09). Research reported in this publication was also supported in part by the OneFlorida+ Clinical Research Network, funded by the Patient‐Centered Outcomes Research Institute numbers CDRN‐1501‐26692, RI‐CRN‐2020‐005 and RI‐FLORIDA‐01‐PS1; in part by the University of Florida Clinical and Translational Science Institute, which is supported in part by the NIH National Center for Advancing Translational Sciences under award number UL1TR001427 and UL1TR000064. The content is solely the responsibility of the authors and does not necessarily represent the official views of the Patient‐Centered Outcomes Research Institute (PCORI), its Board of Governors or Methodology, the OneFlorida+ Clinical Research Network, the UF‐FSU Clinical and Translational Science Institute, or the National Institutes of Health.
Pan J, Fan Z, Smith GE, Guo Y, Bian J, Xu J. Federated learning with multi‐cohort real‐world data for predicting the progression from mild cognitive impairment to Alzheimer's disease. Alzheimer's Dement. 2025;21:e70128. 10.1002/alz.70128
REFERENCES
- 1. Alzheimer's Association . 2012 Alzheimer's disease facts and figures. Alzheimer Demen. 2012;8:131‐168. [DOI] [PubMed] [Google Scholar]
- 2. Tarawneh R, Holtzman DM. The clinical problem of symptomatic Alzheimer disease and mild cognitive impairment. Cold Spring Harb Perspect Med. 2012;2:a006148. [DOI] [PMC free article] [PubMed] [Google Scholar]
- 3. Anderson ND. State of the science on mild cognitive impairment (MCI). CNS Spectr. 2019;24:78‐87. [DOI] [PubMed] [Google Scholar]
- 4. Petersen RC, Caracciolo B, Brayne C, Gauthier S, Jelic V, Fratiglioni L. Mild cognitive impairment: a concept in evolution. J Intern Med. 2014;275:214‐228. [DOI] [PMC free article] [PubMed] [Google Scholar]
- 5. Farias ST, Mungas D, Reed BR, Harvey D, DeCarli C. Progression of mild cognitive impairment to dementia in clinic‐vs community‐based cohorts. Arch Neurol. 2009;66:1151‐1157. [DOI] [PMC free article] [PubMed] [Google Scholar]
- 6. Mitchell A, Shiri‐Feshki M. Temporal trends in the long term risk of progression of mild cognitive impairment: a pooled analysis. J Neurol Neurosurg Psychiatry. 2008;79:1386‐1391. [DOI] [PubMed] [Google Scholar]
- 7. Varatharajah Y, Ramanan VK, Iyer R, Vemuri P. Predicting short‐term MCI‐to‐AD progression using imaging, CSF, genetic factors, cognitive resilience, and demographics. Sci Rep. 2019;9:2235. [DOI] [PMC free article] [PubMed] [Google Scholar]
- 8. Hansson O, Lehmann S, Otto M, Zetterberg H, Lewczuk P. Advantages and disadvantages of the use of the CSF Amyloid β (Aβ) 42/40 ratio in the diagnosis of Alzheimer's Disease. Alzheimers Res Ther. 2019;11:1‐15. [DOI] [PMC free article] [PubMed] [Google Scholar]
- 9. Zhang T, Liao Q, Zhang D, et al. Predicting MCI to AD conversation using integrated sMRI and rs‐fMRI: machine learning and graph theory approach. Front Aging Neurosci. 2021;13:688926. [DOI] [PMC free article] [PubMed] [Google Scholar]
- 10. Teng L, Li Y, Zhao Y, et al. Predicting MCI progression with FDG‐PET and cognitive scores: a longitudinal study. BMC Neurol. 2020;20:1‐10. [DOI] [PMC free article] [PubMed] [Google Scholar]
- 11. Korolev IO, Symonds LL, Bozoki AC. Alzheimer's Disease Neuroimaging Initiative. Predicting progression from mild cognitive impairment to Alzheimer's dementia using clinical, MRI, and plasma biomarkers via probabilistic pattern classification. PLoS One. 2016;11:e0138866. [DOI] [PMC free article] [PubMed] [Google Scholar]
- 12. Shigemizu D, Akiyama S, Higaki S, et al. Prognosis prediction model for conversion from mild cognitive impairment to Alzheimer's disease created by integrative analysis of multi‐omics data. Alzheimers Res Ther. 2020;12:1‐12. [DOI] [PMC free article] [PubMed] [Google Scholar]
- 13. Davatzikos C, Bhatt P, Shaw LM, Batmanghelich KN, Trojanowski JQ. Prediction of MCI to AD conversion, via MRI, CSF biomarkers, and pattern classification. Neurobiol Aging. 2011;32:2322‐e19. [DOI] [PMC free article] [PubMed] [Google Scholar]
- 14. Li Q, Yang X, Xu J, et al. Early prediction of Alzheimer's disease and related dementias using real‐world electronic health records. Alzheimer Demen. 2023;19:3506‐3518. [DOI] [PMC free article] [PubMed] [Google Scholar]
- 15. Park JH, Cho HE, Kim JH, et al. Machine learning prediction of incidence of Alzheimer's disease using large‐scale administrative health data. NPJ Digital Med. 2020;3:46. [DOI] [PMC free article] [PubMed] [Google Scholar]
- 16. Fouladvand S, Noshad M, Periyakoil V, Chen JH. Machine learning prediction of mild cognitive impairment and its progression to Alzheimer's disease. Health Science Reports. 2023;6:e1438. [DOI] [PMC free article] [PubMed] [Google Scholar]
- 17. Pang Y, Kukull W, Sano M, et al. Predicting progression from normal to MCI and from MCI to AD using clinical variables in the national Alzheimer's coordinating center uniform data set version 3: application of machine learning models and a probability calculator. J Prev Alzheimers Dis. 2023;10:301‐313. [DOI] [PMC free article] [PubMed] [Google Scholar]
- 18. Beekly DL, Ramos EM, Lee WW, et al. The national alzheimer's coordinating center (NACC) database: the uniform data set. 2007:249‐258. [DOI] [PubMed]
- 19. Brisimi TS, Chen R, Mela T, Olshevsky A, Ch PI, Shi W. Federated learning of predictive models from federated electronic health records. Int J Med Informatics. 2018;112:59‐67. [DOI] [PMC free article] [PubMed] [Google Scholar]
- 20. Xu J, Glicksberg BS, Su C, Walker P, Bian J, Wang F. Federated learning for healthcare informatics. J Healthcare Informat Res. 2021;5:1‐19. [DOI] [PMC free article] [PubMed] [Google Scholar]
- 21. Rieke N, Hancox J, Li W, et al. The future of digital health with federated learning. NPJ Digital Med. 2020;3:1‐7. [DOI] [PMC free article] [PubMed] [Google Scholar]
- 22. Lee J, Sun J, Wang F, Wang S, Jun CH, Jiang X. Privacy‐preserving patient similarity learning in a federated environment: development and analysis. JMIR Med Inform. 2018;6:e7744. [DOI] [PMC free article] [PubMed] [Google Scholar]
- 23. Xu J, Xu Z, Walker P, Wang F. Federated patient hashing. In Proc AAAI Conf Artif Intell. 2020:6486‐6493.
- 24. Kim Y, Sun J, Yu H, Jiang X. Federated tensor factorization for computational phenotyping. In Proc 23rd ACM SIGKDD Int Conf Knowl Discov Data Min (KDD). 2017:887‐895. [DOI] [PMC free article] [PubMed]
- 25. Liu D, Dligach D, Miller T. Two‐stage federated phenotyping and patient representation learning. NIH Public Access. 2019;2019:283. [DOI] [PMC free article] [PubMed] [Google Scholar]
- 26. Huang L, Shea AL, Qian H, Masurkar A, Deng H, Liu D. Patient clustering improves efficiency of federated machine learning to predict mortality and hospital stay time using distributed electronic medical records. J Biomed Inform. 2019;99:103291. [DOI] [PubMed] [Google Scholar]
- 27. Vaid A, Jaladanki SurajK, Xu J, et al. Federated learning of electronic health records to improve mortality prediction in hospitalized patients with COVID‐19: machine learning approach. JMIR Medical Informatics. 2021;9:e24207. [DOI] [PMC free article] [PubMed] [Google Scholar]
- 28. Yaqoob MM, Nazir M, Khan MA, Qureshi S, Al‐Rasheed A. Hybrid classifier‐based federated learning in health service providers for cardiovascular disease prediction. Applied Sciences. 2023;13:1911. [Google Scholar]
- 29. Dhavamani M , Alansary. A federated learning based approach for heart disease prediction. In 6th Int Conf Comput Methodol Commun (ICCMC). 2022: 1117‐1121.
- 30. Dayan I, Roth HR, Zhong A, et al. Federated learning for predicting clinical outcomes in patients with COVID‐19. Nat Med. 2021;27:1735‐1743. [DOI] [PMC free article] [PubMed] [Google Scholar]
- 31. Linardos A, Kushibar K, Walsh S, Gkontra P, Lekadir K. Federated learning for multi‐center imaging diagnostics: a simulation study in cardiovascular disease. Sci Rep. 2022;12:3551. [DOI] [PMC free article] [PubMed] [Google Scholar]
- 32. Bebortta S, Tripathy SS, Basheer S, Chowdhary CL. FedEHR: a federated learning approach towards the prediction of heart diseases in IoT‐based electronic health records. Diagnostics. 2023;13:3166. [DOI] [PMC free article] [PubMed] [Google Scholar]
- 33. Ma Z, Zhang M, Liu J, et al. An assisted diagnosis model for cancer patients based on federated learning. Front Oncol. 2022;12:860532. [DOI] [PMC free article] [PubMed] [Google Scholar]
- 34. Abbas S, Issa GF, Fatima A, et al. Fused weighted federated deep extreme machine learning based on intelligent lung cancer disease prediction model for healthcare 5.0. Int J Intell Syst. 2023;2023:1‐14. [Google Scholar]
- 35. Nandhini J, Joshi S, Anuratha K. Federated learning based prediction of chronic kidney diseases. IEEE. 2022:1‐6. [Google Scholar]
- 36. Rajendran S, Xu Z, Pan W, Ghosh A, Wang F. Data heterogeneity in federated learning with electronic health records: case studies of risk prediction for acute kidney injury and sepsis diseases in critical care. PLOS Digital Health. 2023;2:e0000117. [DOI] [PMC free article] [PubMed] [Google Scholar]
- 37. Su Y, Huang C, Zhu W, Lyu X, Ji F. Multi‐party diabetes mellitus risk prediction based on secure federated learning. Biomed Signal Process Control. 2023;85:104881. [Google Scholar]
- 38. Ouyang X. Design and deployment of multi‐modal federated learning systems for Alzheimer's disease monitoring. In: Proceedings of the 21st Annual International Conference on Mobile Systems, Applications and Services (MobiSys). 2023:612‐614. [Google Scholar]
- 39. Stripelis D, Dhinagar NikhilJ, Sanchez RV, Thomopoulos SI, Thompson PM, Ambite JL. Federated deep learning for detecting alzheimer's disease in multi‐cohort brain MRI. Alzheimer Demen. 2023;19:e065998. [Google Scholar]
- 40. Huang YL, Yang HC, Lee CC. Federated learning via conditional mutual learning for Alzheimer's disease classification on T1W MRI. IEEE. 2021;2021:2427‐2432. [DOI] [PubMed] [Google Scholar]
- 41. Lakhan A, Grønli TM, Muhammad G, Tiwari P. EDCNNS: federated learning enabled evolutionary deep convolutional neural network for Alzheimer disease detection. Appl Soft Comput. 2023;147:110804. [Google Scholar]
- 42. Khalil K, Mahbubur M, Sherif A, et al. A federated learning model based on hardware acceleration for the early detection of alzheimer's disease. Sensors. 2023;23:8272. [DOI] [PMC free article] [PubMed] [Google Scholar]
- 43. Ali LiZ, Liu L, Zhang J, Liu J. Fair and privacy‐preserving alzheimer's disease diagnosis based on spontaneous speech analysis via federated learning. IEEE. 2022;2022:1362‐1365. [DOI] [PubMed] [Google Scholar]
- 44. Suchitra S, Senthamarai N, Jeyaselvi M, Poovaraghan R. A federated learning based alzheimer's disease prediction. CRC Press; 2024:264‐282. [Google Scholar]
- 45. Lei B, Zhu Y, Liang E, et al. Federated Domain Adaptation via Transformer for Multi‐Site Alzheimer's Disease Diagnosis. IEEE; 2023. [DOI] [PubMed] [Google Scholar]
- 46. Mandawkar U, Diwan T. Alzheimer disease classification using tawny flamingo based deep convolutional neural networks via federated learning. The Imaging Science Journal. 2022;70:459‐472. [Google Scholar]
- 47. Hochreiter S, Schmidhuber J. Long short‐term memory. Neural Comput. 1997;9:1735‐1780. [DOI] [PubMed] [Google Scholar]
- 48. Lundberg SM, Lee SI. A unified approach to interpreting model predictions. Adv Neural Inf Process Syst. 2017;30. [Google Scholar]
- 49. Altmann A, Toloşi L, Sander O, Lengauer T. Permutation importance: a corrected feature importance measure. Bioinformatics. 2010;26:1340‐1347. [DOI] [PubMed] [Google Scholar]
- 50. Shenkman E, Hurt M, Hogan W, et al. OneFlorida Clinical Research Consortium: linking a clinical and translational science institute with a community‐based distributive medical education model. Acad Med. 2018;93:451‐455. [DOI] [PMC free article] [PubMed] [Google Scholar]
- 51. Xu J, Zhang H, Zhang H, Bian J, Wang F. Machine learning enabled subgroup analysis with real‐world data to inform clinical trial eligibility criteria design. Sci Rep. 2023;13:613. [DOI] [PMC free article] [PubMed] [Google Scholar]
- 52. Bastarache L. Using phecodes for research with the electronic health record: from PheWAS to PheRS. Annu Rev Biomed Data Sci. 2021;4:1‐19. [DOI] [PMC free article] [PubMed] [Google Scholar]
- 53. Nahler G, Nahler G. Anatomical Therapeutic Chemical Classification System (ATC). Springer; 2009:8‐8. [Google Scholar]
- 54. Mao C, Xu J, Rasmussen L, et al. AD‐BERT: using pre‐trained language model to predict the progression from mild cognitive impairment to Alzheimer's disease. J Biomed Inform. 2023;144:104442. [DOI] [PMC free article] [PubMed] [Google Scholar]
- 55. Su C, Hou Y, Xu J, et al. Identification of Parkinson PACE Subtypes and Repurposing Treatments through Integrative Analyses of Multimodal Clinical Progression, Neuroimaging, Genetic, and Transcriptomic Data. Cold Spring Harbor Laboratory Press; 2021:2021‐2007. [Google Scholar]
- 56. Bonawitz K, Ivanov V, Kreuter B, et al. Practical secure aggregation for privacy‐preserving machine learning. In Proc ACM SIGSAC Conf Comput Commun Secur (CCS). 2017:1175‐1191.
- 57. Sarma KV, Harmon S, Sanford T, et al. Federated learning improves site performance in multicenter deep learning without data sharing. J Am Med Inform Assoc. 2021;28:1259‐1264. [DOI] [PMC free article] [PubMed] [Google Scholar]
- 58. García‐Ptacek S, Faxén‐Irving G, Čermáková P, Eriksdotter M, Religa D. Body mass index in dementia. Eur J Clin Nutr. 2014;68:1204‐1209. [DOI] [PubMed] [Google Scholar]
- 59. Wang HX, Wahlin A, Basun H, Fastbom J, Winblad B, Fratiglioni L. Vitamin B12 and folate in relation to the development of Alzheimer's disease. Neurology. 2001;56:1188‐1194. [DOI] [PubMed] [Google Scholar]
- 60. Jack. Cardiovascular risk factors promote brain hypoperfusion leading to cognitive decline and dementia. Cardiovasc Psychiatry Neurol. 2012;2012. [DOI] [PMC free article] [PubMed] [Google Scholar]
- 61. Puglielli L, Tanzi RE, Kovacs DM. Alzheimer's disease: the cholesterol connection. Nat Neurosci. 2003;6:345‐351. [DOI] [PubMed] [Google Scholar]
- 62. Pedrini S, Chatterjee P, Hone E, Martins RN. High‐density lipoprotein‐related cholesterol metabolism in Alzheimer's disease. J Neurochem. 2021;159:343‐377. [DOI] [PubMed] [Google Scholar]
- 63. Rekik A, Santoro C, Poplawska‐Domaszewicz K, et al. Parkinson's disease and vitamins: a focus on vitamin B12. J Neural Transm. 2024;131(12):1495‐1509. [DOI] [PMC free article] [PubMed] [Google Scholar]
- 64. Kivipelto M, Helkala EL, Laakso MP, et al. Midlife vascular risk factors and Alzheimer's disease in later life: longitudinal, population based study. BMJ. 2001;322(7300):1447‐1451. [DOI] [PMC free article] [PubMed] [Google Scholar]
- 65. Sorbi S, Hort J, Erkinjuntti T, et al. EFNS‐ENS Guidelines on the diagnosis and management of disorders associated with dementia. Eur J Neurol. 2012;19:1159‐1179. [DOI] [PubMed] [Google Scholar]
- 66. American, American . Diagnostic and Statistical Manual of Mental Disorders: DSM‐5. Vol 5. American psychiatric association Washington, DC; 2013. [Google Scholar]
- 67. Deng YT, Li YZ, Huang SY, et al. Association of life course adiposity with risk of incident dementia: a prospective cohort study of 322,336 participants. Mol Psychiatry. 2022;27:3385‐3395. [DOI] [PubMed] [Google Scholar]
Associated Data
This section collects any data citations, data availability statements, or supplementary materials included in this article.
Supplementary Materials
Supporting information