

Abstract
Background
Prognostic markers of good neurological outcome after cardiac arrest (CA) remain limited. We aimed to evaluate the prognostic value of neuron-specific enolase (NSE), electroencephalogram (EEG) and somatosensory evoked potentials (SSEP) in predicting good outcome, assessed separately and in combination.
Methods
A retrospective study was conducted in a tertiary CA center, using a prospective registry. We included all patients comatose after discontinuation of sedation and with one EEG and NSE blood measurement at 24, 48 or/and 72 h after CA. The primary outcome was favorable neurological outcome at three months, a Cerebral Performance Categories (CPC) scale 1–2 defining a good outcome.
Results
Between January 2017 and April 2024, 215 patients were included. Participants were 63 years old (IQR [52–73]), and 73% were male. At 3 months, 54 patients (25.1%) had a good outcome. Compared to the poor outcome group, NSE blood levels were significantly lower in the good outcome group at 24 h (39 IQR[27–45] vs 54 IQR[37–82]µg/L, p < 0.001), 48 h (26 [18–43] vs 107 [54–227]µg/L, p < 0.001) and 72 h (20 µg/L IQR [15–30] vs 184 µg/l IQR [60–300], p < 0,001). Normal NSE (i.e., < 17 µg/L) at 24 h was highly predictive of good outcome, with a predictive positive value (PPV) of 71% despite a sensitivity (Se) of 9%. The best cut-off values for NSE at 24, 48 and 72 h were below 45.5, 51.5 and 41.5 µg/L, yielding PPV of 64%, 80% and 83% and sensitivities of 74%, 93% and 90%, respectively. A decreasing trend in NSE levels between 24 and 72 h was also highly predictive of good outcome (PPV 82%, Se 81%). A benign EEG pattern was more frequently observed in the good outcome group (87.1 vs 14.9%, p < 0.001) and predicted a good outcome with a PPV of 72% and a Se of 94%. Regarding SSEPs, a bilateral N20-baseline amplitude > 0.85 µV was predictive of good outcome (PPV 75%, Se 100%). The combination of NSE < 51.5 µg/l at 48 h, a decreasing NSE trend between 24 and 72 h and a benign EEG showed the best predictive value (PPV 96%, Se 76%).
Conclusion
In comatose patients after CA, a low NSE levels at 24, 48 h or 72 h, a decreasing trend in NSE over time, a benign EEG and a high N20 amplitude are robust markers of favorable outcome, reducing prognosis uncertainty.
Graphical abstract

Supplementary Information
The online version contains supplementary material available at 10.1186/s13054-025-05378-8.
Keywords: Cardiac arrest, Neuroprognostication, Coma, Neuron-specific enolase, NSE, EEG, Electroencephalography, Somatosensory-evoked potentials, SSEP
Introduction
Approximately 80% of patients resuscitated from cardiac arrest (CA) are comatose on ICU admission and nearly 50% of survivors have still not regained consciousness after 72 h [1]. In this population, prognostication is commonly used to guide care and to provide the most accurate information to patient’s relatives. Withdrawal of life-sustaining therapy (WLST) remains the leading cause of mortality among comatose patients after CA [2] highlighting the importance of accurate prognostication to enable informed decisions [3]. Both the 2021 ERC-ESICM [4] and the 2023 Neurocritical Care Society (NCS) [5] guidelines for neuroprognostication emphasize predictors of poor outcome. With this intention, predictors with the highest specificity and the lowest false positive rate should be favored to minimize the possibility of wrong prediction, avoiding self-fulfilling prophecy [6, 7]. To date, it seems possible to predict a poor outcome when at least two of the following markers are present: status myoclonus appearing during the first 72 h, bilateral abolition of corneal and pupillary reflexes at 72 h, highly malignant EEG after 24 h, bilateral abolition of the N20 on somato-sensory evoked potentials (SSEP), neuron-specific enolase (NSE) blood level > 60 µg/l at 48 or/and 72 h, and diffuse/extensive anoxic injury on brain imaging. However, if none or only one of these predictors is present, the outcome is considered as “indeterminate”, requiring further observation. A recent prospective multicentric study highlighted that approximately 50% of patients have an indeterminate outcome [8]. It is therefore of interest to identify markers that are highly predictive of a good outcome. Indeed, these markers may reflect limited or reversible brain injury, encouraging intensivists to continue aggressive life support. A recent systematic review[9] highlighted that localization motor response to pain immediately or at 72–96 h after CA, normal blood levels of NSE (i.e., < 17 µg/L) between 24 and 72 h, N20 amplitude > 3 or 4 μV on SSEP, normal or near-normal brain MRI between days 2 and 7 and continuous EEG background without discharges within 72 h could be interesting markers of a favorable neurological outcome. Regarding EEG, a major point remains the timing of assessment, as EEG patterns can evolve over time. Early EEG (i.e., performed between 12 and 24 h after CA) may have a high prognostic value for predicting both poor and good outcomes [13, 33, 34]. However, most clinical studies [10–12] have examined these prognostic markers on separate populations. Furthermore, data are lacking regarding the optimal threshold to use for NSE levels [10, 12, 14]. Finally, the prognostic value of NSE kinetics over time to predict a good outcome remains debated [15].
Overall, it appears established that the prediction of a favorable outcome in comatose patients after CA could reduce uncertainty and legitimize the maintain of therapeutic intensity, but the performance of the indicators should be better studied. We aimed to evaluate the prognostic values of low NSE levels and decreasing trend of NSE over time to predict a favorable outcome. We also aimed to assess the prognostic performance of normal or near-normal EEG and high N20 amplitude on SSEP to predict a favorable outcome in comatose patients after CA.
Materials and methods
Patients
We performed a retrospective analysis of prospectively collected data from our CA registry (PROCAT and AfterROSC registries) that have been previously described [8, 16]. We screened all consecutive patients resuscitated after in- or out-hospital CA, admitted in our medical ICU (Cochin hospital, Paris, France) between February 2017 and April 2024. Adult patients were included if they were comatose (i.e., Glasgow Coma Scale–GCS < 8) after discontinuation of sedation, with at least one EEG and NSE measurement at 24, 48 and/or 72 h after the CA performed for neuroprognostication. CA of presumed traumatic origin, early death and/or early awakening (i.e., within 24 h of admission) and brain death were exclusion criteria.
Data collection
This observational study followed the STROBE guidelines [17]. The following variables were collected and analysed: baseline characteristics (age, sex, comorbidities), cardiac arrest and resuscitation data according to Utstein style [18] (CA location, presence of witness, no flow and low flow duration, time to ROSC, initial cardiac rhythm, adrenaline administration during cardio-pulmonary resuscitation, arterial pH, lactate and SOFA score at admission, cause of CA) and characteristics of the ICU stay (Richmond Agitation-Sedation Scale – RASS during EEG, length of stay and cerebral performance category—CPC at ICU discharge).
We also collected prognostic markers, including clinical parameters (GCS including motor response, early myoclonus), biological markers (i.e., NSE at 24 h, 48 h and 72 h), EEG and SSEPs. Patients’ relatives were informed that data were collected for clinical research purposes. The research protocol was approved by the ethics committees (2019-A01378-49, CPP-SMIV-190901; 2022-A01811 42; CPP-Ile-de-France-I) and the French data protection authorities, in accordance with the Declaration of Helsinki.
EEG, SSEP and NSE evaluation
Video-EEG was recorded in the ICU by an experienced technician using a Deltamed Coherence device (Natus®, Middelton, USA) or a Micromed Brain Quick device (Micromed® SAS, Treviso, Italy). Recordings with 19 electrodes placed according to the international 10–20 system with additional ground and reference electrodes, lasted 20 min. Repetitive auditive (calling out the patient’s first name and surname, hand clapping), tactile and nociceptive (bilateral leg and arm touch and pinching) stimulations were applied at least twice with a minimum of 10-s interval during the recording. If multiple EEGs were performed, we evaluated the first EEG recorded during the ICU stay. The EEG raw-data recording was analyzed a second time for this study by two experienced neurologists (EPR, SB), blinded to other prognostic markers and to the patient’s outcome. Standardized terminology from the 2021 American Clinical Neurophysiology Society (ACNS) [19] was used to describe the background activity as: normal voltage (amplitude > 20 µV), low voltage (amplitude between 10 and 20 µV), discontinuous (amplitude < 10 µV during 10–49% of the EEG recording), burst suppression (< 10 µV during > 50% and < 99%, with identical or non-identical bursts) or suppression background (< 10 µV all the time). We also assessed background reactivity, and the presence of additional features such as rhythmic or periodic patterns (RPPs), seizures and status epilepticus (SE). Each recording was then classified according to Westhall et al. [20] into one of the mutually exclusive categories, namely highly malignant (suppressed or burst-suppression background, with or without superimposed periodic patterns), malignant (presence of at least one of the following: abundant generalized rhythmic or periodic discharges—RPPs, seizures or SE, discontinuous or low-voltage background, absence of reactivity, reversal of the antero-posterior gradient) or benign (absence of malignant and highly malignant features) [21].
NSE was measured in serum samples. After collection in gel separator tubes, whole blood samples were centrifuged within 4 h. Serum was stored at + 4 − 8 °C for analysis within 6 h. For delayed analysis (within 48–72 h), serum was stored at − 40 °C. The NSE immunoassay was performed on Cobas® analyzer (Roche Diagnostics, Meylan, France) using the commercial sandwich immunochemiluminescent Elecsys NSE assay (Roche Diagnostics, Meylan, France). The measuring range of NSE assay is 0.22–300 μg/L. Values above 300 μg/L were diluted manually 1:2 with the Diluent NSE, as recommended. The 95th percentile value is 16.3 μg/L (manufacturer’s data). In our laboratory, the within‐run and between‐run imprecision were < 1.0% and < 6.0%, respectively, for concentrations of approximatively 12 and 100 µg/L. Because of overestimation of NSE, hemolyzed samples were not considered. NSE was measured at 24, 48 and 72 h. Kinetics was defined as ascending when the level of NSE at 72 h was higher than that at 24 h or 48 h; descending trend was defined if the NSE level at 72 h was lower than that levels at 24 h or 48 h after CA.
Recording of SSEP was performed in the ICU by an experienced technician. The median nerve was electrically stimulated using a Micromed Brain Quick device (Micromed® SAS, Treviso, Italy) and the ascending signals were recorded from the peripheral plexus brachialis, cervical level, subcortical level and the somato-sensory cortex (N20). The averaging of at least three blocks of 300 stimuli was analyzed. Reproducibility of at least two blocks was required to interpret peripheral or cortical responses. Before evaluating cortical N20 responses, the recording of reproductible peripheral (N9) and spinal (N13) responses was required. Digitalized SSEPs were analyzed by an experienced electrophysiologist blinded to patient outcome. The N20 was identified as the major negative peak (C’3-C’4 montage) of consistent latency, while P25 was identified as the major positive peak following the N20. We assessed SSEP amplitudes only in the case of unilateral or bilateral responses. We defined N20-baseline amplitude as the largest difference between N20 peak and the baseline, and N20-P25 amplitude as the largest amplitude between N20 and P25 peak to peak. Amplitude calculation was automated by the analysis software use. In the case of asymmetry between right and left N20, we retained the highest amplitude value.
ICU management
Management of post-CA patients is standardized and includes targeted temperature management (TTM) at 33 °C (from 2017 to 2021) or 36 °C (from 2021 to 2022) using a surface cooling device [22, 23], according to European guidelines [24]. TTM was initiated as soon as possible after admission and continued for 24 h in all patients who remained comatose after ROSC. The sedation protocol used a short-acting drugs (propofol and remifentanil) with protocolized adaptation according to the RASS (Supplementry file1: ESM1) [25–27]. Sedation was discontinued after rewarming. Management also included multi-day assessment of consciousness using the RASS, and prevention of cerebral aggression of systemic origin. Awakening was defined by 3 consecutive RASS scores ≥ -2 with a reproducible response to command.
Neurological prognostication process and decisions to withdraw life-sustaining therapies
In the case of persistent coma 72 h after CA not explained by confounding factors, a multimodal prognostication protocol based on the 2015 and 2021 ERC-ESICM recommendations was used [4]. Before 2021, a poor neurological outcome was considered if patients had a Glasgow motor score of 1 or 2 and at least one of the following: no pupillary and corneal reflexes, bilaterally absent N20 SSEP, refractory SE or suppression/burst-suppression EEG patterns [28]. After 2021, a poor neurological outcome was considered when at least two of the following conditions were observed: no pupillary and corneal reflexes after 72 h, bilaterally absent N20 SSEP, highly malignant EEG > 24 h, status myoclonus ≤ 72 h, diffuse and extensive anoxic injury on brain CT/MRI, NSE > 60 µg/l at 48 h and/or 72 h [4] (Supplementry file1: ESM2).
Outcome
The primary endpoint was neurological recovery at 3 months according to the Cerebral Performance Categories (CPC) scale. CPC is a 5-point scale of global disability ranging from 0 (no symptoms) to 5 (death) (Supplementry file1: ESM3). The CPC level was assessed by an independent trained researcher and assessed by telephone interview with the patient or their next of kin. If the information could not be obtained by telephone interview, we collected the neurological result from the medical records. A favorable neurological outcome was defined by a CPC level 1 or 2 (no, mild or moderate disability).
Statistical analysis
Categorical variables are expressed as numbers and percentages. Quantitative variables were expressed as mean ± standard deviations or median and interquartile range. The association between demographic variables, prognostication markers and neurological outcome were tested using Chi-square and Fisher’s tests for categorical variables, and Student’s t-test and Wilcoxon tests for quantitative variables, as appropriate. We performed a sensitivity analysis after exclusion of patients who died from a non-neurological cause. The performance of the outcome predictors was assessed by their sensitivity, specificity, positive predictive value (PPV) and negative predictive value (NPV) using an exact binomial 95% confidence interval (CI). We a priori defined two NSE levels for predicting of good outcome: an NSE level < 17 μg/L at 24, 48 or 72 h as suggested by Sandroni et al. [9], and an NSE < 41 µg/L at 48 h as suggested by Vanat et al. [12]. To define the best NSE threshold in our study, we performed a receiver operating characteristic (ROC) curve analysis, considering the point where the difference between the true positive rate (i.e., sensitivity) and the false positive rate (i.e., 1-specificity) is maximized, using the Youden index. Regarding kinetics of NSE, we assessed the prognostic value of a decreasing trend between 24 and 72 h and between 48 and 72 h. For SSEP amplitude analysis, we used 3 µV as a cut-off value, as reported in a previous study [29]. All statistical analyses were performed using IBM SPSS version 22 software.
Results
Demographic characteristics
From January 2017 to April 2024, 786 patients who underwent CA and who were admitted in our ICU were screened for participation. Among them, we included 215 patients who remained comatose after discontinuation of sedation with at least one NSE level at 24, 48 and/or 72 h and an EEG performed for neuroprognostication (see Flowchart (Supplementry file1: ESM4)). Comparison between the 215 included patients and those who were screened for eligibility but did not meet the inclusion criteria is provided as (Supplementry file1: ESM5). Non-included patients had a lower time to ROSC (median 20 min IQR [12; 28] vs median 25 min IQR [18; 32], p = 0.002), a higher frequency of cardiac causes of CA (51 vs 29%, p < 0.001), a lower rate of respiratory failure cause of CA (21 vs 38%, p < 0.001) and a lower ICU mortality rate (41% vs 71%, p < 0.001). No significant differences were observed in other baseline characteristics.
The median age was 63 (IQR, 52–73) years and 157 patients (73.0%) were male. CA occurred out of hospital in 175/215 patients (81.4%), in the presence of a witness for 172/215 patients (80.0%) and an initial shockable rhythm in 103/215 patients (47.9%). Adrenaline was used in 173/215 patients (80.5%) and the median time to ROSC was 25 (IQR, 18–32) minutes. Main causes for CA were hypoxic (n = 81, 37.7%), ischemic cardiac injury (n = 63, 29.3%) and neurological (n = 5, 2.3%). During the ICU stay, 154 out of 215 patients (71.6%) died. At 3 months, 54/215 patients (25.1%) achieved a good neurological outcome, including 32 patients with a CPC 1 and 22 patients with a CPC 2 (Table 1).
Table 1.
Patients’ characteristics according to neurological outcome at 3 months
| Overall n = 215 | CPC 1–2 n = 54 | CPC 3–5 n = 161 | p | |
|---|---|---|---|---|
| Demographic | ||||
| Sex (n, %) | 0.84 | |||
| Female | 58 (27.0%) | 14 (25.9%) | 44 (27.3%) | |
| Male | 157 (73.0%) | 40 (74.1%) | 117 (72.7%) | |
| Age, years | 63 [52–73] | 57 [47–66] | 66 [54–75] | < 10–3 |
| Cardiac arrest | ||||
| CA location (n, %) | 0.43 | |||
| Out-of-hospital | 175 (81.4%) | 42 (77.8%) | 133 (82.6%) | |
| In-hospital | 40 (18.6%) | 12 (22.2%) | 28 (17.4%) | |
| Presence of witness (n, %) | 172 (80.0%) | 49 (90.7%) | 123 (76.4%) | 0.02 |
| Initial cardiac rhythm (n, %) | < 10–3 | |||
| Shockable | 103 (47.9%) | 40 (74.1%) | 63 (39.1%) | |
| Non shockable | 112 (52.1%) | 14 (25.9%) | 98 (60.9%) | |
| CPR duration (min) | ||||
| No flow | 2 [0–5] | 1 [0–5] | 3 [0–5] | 0.08 |
| Low flow | 20 [15–27] | 15 [9–22] | 23 [4, 17–28] | < 10–3 |
| Time to ROSC | 25 [4, 4, 18–30] | 18 [11–25] | 25 [4, 4, 20–33] | < 10–3 |
| Adrenaline during CPR (n, %) | 173 (80.5%) | 31 (57.4%) | 142 (88.2%) | < 10–3 |
| In-hospital data | ||||
| Arterial pH at admission | 7.22 [7.13–7.32] | 7.23 [7.17–7.32] | 7.21 [7.11–7.31] | 0.25 |
| Lactate (mmol/L) at admission | 4.2 [2.5–7.2] | 2.8 [1.9–4.4] | 5.0 [3.1–8.2] | 0.44 |
| SOFA score at admission | 12 [9–14] | 11 [8–14] | 12 [9–14] | 0.37 |
| Cause of CA (n, %) | ||||
| Coronary disease | 63 (29.3%) | 23 (42.6%) | 40 (28.8%) | 0.03 |
| Hypoxic | 81 (37.7%) | 7 (13.0%) | 74 (46.0%) | < 10–3 |
| Neurologic | 5 (2.3%) | 2 (3.7%) | 3 (1.9%) | 0.44 |
| Other | 55 (25.6%) | 19 (35.2%) | 36 (22.4%) | 0.06 |
| Unknown | 11 (5.1%) | 3 (5.6%) | 8 (5.0%) | 0.72 |
Continuous variables are expressed as median [interquartile range 25–75]; categorical variables are expressed as n (%). Abbreviations: CA Cardiac arrest; CPC cerebral performance category; CPR cardiopulmonary resuscitation; ICU intensive care unit; ROSC return of spontaneous circulation; SOFA sequential organ failure assessment
Compared to patients with a poor outcome, those with a good outcome were significantly younger (median age 57 [47–66] vs 66 [54–75] years, p < 0.001), had more frequently an initial shockable rhythm (40/54 (74.1%) vs 63/161 (39.1%), p < 0.001), presented a shorter time to ROSC (18 [11-25] versus 25 [20-35] minutes, p<0.001) and have received less often adrenaline during resuscitation (31/54 (57.4%) vs 142/161 (88.2%), p < 0.001). Regarding the etiology of CA, ischemic cardiac injury was also more common in patients with good outcome (23/54 (42.6%) vs 40/161 (28.8%), p = 0.026) whereas hypoxic cause was more common in poor outcome group (74/161 (46.0%) vs 7/54 (13.0%), p < 0.001). Other baseline characteristics were not significantly different between groups (Table 1).
Prognostic markers according to neurological outcome at 3 months
NSE
The median blood levels of NSE were 46 [IQR, 33-72], 66 [IQR, 33-100] and 81 [IQR, 29-300] µg/L at 24, 48 and 72 h after CA, respectively (Table 2). These results did not change when excluding the 16 out of 215 patients (7.4%) who died from non-neurological cause (Supplementry file1: ESM6). An increasing trend between 24 and 72 h was observed in 139/215 patients (64.7%), whereas an increasing trend between 48 and 72 h was observed in only 85/215 patients (39.5%). Conversely, a decreasing trend between 24 and 72 h was observed in 65/215 patients (30.2%), and between 48 and 72 h in 70/215 patients (32.6%) (Table 2).
Table 2.
Prognostication markers according to neurological outcome at 3 months
| Overall n = 215 | CPC 1–2 n = 54 | CPC 3–5 n = 161 | p | |
|---|---|---|---|---|
| NSE (µg/L) | ||||
| At 24 h (missing = 19) | 46 [33–72] | 39 [4, 4, 27–42] | 54 [37–82] | < 10–3 |
| At 48 h (missing = 25) | 66 [33–188] | 26 [4, 4, 18–40] | 107 [54–227] | < 10–3 |
| At 72 h (missing = 45) | 81 [29–300] | 20 [4, 4, 15–28] | 184 [60–300] | < 10–3 |
| Kinetics (missing = 11) | ||||
| Increasing (72 h > 24 h) | 139 (64.7%) | 9 (16.7%) | 130 (80.7%) | < 10–3 |
| Decreasing (72 h < 24 h) | 65 (30.2%) | 41 (75.9%) | 24 (14.9%) | < 10–3 |
| Increasing (72 h > 48 h) | 85 (39.5%) | 9 (16.7%) | 76 (47.2%) | < 10–3 |
| Decreasing (72 h < 48 h) | 70 (32.6%) | 30 (55.6%) | 40 (24.8%) | < 10–3 |
| EEG | ||||
| Median delay CA—EEG (days) | 2 [1–3] | 2 [1–3] | 2 [1–3] | 0.82 |
| RASS during recording | − 5 [− 5; − 4] | − 5 [− 5; − 4] | − 5 [− 5; − 4] | 0.007 |
| ACNS/Westhall classification (n, %) | < 10–3 | |||
| Benign | 71 (33.0%) | 47 (87.1%) | 24 (14.9%) | < 10–3 |
| Malignant | 80 (37.2%) | 7 (13.0%) | 73 (45.3%) | < 10–3 |
| Highly malignant | 64 (29.8%) | 0 (0%) | 64 (39.8%) | < 10–3 |
| Background continuity (n, %) | ||||
| Continuous or nearly continuous | 140 (65.1%) | 51 (94.4%) | 89 (55.3%) | < 10–3 |
| Discontinuous | 74 (34.4%) | 3 (5.6%) | 71 (44.1%) | < 10–3 |
| Burst suppression | 30 (14.0%) | 0 (0%) | 30 (18.6%) | < 10–3 |
| Suppressed | 61 (28.4%) | 1 (1.9%) | 60 (37.3%) | < 10–3 |
| Voltage (n, %) | < 10–3 | |||
| Normal (> 20 µV) | 108 (50.2%) | 51 (94.4%) | 57 (35.4%) | < 10–3 |
| Low (10 – 20 µV) | 45 (20.9%) | 2 (3.7%) | 43 (26.7%) | < 10–3 |
| Reactivity (n, %) | ||||
| Present | 104 (48.4%) | 54 (100.0%) | 50 (31.1%) | < 10–3 |
| Absent | 101 (47.0%) | 3 (5.6%) | 98 (60.9%) | < 10–3 |
| Superimposed features (n, %) | ||||
| Seizures or status epilepticus | 17 (7.9%) | 2 (3.7%) | 15 (9.3%) | 0.18 |
| Generalized and abundant rhythmic or periodic discharges | 49 (22.8%) | 1 (1.9%) | 48 (29.8%) | 0.001 |
| N20 SSEPs (n = 131) | ||||
| Bilateral absence of N20 (n, %) | 56/131 (42.7%) | 0/19 (0%) | 56/112 (50.0%) | < 10–3 |
| Unilateral presence of N20 (n, %) | 12/131 (9.2%) | 1/19 (5.3%) | 11/112 (9.8%) | 0.54 |
| Bilateral presence of N20 (n, %) | 63/131 (48.1%) | 18/19 (94.7%) | 45/112 (40.2%) | < 10–3 |
| N20-baseline amplitude (µV) | 1.4 [0.4–1.3] | 1.5 [1.2–2.2] | 1.1 [0.6–2.0] | 0.210 |
| N20-P25 amplitude (µV) | 1.7 [1.0–3.6] | 2.9 [1.6–4.2] | 1.1 [0.6–2.4] | 0.120 |
| Early myoclonus (n, %) | 90 (41.9%) | 10 (18.5%) | 80 (49.7%) | < 10–3 |
Abbreviations: CPC cerebral performance category; EEG electroencephalogram; NSE neuron-specific enolase; RASS richmond agitation and sedation scale; SSEP: somato-sensory evoked potentials
Compared with poor outcome, the median blood levels were significantly lower in the good outcome group at 24 h (39 [27–45] vs 54 [37–82] µg/L, p<0.001), 48 hours (26 [18–43] vs 107 [54–227] µg/L, p<0.001) and 72 hours (20 [15–30] vs 184 [60–300] µg/L, p<0.001). The highest NSE level measured in the good outcome group was 63 µg/L at 48 h and 64 µg/L at 72 h, in a patient who presented a CPC 3 at ICU discharge, which improved to a CPC 2 at 3 months.
NSE kinetics were also significantly different between the two groups. Compared with the poor outcome group, a decreasing trend was more frequently observed in case of good outcome: a decreasing NSE between 24 and 72 h was observed in 41/54 patients (75.9%) vs 24/161 patients (14.9%, p < 0.001), respectively; a decreasing NSE between 48 and 72 h was observed in 30/54 (55.6%) vs 40/161 patients (24.8%, p < 0.001), respectively.
EEG
The first EEG recording was performed after a median time of 2 days (IQR, 1–3), with no difference between groups. The median RASS during EEG recording was − 5 [− 5; − 4] (Table 2).
EEG was benign in 71/215 patients (33.0%), malignant in 80/215 patients (37.2%) and highly malignant in 64/215 patients (29.8%). Regarding EEG continuity, the EEG background was continuous or nearly continuous in 140/215 patients (65.1%), discontinuous in 74/215 patients (34.4%) and showed burst suppression in 30/215 (14.0%) of cases. Regarding the voltage background, a normal voltage (> 20 µV) was observed in 108/215 patients (50.2%), a low voltage (10–20 µV) in 45/215 patients (20.9%) and a suppressed background (< 10 µV) in 61/215 (28.4%) of cases. The EEG background was reactive in 104/215 patients (48.4%) and unreactive in 101/215 patients (47.0%). Finally, 17/215 patients (7.9%) presented seizures or SE, although abundant and generalized rhythmic/periodic discharges were reported in 49/215 EEGs (22.8%).
A benign EEG was more frequently observed in patients with good outcome (47/54 (87.1%) vs 24/161 (14.9%) in good and poor outcome respectively, p < 0.001). No patient with a highly malignant pattern reached a good outcome. The EEG background was more frequently continuous or nearly continuous in the good outcome group (51/54 (94.4%) patients vs 89/161 (55.3%), p < 0.001), as was the normal voltage background (51/54 (94.4%) vs 57/161 (35.4%), p < 0.001). EEG was reactive in all patients with a good outcome and only in 50/161 patients (30.1%) with a poor outcome (p < 0.001). Finally, rhythmic or periodic discharges were relatively rare in good outcome patients (1/54 patients (1.9%) vs 48/161 patients (29.8%), p = 0.001), whereas seizures did not differ significantly between groups (3.7% vs 9.3%, p = 0.184).
SSEPs
SSEPs were recorded in 131 patients. Bilateral N20 abolition was observed in 42.7%, and unilateral N20 abolition in 9.2%. When N20 were preserved unilaterally or bilaterally, we also assessed the N20-baseline and the N20-P25 amplitudes, which were at 1.4 [IQR, 0.4–1.3] and 1.7 [1.0–3.6] µV, respectively (Table 2). Bilateral presence of N20 was observed in 18/19 (94.7%) patients with a good outcome and in 45/112 (47.7%) patients with a poor outcome (p < 0.001). Conversely, bilateral N20 abolition was never observed in case of good outcome. The median amplitude of N20-baseline and N20-P25 were not significantly different between the two groups (p = 0.21 and p = 0.12, respectively).
Individual performances for prediction of favorable outcome
Figure 1 shows the ROC-AUC of NSE at 24, 48 and 72 h after ROSC, and Table 3 describes the individual prognostic performance (i.e. PPV, NPV, specificity and sensitivity) of each indicator.
Fig. 1.
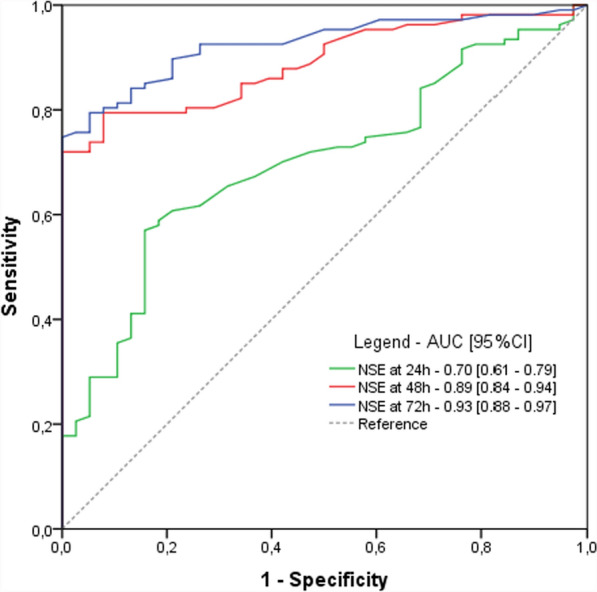
Prognosis performances of blood NSE at 24, 48 and 72 h after cardiac arrest. Abbreviations: AUC area under the curve; CI confidence interval; h hours; NSE neuron specific enolase
Table 3.
Comparison of prognostic performances for prediction of favorable outcome
| TP | TN | FP | FN | Sensitivity | Specificity | PPV | NPV | |
|---|---|---|---|---|---|---|---|---|
| NSE | ||||||||
| At 24 h | ||||||||
| best threshold* NSE < 45.5 µg/L | 76.5 | 62.8 | 37.2 | 23.5 | 0.74 [0.65–0.83] | 0.63 [0.53–0.72] | 0.64 [0.55–0.73] | 0.73 [0.63–0.82] |
| NSE < 17 µg/L | 8.5 | 96.6 | 3.4 | 91.5 | 0.09 [0.04–0.16] | 0.97 [0.91–0.99] | 0.71 [0.43–0.89] | 0.51 [0.44–0.58] |
| NSE < 41 µg/L | 59.6 | 71.8 | 28.2 | 40.4 | 0.59 [0.50–0.69] | 0.72 [0.62–0.80] | 0.68 [0.58–0.77] | 0.64 [0.55–0.72] |
| At 48 h | ||||||||
| best threshold* NSE < 51.5 µg/L | 93.3 | 77.1 | 22.9 | 6.7 | 0.93 [0.88–0.98] | 0.77 [0.69–0.85] | 0.80 [0.73–0.87] | 0.92 [0.86–0.98] |
| NSE < 17 µg/L | 20.4 | 96.9 | 3.1 | 79.6 | 0.20 [0.12—0.28] | 0.97 [0.93–1.00] | 0.87 [0.73–1.00] | 0.55 [0.48–0.62] |
| NSE < 41 µg/L | 73.3 | 80.6 | 19.4 | 26.7 | 0.73 [0.64–0.82] | 0.81 [0.73–0.88] | 0.79 [0.71–0.87] | 0.75 [0.67–0.83] |
| At 72 h | ||||||||
| best threshold* NSE < 41.5 µg/L | 89.7 | 81.7 | 18.3 | 10.3 | 0.90 [0.82–0.94] | 0.82 [0.73–0.88] | 0.83 [0.75–0.88] | 0.89 [0.81–0.94] |
| NSE < 17 µg/L | 29.6 | 97.5 | 2.5 | 70.4 | 0.30 [0.21–0.39] | 0.97 [0.94–1.00] | 0.92 [0.83–1.00] | 0.58 [0.51–0.65] |
| NSE < 41 µg/L | 68.5 | 86.3 | 13.7 | 31.5 | 0.68 [0.59–0.78] | 0.86 [0.80–0.93] | 0.83 [0.75–0.91] | 0.73 [0.65–0.81] |
| NSE kinetics | ||||||||
| Decreasing trend between 24 and 72 h | 80.9 | 82.8 | 17.2 | 19.1 | 0.81 [0.72–0.87] | 0.83 [0.74–0.89] | 0.82 [0.74–0.89] | 0.81 [0.73–0.88] |
| Decreasing trend between 48 and 72 h | 70.0 | 66.7 | 33.3 | 30.0 | 0.70 [0.61–0.79] | 0.67 [0.57–0.76] | 0.68 [0.59–0.77] | 0.69 [0.60–0.78] |
| EEG | ||||||||
| Continuous | 94.4 | 44.4 | 55.6 | 5.6 | 0.94 [0.89–0.99] | 0.43 [0.34–0.53] | 0.63 [0.55–0.70] | 0.88 [0.79–0.97] |
| Reactive | 94.0 | 61.0 | 39.0 | 6.0 | 0.94 [0.89–0.99] | 0.64 [0.54–0.73] | 0.72 [0.64–0.80] | 0.91 [0.85–0.98] |
| Normal voltage | 70.0 | 55.8 | 44.2 | 30.0 | 0.70 [0.61–0.79] | 0.56 [0.46–0.66] | 0.61 [0.52–0.70] | 0.65 [0.55–0.75] |
| Benign pattern | 94.0 | 62.8 | 37.2 | 6.0 | 0.94 [0.89–0.99] | 0.63 [0.53–0.72] | 0.72 [0.64–0.79] | 0.91 [0.85–0.98] |
| N20 SSEP | ||||||||
| Bilateral N20 presence | 94.4 | 59.6 | 40.4 | 5.6 | 0.94 [0.89–0.99] | 0.60 [0.50–0.69] | 0.70 [0.62–0.78] | 0.91 [0.85–0.98] |
| N20-baseline amplitude > 3 µV | 2.0 | 46.7 | 0.6 | 32.0 | 0.06 [0.02–0.19] | 0.99 [0.90–1.00] | 0.77 [0.25–0.97] | 0.59 [0.48–0.70] |
| Best threshold* for N20-baseline amplitude ≥ 0.85 µV | 100 | 66.3 | 33.7 | 0.0 | 1.00 [1.00–1.00] | 0.66 [0.57–0.76] | 0.75 [0.67–0.82] | 1.00 [1.00–1.00] |
| Early myoclonus | ||||||||
| Absence of early myoclonus | 81.8 | 50.0 | 50.0 | 18.2 | 0.81 [0.74–0.89] | 0.50 [0.40–0.60] | 0.62 [0.54–0.70] | 0.73 [0.62–0.83] |
*Best thresholds are defined according to Youden’s index, defined as the breakpoint providing both the best sensitivity and specificity. Variables are expressed with their 95% confidence interval. Abbreviations: FN false negative; FP false positive; NPV negative predictive value; PPV positive predictive value; TP true positive; TN true negative; EEG Electroencephalogram; NSE Neuron Specific Enolase; SSEP: somato-sensory evoked potentials
NSE predicted good outcome with an AUC of 0.70 (95%CI, 0.610.79), 0.89 (95%CI, 0.84-0.94), 0.93 (95%CI, 0.88-0.97) at 24, 48 and 72 h, respectively.
At 24 h, an NSE < 17 μg/L predicted good outcome with a PPV of 71% (95%CI, 43–89%) and a sensitivity of 9% (95% CI, 4–16%). An NSE < 41 μg/L showed a PPV of 68% (95%CI, 58–77%) and a sensitivity of 59% (95%CI, 50–69%). According to Youden index, the best threshold for NSE level at 24 h was 45.5 µg/L, giving a PPV of 64% (95%CI, 55–73%) and a sensitivity of 74% (95% CI, 65–83%). At 48 h, an NSE < 17 μg/L predicted a good outcome with a PPV of 87% (95%CI, 73–100%) and a sensitivity of 20% (95% CI, 12–28%). An NSE < 41 μg/L showed a PPV of 79% (95% CI, 71–87%) and a sensitivity of 73% (95% CI, 64–82%). The best threshold for NSE level at 48 h according to the Youden index was 51.5 µg/L, which gave a PPV of 80% (95% CI, 73–87%) and a sensitivity of 93% (95% CI, 88–98%). At 72 h, an NSE < 17 μg/L predicted good outcome with a PPV of 92% (95% CI, 83–100%) and a sensitivity of 30% (95% CI, 21–39%). An NSE < 41 μg/L showed a PPV of 83% (75–91%) and a sensitivity of 68% (95% CI, 75–88%). The best threshold for NSE levels at 72 h according to the Youden index was 41.5 µg/L, giving a PPV of 83% (95%CI, 75–88%) and a sensitivity of 90% (95% CI, 82–94%). A decreasing NSE level between 24 and 72 h predicted a good outcome with a PPV of 82% (95% CI, 74–89%) and a sensitivity of 81% (95% CI, 72–87%). A decreasing level between 48 and 72 h predicted a good outcome with a PPV of 68% (95% CI, 59–77%) and sensitivity of 70% (95% CI, 61–79%).
Regarding EEG, a benign pattern predicted a good outcome with a PPV of 72% (95% CI, 54–73%) and a sensitivity of 94% (95% CI, 89–99%). The prognostic performance of other EEG patterns are indicated in the Table 3. Regarding N20 amplitude, an N20-baseline > 3 µV was predictive of good outcome with a specificity of 99% (95% CI, 90–100%), a PPV of 77% (95% CI, 25–97%), despite a very low sensitivity of 6% (95% CI, 2–19%). According to Youden index, the best threshold for N20-baseline amplitude was 0.85 μV, providing a sensitivity of 100% (95% CI, 100–100%) and a PPV of 75% (95% CI, 67–82%)(Table 3).
Performances of combinations markers for prediction of favorable outcome
Finally, we assessed the performance of several combinations (Table 4). A multimodal approach combining a benign EEG and low levels of NSE at 48 h (NSE < 51.5 µg/L) or 72 h (NSE < 41.5 µg/L) increased the PPV to 92% (95%CI, 86–96%) and 85% (73–93%), with a sensitivity of 79% (95%CI, 72–85%) and 29% (95%CI, 23–38%) respectively. Combining a benign EEG, an NSE < 51.5 µg/L at 48 h, and a N20-baseline ≥ 0.85 µV increased the PPV to 98% (95%CI,88–100%), despite a low sensitivity of 38% (95%CI,29–48%). The multimodal approach combining a benign EEG, a NSE < 51.5 µg/L at 48 h, and a decreasing NSE trend between 24 and 72 h showed the best prognostic performance, reaching a PPV of 96% (95%CI,93–98%) and a sensitivity of 76% (95%CI,70–82%).
Table 4.
Prognostic performances of markers combination for favorable outcome
| TP | TN | FP | FN | Sensitivity | Specificity | PPV | NPV | |
|---|---|---|---|---|---|---|---|---|
| Low NSE + benign EEG | ||||||||
| NSE < 51.5 µg/l at 48 h + benign EEG | 79.2 | 93.6 | 6.4 | 20.8 | 0.79 [0.72–0.85] | 0.94 [0.88–0.97] | 0.92 [0.86–0.96] | 0.82 [0.75–0.87] |
| NSE < 41.5 µg/L at 72 h + benign EEG | 29.5 | 94.9 | 5.1 | 70.5 | 0.29 [0.23–0.38] | 0.95 [0.90–0.98] | 0.85 [0.73–0.93] | 0.57 [0.51–0.63] |
| Low NSE + benign EEG + decreasing NSE trend | ||||||||
| NSE < 51.5 µg/l at 48 h + benign EEG + decreasing NSE trend between 24–72 h | 76.1 | 96.5 | 3.5 | 23.9 | 0.76 [0.70–0.82] | 0.97 [0.94–0.99] | 0.96 [0.93–0.98] | 0.80 [0.75–0.86] |
| Low NSE + benign EEG + N20 SSEPs | ||||||||
| NSE < 51.5 µg/l at 48 h + benign EEG + bilaterally presence of N20 | 47.6 | 98.0 | 2.0 | 42.4 | 0.48 [0.42–0.56] | 0.98 [0.93–0.99] | 0.96 [0.86–0.99] | 0.70 [0.62–0.77] |
| NSE < 51.5 µg/l at 48 h + benign EEG + N20-baseline amplitude > 3 µV | 5.0 | 99.3 | 0.7 | 95.0 | 0.05 [0.01–0.10] | 0.99 [0.97–1.00] | 0.88 [0.62–1.00] | 0.51 [0.44–0.58] |
| NSE < 51.5 µg/l at 48 h + benign EEG + N20-baseline amplitude ≥ 0.85 µV | 38.1 | 99.3 | 0.7 | 61.9 | 0.38 [0.29–0.48] | 0.99 [0.95–1.00] | 0.98 [0.88–1.00] | 0.62 [0.54–0.69] |
Variables are expressed with their 95% confidence interval. Abbreviations: FN false negative; FP false positive; NPV negative predictive value; PPV positive predictive value; TP true positive; TN true negative; EEG electroencephalogram; NSE neuron specific enolase; SSEP somato-sensory evoked potentials
Effect of favorable prognostic markers assessment on prognostic uncertainty
Following the ERC-ECISM 2021 algorithm [4], 103/215 (47.9%) presented at least two markers of poor outcome. Thus, 112/215 (52.1%) of patients presented an indeterminate outcome. Among these 112 patients, 46 (41.1%) were classified as “good outcome likely”. Thus, using combination of poor and good outcome predictors, neurological outcome was predictable in 149/215 (69.3%) patients, narrowing uncertainty to 30.7%.
Regarding misclassification, 2 patients considered as « poor outcome likely» underwent a good neurological outcome at 3 months; these 2 patients had early myoclonus and an NSE level > 60 µg/L at 48 h and/or 72 h. Conversely, 7 patients with a poor outcome presented a benign EEG and a NSE level < 51.5 µg/L at 48 h.
Discussion
In this large cohort of comatose patients after CA, we assessed the ability of NSE (absolute levels and kinetics over time), EEG patterns and N20 amplitude on SSEPs to predict good outcome at 3 months. We highlighted that low levels of NSE (i.e., < 45.5 µg/L, 51.5 µg/L and 41.5 µg/L at 24, 48 and 72 h, respectively) and decreasing trends of NSE between 24, 48 and 72 h were highly predictive of good outcome. We also confirmed that benign EEG and N20-baseline amplitude > 0.85 µV on SSEP were predictive of favorable outcome. These early markers may reflect limited or reversible acute brain injury and should encourage intensivists to pursue aggressive life support.
Several neuronal and glial cell components can be measured in the serum after CA as markers of hypoxic ischemic brain injury (HIBI). Among these biomarkers, NSE is to date the only one recommended for predicting an unfavorable outcome, essentially because it is the one whose performance has been most widely studied [30]. While the best level of NSE at 48 and/or 72 h has been largely assessed to predict poor outcome [31], the best threshold to predict good outcome remains debated. Consistently with Sandroni et al. and Kim et al. results [9, 10], we found that an NSE < 17 µg/L at 24, 48 or 72 h was highly specific for a good outcome, despite a very low sensitivity, raising the question of the optimal cut-off. We also evaluated the threshold of NSE < 41 μg/L at 48 h, as described by Vanat et al. and found similar results [12]. Indeed, the optimal thresholds in our study were 45.5 µg/L, 51.5 µg/L and 41.5 µg/ L at 24, 48, and 72 h, permitting a good PPV with a high sensitivity. All together, these results indicate that the NSE level can be considered a good indicator of favorable prognosis when it remained below 45 µg/L at the three time points of interest. Interestingly, we also highlighted that descreasing kinetics of NSE between 24 and 72 h or 48 and 72 h were highly predictive of good outcome. In addition, the prognostic performance of a decreasing trend between 24 and 72 h seems to be higher than a decrease between 48 and 72 h. These results are in agreement with the study by Duez et al. [15], confirming that a decreasing trend over time could reflect limited neuronal injury. Indeed, NSE levels increase and peak at 48–72 h after CA in patients with poor prognosis and it is now clear that a steady increase in the level during the first 72 h is a marker of poor prognosis [15].
There is now converging evidence that EEG is also a good indicator of brain function in HIBI [32]. Our results suggest that a continuous, normal voltage, reactive background or benign EEG patterns recorded at a median time of 48 h after CA were all predictive of favorable outcome, with a PPV between 61 and 72%, and a sensitivity varying from 70 to 94%. Interestingly, a benign pattern and a reactive EEG presented the best prognostic performance, with a PPV of 72% and a sensitivity of 94%. Our results are consistent with other studies, showing that a continuous, normal voltage EEG background within 24 h after CA is a good predictor of favorable outcome [9]. In our practice, EEG is only considered in patients who remain comatose after the 24 h of TTM and after sedation weaning, in line with the ERC/ESICM guidelines [4]; However, EEG patterns change over time [33] and an earlier EEG (i.e., performed 12–24 h after CA) may have the highest prognostic value for predicting both good and poor outcome [34]. EEG reactivity is also recognized as a powerful prognostic marker in this population [35, 36]. Indeed, EEG reactivity reflects dynamic brain responses to external stimulation, which requires functional integrity of different neuro-anatomical structures, from the brainstem to the subcortical and cortical areas [37]. Finally, some other studies also highlighted that a benign EEG could be an interesting marker of favorable outcome [8, 35, 38].
We also highlighted that a high N20 amplitude is predictive of a good outcome, although the sensitivity remains low. There is currently no recommendation for systematic reporting of cortical amplitude rather than the binary response “absent vs present” of N20. Our results suggest that caution is needed regarding the use of N20 amplitude in routine practice, the underlying concept being that the amplitude of the N20 is inversely related to the severity of neurological injury [35, 36]. In a postmortem study that assessed prognostic markers in conjunction with the histopathological severity, it has been shown that HIBI severity increases as N20 amplitude decreases [39]. The present results are congruent with those from previous studies, although the best cut-off value remains heterogeneous, varying from 2 to 4 µV[9, 11, 29, 36, 41, 42]. These results should be interpreted with caution, as the lack of standardization in amplitude measures (i.e., N20-P25 or N20-baseline) may limit their use in routine applications [29].
Our study has several strengths. First, we used a large cohort of patients who were still comatose after sedation weaning, in line with current guidelines for neuroprognostication and the clinical relevance of this evaluation. Second, we assessed several markers of good outcome and compared their prognostic value, to identify the isolated marker or the combination with the highest prognostic value. In addition, we assessed the prognostic performance of the decreasing trend of NSE using two different definitions (i.e., 24 vs 72 h and 48 vs 72 h), which had never been done before. Third, the neurological outcome was assessed at 3 months permitting a long-term outcome assessment; neurological outcome was evaluated by an independent trained researcher blinded from neuroprognostication markers, using telephone interview in the majority of cases (51/61 survivors at 3 months). Finally, all EEG recordings were analyzed by two experienced neurologists, according to the ACNS terminology and blinded to the results of other prognostic markers and patients’ outcome.
The main limitation of our study remains its monocentric setting. Moreover, we performed a retrospective analysis of a prospective registry. Thus, our results should be confirmed in a large prospective multicenter study. Secondly, the physician in charge was not blinded to the results of EEG and NSE. Consequently, we cannot exclude that this may have affected patients’ management regarding WLST decisions and self-fulfilling prophecy, that remain a major bias in neuroprognostication studies. Thirdly, because of our privileged access to biomarkers and neurophysiological tools, the use of MRI for prognostication remains limited in our practice, and has not been included to this work [43]. Due to accessibility constraints in our center, SSEPs may have been preferentially performed in patients with prolonged coma; therefore, patients who had a favorable outcome were less likely to have had SSEP recording. Finally, we did not assess the correlation between EEG and other biomarkers of neuronal injury, such as neurofilament light chain (NFL) whose performances seems very interesting [44].
Conclusion
In comatose patients after cardiac arrest, a low level of NSE at 24, 48 or 72 h, a decreasing trend of NSE over time, a benign EEG and a high amplitude of N20 were markers of good neurological outcome. These markers could therefore reduce uncertainty, discourage early implementation of WLST and legitimize an escalation of therapeutic intensity if necessary.
Supplementary Information
Acknowledgements
None
Author contributions
AB, SB and AC designed the study. AB, JP collected the data. AB performed the analyses. EPR and SB reviewed EEG raw data. AB and SB wrote the manuscript. All authors have reviewed the manuscript.
Funding
None.
Availability of data and materials
Data could be available if request to corresponding author, to a reasonable extent.
Declarations
Ethics approval and consent to participate
The research protocol was approved by the ethical committees (2019-A01378-49, CPP-SMIV-190901; 2022-A01811 42; CPP-Ile-de-France-I) and the French data protection authorities, in accordance with the Declaration of Helsinki.
Consent for publication
Not applicable.
Competing interests
The authors declare no competing interests.
Footnotes
Publisher's Note
Springer Nature remains neutral with regard to jurisdictional claims in published maps and institutional affiliations.
References
- 1.Sandroni C, Cronberg T, Sekhon M. Brain injury after cardiac arrest: pathophysiology, treatment, and prognosis. Intensive Care Med. 2021;47(12):1393–414. [DOI] [PMC free article] [PubMed] [Google Scholar]
- 2.Cronberg T, Greer DM, Lilja G, Moulaert V, Swindell P, Rossetti AO. Brain injury after cardiac arrest: from prognostication of comatose patients to rehabilitation. Lancet Neurol. 2020;19(7):611–22. [DOI] [PubMed] [Google Scholar]
- 3.Perkins GD, Callaway CW, Haywood K, Neumar RW, Lilja G, Rowland MJ, et al. Brain injury after cardiac arrest. The Lancet. 2021;398(10307):1269–78. [DOI] [PubMed] [Google Scholar]
- 4.Nolan JP, Sandroni C, Böttiger BW, Cariou A, Cronberg T, Friberg H, et al. European resuscitation council and european society of intensive care medicine guidelines 2021: post-resuscitation care. Intensive Care Med. 2021;47(4):369–421. [DOI] [PMC free article] [PubMed] [Google Scholar]
- 5.Rajajee V, Muehlschlegel S, Wartenberg KE, Alexander SA, Busl KM, Chou SHY, et al. Guidelines for neuroprognostication in comatose adult survivors of cardiac arrest. Neurocrit Care. 2023;38(3):533–63. [DOI] [PMC free article] [PubMed] [Google Scholar]
- 6.Teixeira FJ, Ahmad B, Gibatova V, Ameli PA, Da Silva I, Carneiro T, Roth W, Ford JL, Selfe TK, Greer DM, Busl KM. Do neuroprognostic studies account for self-fulfilling prophecy bias in their methodology? The SPIN protocol for a systematic review. Crit Care Explor. 2023;5(7):e0943. [DOI] [PMC free article] [PubMed] [Google Scholar]
- 7.Bin Zahid A, Geocadin RG. Machine learning and self-fulfilling prophecies: primum non nocere. Resuscitation. 2023;183:109687. [DOI] [PubMed] [Google Scholar]
- 8.Bougouin W, Lascarrou JB, Chelly J, Benghanem S, Geri G, Maizel J, et al. Performance of the ERC/ESICM-recommendations for neuroprognostication after cardiac arrest: insights from a prospective multicenter cohort. Resuscitation. 2024;202:110362. [DOI] [PubMed] [Google Scholar]
- 9.Sandroni C, D’Arrigo S, Cacciola S, Hoedemaekers CWE, Westhall E, Kamps MJA, et al. Prediction of good neurological outcome in comatose survivors of cardiac arrest: a systematic review. Intensive Care Med. 2022;48(4):389–413. [DOI] [PMC free article] [PubMed] [Google Scholar]
- 10.Kim D, Kwon H, Kim SM, Kim JS, Kim YJ, Kim WY. Normal value of neuron-specific enolase for predicting good neurological outcomes in comatose out-of-hospital cardiac arrest survivors. PLoS ONE. 2024;19(6):e0305771. [DOI] [PMC free article] [PubMed] [Google Scholar]
- 11.Oh SH, Park KN, Choi SP, Oh JS, Kim HJ, Youn CS, et al. Beyond dichotomy: patterns and amplitudes of SSEPs and neurological outcomes after cardiac arrest. Crit Care. 2019;23(1):224. [DOI] [PMC free article] [PubMed] [Google Scholar]
- 12.Vanat A, Lee JW, Elkhider H, Novy J, Ben-Hamouda N, Oddo M, et al. Multimodal prediction of favorable outcome after cardiac arrest: a cohort study*. Crit Care Med. 2023;51(6):706–16. [DOI] [PMC free article] [PubMed] [Google Scholar]
- 13.Spalletti M, Carrai R, Scarpino M, Cossu C, Ammannati A, Ciapetti M, et al. Single electroencephalographic patterns as specific and time-dependent indicators of good and poor outcome after cardiac arrest. Clin Neurophysiol. 2016;127(7):2610–7. [DOI] [PubMed] [Google Scholar]
- 14.Moseby-Knappe M, Mattsson-Carlgren N, Stammet P, Backman S, Blennow K, Dankiewicz J, et al. Serum markers of brain injury can predict good neurological outcome after out-of-hospital cardiac arrest. Intensive Care Med. 2021;47(9):984–94. [DOI] [PMC free article] [PubMed] [Google Scholar]
- 15.Duez CHV, Grejs AM, Jeppesen AN, Schrøder AD, Søreide E, Nielsen JF, et al. Neuron-specific enolase and S-100b in prolonged targeted temperature management after cardiac arrest: a randomised study. Resuscitation. 2018;122:79–86. [DOI] [PubMed] [Google Scholar]
- 16.Dumas F, Cariou A, Manzo-Silberman S, Grimaldi D, Vivien B, Rosencher J, et al. Immediate percutaneous coronary intervention is associated with better survival after out-of-hospital cardiac arrest: insights from the PROCAT (Parisian Region Out of Hospital Cardiac Arrest) registry. Circ Cardiovasc Interv. 2010;3(3):200–7. [DOI] [PubMed] [Google Scholar]
- 17.Von Elm E, Altman DG, Egger M, Pocock SJ, Gøtzsche PC, Vandenbroucke JP. The strengthening the reporting of observational studies in epidemiology (STROBE) statement: guidelines for reporting observational studies. Lancet. 2007;370(9596):1453–7. [DOI] [PubMed] [Google Scholar]
- 18.Jacobs I, Nadkarni V, Bahr J, Berg RA, Billi JE, Bossaert L, et al. Cardiac arrest and cardiopulmonary resuscitation outcome reports: update and simplification of the Utstein templates for resuscitation registries. Resuscitation déc. 2004;63(3):233–49. [DOI] [PubMed] [Google Scholar]
- 19.Hirsch LJ, Fong MWK, Leitinger M, LaRoche SM, Beniczky S, Abend NS, et al. American clinical neurophysiology society’s standardized critical care EEG terminology: 2021 version. J Clin Neurophysiol. 2021;38(1):1–29. [DOI] [PMC free article] [PubMed] [Google Scholar]
- 20.Westhall E, Rosén I, Rossetti AO, Van Rootselaar AF, Kjaer TW, Horn J, et al. Electroencephalography (EEG) for neurological prognostication after cardiac arrest and targeted temperature management; rationale and study design. BMC Neurol déc. 2014;14(1):159. [DOI] [PMC free article] [PubMed] [Google Scholar]
- 21.Westhall E, Rossetti AO, van Rootselaar AF, Wesenberg Kjaer T, Horn J, Ullén S, Friberg H, Nielsen N, Rosén I, Åneman A, Erlinge D. Standardized EEG interpretation accurately predicts prognosis after cardiac arrest. Neurology. 2016;86(16):1482–90. [DOI] [PMC free article] [PubMed] [Google Scholar]
- 22.Nielsen N, Wetterslev J, Cronberg T, Erlinge D, Gasche Y, Hassager C, Horn J, Hovdenes J, Kjaergaard J, Kuiper M, Pellis T. Targeted temperature management at 33 °C versus 36 °C after cardiac arrest. New Engl J Med. 2013;369(23):2197–206. [DOI] [PubMed] [Google Scholar]
- 23.Dankiewicz J, Cronberg T, Lilja G, Jakobsen JC, Levin H, Ullén S, Rylander C, Wise MP, Oddo M, Cariou A, Bělohlávek J. Hypothermia versus normothermia after out-of-hospital cardiac arrest. New Engl J Med. 2021;384(24):2283–94. [DOI] [PubMed] [Google Scholar]
- 24.Sandroni C, Nolan JP, Andersen LW, Böttiger BW, Cariou A, Cronberg T, et al. ERC-ESICM guidelines on temperature control after cardiac arrest in adults. Intensive Care Med. 2022;48(3):261–9. [DOI] [PubMed] [Google Scholar]
- 25.Sessler CN, Gosnell MS, Grap MJ, Brophy GM, O’Neal PV, Keane KA, Tesoro EP, Elswick R. The richmond agitation-sedation scale: validity and reliability in adult intensive care unit patients. Am J Respir Crit Care Med. 2002;166(10):1338–44. [DOI] [PubMed] [Google Scholar]
- 26.Paul M, Bougouin W, Geri G, Dumas F, Champigneulle B, Legriel S, et al. Delayed awakening after cardiac arrest: prevalence and risk factors in the Parisian registry. Intensive Care Med. 2016;42(7):1128–36. [DOI] [PubMed] [Google Scholar]
- 27.Paul M, Bougouin W, Dumas F, Geri G, Champigneulle B, Guillemet L, et al. Comparison of two sedation regimens during targeted temperature management after cardiac arrest. Resuscitation. 2018;128:204–10. [DOI] [PubMed] [Google Scholar]
- 28.Nolan JP, Cariou A. Post-resuscitation care: ERC–ESICM guidelines 2015. Intensive Care Med. 2015;41:2204–6. [DOI] [PubMed] [Google Scholar]
- 29.Benghanem S, Nguyen LS, Gavaret M, Mira JP, Pène F, Charpentier J, et al. SSEP N20 and P25 amplitudes predict poor and good neurologic outcomes after cardiac arrest. Ann Intensive Care déc. 2022;12(1):25. [DOI] [PMC free article] [PubMed] [Google Scholar]
- 30.Mattsson N, Cullen NC, Andreasson U, Zetterberg H, Blennow K. Association between longitudinal plasma neurofilament light and neurodegeneration in patients with alzheimer disease. JAMA Neurol. 2019;76(7):791–9. [DOI] [PMC free article] [PubMed] [Google Scholar]
- 31.Sandroni C, D’Arrigo S, Cacciola S, Hoedemaekers CWE, Kamps MJA, Oddo M, et al. Prediction of poor neurological outcome in comatose survivors of cardiac arrest: a systematic review. Intensive Care Med. 2020;46(10):1803–51. [DOI] [PMC free article] [PubMed] [Google Scholar]
- 32.Sandroni C, Cronberg T, Hofmeijer J. EEG monitoring after cardiac arrest. Intensive Care Med. 2022;48(10):1439–42. [DOI] [PMC free article] [PubMed] [Google Scholar]
- 33.Sivaraju A, Gilmore EJ, Wira CR, Stevens A, Rampal N, Moeller JJ, et al. Prognostication of post-cardiac arrest coma: early clinical and electroencephalographic predictors of outcome. Intensive Care Med. 2015;41(7):1264–72. [DOI] [PubMed] [Google Scholar]
- 34.Ruijter BJ, Tjepkema-Cloostermans MC, Tromp SC, Van Den Bergh WM, Foudraine NA, Kornips FHM, et al. Early electroencephalography for outcome prediction of postanoxic coma: a prospective cohort study. Ann Neurol. 2019;86(2):203–14. [DOI] [PMC free article] [PubMed] [Google Scholar]
- 35.Benghanem S, Paul M, Charpentier J, Rouhani S, Salem OB, Guillemet L, Legriel S, Bougouin W, Pène F, Chiche JD, Mira JP. Value of EEG reactivity for prediction of neurologic outcome after cardiac arrest: Insights from the Parisian registry. Resuscitation. 2019;142:168–74. [DOI] [PubMed] [Google Scholar]
- 36.Benghanem S, Pruvost-Robieux E, Bouchereau E, Gavaret M, Cariou A. Prognostication after cardiac arrest: how EEG and evoked potentials may improve the challenge. Ann Intensive Care. 2022;12(1):111. [DOI] [PMC free article] [PubMed] [Google Scholar]
- 37.Azabou E, Navarro V, Kubis N, Gavaret M, Heming N, Cariou A, et al. Value and mechanisms of EEG reactivity in the prognosis of patients with impaired consciousness: a systematic review. Crit Care. 2018;22(1):184. [DOI] [PMC free article] [PubMed] [Google Scholar]
- 38.Fenter H, Ben-Hamouda N, Novy J, Rossetti AO. Benign EEG for prognostication of favorable outcome after cardiac arrest: a reappraisal. Resuscitation. 2023;182:109637. [DOI] [PubMed] [Google Scholar]
- 39.Endisch C, Westhall E, Kenda M, Streitberger KJ, Kirkegaard H, Stenzel W, Storm C, Ploner CJ, Cronberg T, Friberg H, Englund E. Hypoxic-ischemic encephalopathy evaluated by brain autopsy and neuroprognostication after cardiac arrest. JAMA Neurol. 2020;77(11):1430–9. [DOI] [PMC free article] [PubMed] [Google Scholar]
- 40.Elmer J, Kane N. Evoking signs of recovery after cardiac arrest: the SSEP ‘present versus absent’ dichotomy has shifted, now size matters. Resuscitation. 2021;163:195–7. [DOI] [PubMed] [Google Scholar]
- 41.Scarpino M, Lolli F, Lanzo G, Carrai R, Spalletti M, Valzania F, et al. SSEP amplitude accurately predicts both good and poor neurological outcome early after cardiac arrest; a post-hoc analysis of the ProNeCA multicentre study. Resuscitation. 2021;163:162–71. [DOI] [PubMed] [Google Scholar]
- 42.Glimmerveen AB, Keijzer HM, Ruijter BJ, Tjepkema-Cloostermans MC, Van Putten MJ, Hofmeijer J. Relevance of somatosensory evoked potential amplitude after cardiac arrest. Front Neurol. 2020;11:335. [DOI] [PMC free article] [PubMed] [Google Scholar]
- 43.Pelle J, Pruvost-Robieux E, Dumas F, Ginguay A, Charpentier J, Vigneron C, Pène F, Mira JP, Cariou A, Benghanem S. Personalized neuron-specific enolase level based on EEG pattern for prediction of poor outcome after cardiac arrest. Ann Intensive Care. 2025;15(1):11. [DOI] [PMC free article] [PubMed] [Google Scholar]
- 44.Grindegård L, Cronberg T, Backman S, Blennow K, Dankiewicz J, Friberg H, Hassager C, Horn J, Kjaer TW, Kjaergaard J, Kuiper M. Association between EEG patterns and serum neurofilament light after cardiac arrest: a post hoc analysis of the TTM trial. Neurology. 2022;98(24):e2487–98. 10.1212/WNL.0000000000200335. [DOI] [PMC free article] [PubMed] [Google Scholar]
Associated Data
This section collects any data citations, data availability statements, or supplementary materials included in this article.
Supplementary Materials
Data Availability Statement
Data could be available if request to corresponding author, to a reasonable extent.