



Abstract
Vital signs are essential for monitoring and prognostication in the emergency department (ED); however, they may not fully capture the complexity of frailty in older adults. In this multicenter retrospective study of 932 older patients who visited the EDs of three tertiary university hospitals between August 1 and October 31, 2023, we investigated the prognostic value of the Clinical Frailty Scale (CFS) in older patients in the ED and its potential to improve existing vital sign-based scoring systems. The primary outcomes were hospital admission, intensive care unit (ICU) admission, and in-hospital mortality. The AUROC was used to evaluate and compare the predictive performance of CFS, qSOFA, NEWS2, and REMS scores individually and in combination. Combining the CFS with these scores significantly improved predictive accuracy compared to individual scores alone. For hospital admission, the AUROCs were 0.715 (95% CI 0.685–0.744), 0.723 (95% CI 0.693–0.752), and 0.688 (95% CI 0.657–0.718) for CFS + qSOFA, CFS + NEWS2, and CFS + REMS, respectively. For ICU admission, the AUROCs were 0.730 (95% CI 0.701–0.759), 0.714 (95% CI 0.684–0.743), and 0.707 (95% CI 0.677–0.736), respectively. For in-hospital mortality, the AUROCs were 0.798 (95% CI: 0.771–0.823), 0.774 (95% CI: 0.746–0.801), and 0.819 (95% CI: 0.793–0.843), respectively, indicating excellent performance. Incorporating frailty assessment using the CFS enhances risk stratification in older patients in the ED by complementing vital sign-based scores. This provides a more comprehensive assessment, enabling better informed clinical decisions. This study supports employing routine frailty assessment in the ED and the development of enhanced risk stratification tools that incorporate frailty.
Keywords: Clinical frailty scale (CFS), Emergency department (ED), Risk stratification, Prognostic scoring systems, Older people
Subject terms: Health care, Geriatrics, Outcomes research, Risk factors
Introduction
With the aging global population, emergency departments (EDs) are increasingly encountering older patients with complex medical conditions and greater susceptibility to adverse outcomes1–3. Among them, acute conditions that may be fatal to the older people, such as infections, cardiovascular diseases, and respiratory distress, pose significant challenges owing to atypical presentations and reduced physiological reserves4,5. Early, accurate prognostication in the ED is essential for guiding clinical decisions, prioritizing resources, and improving outcomes in this vulnerable population. However, traditional assessment tools based on vital signs alone show limited accuracy, particularly for older patients with frailty and multiple comorbidities6–8.
Several clinical scoring tools, such as the Sequential Organ Failure Assessment (SOFA) score and its simplified version, the quick SOFA (qSOFA), were introduced to predict deterioration and mortality in acutely ill patients, particularly those at risk for sepsis-related poor outcomes9. The qSOFA exhibits superiority over traditional scoring systems such as SOFA, SIRS, and severe sepsis criteria in predicting in-hospital mortality, including in the ED, in accordance with the Third International Consensus Definitions for Sepsis and Septic Shock (Sepsis-3) criteria10. However, other studies suggest that qSOFA has inferior prognostic accuracy compared to early warning scores such as the National Early Warning Score (NEWS) and Rapid Emergency Medicine Score (REMS) and shows low sensitivity for detecting early clinical deterioration8,11,12. In contrast, NEWS and REMS, which include additional parameters such as heart rate, oxygen saturation, and age, have been validated as more comprehensive tools with better predictive accuracy across diverse acute conditions13–15. Frailty, characterized by reduced resistance to physiological stressors, is increasingly recognized as an independent predictor of mortality in older patients16–18. The Clinical Frailty Scale (CFS), a key measure of frailty, has become an important predictor of outcomes in the older patients, with several studies validating its use in the ED19–21. Therefore, incorporating frailty assessment into vital sign-based prognostic models is increasingly necessary to improve outcome prediction in older patients.
Despite advances in scoring tools, studies comparing their performance in older ED patients remain limited, with most evaluations focusing on younger populations or specific clinical conditions, limiting generalizability to older patients with atypical symptoms, polypharmacy, and underlying frailty22,23. Therefore, identifying the most effective prognostic assessment for older patients at risk of acute clinical decline in the ED is crucial.
Therefore, this study aims to evaluate and compare the prognostic accuracy of the qSOFA, NEWS2 (the superior version of NEWS)24, REMS, and CFS in predicting adverse outcomes, including mortality and clinical deterioration, in older ED patients. By assessing these tools across diverse conditions and incorporating frailty as a critical factor, this study seeks to identify the most effective approach for risk stratification and outcome prediction in this high-risk population.
Results
Characteristics of the enrolled study patients
During the study period, 32,636 patients were registered in NEDIS across three emergency medical centers. After applying the exclusion criteria, 932 patients were included in the final analysis (Fig. 1). Table 1 presents the demographic characteristics, vital signs, clinical outcomes, and scoring tool data for the included patients.
Fig. 1.

Flow chart.
Table 1.
Demographic characteristics of patients (Total n = 932).
| Variable | Value |
|---|---|
| Age (years) a | 77.56 ± 8.15 |
| Sex b | |
| Male | 439 (47.1) |
| Female | 493 (52.9) |
| Systolic Blood Pressure (mmHg) a | 135.65 ± 28.69 |
| Diastolic Blood Pressure (mmHg) a | 73.34 ± 16.3 |
| Pulse rate (beats/min) a | 89.55 ± 21.46 |
| Respiratory rate (breath/min) a | 20.62 ± 2.56 |
| Body temperature (oC) a | 37.14 ± 0.94 |
| Mental status b | |
| Alert | 833 (89.4) |
| Verbal response | 46 (4.9) |
| Painful response | 53 (5.7) |
| KTAS b | |
| Level 1 | 2 (0.2) |
| Level 2 | 216 (23.2) |
| Level 3 | 638 (68 0.5) |
| Level 4 | 71 (7.6) |
| Level 5 | 5 (0.5) |
| ED outcomes | |
| ED LOS a | 269.54 ± 210.97 |
| Discharge b | 381 (40.9) |
| Admission b | 551 (59.1) |
| Hospital LOS a | 9.51 ± 7.26 |
| GW admission b | 396 (71.9) |
| ICU admission b | 155 (28.1) |
| In-hospital mortality b | 43 (7.8) |
| Frailty b | |
| Non-frail (CFS 1–3) | 351 (37.7) |
| Prefrail (CFS 4) | 176 (18.9) |
| Frail (CFS 5–9) | 405 (43.5) |
| qSOFA c | 0 (0–1) |
| NEWS2 c | 1 (0–3) |
| REMS c | 7 (6–8) |
KTAS: Korean Triage and Acuity Scale; ED: Emergency department; LOS: length of stay; GW: General ward; ICU: intensive care unit; CFS: Clinical frailty scale; qSOFA: quick Sepsis related organ failure assessment; NEWS2: National Early Warning Score 2; REMS: Rapid emergency medicine score.
a The values are given as mean ± standard deviation.
b The values are given as number (%).
c The values are given as median (interquartile range).
Boldface type indicates statistical significance (p < 0.05).
The mean age was 77.56 ± 8.15 years, with 439 patients (47.1%) being male. Among the 932 patients included in the study, 551 (59.1%) required hospital admission through the ED. Of these hospitalized patients, 396 (71.9%) were admitted to GW and 155 (28.1%) to the ICU, representing an overall ICU admission rate of 16.6% among all ED patients in our study. Additionally, 43 patients (7.8% of hospitalized patients) died during their hospital stay. Based on the CFS, 351 (37.7%), 176 (18.9%), and 405 (43.5%) patients were classified as non-frail (CFS 1–3), pre-frail (CFS 4), and frail (CFS 5–9), respectively. The median scores for qSOFA, NEWS2, and REMS were 0 (interquartile range [IQR]: 0–1), 1 (IQR: 0–3), and 7 (IQR: 6–8), respectively.
Logistic regression analysis of factors predicting outcomes
Logistic regression analysis of admission predictors revealed that older age (OR: 1.037, p < 0.001), higher PR (OR: 1.017, p < 0.001), increased RR (OR: 1.185, p < 0.001), prolonged ED LOS ( OR: 1.008, p < 0.001), higher CFS (OR: 1.414, p < 0.001), elevated qSOFA (OR: 3.088, p < 0.001), higher NEWS2 (OR: 1.459, p < 0.001), and increased REMS (OR: 1.314, p < 0.001) were significant predictors of admission. Additionally, altered mental status (OR: 6.393, p < 0.001) and KTAS triage category ≤ 3 (OR: 6.812, p < 0.001) were associated with higher odds of admission. In contrast, lower SBP (OR: 0.991, p < 0.001) and DBP (OR: 0.987, p = 0.001) were associated with decreased likelihood of discharge. (Table 2). Logistic regression analysis of ICU admission predictors identified significant associations with lower SBP (OR: 0.986, p < 0.001), lower DBP (OR: 0.984, p = 0.004), higher PR (OR: 1.011, p = 0.006), increased RR (OR: 1.108, p = 0.001), and prolonged ED LOS (OR: 1.001, p = 0.012). Altered mental status (OR: 8.257, p < 0.001), higher CFS (OR: 1.254, p < 0.001), elevated qSOFA (OR: 2.744, p < 0.001), higher NEWS2 (OR: 1.350, p < 0.001), and increased REMS (OR: 1.392, p < 0.001) were strongly associated with ICU admission. Variables such as age, sex, body temperature, and KTAS triage category did not show significant predictive value for ICU admission (Table 3). Logistic regression analysis of in-hospital mortality predictors showed that older age (OR: 1.075, p < 0.001), lower SBP (OR: 0.984, p = 0.005), lower DBP (OR: 0.958, p < 0.001), higher PR (OR: 1.017, p = 0.011), and increased RR (OR: 1.179, p < 0.001) were significantly associated with increased mortality. Altered mental status (OR: 6.435, p < 0.001), higher CFS (OR: 1.434, p < 0.001), elevated qSOFA (OR: 2.980, p < 0.001), higher NEWS2 (OR: 1.391, p < 0.001), and increased REMS (OR: 1.515, p < 0.001) were also strong predictors. Body temperature (OR: 0.922, p = 0.027) was inversely associated with mortality. Variables such as sex, KTAS triage category, and ED LOS did not show significant predictive value (Table 4).
Table 2.
Logistic regression analysis of admission predictors.
| Variable | Univariate analysisa | ||||
|---|---|---|---|---|---|
| Discharge patients |
Admission patients |
||||
| n = 381 | n = 551 | OR | B | p-value | |
| Age (years) | 76.17 ± 8.13 | 78.52 ± 8.03 | 1.037 (1.020–1.054) | 0.036 | < 0.001 |
| Sex; Male | 167 (43.8) | 272 (49.4) | – | – | 0.096 |
| Systolic Blood Pressure (mmHg) | 140.13 ± 25.65 | 132.55 ± 30.26 | 0.991 (0.986–0.995) | -0.009 | < 0.001 |
| Diastolic Blood Pressure (mmHg) | 75.4 ± 14.65 | 71.93 ± 17.21 | 0.987 (0.979–0.995) | -0.013 | 0.001 |
| Pulse rate (beats/min) | 85.17 ± 18.96 | 92.58 ± 22.56 | 1.017 (1.011–1.024) | 0.017 | < 0.001 |
| Respiratory rate (breath/min) | 20.12 ± 1.62 | 20.96 ± 2.99 | 1.185 (1.106–1.270) | 0.170 | < 0.001 |
| Body temperature (oC) | 37 ± 0.78 | 37.24 ± 1.03 | – | – | 0.431 |
| Altered mental status | 11 (2.9) | 88 (16.0) | 6.393 (3.366–12.143) | 1.855 | < 0.001 |
| KTAS triage category ≤ 3 | 320 (84.0) | 536 (97.3) | 6.812 (3.808–12.185) | 1.919 | < 0.001 |
| ED LOS | 186.76 ± 114.25 | 326.77 ± 241.44 | 1.008 (1.007–1.010) | 0.008 | < 0.001 |
| CFS | 3 (2–5) | 5 (3–7) | 1.414 (1.310–1.525) | 0.346 | < 0.001 |
| qSOFA | 0 (0–0) | 0 (0–1) | 3.088 (2.367–4.029) | 1.127 | < 0.001 |
| NEWS2 | 1 (0–2) | 2 (1–4) | 1.459 (1.342–1.587) | 0.378 | < 0.001 |
| REMS | 6 (6–8) | 8 (6–9) | 1.314 (1.213–1.423) | 0.273 | < 0.001 |
KTAS: Korean Triage and Acuity Scale; ED: Emergency department; LOS: length of stay; CFS: Clinical frailty scale; qSOFA: quick Sepsis related organ failure assessment; NEWS2: National Early Warning Score 2; REMS: Rapid emergency medicine score.
a The values are given as mean ± standard deviation.
b The values are given as number (%).
c The values are given as median (interquartile range).
Boldface type indicates statistical significance (p < 0.05).
Table 3.
Logistic regression analysis of ICU admission predictors.
| Variable | Univariate analysisa | ||||
|---|---|---|---|---|---|
| Non-ICU admission patients |
ICU admission patients |
||||
| n = 777 | n = 155 | OR | B | p-value | |
| Age (years) | 77.41 ± 8.15 | 78.3 ± 8.16 | – | – | 0.217 |
| Sex; Male | 364 (46.8) | 75 (48.4) | – | – | 0.726 |
| Systolic Blood Pressure (mmHg) | 137.51 ± 27.58 | 126.32 ± 32.25 | 0.986 (0.979–0.992) | -0.015 | < 0.001 |
| Diastolic Blood Pressure (mmHg) | 74.03 ± 15.69 | 69.92 ± 18.73 | 0.984 (0.973–0.995) | -0.016 | 0.004 |
| Pulse rate (beats/min) | 88.68 ± 20.27 | 93.9 ± 26.31 | 1.011 (1.003–1.019) | 0.011 | 0.006 |
| Respiratory rate (breath/min) | 20.48 ± 2.44 | 21.3 ± 2.99 | 1.108 (1.043–1.176) | 0.102 | 0.001 |
| Body temperature (oC) | 37.14 ± 0.9 | 37.14 ± 1.13 | – | – | 0.321 |
| Altered mental status | 46 (5.9) | 53 (34.2) | 8.257 (0.5286–12.898) | 2.111 | < 0.001 |
| KTAS triage category ≤ 3 | 701 (90.2) | 155(100) | – | – | 0.997 |
| ED LOS | 261.38 ± 197.78 | 310.41 ± 264.48 | 1.001 (1.000-1.002) | 0.001 | 0.012 |
| CFS | 4 (3–6) | 5 (4–7) | 1.254 (1.147–1.371) | 0.226 | < 0.001 |
| qSOFA | 0 (0–1) | 1 (0–1) | 2.744 (2.184–3.447) | 1.009 | < 0.001 |
| NEWS2 | 1 (0–3) | 3 (1–5) | 1.350 (1.252–1.456) | 0.300 | < 0.001 |
| REMS | 7 (6–8) | 8 (6–10) | 1.392 (1.280–1.514) | 0.331 | < 0.001 |
KTAS: Korean Triage and Acuity Scale; ED: Emergency department; LOS: length of stay; CFS: Clinical frailty scale; qSOFA: quick Sepsis related organ failure assessment; NEWS2: National Early Warning Score 2; REMS: Rapid emergency medicine score.
a The values are given as mean ± standard deviation.
b The values are given as number (%).
c The values are given as median (interquartile range).
Boldface type indicates statistical significance (p < 0.05).
Table 4.
Logistic regression analysis of in-hospital mortality predictors.
| Variable | Univariate analysisa | Multivariate analysisb | |||
|---|---|---|---|---|---|
| Non-mortality patients |
Mortality patients |
||||
| n = 889 | n = 43 | OR | B | p-value | |
| Age (years) | 77.33 ± 8.15 | 82.28 ± 6.71 | 1.075 (1.036–1.116) | 0.072 | < 0.001 |
| Sex; Male | 417 (46.9) | 22 (51.2) | – | – | 0.585 |
| Systolic Blood Pressure (mmHg) | 136.23 ± 28.14 | 123.6 ± 36.71 | 0.984 (0.972–0.995) | −0.017 | 0.005 |
| Diastolic Blood Pressure (mmHg) | 73.79 ± 16.18 | 64.19 ± 16.25 | 0.958 (0.931–0.980) | −0.043 | < 0.001 |
| Pulse rate (beats/min) | 89.16 ± 21.24 | 97.74 ± 24.55 | 1.017 (1.004–1.029) | 0.016 | 0.011 |
| Respiratory rate (breath/min) | 20.52 ± 2.28 | 22.58 ± 5.56 | 1.179 (1.090–1.276) | 0.165 | < 0.001 |
| Body temperature (oC) | 37.15 ± 0.95 | 37.04 ± 0.85 | 0.922 (0.858–0.991) | −0.081 | 0.027 |
| Altered mental status | 82 (9.2) | 17 (39.5) | 6.435 (3.352–12.353) | 1.862 | < 0.001 |
| KTAS triage category ≤ 3 | 813 (91.5) | 43 (100) | – | – | 0.997 |
| ED LOS | 268.11 ± 213.07 | 298.98 ± 160.73 | – | – | 0.352 |
| CFS | 4 (3–6) | 6 (4–7) | 1.434 (1.216–1.690) | 0.360 | < 0.001 |
| qSOFA | 0 (0–1) | 1 (0–2) | 2.980 (2.146–4.137) | 1.092 | < 0.001 |
| NEWS2 | 1 (0–3) | 3 (2–6) | 1.391 (1.241–1.559) | 0.330 | < 0.001 |
| REMS | 7 (6–8) | 9 (8–12) | 1.515 (1.336–1.718) | 0.416 | < 0.001 |
KTAS: Korean Triage and Acuity Scale; ED: Emergency department; LOS: length of stay; CFS: Clinical frailty scale; qSOFA: quick Sepsis related organ failure assessment; NEWS2: National Early Warning Score 2; REMS: Rapid emergency medicine score.
a The values are given as mean ± standard deviation.
b The values are given as number (%).
c The values are given as median (interquartile range).
Boldface type indicates statistical significance (p < 0.05).
Comparison of predictive performance of clinical scoring tools
The predictive performance of clinical scoring tools for hospital admission, ICU admission, and in-hospital mortality is summarized based on their AUROC values, sensitivity, and specificity (Table 5). For hospital admission, NEWS2 (AUROC: 0.679, 95% confidence interval [CI]: 0.648–0.709) and CFS (AUROC: 0.676, 95% CI 0.645–0.706) showed similar performance, with CFS demonstrating slightly higher specificity (72.70%, 95% CI 67.9–77.1). Notably, CFS was not significantly different from that of qSOFA and NEWS2, but it was significantly superior to that of REMS in predicting hospital admission (Fig. 2A). For ICU admission, qSOFA had the highest AUROC (0.702, 95% CI 0.672–0.731), with high specificity (72.97%, 95% CI 69.7–76.1). In contrast, CFS showed statistically significant lower predictive ability than those of qSOFA and NEWS2 for ICU admission but was not significantly different from that of REMS (Fig. 2B). For in-hospital mortality, REMS had the highest AUROC (0.758, 95% CI 0.729–0.785) and excellent specificity (80.65%, 95% CI 77.9–83.2). qSOFA also performed well in predicting in-hospital mortality (AUROC: 0.743, 95% CI 0.714–0.771), demonstrating balanced sensitivity and specificity. No significant differences in predictive ability were observed among the four tools (Fig. 2C).
Table 5.
Comparison of cut-off value, AUROC, sensitivity and specificity.
| For predict hospital admission | ||||||
|---|---|---|---|---|---|---|
| Cut-off value | AUROC (95% CI) | Sensitivity, % (95% CI) | Specificity, % (95% CI) | p-value | ||
| CFS | 5 | 0.676 (0.645–0.706) | 54.63 (50.4–58.8) | 72.70 (67.9–77.1) | < 0.001 | |
| qSOFA | 1 | 0.644 (0.613–0.675) | 44.46 (40.3–48.7) | 82.94 (78.8–86.6) | < 0.001 | |
| NEWS2 | 2 | 0.679 (0.648–0.709) | 56.62 (52.4–60.8) | 71.13 (66.3–75.6) | < 0.001 | |
| REMS | 9 | 0.621 (0.589–0.653) | 28.88 (24.9–32.6) | 86.76 (86.3–92.6) | < 0.001 | |
| For predict ICU admission | ||||||
| Cut-off value | AUROC (95% CI) | Sensitivity, % (95% CI) | Specificity, % (95% CI) | p-value | ||
| CFS | 5 | 0.628 (0.596–0.659) | 60.65 (52.5–68.4) | 59.97 (56.4–63.4) | < 0.001 | |
| qSOFA | 1 | 0.702 (0.672–0.731) | 64.52 (56.4–72.0) | 72.97 (69.7–76.1) | < 0.001 | |
| NEWS2 | 3 | 0.693 (0.662–0.722) | 56.77 (48.6–64.7) | 74.39 (71.2–77.4) | < 0.001 | |
| REMS | 9 | 0.680 (0.649–0.710) | 47.74 (39.7–55.9) | 84.17 (81.4–86.7) | < 0.001 | |
| For predict in-hospital mortality | ||||||
| Cut-off value | AUROC (95% CI) | Sensitivity, % (95% CI) | Specificity, % (95% CI) | p-value | ||
| CFS | 5 | 0.695 (0.664–0.724) | 74.42 (58.8–86.5) | 58.04 (54.7–61.3) | < 0.001 | |
| qSOFA | 1 | 0.743 (0.714–0.771) | 74.42 (58.8–86.5) | 68.73 (65.6–71.8) | < 0.001 | |
| NEWS2 | 3 | 0.726 (0.696–0.755) | 62.79 (46.7–77.0) | 70.75 (67.6–73.7) | < 0.001 | |
| REMS | 9 | 0.758 (0.729–0.785) | 58.14 (42.1–73.0) | 80.65 (77.9–83.2) | < 0.001 | |
AUROC: Area Under the ROC curve; CFS: Clinical frailty scale; qSOFA: quick Sepsis related organ failure assessment; NEWS2: National Early Warning Score 2; REMS: Rapid emergency medicine score.
Boldface type indicates statistical significance (p < 0.05).
Fig. 2.
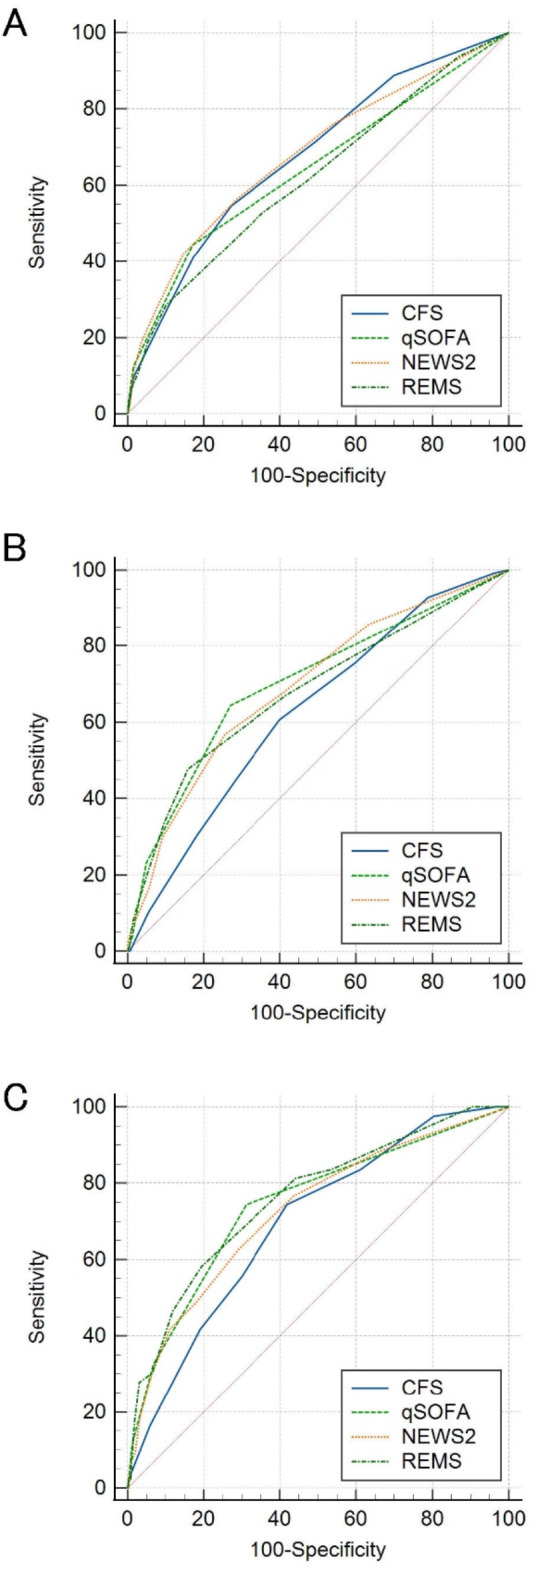
The AUROC curves comparing the predictive performance for critical outcomes in older emergency department patients. (A) The area under the receiver operating characteristic (AUROC) curves for the prediction of admission. (B) AUROC curve for the prediction of ICU admission. (C) AUROC curve for the prediction of in-hospital mortality.
Table 6; Fig. 3 show the differences in AUROC when CFS is combined with vital sign-based scoring tools. Despite some overlap in confidence intervals, the pairwise comparison using DeLong’s method demonstrated statistically significant improvements in predictive performance when CFS was combined with each scoring tool. For hospital admission prediction, the addition of CFS resulted in significant AUROC increases for all scores (qSOFA: 0.0705, p < 0.001; NEWS2: 0.0437, p < 0.001; REMS: 0.0666, p < 0.001) (Fig. 3A). Similarly, for ICU admission prediction, all combined models showed significant improvements (qSOFA + CFS: 0.0281, p = 0.007; NEWS2 + CFS: 0.0213, p = 0.043; REMS + CFS: 0.0268, p = 0.023) (Fig. 3B). The most notable improvements were observed for in-hospital mortality prediction, where the combined models achieved excellent performance with AUROCs ranging from 0.774 to 0.819 (qSOFA + CFS: 0.0549, p = 0.001; NEWS2 + CFS: 0.0483, p = 0.009; REMS + CFS: 0.0606, p = 0.002) (Fig. 3C).
Table 6.
Comparison of AUROC values for individual versus combined scores with CFS.
| Score | Individual AUROC (95% CI) | Combined AUROC (95% CI) | Difference AUROC | p-value | |
|---|---|---|---|---|---|
| Hospital Admission | qSOFA | 0.644 (0.613–0.675) | 0.715 (0.685–0.744) | 0.0705 | < 0.001 |
| NEWS2 | 0.679 (0.648–0.709) | 0.723 (0.693–0.752) | 0.0437 | < 0.001 | |
| REMS | 0.621 (0.589–0.653) | 0.688 (0.657–0.718) | 0.0666 | < 0.001 | |
| ICU admission | qSOFA | 0.702 (0.672–0.731) | 0.730 (0.701–0.759) | 0.0281 | 0.007 |
| NEWS2 | 0.693 (0.662–0.722) | 0.714 (0.684–0.743) | 0.0213 | 0.043 | |
| REMS | 0.680 (0.649–0.710) | 0.707 (0.677–0.736) | 0.0268 | 0.023 | |
| In-hospital mortality | qSOFA | 0.743 (0.714–0.771) | 0.798 (0.771–0.823) | 0.0549 | 0.001 |
| NEWS2 | 0.726 (0.696–0.755) | 0.774 (0.746–0.801) | 0.0483 | 0.009 | |
| REMS | 0.758 (0.729–0.785) | 0.819 (0.793–0.843) | 0.0606 | 0.002 |
AUROC: Area Under the ROC curve; CFS: Clinical frailty scale; qSOFA: quick Sepsis related organ failure assessment; NEWS2: National Early Warning Score 2; REMS: Rapid emergency medicine score.
Individual AUROC: AUROC value for the score alone.
Combined AUROC: AUROC value when CFS is combined with the corresponding score.
Difference AUROC: Absolute increase in AUROC when CFS is added to the score.
p-values calculated using DeLong’s method for comparing AUROCs.
Boldface type indicates statistical significance (p < 0.05).
Fig. 3.

Comparison of patient prognosis performance when combining CFS with scoring tools. The AUROC curves illustrate the performance of CFS combined with qSOFA (left column), NEWS2 (middle column), and REMS (right column) versus each individual score. (A) Hospital admission prediction. (B) ICU admission prediction. (C) In-hospital mortality prediction.
Discussion
This study emphasizes the importance of frailty assessment alongside vital signs in evaluating older ED patients. The CFS, a simple tool for quickly assessing frailty in older patients visiting the ED, demonstrated prognostic ability comparable to that of traditional vital-sign-based scoring systems such as the qSOFA, NEWS2, and REMS. Additionally, incorporating CFS into these scoring systems significantly improved the predictive performance for hospital admission, ICU admission, and in-hospital mortality. While these improvements in AUROCs (ranging from 0.0213 to 0.0705) may appear modest numerically, their consistency across all outcomes and scoring systems is statistically significant (p < 0.05) and clinically meaningful in the context of a heterogeneous elderly ED population. Particularly for in-hospital mortality prediction, the combined models achieved excellent performance. These findings underscore the value of considering both acute physiological changes and baseline vulnerability in risk stratification and management of older patients in the ED.
Vital signs are crucial in clinical practice for monitoring and prognostication, as they reflect physiological processes and detect deviations from homeostasis25,26. Therefore, numerous early warning systems using vital signs have been developed, with extensive research on their prognostic value6–8,27. However, using vital signs alone may not adequately capture the complexity and heterogeneity of older patients, as they fail to reflect functional reserve and resilience28. In contrast, frailty indicates a decline in multiple physiological systems, increasing vulnerability to stressors and adverse outcomes18,29. Although qSOFA, NEWS2, and REMS have been validated in various clinical settings, their prognostic accuracy in older patients with complex conditions and atypical symptoms is uncertain30,31. Unlike previous studies, this study systematically compares these scoring systems while incorporating frailty assessment to provide a more comprehensive assessment tailored to the unique needs of older patients, highlighting its novelty and clinical relevance.
EDs handle multiple symptoms, diseases, and age groups, with patients arriving unpredictably. Effective classification and severity stratification are crucial for early and accurate prediction of potential deterioration in patients. The CFS, such as vital signs, is particularly well-suited for the fast-paced ED environment, where rapid and accurate risk stratification is crucial. Initially part of triage, vital signs provide quick, essential insights into the physiological state of a patient26,27. Similarly, the CFS enables quick, intuitive frailty assessment, enabling clinicians to identify patients at higher risk for adverse outcomes. In a setting with diverse presentations and unpredictable patient inflow, integrating CFS into early evaluations improves severity prediction and triage processes for older patients. Although tools such as qSOFA are simple and easy to use, their low sensitivity has been a consistent limitation in prior studies12,32,33. Our findings demonstrated that the CFS matches or outperforms traditional scoring tools in predictive performance, particularly in sensitivity. Therefore, it is particularly useful for predicting rapid deterioration in older patients visiting the ED in a dynamic environment, highlighting its potential to guide optimal treatment for high-risk patients. It is important to note that unlike vital sign-based scoring systems (qSOFA, NEWS2, and REMS) which primarily capture acute physiological derangements, the CFS assesses a patient’s baseline vulnerability and chronic health status. This fundamental distinction explains why integrating both measures provides superior predictive performance. While vital signs reflect immediate physiological responses to acute stressors, frailty represents the cumulative decline in physiological reserve that affects how patients respond to those stressors.
The prognostic value of the CFS in older patients has been validated in several studies34,35. Furthermore, recent studies indicate that combining CFS with tools such as KTAS and NEWS enhances prognosis prediction for older patients in the ED36,37. Our study also revealed that integrating CFS with existing scoring systems significantly improved predictive performance, highlighting frailty as a key predictor. This improvement stems from the complementary nature of these assessments: while the CFS captures pre-existing vulnerability and reduced physiological reserve, vital sign-based scores reflect acute physiological derangements. Our intention in evaluating the CFS alongside vital-sign-based tools (qSOFA, NEWS2, REMS) was not to advocate for its isolated use as a decision-making instrument for ICU admission or mortality risk prediction. It is important to note that the CFS was not originally developed for acute care settings to predict critical outcomes, but rather to assess frailty and functional status in older adults. Nevertheless, our findings demonstrate that frailty assessment provides valuable additional information that complements acute physiological measurements. The modest yet statistically significant improvements in predictive accuracy highlight both the inherent challenges in accurately predicting complex clinical outcomes in heterogeneous elderly populations and the continued need for more refined predictive tools specifically designed for older ED patients. The significant improvement in predictive accuracy when combining these measures demonstrates that neither approach alone fully captures the complex interplay between chronic frailty and acute illness in older patients. This finding suggests that relying solely on vital signs fails to adequately represent the multifaceted nature of health status in the geriatric population. This study demonstrates the value of incorporating frailty into established tools, highlighting the potential of novel scoring systems and automated risk prediction models. Moreover, our findings support the development of specific clinical guidelines that incorporate early frailty assessment to optimize the management of older patients.
Limitations
This study has some limitations. First, its retrospective design may introduce selection bias, and reliance on the NEDIS database limits detailed clinical information. Second, the focus on tertiary university hospitals in South Korea may restrict the generalizability of our findings to other patient populations or healthcare systems globally. Therefore, further research is needed to validate these results across diverse populations and settings. Third, the exclusion of patients with traumatic injuries, including falls resulting in significant trauma, may limit generalizability, as falls are a common geriatric syndrome strongly associated with frailty. Future studies should consider including fall-related presentations to provide a more comprehensive assessment of frailty in older ED patients. Fourth, regarding ICU admission as a primary outcome, we acknowledge potential selection bias as admission decisions may be influenced by patient/family preferences and ethical considerations about aggressive interventions in frail patients. This could lead to underestimation of frailty’s impact on critical illness outcomes. However, this concern is somewhat mitigated in our study context, as our participating hospitals are regional emergency medical centers designated to provide definitive care for critically ill patients, and patients declining ICU-level care despite medical necessity are typically transferred to other facilities and thus excluded from our analysis. Fifth, the CFS scoring was based on clinical judgment, which may be influenced by interobserver variability. Standardized training and assessment procedures could mitigate this and ensure consistent CFS application in clinical practice. It is worth noting that Albrecht et al. demonstrated that with standardized training and brief familiarization, this variability can be significantly reduced, making the CFS both feasible and reliable in routine ED practice38. Finally, due to the nature of the study employment of older patients, unmeasured confounders, such as socioeconomic factors or comorbidity severity, may have affected the results.
Conclusion
This study highlights the significance of incorporating frailty assessment with the CFS into risk stratification of older patients presenting to the ED. The CFS, a simple and effective tool, exhibited comparable prognostic ability to those of traditional vital sign-based scoring systems such as qSOFA, NEWS2, and REMS for predicting hospital admission, ICU admission, and in-hospital mortality. Furthermore, integrating the CFS with these scores significantly improved predictive accuracy, underscoring the importance of frailty in risk assessment for this vulnerable population. Our findings suggest that frailty, indicating a decline in physiological reserve and resilience, complements vital signs, which primarily reflect acute physiological changes. This distinction is crucial, frailty represents a pre-existing vulnerability that influences how patients respond to acute stressors, while vital signs capture the immediate physiological response to those stressors. The superior performance of the combined models confirms that these are not competing but rather complementary approaches to risk stratification in older ED patients. Considering both allows clinicians to better assess patient risk and tailor targeted interventions accordingly. This study supports the inclusion of frailty assessment when evaluating older patients presenting to the ED and developing more advanced risk stratification tools and clinical guidelines to optimize care for this vulnerable population.
Materials and methods
Study design and population
In this multicenter retrospective study, the National Emergency Department Information System (NEDIS) data of older patients aged ≥ 65 years who visited the ED of three tertiary university hospitals between August 1 and October 31, 2023, was utilized. The NEDIS is a South Korean comprehensive database that collects real-time data from EDs nationwide, which supports research and policy decisions by providing detailed information on patient characteristics, medical outcomes, and resource use39. Patients < 65 years, those visiting the ED for non-medical purposes (certificate issuance), and patients with uncertain outcomes owing to discharge against medical advice or transfer to another facility were excluded. Additionally, patients presenting for trauma, including falls, to EDs were excluded. Since this study compares scoring tools based on vital signs recorded at ED presentation, those without measured vital signs, such as those declared dead on arrival or experienced out-of-hospital cardiac arrest, were excluded from the analysis. This study was conducted according to the guidelines of the Declaration of Helsinki. Due to the retrospective nature of the study, the need of informed consent was waived by the Institutional Review Board of each participating hospital (Ewha Womans University Seoul Hospital: 2024-04-013, 22 April 2024; Ewha Womans University Mokdong Hospital: 2024-01-007-005, 12 April 2024; Chung-ang University Gwangmyeong Hospital: 2402-139-020, 6 March 2024).
Data collection and outcome measures
Data from eligible patients were collected from the NEDIS. The dataset included demographics (age and sex), initial vital signs recorded in the ED (systolic blood pressure [SBP], diastolic blood pressure [DBP], pulse rate [PR], respiratory rate [RR], body temperature, and mental status), Korean Triage and Acuity Scale (KTAS) levels, ED outcomes (discharge, admission to general wards [GW] intensive care units [ICU], or death), ED length of stay (ED LOS), hospital length of stay (hospital LOS), and final hospital outcomes (in-hospital mortality or discharge). The KTAS is a five-level emergency patient triage tool used in South Korea, adapted from the Canadian Triage and Acuity Scale40. It categorizes patients based on care urgency to facilitate efficient resource allocation and prioritization in EDs. A score of 1, 2, or 3 indicates urgent care requiring prompt medical attention41.
The qSOFA score was calculated based on the presence of altered mental status, SBP ≤ 100 mmHg, and RR ≥ 22 breaths/min. NEWS2 was calculated using seven physiological parameters: RR, oxygen saturation, supplemental oxygen, temperature, SBP, heart rate, and level of consciousness. REMS was calculated using age, heart rate, RR, SBP, oxygen saturation, and Glasgow Coma Scale. The CFS is a validated frailty assessment tool based on clinical judgment. It scores individuals on a 9-point scale ranging from 1 (very fit) to 9 (terminally ill) based on physical fitness and functional independence. In this study, the Korean version of the Clinical Frailty Scale (CFS-K), proposed by Ko et al. in 2021 42, was used. Upon arrival at the ED, patients or caregivers were interviewed by physicians or nurses, who then assigned the CFS score. Frailty levels were categorized as follows: CFS scores of 1–3, 4, and 5–9 indicate non-frail, pre-frail, and frail, respectively.
The primary outcomes of this study were hospital admission, specifically ICU admission, and in-hospital mortality among older patients. The predictive abilities of various assessment tools for these outcomes were compared in this study.
Statistical analysis
Continuous variables are expressed as means and standard deviations (SD), and categorical variables are expressed as counts (percentages). Baseline demographic and clinical characteristics were summarized using independent t-tests for continuous variables and Pearson’s chi-square tests for categorical variables. Logistic regression models were used to evaluate the predictive performance of each tool for hospital admission, ICU admission, and in-hospital mortality. The area under the receiver operating characteristic (AUROC) curve, which assesses the discriminative ability of a prognostic tool, is interpreted as follows: 0.8–0.9, 0.7–0.8, and 0.6–0.7 indicate excellent, fair, and poor performance, respectively. The optimal cutoff values for each scoring system were determined by maximizing the combined sensitivity and specificity. Statistical analyses were conducted using SPSS version 26.0, and the AUROC curve was analyzed using the DeLong method with MedCalc Statistical Software version 19. A p-value < 0.05 was considered statistically significant.
Author contributions
Conceptualization, S.J.B. and H.S.C.; methodology, Y.C. and S.J.B.; software, J.Y.L.; validation, D.H.L. and K.K.; formal analysis, Y.C.; investigation, H.S.C.; resources, H.S.C.; data curation, J.Y.L. and S.J.B.; writing—original draft preparation, H.S.C.; writing—review and editing, S.J.B.; visualization, Y.H.C.; supervision, D.H.L. and Y.H.C.; project administration, K.K. and Y.H.C.; All authors have read and agreed to the published version of the manuscript.
Data availability
The datasets used in this study are available from the corresponding author upon request.
Declarations
Competing interests
The authors declare no competing interests.
Footnotes
Publisher’s note
Springer Nature remains neutral with regard to jurisdictional claims in published maps and institutional affiliations.
References
- 1.Samaras, N., Chevalley, T., Samaras, D. & Gold, G. Older patients in the emergency department: A review. Ann. Emerg. Med.56, 261–269. 10.1016/j.annemergmed.2010.04.015 (2010). [DOI] [PubMed] [Google Scholar]
- 2.Lin, C. F. et al. Comprehensive geriatric assessment and clinical outcomes in the older people at the emergency department. 18, 6164 (2021). [DOI] [PMC free article] [PubMed]
- 3.Shenvi, C. L. & Platts-Mills, T. F. J. A. O. E. M. Managing the elderly emergency department patient. 73, 302–307 (2019). [DOI] [PubMed]
- 4.Le Borgne, P. et al. Critically ill elderly patients (≥ 90 years): clinical characteristics, outcome and financial implications. 13, e0198360 (2018). [DOI] [PMC free article] [PubMed]
- 5.Orsini, J. et al. Prognostic factors associated with adverse outcome among critically ill elderly patients admitted to the intensive care unit. 15, 889–894 (2015). [DOI] [PubMed]
- 6.Brunetti, E. et al. Comparison of diagnostic accuracies of qSOFA, NEWS, and MEWS to identify sepsis in older inpatients with suspected infection. 23, 865–871. e862 (2022). [DOI] [PubMed]
- 7.Sanguanwit, P., Thudsaringkarnsakul, W., Angkoontassaneeyarat, C. & Watcharakitpaisan, S. J. A. o. A. E. M. Comparison of qSOFA, SIRS, NEWS and REWS scores in predicting severity and 28-day mortality of older suspected sepsis cases; a prognostic accuracy study. 12, e3 (2023). [DOI] [PMC free article] [PubMed]
- 8.Ruangsomboon, O., Boonmee, P., Limsuwat, C., Chakorn, T. & Monsomboon, A. The utility of the rapid emergency medicine score (REMS) compared with SIRS, qSOFA and NEWS for predicting in-hospital mortality among patients with suspicion of sepsis in an emergency department. J. B E M. 21, 1–13 (2021). [DOI] [PMC free article] [PubMed] [Google Scholar]
- 9.Singer, M. et al. The third international consensus definitions for sepsis and septic shock (Sepsis-3). 315, 801–810 (2016). [DOI] [PMC free article] [PubMed]
- 10.Freund, Y. et al. Prognostic accuracy of sepsis-3 criteria for in-hospital mortality among patients with suspected infection presenting to the emergency department. 317, 301–308 (2017). [DOI] [PubMed]
- 11.Churpek, M. M. et al. Quick sepsis-related organ failure assessment, systemic inflammatory response syndrome, and early warning scores for detecting clinical deterioration in infected patients outside the intensive care unit. 195, 906–911 (2017). [DOI] [PMC free article] [PubMed]
- 12.Perman, S. M. et al. The sensitivity of qSOFA calculated at triage and during emergency department treatment to rapidly identify sepsis patients. Sci. Rep.10, 20395. 10.1038/s41598-020-77438-8 (2020). [DOI] [PMC free article] [PubMed] [Google Scholar]
- 13.Kim, I. et al. Use of the National early warning score for predicting in-hospital mortality in older adults admitted to the emergency department. 7, 61 (2020). [DOI] [PMC free article] [PubMed]
- 14.Lee, Y. S. et al. Evaluation of the efficacy of the National early warning score in predicting in-hospital mortality via the risk stratification. 47, 222–226 (2018). [DOI] [PubMed]
- 15.Özdemir, S. et al. T. A. J. O. E. M. Effectiveness O. the rapid emergency medicine score and the rapid acute physiology score in prognosticating mortality in patients presenting to the emergency department with COVID-19 symptoms. 49, 259–264 (2021). [DOI] [PMC free article] [PubMed]
- 16.Soong, J., Poots, A., Scott, S., Donald, K. & Bell, D. J. B. o. Developing and validating a risk prediction model for acute care based on frailty syndromes. 5, e008457 (2015). [DOI] [PMC free article] [PubMed]
- 17.Zou, Y. et al. Predictive value of frailty in the mortality of hospitalized patients with COVID-19: A systematic review and meta-analysis. 10 (2022). [DOI] [PMC free article] [PubMed]
- 18.Clegg, A., Young, J., Iliffe, S., Rikkert, M. O. & Rockwood, K. J. T. L. Frailty in elderly people. 381, 752–762 (2013). [DOI] [PMC free article] [PubMed]
- 19.Zacchetti, L. et al. Clinical frailty scale as a predictor of outcome in elderly patients affected by moderate or severe traumatic brain injury. 14, 1021020 (2023). [DOI] [PMC free article] [PubMed]
- 20.Rueegg, M. et al. The clinical frailty scale predicts 1-year mortality in emergency department patients aged 65 years and older. 29, 572–580 (2022). [DOI] [PMC free article] [PubMed]
- 21.Kaeppeli, T. et al. Validation of the clinical frailty scale for prediction of thirty-day mortality in the emergency department. 76, 291–300 (2020). [DOI] [PubMed]
- 22.Perry, A., Macias Tejada, J. & Melady, D. An approach to the older patient in the emergency department. Clin. Geriatr. Med.34, 299–311. 10.1016/j.cger.2018.03.001 (2018). [DOI] [PubMed] [Google Scholar]
- 23.Carpenter, C. R. et al. Risk factors and screening instruments to predict adverse outcomes for undifferentiated older emergency department patients: A systematic review and Meta-analysis. 22, 1–21, (2015). 10.1111/acem.12569 [DOI] [PubMed]
- 24.Wei, S. et al. The accuracy of the National early warning score 2 in predicting early death in prehospital and emergency department settings: A systematic review and meta-analysis. Annals Translational Med.11, 95. 10.21037/atm-22-6587 (2023). [DOI] [PMC free article] [PubMed] [Google Scholar]
- 25.Chester, J. G. & Rudolph, J. L. Vital signs in older patients: Age-related changes. J. Am. Med. Dir. Assoc.12, 337–343. 10.1016/j.jamda.2010.04.009 (2011). [DOI] [PMC free article] [PubMed] [Google Scholar]
- 26.Lamantia, M. A. et al. Predictive value of initial triage vital signs for critically ill older adults. West. J. Emerg. Med.14, 453–460. 10.5811/westjem.2013.5.13411 (2013). [DOI] [PMC free article] [PubMed] [Google Scholar]
- 27.Hodgson, N. R., Poterack, K. A., Mi, L. & Traub, S. J. Association of vital signs and process outcomes in emergency department patients. Western J. Emerg. Med.20, 433–437. 10.5811/westjem.2019.1.41498 (2019). [DOI] [PMC free article] [PubMed] [Google Scholar]
- 28.Thorpe, O. et al. Scoring the clinical frailty scale in the emergency department: The home first experience. J. Frailty Sarcopenia Falls. 7, 95–100. 10.22540/jfsf-07-095 (2022). [DOI] [PMC free article] [PubMed] [Google Scholar]
- 29.Lacas, A. & Rockwood, K. Frailty in primary care: a review of its conceptualization and implications for practice. BMC Med.1010.1186/1741-7015-10-4 (2012). [DOI] [PMC free article] [PubMed]
- 30.de Groot, B. et al. The most commonly used disease severity scores are inappropriate for risk stratification of older emergency department sepsis patients: An observational multi-centre study. Scand. J. Trauma Resusc. Emerg. Med.25, 91. 10.1186/s13049-017-0436-3 (2017). [DOI] [PMC free article] [PubMed] [Google Scholar]
- 31.Boonmee, P., Ruangsomboon, O., Limsuwat, C. & Chakorn, T. Predictors of mortality in elderly and very elderly emergency patients with sepsis: A retrospective study. Western J. Emerg. Med.21, 210–218. 10.5811/westjem.2020.7.47405 (2020). [DOI] [PMC free article] [PubMed] [Google Scholar]
- 32.Hwang, S. Y. et al. Low accuracy of positive qSOFA criteria for predicting 28-Day mortality in critically ill septic patients during the early period after emergency department presentation. Ann. Emerg. Med.71, 1–9e2. 10.1016/j.annemergmed.2017.05.022 (2018). [DOI] [PubMed] [Google Scholar]
- 33.Rodriguez, R. M. et al. Comparison of qSOFA with current emergency department tools for screening of patients with sepsis for critical illness. Emerg. Med. J.35, 350–356. 10.1136/emermed-2017-207383 (2018). [DOI] [PubMed] [Google Scholar]
- 34.Muessig, J. M. et al. Clinical frailty scale (CFS) reliably stratifies octogenarians in German ICUs: a multicentre prospective cohort study. BMC Geriatr.1810.1186/s12877-018-0847-7 (2018). [DOI] [PMC free article] [PubMed]
- 35.Rueegg, M. et al. The clinical frailty scale predicts 1-year mortality in emergency department patients aged 65 years and older. Acad. Emerg. Medicine: Official J. Soc. Acad. Emerg. Med.29, 572–580. 10.1111/acem.14460 (2022). [DOI] [PMC free article] [PubMed] [Google Scholar]
- 36.Chung, H. S. et al. Validation of the Korean version of the clinical frailty scale-Adjusted Korean triage and acuity scale for older patients in the emergency department. Med. (Kaunas Lithuania). 6010.3390/medicina60060955 (2024). [DOI] [PMC free article] [PubMed]
- 37.Kabell Nissen, S. et al. Prognosis for older people at presentation to emergency department based on frailty and aggregated vital signs. J. Am. Geriatr. Soc.71, 1250–1258. 10.1111/jgs.18170 (2023). [DOI] [PubMed] [Google Scholar]
- 38.Albrecht, R. et al. Clinical frailty scale at presentation to the emergency department: Interrater reliability and use of algorithm-assisted assessment. Eur. Geriatr. Med.15, 105–113. 10.1007/s41999-023-00890-y (2024). [DOI] [PMC free article] [PubMed] [Google Scholar]
- 39.Oh, M. et al. Usage patterns of emergency medical services in Korea: Analysis of patient flow. Chin. Med. J.132, 259–268. 10.1097/cm9.0000000000000062 (2019). [DOI] [PMC free article] [PubMed] [Google Scholar]
- 40.Murray, J. M. The Canadian triage and acuity scale: A Canadian perspective on emergency department triage. 15, 6–10, (2003). 10.1046/j.1442-2026.2003.00400.x [DOI] [PubMed]
- 41.Kwon, H. et al. The Korean Triage and Acuity Scale: Associations with admission, disposition, mortality and length of stay in the emergency department. Int. J. Quality Health Care31, 449–455, (2018). https://doi.org/10.1093/intqhc/mzy184%J. [DOI] [PubMed]
- 42.Ko, R. E. et al. Translation and validation of the Korean version of the clinical frailty scale in older patients. 21, 1–8 (2021). [DOI] [PMC free article] [PubMed]
Associated Data
This section collects any data citations, data availability statements, or supplementary materials included in this article.
Data Availability Statement
The datasets used in this study are available from the corresponding author upon request.