

Abstract
Analyzing biomedical images is vital in permitting the highest-performing imaging and numerous medical applications. Determining the analysis of the disease is an essential stage in handling the patients. Similarly, the statistical value of blood tests, the personal data of patients, and an expert estimation are necessary to diagnose a disease. With the growth of technology, patient-related information is attained rapidly and in big sizes. Currently, numerous physical methods exist to evaluate and forecast blood cancer utilizing the microscopic health information of white blood cell (WBC) images that are stable for prediction and cause many deaths. Machine learning (ML) and deep learning (DL) have aided the classification and collection of patterns in data, foremost in the growth of AI methods employed in numerous haematology fields. This study presents a novel Computer-Aided Diagnosis of Haematologic Disorders Detection Based on Spatial Feature Learning Networks with Hybrid Model (CADHDD-SFLNHM) approach using Blood Cell Images. The main aim of the CADHDD-SFLNHM approach is to enhance the detection and classification of haematologic disorders. At first, the Sobel filter (SF) technique is utilized for preprocessing to improve the quality of blood cell images. Additionally, the modified LeNet-5 model is used in the feature extractor process to capture the essential characteristics of blood cells relevant to disorder classification. The convolutional neural network and bi-directional gated recurrent unit with attention (CNN-BiGRU-A) method is employed to classify and detect haematologic disorders. Finally, the CADHDD-SFLNHM model implements the pelican optimization algorithm (POA) method to fine-tune the hyperparameters involved in the CNN-BiGRU-A method. The experimental result analysis of the CADHDD-SFLNHM model was accomplished using a benchmark database. The performance validation of the CADHDD-SFLNHM model portrayed a superior accuracy value of 97.91% over other techniques.
Keywords: Haematologic disorders, Computer-aided diagnosis, Blood cell images, Artificial Intelligence, Pelican optimization Algorithm
Subject terms: Computer science, Information technology
Introduction
Blood is generally made of numerous modules with dissimilar types of cells and plasma. Blood transfers nutrients and oxygen to organs and tissues while removing waste products like ammonia and carbon dioxide1. Blood plays key roles in oxygen transport, temperature regulation, clotting, and immune response while aiding in gas exchange and tissue regeneration2. It includes four vital cellular modules: platelets, plasma, WBCs, and red blood cells (RBCs)3. WBCs are generally found in blood as well as lymphatic nodes. In the body’s immune response, many kinds of WBCs are recognized and perform their particular functions4. Unfortunately, traditional models for haematological analysis provide restricted access to the assets of distinct RBCs5. An instance of a classical model is the complete blood count (CBC), which is the present gold standard model to measure RBC properties. A CBC is a blood test that delivers valuable information regarding an individual’s health status6.
Usually, WBCs are classified by knowledgeable medical staff who distinguish WBCs visually depending on their morphologies in blood samples that are perceived under a microscope7. WBCs are formed in the bone marrow and contain cytoplasm and nuclei. All these significantly shield the body by protecting it against foreign stuff, infections, and viruses, creating a vital module of the immune response8. DL is a well-known artificial intelligence (AI) domain that uses numerous techniques. It has rapidly invaded the area of clinical investigation. DL permits you to explain machines without skills and learn the information9. The DL applications have attained excellent outcomes and were particularly helpful in disease recognition. Studies show that DL models enhance medical reasoning in CT by analyzing image features. With the growth of healthcare data and tools, there is a crucial need for more robust data processing capabilities10. Traditional data analysis models could not examine vast amounts of data or recognize trends.
This study presents a novel Computer-Aided Diagnosis of Haematologic Disorders Detection Based on Spatial Feature Learning Networks with Hybrid Model (CADHDD-SFLNHM) approach using Blood Cell Images. The main aim of the CADHDD-SFLNHM approach is to enhance the detection and classification of haematologic disorders. At first, the Sobel filter (SF) technique is used for preprocessing to improve the quality of blood cell images. Additionally, the modified LeNet-5 model is used in the feature extractor process to capture the essential characteristics of blood cells relevant to disorder classification. The convolutional neural network and bi-directional gated recurrent unit with attention (CNN-BiGRU-A) method is employed to classify and detect haematologic disorders. Finally, the CADHDD-SFLNHM model implements the pelican optimization algorithm (POA) method to fine-tune the hyperparameters involved in the CNN-BiGRU-A method.
Review of literature
In11, a computer-aided ALL recognition system utilizing a Whale Optimizer Algorithm-based SVM (WOA-SVM) was developed. Here, color-based K-means clustering is applied to segment WBC. The features are achieved by merging the projected and existing features to recognize the set of features. In12, a classification method that depends upon the EfficientNetB3 convolutional neural networks (CNNs) technique is developed to differentiate ALL as an automatic method, which undoubtedly changes the learning rate. The analysis organizes a traditional LR that equates the value of loss and training accuracy at the start of every epoch. Shams et al.13 propose a huge customized marked blood cell database and blood cell recognition in the peripheral blood smear imageries. A particular WBC-based image processing task has been trained to categorize the healthy and developed WBCs. An object recognition technique named You Only Look Once (YOLO) is trained on the new database to mechanically classify and detect blood cells into WBCs with other openly accessible databases. Kumar and Babulal14 developed an image analysis viewpoint. The main aim of the method is to improve an initial erythrocyte screening by investigating the colour, textural, and morphological features by the developed technique FC-TriSDR (FCM clustering model beside three ensembled classifiers- SVM, DT, and RBFN). In15, an Improved Haematological Diseases Classification utilizing the Dthe L (IHDC-DL) model is proposed. In a predefined EfficientNet DL method, an enhanced layer upsurges autonomous feature selection and classification by decreasing the inadequacy of computational. The technique also executes the IHDC-DL method utilizing dual blood cell databases.
Su et al.16 present a new analysis structure named ROI-BMC-DNNet. The study develops a pyramid segmentation network to seize patch images in the cell regions depending upon preceding pathological data. A simple but effective alignment technique is defined for multi-scale ROI, which is directed to uphold the accuracy of the semantics. Besides, a patch sampling technique and a patch quality assessing system are intended to certify the efficiency of the sampled patches. The authors17 develop a high-performance CNN attached with a dual-attention system, which well perceives and categorizes WBC in microscopic thick smear imageries. The proposed model aims to improve medical haematology methods and further medical analytic methods. This model employed a deep convolutional generative adversarial networks (DCGANs) technique to overwhelm the restrictions enforced by partial training data. A two-attention mechanism was used to improve effectiveness, generalization, and accuracy. Yadav et al.18 developed an image-processing model to separate RBCs from other blood products. The WBCs are mined utilizing the K-Medoids model, which is resilient to external disturbance. The calculation of granulometrics was employed to differentiate between red and WBCs. The extraction of features is utilized to obtain significant features, which help in categorization. These outcomes support a fast analysis of disorders like Sickle Cell, Iron Deficiency, Normochromic, Megaloblastic, and Hypochromic.
Despite the advancements in blood cell recognition techniques, several limitations remain. Many methods rely on specific algorithms or databases that may need to generalize better to diverse real-world data or variations in cell morphology. Additionally, some models require significant computational resources and complex training procedures, making them less efficient for large-scale deployment. Furthermore, there needs to be more integration across different blood cell types and diseases, limiting the comprehensiveness of the models. The reliance on specific feature extraction methods also hinders the adaptability of these systems to new, unanticipated conditions or data types. Future research could improve generalization, reduce computational costs, and address the gaps in multi-disease and multi-cell type classification.
The proposed method
This paper presents a novel CADHDD-SFLNHM approach using Blood Cell Images. The main aim of the CADHDD-SFLNHM approach is to enhance the detection and classification of haematologic disorders. The CADHDD-SFLNHM method accomplishes that through image preprocessing, a modified LeNet-5-based feature extractor, classification, and POA-based parameter tuning. Figure 1 represents the workflow of the CADHDD-SFLNHM method.
Fig. 1.

Workflow of CADHDD-SFLNHM approach.
SF-based Image Preprocessing
Primarily, the CADHDD-SFLNHM model performs image preprocessing using the SF technique to enhance the quality of blood cell images19. The SF is a commonly employed image preprocessing model in recognizing haematologic disorders over blood cell images. It improves the limits of cellular structures, making it simpler to classify and distinguish numerous blood cell types. By highlighting areas of high-intensity gradient, the SF enhances the prospect of features, which is critical for analyzing conditions like leukaemia, anaemia, and other blood-related diseases. This edge recognition aids in decreasing noise and emphasizing relevant patterns, enabling more precise extraction of features and classification in the following analysis phases. Generally, utilizing the SF as a preprocessing step improves the reliability and quality of haematologic disorder recognition.
Modified LeNet-5 feature extractor
Besides, the modified LeNet-5 model is utilized in the feature extractor process to capture the essential characteristics of blood cells relevant to disorder classification20. This model was chosen for its proven efficiency in image classification tasks, specifically in handling smaller, less complex datasets like blood cell images. Its architecture, which comprises convolutional and pooling layers, is effectual at capturing spatial hierarchies and local features within images, making it appropriate for detecting and distinguishing blood cell types. Unlike more complex models, LeNet-5 is relatively lightweight, mitigating computational demands and training time, which is significant for healthcare applications where quick results are essential. Furthermore, LeNet-5’s simplicity makes it easier to implement and tune, particularly for datasets with limited diversity, such as the four blood cell types. Although more advanced models like ResNet or DenseNet may give higher accuracy, LeNet-5 strikes a good balance between performance and efficiency for this specific task. Figure 2 illustrates the workflow of the LeNet-5 methodology.
Fig. 2.

Workflow of modified LeNet-5 model.
The concatenated LeNet5 method comprises three equal LeNet5 techniques, all handling the input data over convolutional sequences and FC layers. The bottom of the framework receives input layer data using a dimension of  , demonstrating grayscale size images of
  x
x pixels. Every LeNet5 approach follows a reliable framework. This method starts using a convolutional layer with activation of ReLU, six filters, and a kernel dimension of
  with similar spatial sizes as the input guarantees that the resultant feature maps contain similar spatial sizes for propagating gradients proficiently. The average pooling layer has accompanied this through the dimension of pooling
  . Consequently, an additional convolutional layer has been utilized using activation of ReLU, 16 filters, and a kernel dimension of
  , succeeded by an additional average pooling layer with a dimension of pooling
  . Every LeNet5 method contains the last output layer of two neurons with softmax activation, allowing dual classification. This complete layer’s sequence has been repeated 3 times for every concatenated method.
The resultant of the 3 LeNet5 methods are concatenated with a concatenated state, making a unified depiction of the in-between outputs. These concatenated outputs are then reformed with a layer of Reshape to have sizes (2, nets), while nets signify the amount of concatenated methods. Lastly, the resultant layer at the maximum of the framework gives the last output using a shape of (2, None), representing the dual classifier result. The order of processing, output, and input layer particulars are shown under.
Input Layer: This layer demonstrates the input data through the dimensions (128, 128, 1).
LeNet5 Method (Reiterated three Times): For every Concatenated method, the succeeding blocks, reiterated 3 times (nets
 in the presented method):
Convolutional Layer: six filters, kernel dimension
 , with average pooling (pooling dimension:
  ).
).Convolutional Layer: activation of ReLU, kernel dimension
 , 16 filters, with average pooling (pooling dimension:
  ).
).Flattening Layer: Flattening the output.
FC Layer: 120 neurons, activation of ReLU.
FC Layer: 84 neurons, activation of ReLU.
Output Layer: Two neurons with activation of softmax.
Concatenated Input: A-line associates the input layer with every concatenated LeNet5 method, representing that a similar input connects with every.
Concatenate Layer: At the top of the LeNet5 blocks, there would be a block demonstrating the concatenated layer, merging the concatenated methods outputs.
Reshape Layer: In the top, the concatenate layer would be a block demonstrating the Reshape layer, redesigning the concatenate outcome to take sizes (2 nets).
Output Layer: Above, there would be the last resultant layer by shape (2, None).
Hybrid of CNN-BiGRU-A method
For the classification and detection of haematologic disorders, the CNN-BiGRU-A method is employed21. This technique was chosen because it can effectively integrate the merits of CNNs and BiGRUs for feature extraction and sequential data processing. CNNs outperform at extracting spatial features from blood cell images, enabling the model to capture crucial patterns and characteristics for classification. The BiGRU component improves the ability of the model to capture temporal or sequential dependencies, allowing for more robust feature learning across diverse blood cell types and conditions. This incorporation enhances the model’s accuracy by leveraging local and global data. Additionally, BiGRUs, by processing data in both forward and backward directions, provide better context understanding related to traditional unidirectional models, making them ideal for handling complex and varied blood cell data. This hybrid model balances computational efficiency and performance, providing a practical solution for detecting haematologic disorders. Figure 3 demonstrates the structure of the CNN-BiGRU-A method.
Fig. 3.

Architecture of CNN-BiGRU-A method.
CNN is typically a multiple-layered perceptron and one of the characteristic models of DL. It comprises input, convolutional, pooling, FC, and output layers.
Input layer: This layer serves as the point of entry for the completed network and typically requires preprocessing of the raw data (the preprocessing data will be included in the Third section of this paper).
Convolution layer: This layer includes the activation layers and convolution computation. This convolution computation contains matrix operations amongst the convolution kernel matrix and consistent location matrices of data, with inputs signified as  , the convolution kernel as
  , and described by
  , Here
  denotes the convolution operator. The equation is as shown:
 |
1 |
The functions of the activation layer to non-linearly convert the outcome from the convolution computation over an activation function:
 |
2 |
Where  symbolizes a non-linear activation function by commonly utilized selections with Sigmoid, ReLU, tanh, and their differences.
Pooling layer: This layer’s primary function is compressing data and reducing neural network computations and parameters while avoiding overfitting. A normal pooling model is  Pooling, which uses maximal values inside pooled areas to underline important features in data. Additional pooling models include spatial pyramid, average, random, and overlapping pooling.
FC layer: Neurons in this FC layer started connections with each neuron in previous layers; its part is to incorporate distributed feature representations learned by the network and map them into sample label space.
GRU networks characterize an LSTM network’s optimization, which is characterized by modelled structures that experience lower computational costs while showing improved convergence rates.
The gated update equation for GRU is as demonstrated:
 |
3 |
 |
4 |
 |
5 |
 |
6 |
Here,  signifies the input vector at
  time
time and
and  represent the update gate and reset gate.
  refers to the state of the hidden layer (HL), while
  signifies the candidate state of HL.
  , and
, and  characterize the weighted matrix, and
  , and
, and  are biased vectors.
Nevertheless, GRU networks are restricted to data processing in a solitary direction, depending only on previous data to make predictions. Conversely, the BiGRU network contains either forward or backward neural networks, permitting it to utilize information from previous or following time steps. It enables more precise predictions near the real values.
It includes an input layer, backward HL, and forward HL, the output layer. The input layer concurrently feeds input data into either the forward or backward HLs at every time step, allowing bi-directional data flow over the GRU network.
At time  , BiGRU’s hidden output has been controlled by dual independent GRUs:
 |
7 |
 |
8 |
 |
9 |
Here,  and
and  signify the output condition of the forward and backward GRU at
  time; correspondingly,
  and
and  stand for the weighted matrix, and
  implies the biased vector.
It simulates the human brain’s allocation of resources in concentrating attention on particular areas while ignoring or reducing others to obtain related information efficiently without interference from unrelated data. The basic idea includes allocating weights depending on input data significance for a complete concentration on critical portions, resulting in enhanced method performance and prediction capability.
Let  be the input information vector, given a task-related query vector
  , and calculate the attention distribution (weight coefficient)
  of the input information:
 |
10 |
Now  denotes attention score function, and softmax is the normalized exponential function. During softmax processing, the uniquely designed score has been transformed into a probability distribution through the ownership sum weight as one, which emphasizes the weight of significant elements. The Attention score function
 use techniques like the dot product, addition, bilinear, scaled dot product model, etc. Here, the addition model has been selected:
 |
11 |
 , and
, and  are learnable parameters inside the neural network. Lastly, the output of Attention layer
  includes a weighted summation of input information with weighted coefficients from attention distribution:
 |
12 |
Hyperparameter tuning using the POA model
Finally, the presented CADHDD-SFLNHM model employs POA to fine-tune the hyperparameters involved in the CNN-BiGRU-A method. POA is an effective optimization technique known for its ability to explore an ample search space and converge on optimal solutions efficiently, enhancing model accuracy. By integrating POA, the model avoids the requirement for manual tuning and accelerates the process of finding the optimum hyperparameter combination. This optimization results in an enhanced generalization and robustness of the CNN-BiGRU-A model in detecting haematologic disorders. Moreover, POA is computationally less expensive than conventional optimization techniques such as grid search, making it more appropriate for real-time applications. Overall, the integration of POA with CNN-BiGRU-A confirms enhanced performance, faster convergence, and better adaptability to varied datasets. Figure 4 specifies the workflow of the POA technique.
Fig. 4.
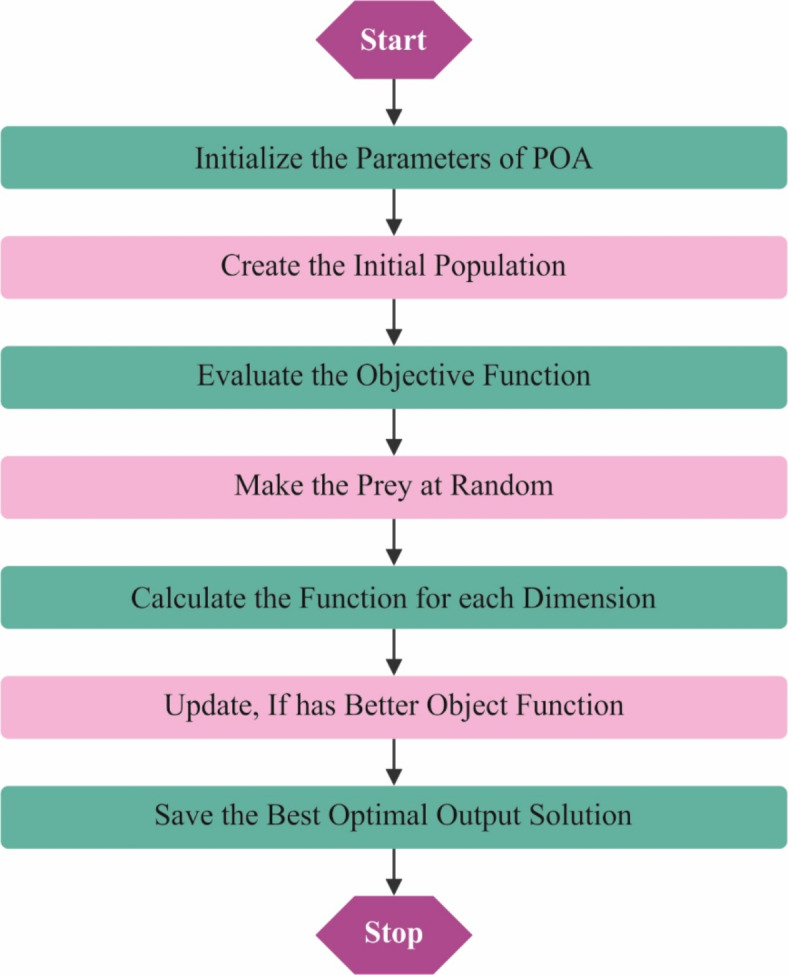
Working flow of the POA model.
POA attains local exploitation and global exploration of the optimum performance by pretending the pelican flock’s managing prey and surface fight behaviour correspondingly and attains a relational balance between exploitation and exploration to gain the optimum solution22. The POA’s optimizer search stages are as demonstrated.
Stage 1: Initialization of Pelican flock. Every pelican inside the pelican flock signifies a candidate outcome, and the mathematic formulation for the pelican flock initialized is as shown:
 |
13 |
Whereas  denotes the value of
  variable of
  candidate performance;
  signifies randomly generated number in
  and
and  represent lower and upper bounds of the
  variable;
  symbolizes pelican group counts, for example, the candidate solution counts; and
  refers to variable counts of the problem-to-solve:
The primary  candidate outcome
  is formulated below:
 |
14 |
Stage 2: Approach the prey to attain exploration globally. This POA arbitrarily makes the location of the prey within the solution space; in addition, the pelican flock transfers near the prey position using the succeeding mathematic representation:
 |
15 |
Here,  stands for the upgraded value of the
  variable of the
  candidate solution;
  denotes the value of the
  variable of prey;
  signify an arbitrary value equivalent to 1 or 2;
  and
and  represent prey’s fitness function (FF) values and
  pelican, respectively.
When the FF value of the initial  candidate outcome has been enhanced after upgrading their location, substitute
  with
with  ; otherwise,
  has remained unchanged.
Stage 3: Surface fight to attain local exploitation. POA to additionally estimate the optimum performance, the location of the pelican has been updated with the succeeding Eq. (16):
 |
16 |
Now  means constant, typically 0.2;
  and
and  correspondingly represent the maximum and present iteration count. When the FF value has been enhanced after updating the location, replacing
  with
with  , or
, or  does not vary.
Stage 4: Updating the optimum location. When the locations of each candidate’s performance are upgraded to the best outcome for the present iteration count, their FF values are considered. Subsequently, these model developments to the following iteration, by these sequences enduring till the iteration stopping condition has been achieved. The POA grows a fitness function (FF) for attaining greater classifier proficiencies. It solves a positive value by suggesting better results for candidate performances. In this paper, the decrease in classifier error ratio is supposed to be FF.
The POA fine-tunes hyperparameters more efficiently than conventional optimization methods such as grid or random search by balancing local exploitation and global exploration. Unlike grid or random search, which exhaustively or randomly search through a predefined set of hyperparameter values, POA intelligently adjusts the position of candidate solutions (pelicans) based on prey locations and surface fight behaviour. This allows POA to quickly converge on optimal solutions by iteratively refining candidate positions according to fitness values. By combining global exploration through the prey approach and local exploitation via surface fight, POA avoids getting trapped in local minima, giving faster convergence and enhanced optimization of hyperparameters.
 |
17 |
Result analysis and discussion
The experimental result analysis of the CADHDD-SFLNHM model is performed under a benchmark database23. The dataset contains 12,500 augmented images of blood cells, with approximately 3,000 images for each of four cell types: Eosinophil, Lymphocyte, Monocyte, and Neutrophil. It also comprises 410 original images with subtype labels and bounding boxes, 2,500 augmented images and additional subtype labels for further classification tasks. Table 1 describes the dataset. Figure 5 signifies the sample images.
Table 1.
Details on database.
| Cell Types | No. of Images |
|---|---|
| Eosinophil | 2000 |
| Lymphocyte | 2000 |
| Monocyte | 2000 |
| Neutrophil | 2000 |
| Total Images | 8000 |
Significant values are in bold.
Fig. 5.

Sample images of (a) Eosinophil, (b) Lymphocyte, (c) Monocyte, and (d) Neutrophil.
Figure 6 presents the classifier outcomes of the CADHDD-SFLNHM method on 80%TRASE and 20%TESSE. Figure 6a and b illustrates the confusion matrices with accurately recognizing and categorizing four classes. Figure 6c demonstrates the PR curve, indicating an excellent solution across all classes. Finally, Fig. 6d proves the ROC evaluation, displaying capable results with a high ROC curve for all classes.
Fig. 6.

80%TRASE and 20%TESSE (a,b) Confusion matrices and (c,d) Curves of PR and ROC.
In Table 2; Figs. 7 and 8, the haematologic disorders recognition results of the CADHDD-SFLNHM method with 80%TRASE and 20%TESSE are clearly shown. The experimental value suggested that the CADHDD-SFLNHM approach has correctly classified and identified four classes. With 80%TRASE, the CADHDD-SFLNHM approach reaches average  ,
,  ,
,  ,
,  , and
, and  of 97.69%, 95.40%, 95.35%, 95.34%, and 95.36%, respectively. Moreover, with 20%TESSE, the CADHDD-SFLNHM approach obtains average
 ,
,  ,
,  ,
,  , and
, and  of 97.91%, 95.81%, 95.86%, 95.83%, and 95.83%, correspondingly.
Table 2.
Haematologic disorders detection outcomes of CADHDD-SFLNHM method under 80%TRASE and 20%TESSE.
| Classes | Accu y | Prec n | Reca l | F1Score | G Mean |
|---|---|---|---|---|---|
| TRASE (80%) | |||||
| Eosinophil | 96.58 | 95.90 | 90.03 | 92.87 | 92.92 |
| Lymphocyte | 98.28 | 95.76 | 97.44 | 96.59 | 96.60 |
| Monocyte | 98.16 | 94.42 | 98.51 | 96.42 | 96.45 |
| Neutrophil | 97.73 | 95.50 | 95.44 | 95.47 | 95.47 |
| Average | 97.69 | 95.40 | 95.35 | 95.34 | 95.36 |
| TESSE (20%) | |||||
| Eosinophil | 97.12 | 95.34 | 93.51 | 94.42 | 94.42 |
| Lymphocyte | 98.50 | 96.99 | 96.99 | 96.99 | 96.99 |
| Monocyte | 98.44 | 95.23 | 98.44 | 96.81 | 96.82 |
| Neutrophil | 97.56 | 95.70 | 94.50 | 95.09 | 95.10 |
| Average | 97.91 | 95.81 | 95.86 | 95.83 | 95.83 |
Significant values are in bold.
Fig. 7.

Average of CADHDD-SFLNHM method under 80%TRASE.
Fig. 8.
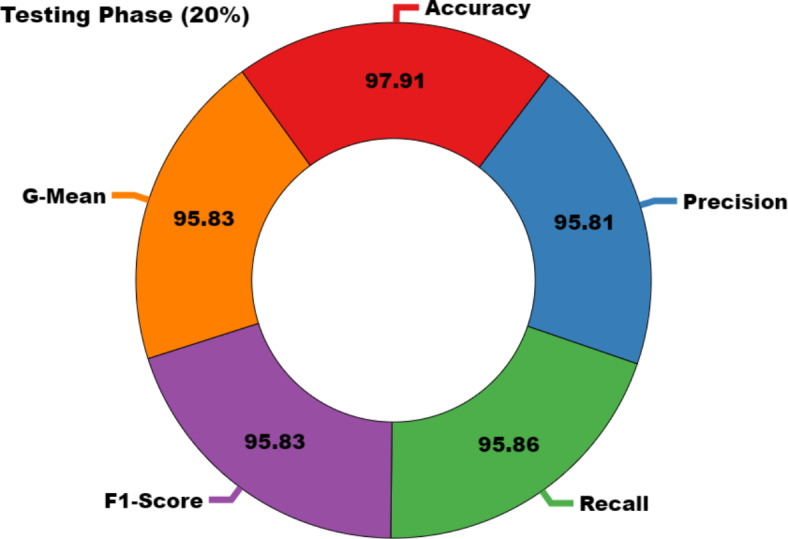
Average of CADHDD-SFLNHM method under 20% TESSE.
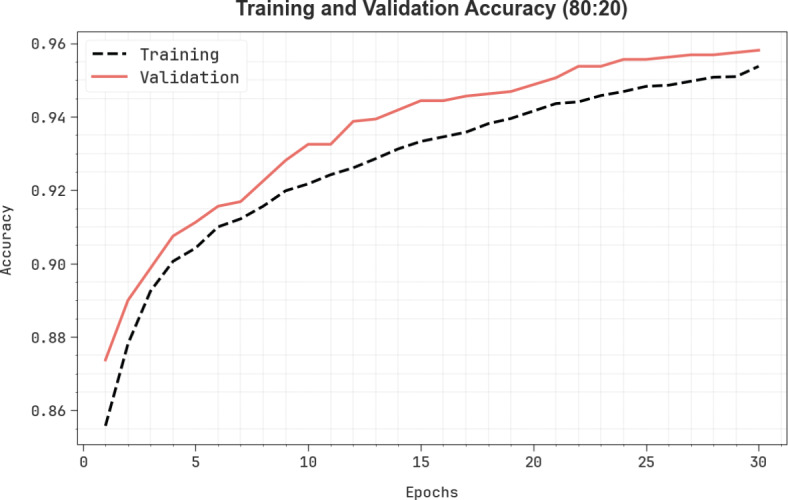
In Fig. 9, the TRA  (TRAAY) and validation
  (VLAAY) outcomes of the CADHDD-SFLNHM method under 80%TRASE and 20%TESSE are displayed. The
  values are calculated throughout 0–30 epochs. The outcome highlighted that the TRAAY and VLAAY outcomes depict a rising tendency that notified the ability of the CADHDD-SFLNHM method with more excellent outcomes under various iterations. Besides, the TRAAY and VLAAY stay closer at epochs, indicating lesser overfitting and displaying the more remarkable result of the CADHDD-SFLNHM approach, guaranteeing consistent prediction on concealed instances.
Fig. 9.
 curve of CADHDD-SFLNHM method with 80%TRASE and 20%TESSE
Figure 10 shows the TRA loss (TRALO) and VLA loss (VLALO) outcomes of the CADHDD-SFLNHM methodology at 80%TRASE and 20%TESSE. The loss values are computed throughout 0–30 epochs. The TRALO and VLALO outcomes represent a reducing tendency, which indicates the ability of the CADHDD-SFLNHM approach to balance a trade-off among appropriate and generalized data.
Fig. 10.
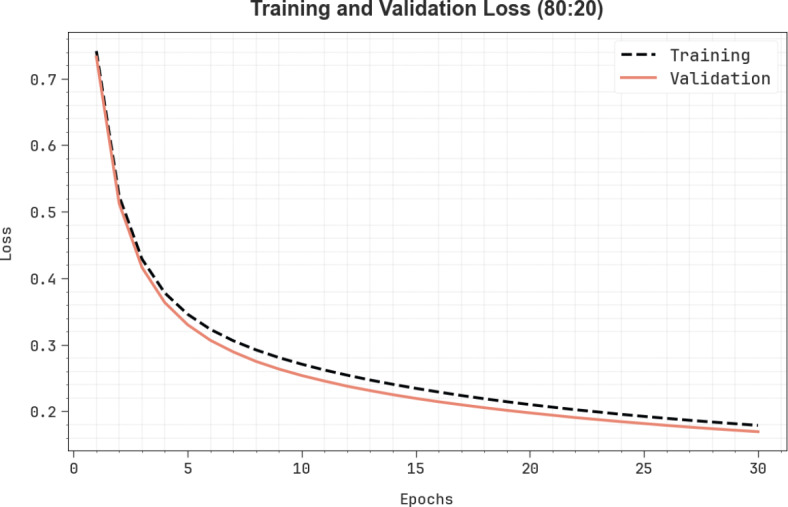
Loss curve of CADHDD-SFLNHM method with 80%TRASE and 20%TESSE.
Figure 11 presents the classifier results of the CADHDD-SFLNHM method on 70%TRASE and 30%TESSE. Figure 11a and b shows the confusion matrices with the detection and classification of all four classes. Figure 11c displays the PR values, indicating maximum performance across all four classes. Lastly, Fig. 11d proves the ROC valuation, showing accomplished outcomes with a high ROC curve for various class labels.
Fig. 11.

70%TRASE and 30%TESSE (a,b) Confusion matrices and (c,d) Curves of PR and ROC.
Table 3; Fig. 12 depict the haematologic disorders detection outcomes of the CADHDD-SFLNHM model with 70%TRASE and 30%TESSE. The experimental value suggested that the CADHDD-SFLNHM model has been appropriately classified and recognized as having four class labels. With 70%TRASE, the CADHDD-SFLNHM approach reaches average  ,
,  ,
,  ,
,  , and
, and  of 96.17%, 92.41%, 92.34%, 92.35% and 92.36% individually. Besides, 30%TESSE, the CADHDD-SFLNHM approach achieves average
  ,
,  ,
,  ,
,  , and
, and  of 96.56%, 93.15%, 93.15%, 93.15 and 93.15%, respectively.
Table 3.
Haematologic disorders detection of CADHDD-SFLNHM method under 70%TRASE and 30%TESSE.
| Class | Accu y | Prec n | Reca l | F1Score | G Mean |
|---|---|---|---|---|---|
| TRASE (70%) | |||||
| Eosinophil | 95.96 | 91.17 | 92.86 | 92.01 | 92.01 |
| Lymphocyte | 94.75 | 87.96 | 91.26 | 89.58 | 89.60 |
| Monocyte | 96.86 | 94.89 | 92.63 | 93.75 | 93.75 |
| Neutrophil | 97.11 | 95.62 | 92.59 | 94.08 | 94.09 |
| Average | 96.17 | 92.41 | 92.34 | 92.35 | 92.36 |
| TESSE (30%) | |||||
| Eosinophil | 96.71 | 92.76 | 94.16 | 93.45 | 93.46 |
| Lymphocyte | 95.13 | 90.55 | 90.41 | 90.48 | 90.48 |
| Monocyte | 97.33 | 94.44 | 94.44 | 94.44 | 94.44 |
| Neutrophil | 97.08 | 94.85 | 93.61 | 94.22 | 94.23 |
| Average | 96.56 | 93.15 | 93.15 | 93.15 | 93.15 |
Significant values are in bold.
Fig. 12.

Average of CADHDD-SFLNHM method under 70%TRASE and 30%TESSE.
Figure 13 shows the TRAAY and VLAAY curves of the CADHDD-SFLNHM methodology at 70%TRASE and 30%TESSE. The  values are measured throughout 0–30 epochs. The outcome demonstrated that the TRAAY and VLAAY outcomes depict a rising trend that informed the competence of the CADHDD-SFLNHM model with more remarkable outcomes over distinct iterations. Besides, the TRAAY and VLAAY remain closer across the epochs, demonstrating lower overfitting, and display the superior performance of the CADHDD-SFLNHM model, guaranteeing consistent prediction on unseen instances.
Fig. 13.

 curve of CADHDD-SFLNHM method with 70%TRASE and 30%TESSE
Figure 14 depicts the TRALO and VLALO outcomes of the CADHDD-SFLNHM methodology under 70%TRASE and 30%TESSE. The loss ratio is measured across intervals of 0–30 epochs. The TRALO and VLALO values represent a minimizing pattern, which indicates the capability of the CADHDD-SFLNHM approach to balance a trade-off among appropriate and generalized data.
Fig. 14.

Loss curve of CADHDD-SFLNHM method with 70%TRASE and 30%TESSE.
In Table 4; Fig. 15, the experimental outcomes of the CADHDD-SFLNHM approach with recent methods are specified24–26. The table values demonstrate that the CNN-ResNet50 technique has shown inferior performance with  ,
,  ,
,  , and
, and  of 74.58%, 81.00%, 74.00%, and 73.00%, individually. At the same time, the MobileNetV2 approach has gained moderately increased outcomes with
  ,
,  ,
,  , and
, and  of 78.47%, 78.00%, 78.00%, and 78.00%, correspondingly. In addition, the CNN-Inception V3, RCNN, SRGAN-EfficientNetB7, GoogleNet, and VGG16 methodologies have achieved moderately closer performance. Meanwhile, the InceptionV3 method has resulted in substantial results with
  ,
,  ,
,  , and
, and  of 97.20%, 92.58%, 93.23%, and 93.88%, respectively. But the CADHDD-SFLNHM model outperforms the other methods with the highest
  ,
,  ,
,  , and
, and  of 97.91%, 92.81%, 95.86%, and 95.83%, individually.
Table 4.
Comparative outcome of CADHDD-SFLNHM approach with other methods.
| Model | Accu y | Reca l | F1Score | G Mean |
|---|---|---|---|---|
| SRGAN-EfficientNetB7 | 89.97 | 92.71 | 90.69 | 86.06 |
| CNN-Inception V3 | 85.41 | 88.85 | 89.70 | 89.58 |
| CNN-ResNet50 | 74.58 | 81.00 | 74.00 | 73.00 |
| GoogleNet Model | 90.86 | 86.39 | 89.33 | 89.61 |
| RCNN Classifier | 86.82 | 86.44 | 92.58 | 91.17 |
| MobileNetV2 Model | 78.47 | 78.00 | 78.00 | 78.00 |
| InceptionV3 Method | 97.20 | 92.58 | 93.23 | 93.88 |
| VGG16 Algorithm | 96.09 | 91.11 | 92.60 | 92.39 |
| CADHDD-SFLNHM | 97.91 | 95.81 | 95.86 | 95.83 |
Fig. 15.

Comparative outcome of CADHDD-SFLNHM approach with other methods.
The computational complexity of the proposed CADHDD-SFLNHM model is compared to baseline models using the processing times (PT) in Table 5; Fig. 16. The results indicate that models such as VGG16, SRGAN-EfficientNetB7, and InceptionV3 portray higher PT values of 54.24 min, 50.58 min, and 47.87 min, respectively. Meanwhile, CNN-ResNet50, GoogleNet, and RCNN models illustrate similar PT values around 47.34 min, 46.35 min, and 43.38 min. MobileNetV2 and CNN-Inception V3 also report significant PTs of 38.46 min and 35.42 min. On the contrary, the CADHDD-SFLNHM approach attains superior performance with the lowest PT of just 20.46 min. Therefore, the CADHDD-SFLNHM approach is appropriate for the automated recognition of haematologic disorders.
Table 5.
PT outcome of CADHDD-SFLNHM approach with recent methods.
| Model | PT (min) |
|---|---|
| SRGAN-EfficientNetB7 | 50.58 |
| CNN-Inception V3 | 35.42 |
| CNN-ResNet50 | 47.34 |
| GoogleNet Model | 46.35 |
| RCNN Classifier | 43.38 |
| MobileNetV2 Model | 38.46 |
| InceptionV3 Method | 47.87 |
| VGG16 Algorithm | 54.24 |
| CADHDD-SFLNHM | 20.46 |
Fig. 16.

PT outcome of CADHDD-SFLNHM approach with other methods.
Conclusion
This study presents a novel CADHDD-SFLNHM approach using Blood Cell Images. SF model performed the preprocessing. Furthermore, the LeNet-5 model was employed for feature extraction. Moreover, the CNN-BiGRU-A method was employed to classify and detect haematologic disorders. Also, the POA-based model was utilized to fine-tune the hyperparameters involved in the CNN-BiGRU-A method. The experimental result analysis of the CADHDD-SFLNHM model was accomplished using a benchmark database. The performance validation of the CADHDD-SFLNHM model portrayed a superior accuracy value of 97.91% over other techniques.
Acknowledgments
The authors extend their appreciation to the Deanship of Research and Graduate Studies at King Khalid University for funding this work through Large Research Project under grant number RGP2/243/45. Princess Nourah bint Abdulrahman University Researchers Supporting Project number (PNURSP2025R729), Princess Nourah bint Abdulrahman University, Riyadh, Saudi Arabia. The authors extend their appreciation to the Deanship of Scientific Research at Northern Border University, Arar, KSA for funding this research work through the project number “NBU-FFR-2025-2903-01. The authors would like to thank the Deanship of Scientific Research at Majmaah University for supporting this work under Project No. R-2025-1516. The authors are thankful to the Deanship of Graduate Studies and Scientific Research at University of Bisha forsupporting this work through the Fast-Track Research Support Program.
Author contributions
Jamal Alsamri: Conceptualization, methodology development, experiment, formal analysis, investigation, writing. Hamed Alqahtani: Formal analysis, investigation, validation, visualization, writing. Ali M. Al-Sharafi: Formal analysis, review and editing. Ahmad A. Alzahrani: Methodology, investigation. Khalid Nazim Abdul Sattar: Review and editing.Menwa Alshammeri: Discussion, review and editing. Marwa Obayya: Discussion, review and editing. Abdulbasit A. Darem: Conceptualization, methodology development, investigation, supervision, review and editing.All authors have read and agreed to the published version of the manuscript.
Data availability
The data that support the findings of this study are openly available in Kaggle repository at https://www.kaggle.com/datasets/paultimothymooney/blood-cells.
Declarations
Competing interests
The authors declare no competing interests.
Ethics approval
This article does not contain any studies with human participants performed by any of the authors.
Footnotes
Publisher’s note
Springer Nature remains neutral with regard to jurisdictional claims in published maps and institutional affiliations.
References
- 1.Brundha, M., Pathmashri, V. & Sundari, S. Quantitative changes of red blood cells in cancer patients under palliative radiotherapy-a retrospective study. Res. J. Pharm. Technol.12, 687–692 (2019). [Google Scholar]
- 2.Aliko, V., Qirjo, M., Sula, E., Morina, V. & Faggio, C. Antioxidant defense system, immune response and erythron profle modulation in gold fsh, Carassius auratus, afer acute manganese treatment. Fish. Shellfsh Immunol.76, 101–109 (2018). [DOI] [PubMed] [Google Scholar]
- 3.Labati, R. D., Piuri, V. & Scotti, F. All-IDB: the acute lymphoblastic leukemia image database for image processing, in Proceedings of the 2011 18th IEEE International Conference on Image Processing, Brussels, Belgium, September (2022).
- 4.Tran, T., Kwon, O. H., Kwon, K. R., Lee, S. H. & Kang, K. W. Blood cell images segmentation using deep learning semantic segmentation, in Proceedings of the IEEE International Conference on Electronics and Communication Engineering (ICECE), pp. 13–16, Xi’an, China, December 2018. (2018).
- 5.Qin, F. et al. Fine-grained leukocyte classifcation with deep residual learning for microscopic images, Computer Methods and Programs in Biomedicine, 162, pp. 243–252, (2018). [DOI] [PubMed]
- 6.Gupta, U. & Sharma, R. Multi-sensor Data Fusion based Medical Data classification model using Gorilla troops optimization with deep learning. Full Length Article. 15 (1), 08–08 (2024). [Google Scholar]
- 7.Sheng, B. et al. A blood cell dataset for lymphoma classifcation using faster R-CNN. Biotechnol. Biotechnol. Equip.34, 413–420 (2020). [Google Scholar]
- 8.Mohamed, M. & AbdelAal, S. I. Auto-ASD detector: exploiting Computational Intelligence for autism spectrum disorders detection in children via facial analysis. Full Length Article, 3(1), 42 – 2. (2023).
- 9.Hegde, R. B., Prasad, K. H., Hebbar, H., Singh, M. K. & Sandhya, I. Automated decision support system for detection of leukemia from peripheral blood smear images. J. Digit. Imaging. 33 (2), 361–374 (2019). [DOI] [PMC free article] [PubMed] [Google Scholar]
- 10.Baig, R., Rehman, A., Almuhaimeed, A., Alzahrani, A. & Rauf, H. T. Detection malignant leukemia cells using microscopic blood smear images: a deep learning approach. Appl. Sceinces. 12, 6317 (2022). [Google Scholar]
- 11.Saikia, R., Sarma, A. & Shuleenda Devi, S. Optimized Support Vector Machine Using Whale Optimization Algorithm for Acute Lymphoblastic Leukemia Detection from Microscopic Blood Smear Images. SN Computer Science, 5(5), p.439. (2024).
- 12.Abd El-Ghany, S., Elmogy, M. & El-Aziz, A. A. Computer-aided diagnosis system for blood diseases using efficientnet-b3 based on a dynamic learning algorithm. Diagnostics, 13(3), p.404. (2023). [DOI] [PMC free article] [PubMed]
- 13.Shams, U. A. et al. Bio-net dataset: AI-based diagnostic solutions using peripheral blood smear images. Blood Cells, Molecules, and Diseases, 105, p.102823. (2024). [DOI] [PubMed]
- 14.Kumar, P. & Babulal, K. S. Hematological image analysis for segmentation and characterization of erythrocytes using FC-TriSDR. Multimedia Tools Appl.82 (5), 7861–7886 (2023). [Google Scholar]
- 15.Jagtap, N. S. et al. Deep learning-based blood cell classification from microscopic images for haematological disorder identification. Multimedia Tools and Applications, pp.1–28. (2024).
- 16.Su, J. et al. Roi-bmc-dnnet: An efficient automatic analysis model of whole-slide scanned bone marrow aspirate images for the diagnosis of hematological disorders. Biomedical Signal Processing and Control, 86, p.105243. (2023).
- 17.Khan, S. et al. Efficient leukocytes detection and classification in microscopic blood images using convolutional neural network coupled with a dual attention network. Computers in Biology and Medicine, 174, p.108146. (2024). [DOI] [PubMed]
- 18.Yadav, V., Ganesh, P. & Thippeswamy, G. Determination and categorization of Red Blood cells by computerized framework for diagnosing disorders in the blood. J. Intell. Fuzzy Syst., (Preprint), 1–13. (2023).
- 19.Aqrawi, A. A. & Boe, T. H. Improved fault segmentation using a dip guided and modified 3D Sobel filter. In SEG Technical Program Expanded Abstracts 2011 (999–1003). Society of Exploration Geophysicists. (2011).
- 20.Jaganathan, D., Balsubramaniam, S., Sureshkumar, V. & Dhanasekaran, S. Concatenated Modified LeNet Approach for Classifying Pneumonia Images. Journal of Personalized Medicine, 14(3), p.328. (2024). [DOI] [PMC free article] [PubMed]
- 21.Sun, W. et al. Clock Bias Prediction of Navigation Satellite Based on BWO-CNN-BiGRU-Attention Model. (2024).
- 22.Deng, K. et al. An Analytical Approach for IGBT Life Prediction Using Successive Variational Mode Decomposition and Bidirectional Long Short-Term Memory Networks. Electronics, 13(20), 4002. (2024).
- 23.https://www.kaggle.com/datasets/paultimothymooney/blood-cells
- 24.Ferdousi, J., Lincoln, S. I., Alom, M. K. & Foysal, M. A deep learning approach for white blood cells image generation and classification using SRGAN and VGG19. Telematics and Informatics Reports, 100163. (2024).
- 25.Khan, R. U. et al. An intelligent neural network model to detect red blood cells for various blood structure classification in microscopic medical images. Heliyon, 10(4). (2024). [DOI] [PMC free article] [PubMed]
- 26.Saidani, O. et al. White blood cells classification using multi-fold preprocessing and optimized CNN model. Scientific Reports, 14(1), 3570. (2024). [DOI] [PMC free article] [PubMed]
Associated Data
This section collects any data citations, data availability statements, or supplementary materials included in this article.
Data Availability Statement
The data that support the findings of this study are openly available in Kaggle repository at https://www.kaggle.com/datasets/paultimothymooney/blood-cells.