Abstract
Cellular senescence is a hallmark for cancers, particularly in lung adenocarcinoma (LUAD). This study developed a risk model using senescence signature genes for LUAD patients. Based on the RNA-seq, clinical information and mutation data of LUAD patients collected from the TCGA and GEO database, we obtained 102 endotheliocyte senescence-related genes. The “ConsensusClusterPlus” R package was employed for unsupervised cluster analysis, and the “limma” was used for the differentially expressed gene (DEG) analysis. A prognosis model was created by univariate and multivariate Cox regression analysis combined with Lasso regression utilizing the “survival” and “glmnet” packages. KM survival and receiver operator characteristic curve analyses were conducted applying the “survival” and “timeROC” packages. “MCPcounter” package was used for immune infiltration analysis. Immunotherapy response analysis was performed based on the IMvigor210 and GSE78220 cohort, and drug sensitivity was predicted by the “pRRophetic” package. Cell invasion and migration were tested by carrying out Transwell and wound healing assays. According to the results, a total of 32 genes related to endotheliocyte senescence were screened to assign patients into C1 and C2 subtypes. The C2 subtype showed a significantly worse prognosis and an overall higher somatic mutation frequency, which was associated with increased activation of cancer pathways, including Myc_targets2 and angiogenesis. Then, based on the DEGs between the two subtypes, we constructed a five-gene RiskScore model with a strong classification effectiveness for short- and long-term OS prediction. High- and low-risk groups of LUAD patients were classified by the RiskScore. High-risk patients, characterized by lower immune infiltration, had poorer outcomes in both training and validation datasets. The RiskScore was associated with the immunotherapy response in LUAD. Finally, we found that potential drugs such as Cisplatin can benefit high-risk LUAD patients. In-vitro experiments demonstrated that silencing of Angiopoietin-like 4 (ANGPTL4), Gap Junction Protein Beta 3 (GJB3), Family with sequence similarity 83-member A (FAM83A), and Anillin (ANLN) reduced the number of invasive cells and the wound healing rate, while silencing of solute carrier family 34 member 2 (SLC34A2) had the opposite effect. This study, collectively speaking, developed a prognosis model with senescence signature genes to facilitate the diagnosis and treatment of LUAD.
Keywords: Lung adenocarcinoma (LUAD), ConsensusClusterPlus, Immune-infiltration, Senescence signature, RiskScore
Subject terms: Lung cancer, Tumour immunology
Introduction
Lung cancer is a leading cause contributing to global cancer mortality. Statistics revealed that lung cancer accounts for approximately 12.4% of all new cancer cases diagnosed in 2020 worldwide1,2. Lung adenocarcinoma (LUAD), notable for its high invasiveness, aggressiveness and resistance to therapy, is the most frequently detected type of lung cancer3,4. Currently, radiotherapy, chemotherapy and radical resection are the common clinical treatment methods for LUAD5. Despite these interventions, the CONCORD-3 survey reported that the 5-year overall survival (OS) rate for LUAD patients in most countries remains below 20%6. Furthermore, according to the Surveillance, Epidemiology, and End Results (SEER) data, the survival rate for those with metastatic LUAF is under 5%7. Molecularly targeted therapies have improved the treatment of LUAD8, for instance, crizotinib is an inhibitor of anaplastic lymphoma kinase (ALK) that has higher efficacy compared to standard platinum-based chemotherapy in non-small cell lung cancer (NSCLC) patients with ALK rearrangements9. However, the emergence of drug resistance will limit the efficacy of such treatments. Studies have shown that resistance to immunotherapeutic agents such as ALK inhibitors arises from gene mutations, changes in tumor microenvironment (TME), and alterations in other signaling pathways10,11. As a result, there is a growing need for combination therapy and personalized treatment to improve the treatment outcomes12. LUAD is categorized into four stages: I, II, III, and IV13. Research indicated that the survival of LUAD patients with stage I/II exhibit is significantly better than patients with stage III/IV14,15. Despite the identification of numerous genes for LUAD tumorigenesis, only a select few, including ALK, have been translated into clinical applications. This is mainly attributed to the challenges such as inadequate validation, complexity of targeting specific molecules, immune evasion by tumor cells, and lack of clinical data. Hence, there is a need to develop reliable prognostic signatures based on tumor immune evasion and cancer-specific genes and to explore the molecular pathways of these genes, particularly those associated with immune checkpoints such as PD-L1.
Cellular senescence is a crucial physiological process that inhibits the proliferation of abnormal or damaged cells by inducing tissue remodeling16. Replicative senescence is a process by which normal cells undergo a stable proliferative arrest following multiple cell divisions17. Senescent cells usually exhibit a metabolically active and enlarged morphology and multi-nucleation, which facilitate chromatin remodeling and the formation of senescence-associated heterochromatic foci (SAHF), thereby regulating the senescence state18. A pivotal aspect of cellular senescence is the senescence-associated secretory phenotype (SASP), which involves multifaceted biological changes. SASP maintains the senescent state through various mechanisms, for instance, by influencing cell cycle by activating tumor suppressor pathways associated with p53 and p16INK4A (p16)19,20, affecting intracellular environment through promoting the activity of senescence-associated β-galactosidase (SA-β-gal), inducing cell cycle arrest through upregulating the level of CDK inhibitors21, and modulating inflammatory signaling through elevating interleukin-6 (IL-6) expression. The progressive deterioration of endothelial cells is a hallmark of physiological aging, while chronic low-grade inflammation, known as “inflamm-aging,” represents another feature of the aging process22. In addition, the identification of key signatures associated with senescence and of senescence induction has been integrated into anti-cancer research23,24. Impaired antitumor immunity is a sign of immune-aging25, as exemplified by the decline in T cell function caused by age progression. Hence, a senescence-correlated gene signature might serve as a potential prognosis phenotype for the risk prognostic model development. This study, therefore, aimed to discover prognostic biomarkers of LUAD based on the endotheliocyte senescence-related gene set and to establish a prognostic model for LUAD.
This study used the genes related to endothelial senescence characteristics to divide LUAD samples into two molecular subtypes, and their mutation profiles were compared. The prognostic implications of differentially expressed genes between the two subtypes were analyzed by conducting functional analysis. Furthermore, the prognostic biomarkers of LUAD were determined based on the gene set related to endothelial cell senescence and established a prognostic model. The patients were divided by the median value of the model into high-risk and low-risk groups. Next, the study compared the differences in immune infiltration, enriched pathways, and drug sensitivity between the two risk groups. The present research classified molecular subtypes and risk groups for LUAD and discovered novel biomarkers, providing novel insights for the targeted and personalized treatment of LUAD.
Materials and methods
Data acquisition and preprocessing
In this study, the data analyzed were primarily sourced from TCGA and GEO databases26. We downloaded the clinical phenotype and somatic mutation data of LUAD from TCGA-LUAD (https://portal.gdc.cancer.gov/) database27. Samples lacking survival time or status were removed while ensuring the included samples had a survival time > 0 day. Here, survival time denoted the duration from initial diagnosis to the last follow-up, and survival status indicated whether the sample was alive at that point. The RNA-seq expression data in the Fragments Per Kilobase of exon model per Million mapped fragments (FPKM) format was log2 transformed, eventually resulting in the retention of 500 cancer tumor samples. Subsequently, the dataset of GSE31210 was downloaded from Gene Expression Omnibus (GEO, https://www.ncbi.nlm.nih.gov/geo/). Probe-to-Symbol was conducted according to the annotation file, and probes corresponding to multiple gene names were excluded, while an average value was calculated when multiple probes mapped to one gene. Samples without clinical follow-up information or OS data and normal tissue samples were removed, ultimately yielding 226 tumor samples from GSE3121028. All missing or ambiguous data were deleted. We used TCGA-LUAD as the training set and GSE31210 data set as an independent validation set. Additionally, 102 endotheliocyte senescence signature genes (EC.SENESCENCE.SIG GENES) were collected from a previous study29. The specific procedures of preprocessing were shown in Supplementary Table 1.
Molecular clustering analysis
The prognostic relevance of EC.SENESCENCE genes (p < 0.05) was evaluated by univariate Cox regression analysis to identify molecular subtypes of LUAD. Then, the unsupervised consensus clustering analysis of tumor samples was performed by ConsensusClusterPlus (1.50.0) package, employing the parameters of clusterAlg = “hc”, distance = “spearman” and 500 iterations with an 80% sampling proportion30. The optimal clustering number was determined using the cumulative distribution function (CDF) and Silhouette Score. Kaplan-Meier (KM) survival analysis for the two molecular subtypes was conducted using survival package.
Mutation landscape analysis
Tumor mutation burden (TMB) was computed using the maftools package31, which was calculated as the number of mutations per million base pairs. Based on the mutation dataset from the TCGA database processed with mutect2 software (GATK 4.1.x), the genes with mutation frequency > 3 were selected and those with significantly high mutation frequencies (p < 0.01) in each subtype were identified by Fisher’s exact test. In each subtype, the mutation features of the top 15 genes were mapped32. Additionally, the top20 genes with significant high mutation frequencies between high- and low-risk groups were mapped.
Differentially expressed genes (DEGs) and function enrichment analysis
To identify DEGs between the two clusters C1 and C2, we used the limma (3.42.2) package33 for analyzing gene expression data, employing linear model fitting and Bayesian testing methods. Genes were considered as DEGs if they conformed to the criteria of |log2(FC)| > log2(2) and an adjusted p < 0.05 (corrected for false discovery rate, FDR). Following this, univariate survival analysis was conducted on these DEGs using the Cox regression model to assess their prognostic significance. Genes with a p < 0.01 were selected as prognostic-related DEGs. Then, the GSEA package was used to conduct the function enrichment analysis of these DEGs33. P-values of the DEGs were adjusted by the Benjamini-Hochberg method. The gene set utilized for this analysis was “h.all.v2023.1.Hs.entrez.gmt” from MSigDB Hallmark ‘H’ v2023.1, which included key pathways of the HALLMARK series.
Establishment and validation of a risk model
Univariate Cox regression analysis was performed on the DEGs in EC.SENESCENCE.SIG-related molecular subtypes to explore the associations between these DEGs and the prognosis of LUAD. Using the glmnet4.1.2 package, these genes were then subjected to the Lasso Cox regression method34, which combined variable selection and regularization to mitigate the problem of multicollinearity. Additionally, 10-fold cross-validation strategy was implemented to enhance the robustness of the model. By adjusting the regularization parameter λ in the Lasso regression, the optimal λ value was selected to maximize the Area Under the Curve (AUC). Finally, using stepwise multivariate Cox regression, a final risk prediction model was formulated as RiskScore= , where the β is the regression coefficient, i is the corresponding genes. Patients from TCGA-LUAD and GSE31210 cohorts were classified into high- and low-risk groups by the median RiskScore value. The prognostic differences between the two groups were analyzed using KM survival analysis, and the ROC analysis was performed to evaluate the model classification performance using the timeROC package34.
Immune infiltration and tumor escape
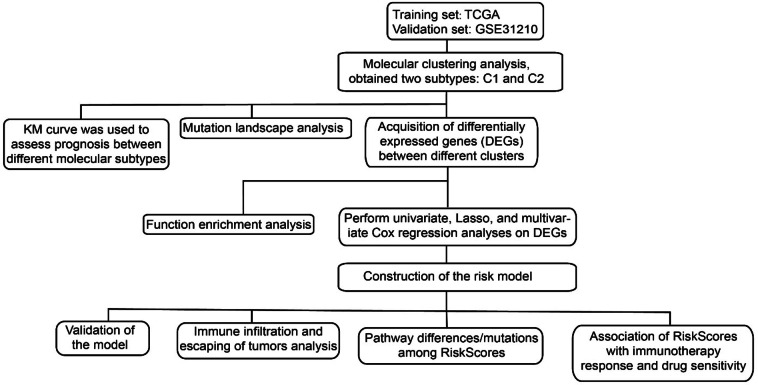
To assess immune infiltration, the MCPcounter (1.2.0) package was employed to compute the score of 10 immune cells, and the TIMER online tool (http://cistrome.org/TIMER) was used for assessing another 6 immune cell types. Additionally, the ESTIMATE (1.0.13) algorithm was employed to compute immune score, stromal score and tumor purity35. Immunotherapy response was predicted using The tumor immune dysfunction and exclusion (TIDE) algorithm (http://tide.dfci.harvard.edu/), with a higher TIDE score suggesting greater immune escape and limited benefits from immunotherapy for those patients35. The PROGENy algorithm (Pathway RespOnsive GENes) was used to calculate the activity score of carcinogenic pathways. Bioinformatics analysis flow chart was shown in Fig. 1.
Fig. 1.
Bioinformatics analysis flow chart.
Association of RiskSores with immunotherapy response and drug sensitivity
We analyzed two immunotherapy cohorts: the urothelial carcinoma immunotherapy cohort (IMvigor210) and the melanoma immunotherapy cohort (GSE78220). Using surv_cutpoint function from the survminer (0.4.9) package, patients were classified by the RiskScore into low- and high-risk groups. The prognostic differences and the impact of the RiskScore on treatment responses were examined. For drug sensitivity analysis, the pRRophetic (0.5) package was used to predict the half maximal inhibitory concentration (IC50) for potential drugs36. In the analysis, the parameter of “dataset = cgp2016” was specified, and the Cancer Genome Project 2016 data was used as the training set.
Cell lines and qPCR assay
NSCLC cells (A549 and H1299) and human lung epithelial cells (BEAS-2B) were commercially purchased from the American Type Culture Collection (ATCC, Manassas, VA, USA). BEAS-2B and A549 cells were cultured in the DMEM supplemented with 10% FBS (Invitrogen, Hercules, CA, USA) and 1% streptomycin/penicillin, at 37 °C with 5% CO2 environment. H1299 cells were cultured in the Roswell Park Memorial Institute (RPMI) 1640 medium (Invitrogen, Hercules, CA, USA) with the same supplements under the same conditions as above. Total RNA was isolated by the use of TRIzol reagent (Invitrogen, Hercules, CA, USA) and its quality was assessed by measuring the absorbance at 260 nm and 280 nm using a Multiskan SkyHigh microplate reader (Invitrogen, Hercules, CA, USA). Synthesis of cDNA from the qualified RNA was performed using the Superscript Reverse Transcriptase Kit (Transgene, Illkirch-Graffenstaden, France), according to the protocols. The Super SYBR Green kit (Transgene, Illkirch-Graffenstaden, France) was applied to perform qPCR on an ABI7300 real-time PCR system. The 2-ΔΔCT method was used to quantify the gene expression, with each sample assayed in triplicate. The specific primer pairs were listed in Supplementary Table 2.
Cell transfection
The Lipofectamine 3000 transfection kit (Invitrogen, Hercules, CA, USA) was used for transfection of cells via liposome. A549 cells (at a density of 1 × 10⁶ cells/well) were inoculated in 6-well plates, then separately transfected with si-ANGPTL4, si-FAM83A, si-GJB3, si-ANLN, and si-SLC34A2 reagents (Merck, Rahway, NJ, USA) and incubated at 37℃ for 48 hours (h). A negative control siRNA was used for comparison in a parallel set of cells. Detailed sequences used for transfection were shown in Supplementary Table 3.
Transwell and wound healing assay
Post-transfection, the cells were harvested for scratch and transwell assays. For wound healing assay, the stably transfected cells A549 (4 × 10⁶) were planted into 6-well plates with 250 µL of DMEM and grown to confluence. A rectilinear scratch was then made using a pipette tip. After 48 h, the cells were washed with PBS, wound closure was evaluated under an inverted microscope (Leica, Wetzlar, Germany), and the wounded areas were quantified using ImageJ software37. For the transwell assay, 6 × 10⁴ cells was seeded into the upper chamber of the Transwell insert (8 μm, Corning, Inc., Corning, NY, USA) with 200 µL of serum-free DMEM. The lower chamber contained 890 µL of 10% FBS DEME. After 48 h, migrated cells in the lower chambers were fixed with 4% paraformaldehyde, dyed by 0.1% crystal violet, and quantified using an inverted microscope (Leica, Wetzlar, Germany)38. Each assay was conducted in sextuplicate, and the experiments were repeated thrice to confirm data reliability.
Statistical analysis
All the statistical data were processed with the R software (version 3.6.0). The Wilcoxon rank-sum test was employed to compare differences between two groups of continuous variables, while Pearson’s method was used for correlation analyses. Data processing was done using GraphPad Prism 8. Prognostic differences among risk groups were evaluated by log-rank test, with statistical significance set at p < 0.05.
Results
Molecular subtypes classified based on the EC.SENESCENCE.SIG-correlated prognostic genes
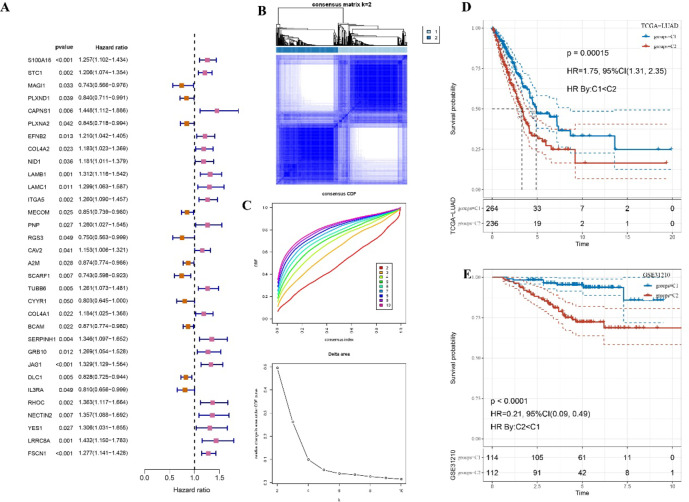
Firstly, we analyzed the significant prognostic genes from the EC.SENESCENCE (see molecular clustering analysis). The univariate Cox regression analysis was then performed and 32 prognostic genes were then identified from the SIG gene set in the TCGA cohort (p < 0.05, Fig. 2A). Unsupervised clustering analysis indicated a highly stable clustering when the cluster number was 2, based on both CDF and Silhouette Score (Fig. 2B & Supplementary Table 4). With an optimal clustering number of K = 2 (Fig. 2C), the samples were grouped into two molecular subtypes (C1 and C2) with distinct prognostic differences. The C1 cluster was associated with a better prognosis (p < 0.05, Fig. 2D). Such a stable subtype classification was consistently observed in GSE31210 cohort across different datasets, where the C1 subtype also demonstrated significantly better outcomes (p < 0.05, Fig. 2E).
Fig. 2.
An unsupervised clustering for molecular subtype. A Univariate Cox regression analysis for the prognostic genes from the EC.SENESCENCE.SIG genes. B The CDF Delta area curve for the optimal number of clusters in TCGA-LUAD cohort. C Heatmap of sample clustering when k = 2. D KM survival analysis among two subtypes in TCGA-LUAD cohort. E KM survival analysis among two subtypes in GSE31210 cohort.
Mutational characteristics between two molecular subtypes
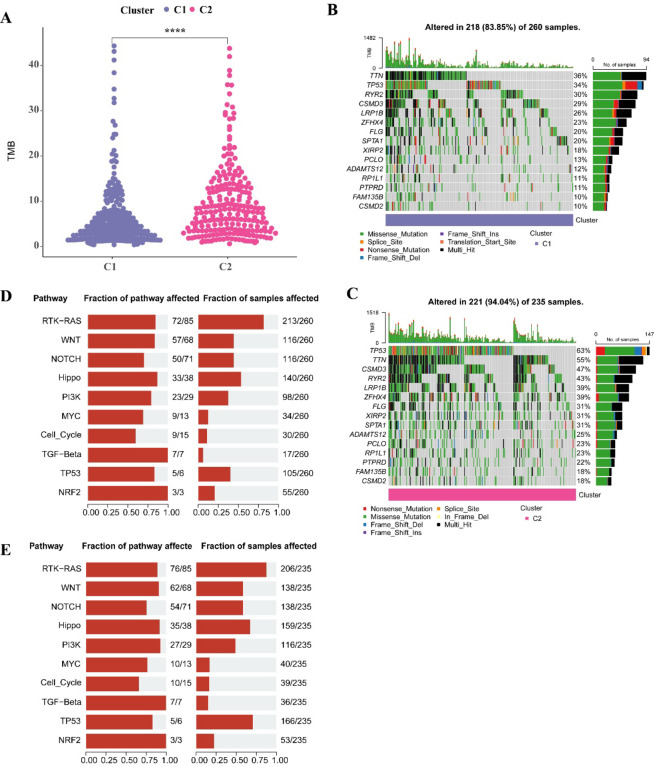
Analysis on the mutation landscape of CI and C2 clusters showed that the C2 cluster with a poorer prognosis had a remarkably higher TMB (p < 0.05, Fig. 3A). The top15 mutated genes in the C1 cluster included the TTN (36%), TP53 (34%), RYR2 (30%) (Fig. 3B), while the top15 mutated genes with higher overall mutation frequency in the C2 cluster included the TP53 (63%), TTN (55%), CSMD3 (47%) (Fig. 3C), potentially explaining the poorer prognosis in the C2 cluster. Further examination of somatic mutations in tumor-related pathways (including the Hippo, RTK-RAS, MYC, NRF2, Cell_Cycle, NOTCH, WNT, PI3K, TP53, TGF-β) revealed that patients in the C2 cluster had the highest mutation rates in these pathways, particularly the RTK-RAS and TP53 pathways (Fig. 3D, E).
Fig. 3.
Mutational characteristics between two molecular subtypes. A Difference analysis of TMB score among two subtypes. B Somatic mutation analysis of the top 15 highly mutated genes of C1 subtype. C Somatic mutation analysis of the top 15 highly mutated genes of C2 subtype. D Mutation frequency of C1 subtype tumor pathway gene and proportion of affected samples. E Mutation frequency of C2 subtype tumor pathway genes and proportion of affected samples.
DEGs and function enrichment analysis among the two molecular subtypes
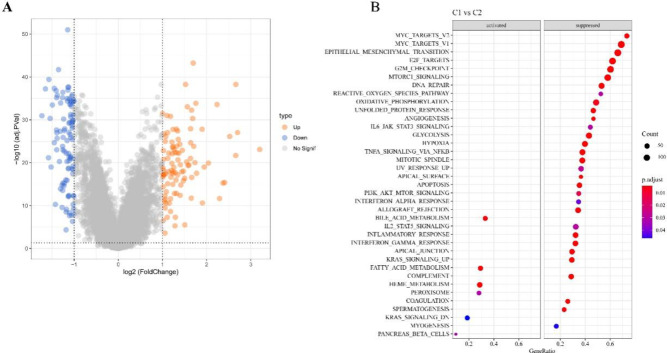
We identified 101 upregulated DEGs and 102 downregulated DEGs in the C1 cluster (p < 0.05, Fig. 4A). GSEA showed that the fatty_acid_metabolism and bile_acid_metabolism pathways were significantly activated in the C1 subtype. Conversely, in the C2 cluster, pathways linked to tumor proliferation, invasion and metastasis, damage repair and energy metabolism, and oxidative stress, such as myc_targets2, epithelial_mesenchymal_transition, reactive_oxygen_species_pathway, e2f_targets, apical_junction, and oxidative_phosphorylation, angiogenesis, were significantly activated (Fig. 4B).
Fig. 4.
Volcano plot of DEGs between the two molecular subtypes. A Volcanic plot of DEGs between two molecular subtypes in TCGA cohort. B Hallmark pathway enrichment analysis of DEGs.
Constructing a prognostic RiskScore model
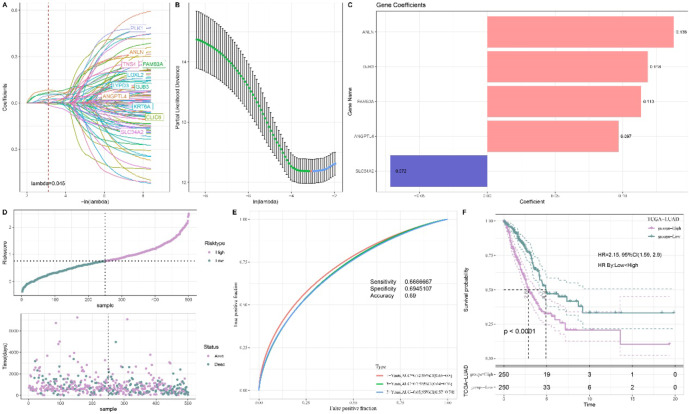
Univariate Cox regression analysis of these DEGs in TCGA cohort identified 105 prognostically significant DEGs in LUAD (p < 0.05). Next, Lasso Cox regression analysis with 10-fold cross validation method was used to reduce the number of genes in the model (Fig. 5A, B). Multivariate Cox regression analysis further refined the model and determined regression coefficient (Fig. 5C). The final RiskScore model was formulated as RiskScore= This model incorporated five biomarkers, namely, Angiopoietin-like 4 (ANGPTL4), Solute Carrier Family 34 Member 2 (SLC34A2), Gap Junction Protein Beta 3 (GJB3), Anillin (ANLN), and Family with sequence similarity 83-member A (FAM83A). All the patients were categorized into high- and low-risk groups by the median value of the RiskScore (Fig. 5D). The ROC analysis showed that the AUC value of 1-, 3- and 5-year OS was 0.72, 0.7 and 0.65, respectively (Fig. 5E), indicating robust short- and long-term prediction capabilities of the model. Meanwhile, KM survival analysis within the TCGA-LUAD cohort confirmed that the high-risk patients had noticeably poorer outcomes (Fig. 5F).
Fig. 5.
Construction of risk model. A Lasso coefficient distribution trajectory, which refers to the path of individual predictor coefficients as they change with the regularization parameter λ. B Lasso regularization trajectory analysis, which refers to the analysis of the trajectory of λ changes during the process of Lasso regularization. C Risk coefficients of key genes in the training set. D The high- and low-risk classification via the median value of RiskScore. E ROC analysis of 1-, 3- and 5- years OS in TCGA cohort. F KM survival analysis of various risk patients in TCGA cohort.
Validation of RiskScore model and impact of individual biomarker on prognosis
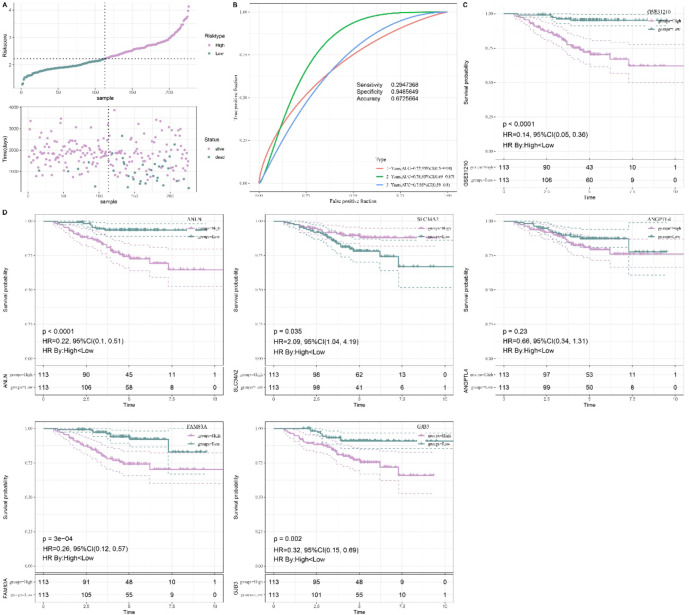
The stability and reliability of the model were verified by applying it to the validation set GSE31210, where consistent results were observed. Patients were categorized into high- and low-risk groups by the RiskScore (Fig. 6A). The AUC of 1-, 2- and 3-year OS was 0.72, 0.78 and 0.7, respectively, all exceeding 0.65 (Fig. 6B), with the high-risk patients showing significantly poorer outcomes (p < 0.05, Fig. 6C). Additionally, the individual prognostic impact of each of the five biomarkers was evaluated. LUAD patients were divided based on the median gene expression value into low- and high expression-groups. KM survival analysis showed that except for ANGPTL4, the high expressions of rest four genes were closely related to a significantly poor OS of LUAD patients (Fig. 6D). However, a decrease in the AUC value was observed when ANGPTL4 was excluded from the model (Supplementary Fig. 1), therefore ANGPTL4 gene was included in the model.
Fig. 6.
Validation of risk model. A The high- and low-risk classification via the median value of RiskScore in GSE31210 cohort. B ROC analysis of 1-, 2- and 3- years OS in GSE31210 cohort. C KM survival analysis of various risk patients in GSE31210 cohort. D KM survival analysis of patients based on single gene expression.
High-risk patients were related to lower immune cell infiltration
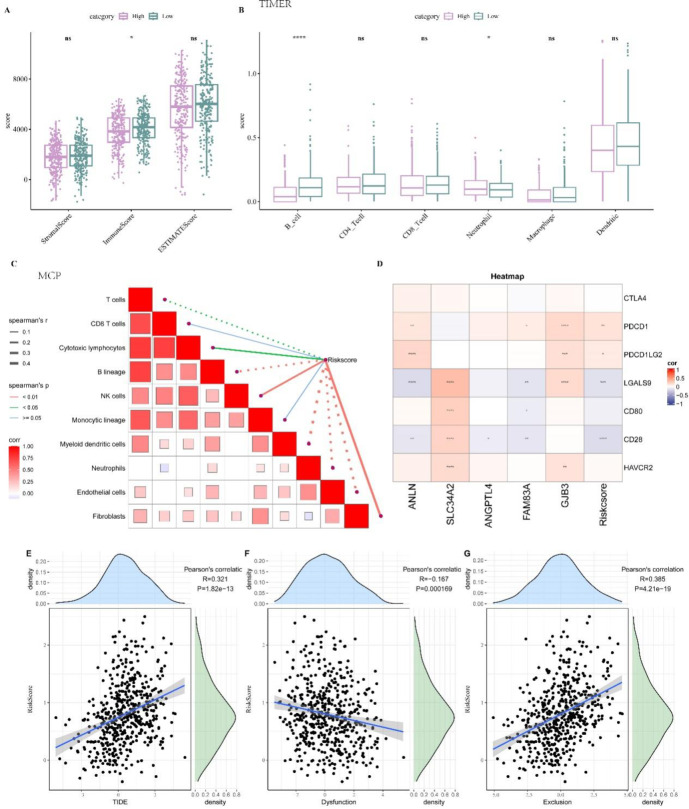
Compared to the low-risk group, the ESTIMATE algorithm showed that patients classified as high-risk displayed a significantly lower immune score (p < 0.05, Fig. 7A). This suggested that the high-risk group was characterized by a suppressive TME conducive to LUAD progression. Subsequent analysis using TIMER analysis revealed that B cells had significantly lower infiltration level in the high-risk group (p < 0.0001, Fig. 7B). Further exploration of the relationship between the RiskScore and cell infiltration scores calculated by MCP-Counter tool revealed that B lineage, Myeloid dendritic cells, T cells, Neutrophils, Endothelial cells were negatively correlated with the RiskScore (Fig. 7C), indicating the high-risk patients with lower immune cell infiltration and higher RiskScore had a poor prognosis. Correlation analyses between model genes, the RiskScore and common immune checkpoint genes revealed that the RiskScore was positively correlated with the expressions of PDCD1 and PDCD1LG2 checkpoints (Fig. 7D) as well as with the TIDE score (Fig. 7E), suggesting that patients with higher TIDE score might experience greater immune escape in response to immunotherapy. The RiskScore was inversely related to the Dysfunction of T cell score (Fig. 7F) but positively correlated with Exclusion of T cell score (Fig. 7G).
Fig. 7.
TME analysis between high- and low-risk groups. A ESTIMATE algorithm for TME, which * means p < 0.05. B TIMER algorithm for immune infiltration of 6 immune cells, which * means p < 0.05 and **** means p < 0.0001. C The correlation analysis between RiskScore and MCP-Count immunization score. In the figure, solid lines indicate positive correlations, dashed lines indicate negative correlations. D The correlation between RiskScore and immune checkpoint genes. * means p < 0.05, ** means p < 0.01, *** means p < 0.001, **** means p < 0.0001. In the figure, red represents positive correlations, and blue represents negative correlations. E The correlation between RiskScore and TIDE score. F The correlation between RiskScore and dysfunction score. G The correlation between RiskScore and exclusion score.
The TMB score and mutation landscape analysis between high- and low- risk groups
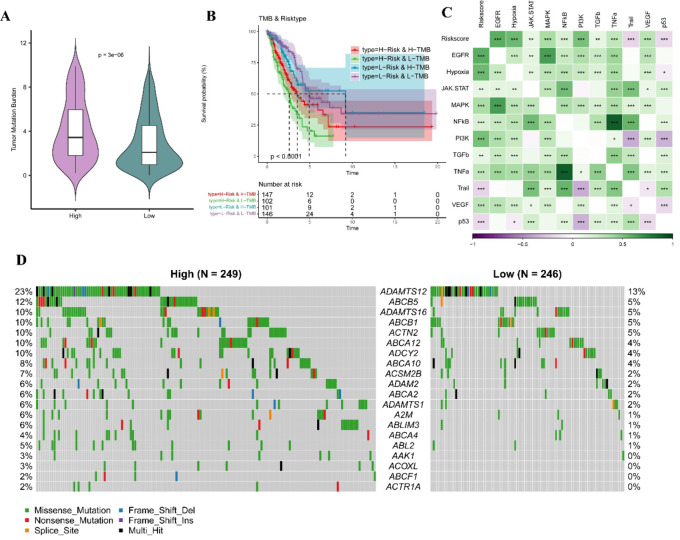
A higher TMB score was positively related to the effect of immunotherapy. We observed that high-risk patients had significantly high TMB score (Fig. 8A). Analysis on the synergistic effect of TMB and the RiskScore demonstrated that the low-risk patients showed better prognosis, irrespective of whether they were in the high- or low-TMB subgroup (Fig. 8B), indicating that the TMB status did not affect the risk assessment of RiskScore. Then, we calculated the cancer hallmark pathway score of PI3K, VEGF, EGFR, p53 and their correlation with the RiskScore, and found that the RiskScore was significantly positively linked to multiple pathways, such as EGFR, Hypoxia, MAPK, PI3K and TNF-α (Fig. 8C). The mutation landscape was compared between the two risk groups. Notably, the mutation frequency of ADAMTS12 was the highest (23%) in the high-risk group compared to 13% in low-risk group (Fig. 8D).
Fig. 8.
TMB differences between high and low-risk groups. A TMB difference between two risk groups. B KM survival analyis between high and low TMB groups combined two risk groups. C Correlation between Riskscore and tumor-related pathway score. In this figure, green represents positive correlations, and purple represents negative correlations. * means p < 0.05, ** means p < 0.01, *** means p < 0.001. D The significant mutated genes in various risk groups.
Evaluation of immunotherapy efficacy and drug sensitivity among the two risk groups
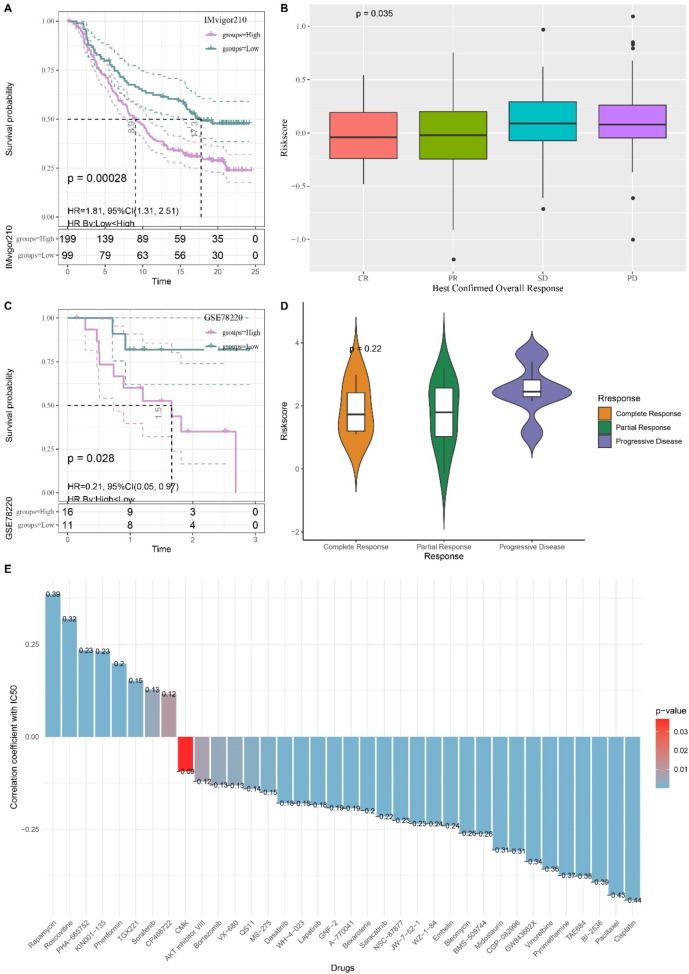
Two immunotherapy cohorts were included to further assess the effect of the RiskScore on predicting immunotherapy sensitivity. The logarithmic rank test showed that in the IMvigor210 cohort, patients with higher risk scores had noticeably shorter survival times (p < 0.05, Fig. 9A), and that there was no significant difference in the response to anti-PD-L1 receptor inhibitors among patients who exhibited different partial response (PR), stable disease (SD), Complete response (CR), progressive disease (PD) (Fig. 9B). In the GSE78220 cohort, the high-risk patients with significantly poor OS (Fig. 9C) also presented varying responses to anti-PD-L1 inhibitor without significant difference (Fig. 9D). By identifying potential drugs for LUAD and predicting the IC50 of drugs (p < 0.05), we found that IC50 of 18 drugs, including Cisplatin, Paclitaxe, and BI-2536, was negatively associated with the RiskScore, indicating that these drugs may benefit high-risk LUAD patients (Fig. 9E). Conversely, Rapamycin and Roscovitine were positively correlated with the RiskScore, suggesting that the low-risk patients were more likely to benefit from taking these two drugs (Fig. 9E).
Fig. 9.
KM survival analysis of patients with high and low-risk scores in the IMvigor210 cohort. A KM survival analysis among two risk patients in IMvigor210 cohort. B The difference in immunotherapy responses of various risk patients in the IMvigor210 cohort. C KM survival analysis among two risk patients in GSE78220 cohort. D The difference in immunotherapy responses of various risk patients in the GSE78220 cohort. E Correlation between RiskScore and drug sensitivity in TCGA cohort.
In vitro experiments to validate the biomarkers
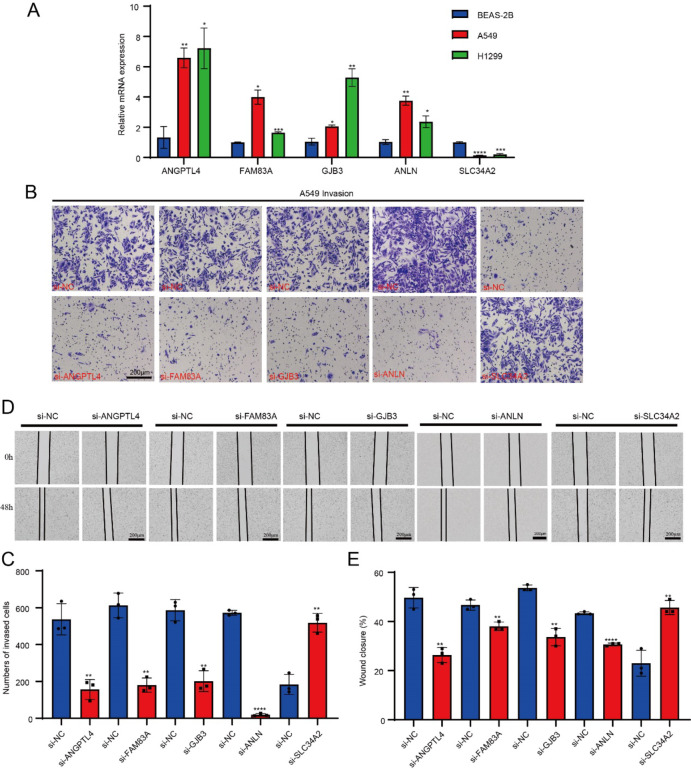
The results of qPCR showed that ANGPTL4, FAM83A, GJB3 and ANLN were significantly overexpressed in the A549 cells and H1299 cells, while SLC34A2 was significantly downregulated in the tumor cells (p < 0.05, Fig. 10A). After silencing ANGPTL4, FAM83A, GJB3 and ANLN, the number of invasive cells in the lower chamber was significantly reduced, while that of non-invasive cells was significantly increased after silencing SLC34A2 (Fig. 10B, C). The wound healing assay revealed that the wound closure rate was remarkably inhibited after silencing ANGPTL4, FAM83A, GJB3 and ANLN in comparison to the si-NC groups, while SLC34A2 knockdown significantly promoted wound healing rate in comparison to the si-NC groups (p < 0.05, Fig. 10D, E).
Fig. 10.
The qPCR, transwell and wound healing assay. A The qPCR for quantification on model genes expression among tumor and normal cells. B The transwell assay imaging. C The number of invasion cells after ANGPTL4, FAM83A, GJB3, ANLN and SLC34A2 silencing. D The wound healing assay. E The wound closure rate of cell migration after ANGPTL4, FAM83A, GJB3, ANLN and SLC34A2 silencing.
Discussion
LUAD is a frequently detected subtype of lung cancer and a major cause leading to cancer mortality39. Previous study showed that cellular senescence process contributes to the development of LUAD and senescence-related genes have the potential to serve as prognostic biomarkers in LUAD40. Based on the senescence phenotype, Khadirnaikar et al. characterized a novel subtype of LUAD with high drug resistance41. Similarly, this study found that LUAD was closely related to aging-associated genes. Ferrara R et al. revealed that T-cell immune senescence is a novel circulating biomarker for evaluating the efficacy of immunotherapies42. This study identified five biomarkers applying bioinformatics analysis and established a corresponding risk model for further analysis, which also revealed a correlation between T-cell score and the RiskScore.
The present research categorized LUAD samples into two molecular subtypes (C1 and C2), with the C2 subtype exhibiting a poorer prognosis and a generally higher TMB. As an emerging biomarker, TMB is highly effective in assessing the efficacy of lung cancer immune checkpoint inhibitors (ICIs)43, with a higher TMB indicating a longer OS for patients undergoing ICI treatment44. Furthermore, previous study has shown a positive relationship between immune infiltration and the TMB in the tumor tissues derived from patients with LUAD45. In addition, patient samples from the C2 group had remarkably higher mutation rate, particularly in RTK-RAS and TP53. The RTK/RAS pathway, an important oncogenic signaling pathway, is closely associated with the prognosis of LUAD46. TP53, one of the most frequently mutated tumor-suppressive genes, undergoes mutations that result in the loss of its tumor-suppressive function and an acceleration of tumorigenesis, potentially contributing to the poor prognosis observed in the C2 subtype47. This study found that the C1 subtype was significantly enriched in pathways such as bile_acid_metabolism. Consistently, previous research has also confirmed changes in serum bile acid levels in patients with NSCLC48. This suggested a close link between these pathways and the development of LUAD. However, the C2 subtype was mainly enriched in the pathways directly related to cell proliferation and tumor growth, invasion and metastasis, and cellular energy metabolism, including myc_targets249, epithelial_mesenchymal_transition50,51, and oxidative_phosphorylation. These enriched pathways indicated that the C2 subtype may possess stronger metabolic activity, proliferative capacity, and invasive potential, providing novel insights into the personalized and precision treatment of LUAD patients.
The development of LUAD is a complex process involving multiple signaling pathways and gene contributors52. This study identified five biomarkers for LUAD, namely, ANLN, SLC34A2, ANGPTL4, FAM83A and GJB3. ANLN encodes a mitosis-related protein that supports cytokinesis via promoting the contractile ring formation53, which implies that they may influence the aging-related pathways by affecting the progress of cell cycle. Deng et al., reported that the oncogenic ANLN is significantly upregulated in the LUAD cells and is positively correlated with a worse prognosis54. Our study found that silencing ANLN affected the capabilities of LUAD cells to migrate and invade. SLC34A2 belongs to a sodium-driven phosphate cotransporters family. Due to the correlation between phosphate transport and cell energy acquisition, SLC34A2 is related to cellular senescence. Overexpression of SLC34A2 in many cancers contributes to cell proliferation and tumor growth55; however, downregulated SLC34A2 in lung cancer has also been observed56 and increased splicing of SLC34A2 is associated with higher invasiveness of LUAD57. Our risk model also showed that high-expressed SLC34A2 reduced RiskScore and downregulated SLC34A2 in vitro, suggesting that the SLC34A2 served as a protective factor in LUAD. ANGPTL4 mediates lipid metabolism and angiogenesis. In the context of cellular senescence, abnormal angiogenesis could change the microenvironment around cells. Study reported that overexpression of ANGPTL4 in LUAD is an independent factor contributing to the diagnosis and poor prognosis of LUAD58. FAM83A exhibits oncogenic effects on multiple cancer types through directly binding to β-catenin to inhibit the degradation of FAM83A-β-catenin complex, causing abnormal activation of Wnt/β-catenin signaling for tumorigenesis59. Furthermore, FAM83A also promotes the tumor proliferation andmigration through activating the HIF-1α/ glycolysis axis in LUAD60. In addition, a higher expression of GJB3 in LUAD is predictive of a worse prognosis, but the use of metformin can significantly downregulate GJB3 to inhibit the cancer progression61. These findings confirmed that the five genes identified by the current research fulfilled their unique functions through influencing multiple biological processes, for instance, cell cycle, cell metabolism, angiogenesis and cell signaling pathways, thereby further affecting the proliferation, migration, invasion of tumor cells and cellular senescence and ultimately contributing to the occurrence of LUAD.
The characteristic of TME affects tumor progression62. We found that the infiltration level was lower in the high-risk group but higher in the low-risk group, which has also been reported by a previous study63.The RiskScore was closely negatively linked to Myeloid dendritic cells, T cells, Endothelial cells, B lineage, Neutrophils. Among them, Neutrophils, T cells, Myeloid dendritic cells are typical anti-tumor cells. Specifically, T cells and Neutrophils are responsible for directly killing tumor cells, and Myeloid dendritic cells fulfill crucial functions in antigen presentation to T/Killer cells64. High infiltration of these cells and lower TIDE score suggested that the low-risk patients had a strong anti-tumor immunity. Previous studies demonstrated that anti-PD-1 ICI therapy is effective in treating clinically advanced tumors65,66. Our results indicated that the RiskScore was positively related to PDCD1 and PDCD1LG2 checkpoints, TIDE score, and T-cell exclusion score. Conversely, the RiskScore and T-cell dysfunction score were inversely correlated with each other. These findings demonstrated that LUAD patients with low-RiskScores and low-TIDE scores may benefit from ICI treatment. In addition, high-risk LUAD patients were linked to the activation of multiple cancer hallmark pathway, such as EGFR, Hypoxia, MAPK, PI3K and TNF-α, which could be possible targets for the treatment of these patients67. The BI-2536, which was found to have a negative correlation with the risk score in the drug sensitivity prediction of this study, is a PIK3 inhibitor, plays an anticancer role by inhibiting the PI3K signaling pathway68. In summary, the distinct characteristics of the low- and high-risk groups required different therapeutic strategies, and the low-risk group may potentially benefit more from ICI therapy.
However, this study also has certain limitations. Firstly, the model in this study was mainly derived from the DEGs related to aging genes without other clinical or demographic variables such as age, gender, and treatment stage. Furthermore, although the five biomarkers were closely involved in LUAD development, the underlying regulatory mechanisms remained incompletely understood, pointing to a need of rigorous and solid basic experiments for further analysis. In particular, the relevant pathways involved in these biomarkers should be validated using animal tumor models. For example, by analyzing the critical role of ANLN during the transition from early-stage carcinoma in situ to invasive carcinoma, it may be possible to provide insights for precise clinical treatments. In addition, although this study compared and analyzed the differences between high-risk and low-risk groups of LUAD, further exploration of potential combined therapies for the two groups is also highly necessary.
Conclusions
In summary, this study identified five aging-related biomarkers to develop a prognostic model that can accurately stratify high-risk and low-risk LUAD patients. Significant differences in the characteristics of the TME and drug sensitivities of LUAD patients in these two groups were detected. Such distinctions can effectively provide useful clues for clinicians to select suitable treatment modalities for patients. In addition, by classifying patients into different hierarchical groups using the RiskScore model, the grouping of clinical trials may become more scientific and reasonable, which helps evaluate the efficacy of new drugs or treatment regimens in patient with different characteristics. To conclude, the development of the RiskScore in this study could effectively improve the overall diagnosis, treatment and prognostic evaluation of LUAD patients.
Acknowledgements
Not applicable.
Author contributions
All authors contributed to this present work: [HZL] & [GML] designed the study, [ZFC] & [CDC] acquired the data. [XG] & [HZL] improved the figure quality. [XJC], [JS] and [HZL] drafted the manuscript, [HZL] & [GML] revised the manuscript. All authors read and approved the manuscript.
Funding
This study was supported by Special Project on Traditional Chinese Medicine Research in Henan Province (2024ZY2171) and the Science and Technology Research Program of Henan Province (252102310236).
Data availability
The datasets generated and/or analyzed during the current study are available in the [GSE78220] repository, [https://www.ncbi.nlm.nih.gov/geo/query/acc.cgi? acc= GSE78220] and [GSE31210] repository, [https://www.ncbi.nlm.nih.gov/geo/query/acc.cgi? acc= GSE31210]. The raw data is available in Github https://github.com/HongzhiLi579/raw-data.git and Zenodo https://doi.org/10.5281/zenodo.14603209 with DOI: 10.5281/zenodo.14603209.
Declarations
Ethics approval and consent to participate
Not applicable.
Consent for publication
Not applicable.
Competing interests
The authors declare no competing interests.
Footnotes
Publisher’s note
Springer Nature remains neutral with regard to jurisdictional claims in published maps and institutional affiliations.
References
- 1.Tang, Z., Wang, L., Wu, G., Qin, L.& Tan, Y. FGD5 as a novel prognostic biomarker and its association with immune infiltrates in lung adenocarcinoma. Biocell47 (11), 2503–2516 (2023). [Google Scholar]
- 2.Bray, F. et al. Global cancer statistics 2022: GLOBOCAN estimates of incidence and mortality worldwide for 36 cancers in 185 countries. CA-Cancer J. Clin.74 (3), 229–263 (2024). [DOI] [PubMed] [Google Scholar]
- 3.Nooreldeen, R. & Bach, H. Current and future development in lung cancer diagnosis. Int. J. Mol. Sci. ;22(16). (2021). [DOI] [PMC free article] [PubMed]
- 4.Cao, H. et al. Identification of prognostic molecular subtypes and model based on CD8 + T cells for lung adenocarcinoma. Biocell48 (3), 473–490 (2024). [Google Scholar]
- 5.Hanaoka, J. et al. Dynamic perfusion digital radiography for predicting pulmonary function after lung cancer resection. World J. Surg. Oncol.19 (1), 43 (2021). [DOI] [PMC free article] [PubMed] [Google Scholar]
- 6.Allemani, C. et al. Global surveillance of trends in cancer survival 2000–14 (CONCORD-3): analysis of individual records for 37 513 025 patients diagnosed with one of 18 cancers from 322 population-based registries in 71 countries. Lancet391 (10125), 1023–1075 (2018). [DOI] [PMC free article] [PubMed] [Google Scholar]
- 7.Siegel, R.L., Miller, K.D., & Jemal, A. Cancer statistics, 2020. Cancer J. Clin.70 (1), 7–30 (2020). [DOI] [PubMed] [Google Scholar]
- 8.Shaw, A. T. et al. Alectinib in ALK-positive, crizotinib-resistant, non-small-cell lung cancer: a single-group, multicentre, phase 2 trial. Lancet Oncol.17 (2), 234–242 (2016). [DOI] [PMC free article] [PubMed] [Google Scholar]
- 9.Karachaliou, N. et al. Anaplastic lymphoma kinase inhibitors in phase I and phase II clinical trials for non-small cell lung cancer. Expert Opin. Investig. Drugs. 26 (6), 713–722 (2017). [DOI] [PubMed] [Google Scholar]
- 10.Lin, J. J., Riely, G. J., Shaw, A. T. & Targeting, A. L. K. Precision medicine takes on drug resistance. Cancer Discov.7 (2), 137–155 (2017). [DOI] [PMC free article] [PubMed] [Google Scholar]
- 11.Garraway, L. A. & Jänne, P. A. Circumventing cancer drug resistance in the era of personalized medicine. Cancer Discov.2 (3), 214–226 (2012). [DOI] [PubMed] [Google Scholar]
- 12.Hrustanovic, G. et al. RAS-MAPK dependence underlies a rational polytherapy strategy in EML4-ALK–positive lung cancer. Nat. Med.21 (9), 1038–1047 (2015). [DOI] [PMC free article] [PubMed] [Google Scholar]
- 13.Detterbeck, F. C., Boffa, D. J. & Tanoue, L. T. The new lung cancer staging system. Chest136 (1), 260–271 (2009). [DOI] [PubMed] [Google Scholar]
- 14.Calvayrac, O., Pradines, A., Pons, E., Mazières, J. & Guibert, N. Molecular biomarkers for lung adenocarcinoma. Eur. Respir. J. ;49(4). (2017). [DOI] [PubMed]
- 15.Al-Dherasi, A. et al. A seven-gene prognostic signature predicts overall survival of patients with lung adenocarcinoma (LUAD). Cancer Cell Int.21 (1), 294 (2021). [DOI] [PMC free article] [PubMed] [Google Scholar]
- 16.Muñoz-Espín, D. & Serrano, M. Cellular senescence: from physiology to pathology. Nat. Rev. Mol. Cell Biol.15 (7), 482–496 (2014). [DOI] [PubMed] [Google Scholar]
- 17.Hayflick, L. & Moorhead, P. S. The serial cultivation of human diploid cell strains. Exp. Cell Res.25, 585–621 (1961). [DOI] [PubMed] [Google Scholar]
- 18.Zhang, R., Chen, W. & Adams, P. D. Molecular dissection of formation of senescence-associated heterochromatin foci. Mol. Cell. Biol.27 (6), 2343–2358 (2007). [DOI] [PMC free article] [PubMed] [Google Scholar]
- 19.Beauséjour, C. M. et al. Reversal of human cellular senescence: roles of the p53 and p16 pathways. EMBO J.22 (16), 4212–4222 (2003). [DOI] [PMC free article] [PubMed] [Google Scholar]
- 20.Barnes, P. J., Baker, J. & Donnelly, L. E. Cellular senescence as a mechanism and target in chronic lung diseases. Am. J. Respir. Crit Care Med.200 (5), 556–564 (2019). [DOI] [PubMed] [Google Scholar]
- 21.Tchkonia, T., Zhu, Y., van Deursen, J., Campisi, J. & Kirkland, J. L. Cellular senescence and the senescent secretory phenotype: therapeutic opportunities. J. Clin. Investig.123 (3), 966–972 (2013). [DOI] [PMC free article] [PubMed] [Google Scholar]
- 22.Pacinella, G., Ciaccio, A. M. & Tuttolomondo, A. Endothelial dysfunction and chronic inflammation: the cornerstones of vascular alterations in age-related diseases. Int. J. Mol. Sci. ;23(24). (2022). [DOI] [PMC free article] [PubMed]
- 23.Kennedy, B. K. et al. Geroscience: linking aging to chronic disease. Cell159 (4), 709–713 (2014). [DOI] [PMC free article] [PubMed] [Google Scholar]
- 24.Calcinotto, A. et al. Cellular senescence: aging, cancer, and injury. Physiol. Rev.99 (2), 1047–1078 (2019). [DOI] [PubMed] [Google Scholar]
- 25.Brahmer, J. et al. Nivolumab versus docetaxel in advanced Squamous-Cell Non-Small-Cell lung cancer. N. Engl. J. Med.373 (2), 123–135 (2015). [DOI] [PMC free article] [PubMed] [Google Scholar]
- 26.Shahrajabian, M. H. & Sun, W. Survey on multi-omics, and multi-omics data analysis, integration and application. Curr. Pharm. Anal.19 (4), 267–281 (2023). [Google Scholar]
- 27.Li, H. et al. Identification of lysosomal genes associated with prognosis in lung adenocarcinoma. Translational Lung cancer Res.12 (7), 1477–1495 (2023). [DOI] [PMC free article] [PubMed] [Google Scholar]
- 28.Gentles, A. J. et al. Integrating tumor and stromal gene expression signatures with clinical indices for survival stratification of Early-Stage Non-Small cell lung cancer. J. Natl Cancer Inst. ;107(10). (2015). [DOI] [PMC free article] [PubMed]
- 29.Wu, Z., Uhl, B., Gires, O. & Reichel, C. A. A transcriptomic pan-cancer signature for survival prognostication and prediction of immunotherapy response based on endothelial senescence. J. Biomed. Sci.30 (1), 21 (2023). [DOI] [PMC free article] [PubMed] [Google Scholar]
- 30.Wang, J. et al. Identification of cuproptosis-related subtypes, construction of a prognosis model, and tumor microenvironment landscape in gastric cancer. Front. Immunol.13, 1056932 (2022). [DOI] [PMC free article] [PubMed] [Google Scholar]
- 31.Mayakonda, A., Lin, D-C., Assenov, Y. & Plass, C. Koeffler, HPJGr. Maftools: efficient and comprehensive analysis of somatic variants in cancer. Genome Res.28 (11), 1747–1756 (2018). [DOI] [PMC free article] [PubMed] [Google Scholar]
- 32.Gu, L. et al. Exosomal NOX1 promotes tumor-associated macrophage M2 polarization-mediated cancer progression by stimulating ROS production in cervical cancer: a preliminary study. Eur. J. Med. Res.28 (1), 323 (2023). [DOI] [PMC free article] [PubMed] [Google Scholar]
- 33.Song, Z. et al. CHDTEPDB: transcriptome expression profile database and interactive analysis platform for congenital heart disease. Congenit Heart Dis.18 (6), 693–701 (2023). [Google Scholar]
- 34.Yang, S., Ji, J., Wang, M., Nie, J. & Wang, S. Construction of ovarian cancer prognostic model based on the investigation of Ferroptosis-Related LncRNA. Biomolecules ;13(2). (2023). [DOI] [PMC free article] [PubMed]
- 35.Zheng, H., Liu, H., Ge, Y. & Wang, X. Integrated single-cell and bulk RNA sequencing analysis identifies a cancer associated fibroblast-related signature for predicting prognosis and therapeutic responses in colorectal cancer. Cancer Cell. Int.21 (1), 552 (2021). [DOI] [PMC free article] [PubMed] [Google Scholar]
- 36.Geeleher, P., Cox, N. & Huang, R. S. pRRophetic: an R package for prediction of clinical chemotherapeutic response from tumor gene expression levels. PloS One. 9 (9), e107468 (2014). [DOI] [PMC free article] [PubMed] [Google Scholar]
- 37.Collins, K. A. et al. Astron. J. ;153(2):77. (2017). [Google Scholar]
- 38.Chen, Y. et al. Upregulation of LRRC8A by m(5)C modification-mediated mRNA stability suppresses apoptosis and facilitates tumorigenesis in cervical cancer. Int. J. Biol. Sci.19 (2), 691–704 (2023). [DOI] [PMC free article] [PubMed] [Google Scholar]
- 39.Bray, F. et al. Global cancer statistics 2018: GLOBOCAN estimates of incidence and mortality worldwide for 36 cancers in 185 countries. Cancer J. Clin.68 (6), 394–424 (2018). [DOI] [PubMed] [Google Scholar]
- 40.Fang, X. et al. A novel senescence-related LncRNA signature that predicts prognosis and the tumor microenvironment in patients with lung adenocarcinoma. Front. Genet.13, 951311 (2022). [DOI] [PMC free article] [PubMed] [Google Scholar]
- 41.Khadirnaikar, S., Chatterjee, A. & Shukla, S. Identification and characterization of senescence phenotype in lung adenocarcinoma with high drug sensitivity. Am. J. Pathol.191 (11), 1966–1973 (2021). [DOI] [PubMed] [Google Scholar]
- 42.Ferrara, R. et al. Circulating T-cell Immunosenescence in patients with advanced non-small cell lung cancer treated with single-agent PD-1/PD-L1 inhibitors or platinum-based chemotherapy. Clin. Cancer Res.27 (2), 492–503 (2021). [DOI] [PubMed] [Google Scholar]
- 43.Jiao, X. D. et al. The prognostic value of tumor mutation burden in EGFR-mutant advanced lung adenocarcinoma, an analysis based on cBioPortal data base. J. Thorac. Disease. 11 (11), 4507–4515 (2019). [DOI] [PMC free article] [PubMed] [Google Scholar]
- 44.Samstein, R. M. et al. Tumor mutational load predicts survival after immunotherapy across multiple cancer types. Nat. Genet.51 (2), 202–206 (2019). [DOI] [PMC free article] [PubMed] [Google Scholar]
- 45.Zhao, Z. et al. Combination of tumor mutation burden and immune infiltrates for the prognosis of lung adenocarcinoma. Int. Immunopharmacol.98, 107807 (2021). [DOI] [PubMed] [Google Scholar]
- 46.Yin, X-Q., Yin, X-H., Yu, Y-Q., Xu, L. & Zhang, M. Genomic landscape of RTK/RAS pathway and tumor immune infiltration as prognostic indicator of lung adenocarcinoma. Front. Oncol. ;12. (2022). [DOI] [PMC free article] [PubMed]
- 47.Mammarella, E., Zampieri, C., Panatta, E., Melino, G. & Amelio, I. NUAK2 and RCan2 participate in the p53 mutant pro-tumorigenic network. Biol. Direct. 16 (1), 11 (2021). [DOI] [PMC free article] [PubMed] [Google Scholar]
- 48.Yin, T. et al. Alteration of serum bile acids in non-small cell lung cancer identified by a validated LC–MS/MS method. J. Cancer Res. Clin. Oncol.149 (19), 17285–17296 (2023). [DOI] [PMC free article] [PubMed] [Google Scholar]
- 49.Schulze, A., Oshi, M., Endo, I. & Takabe, K. MYC targets scores are associated with cancer aggressiveness and poor survival in ER-Positive primary and metastatic breast cancer. Int. J. Mol. Sci.21 (21), 8127 (2020). [DOI] [PMC free article] [PubMed] [Google Scholar]
- 50.Tang, Y., Jiang, Y., Qing, C., Wang, J. & Zeng, Z. Systematic construction and validation of an epithelial–mesenchymal transition risk model to predict prognosis of lung adenocarcinoma. Aging13 (1), 794–812 (2020). [DOI] [PMC free article] [PubMed] [Google Scholar]
- 51.Song, J. et al. Epithelial-mesenchymal transition markers screened in a cell-based model and validated in lung adenocarcinoma. BMC Cancer. 19 (1), 680 (2019). [DOI] [PMC free article] [PubMed] [Google Scholar]
- 52.Liu, Q. et al. The expression profile and clinic significance of the SIX family in non-small cell lung cancer. J. Hematol. Oncol.9 (1), 119 (2016). [DOI] [PMC free article] [PubMed] [Google Scholar]
- 53.Magnusson, K. et al. ANLN is a prognostic biomarker independent of Ki-67 and essential for cell cycle progression in primary breast cancer. BMC Cancer. 16 (1), 904 (2016). [DOI] [PMC free article] [PubMed] [Google Scholar]
- 54.Deng, F., Xu, Z., Zhou, J., Zhang, R. & Gong, X. ANLN regulated by miR-30a-5p mediates malignant progression of lung adenocarcinoma. Comput Math Methods iMed. 2021:9549287. (2021). [DOI] [PMC free article] [PubMed] [Retracted]
- 55.Yang, Y. et al. SLC34A2 promotes cancer proliferation and cell cycle progression by targeting TMPRSS3 in colorectal cancer. Pathol. Res. Pract.229, 153706 (2022). [DOI] [PubMed] [Google Scholar]
- 56.Vlasenkova, R., Nurgalieva, A., Akberova, N., Bogdanov, M. & Kiyamova, R. Characterization of SLC34A2 as a potential prognostic marker of oncological diseases. Biomolecules ;11(12). (2021). [DOI] [PMC free article] [PubMed]
- 57.Esfahani, M. S. et al. Functional significance of U2AF1S34F mutations in lung adenocarcinomas. Nat. Commun.10 (1), 5712 (2019). [DOI] [PMC free article] [PubMed] [Google Scholar]
- 58.Yang, Y. et al. Prognostic significance of ANGPTL4 in lung adenocarcinoma: a meta-analysis based on integrated TCGA and GEO databases. Evidence-based complementary and alternative medicine. eCAM2022, 3444740 (2022). [DOI] [PMC free article] [PubMed] [Google Scholar] [Retracted]
- 59.Zhou, C. et al. B-lymphoid tyrosine kinase-mediated FAM83A phosphorylation elevates pancreatic tumorigenesis through interacting with β-catenin. Signal. Transduct. Target. Therapy. 8 (1), 66 (2023). [DOI] [PMC free article] [PubMed] [Google Scholar]
- 60.Chen, Z. et al. LncRNA FAM83A-AS1 facilitates tumor proliferation and the migration via the HIF-1α/ Glycolysis axis in lung adenocarcinoma. Int. J. Biol. Sci.18 (2), 522–535 (2022). [DOI] [PMC free article] [PubMed] [Google Scholar]
- 61.Yu, S. et al. Metformin suppresses NFE2L1 pathway activation to inhibit gap junction beta protein expression in NSCLC. Cancer Med.13 (7), e7021 (2024). [DOI] [PMC free article] [PubMed] [Google Scholar]
- 62.Lavin, Y. et al. Innate immune landscape in early lung adenocarcinoma by paired single-cell analyses. Cell169 (4), 750–65e17 (2017). [DOI] [PMC free article] [PubMed] [Google Scholar]
- 63.Zhang, B. et al. Construction of a prognostic and early diagnosis model for LUAD based on necroptosis gene signature and exploration of immunotherapy potential. Cancers14 (20), 5153 (2022). [DOI] [PMC free article] [PubMed] [Google Scholar]
- 64.Yi, M. et al. Exploiting innate immunity for cancer immunotherapy. Mol. Cancer. 22 (1), 187 (2023). [DOI] [PMC free article] [PubMed] [Google Scholar]
- 65.Jia, R., Sui, Z., Zhang, H. & Yu, Z. Identification and validation of Immune-Related gene signature for predicting lymph node metastasis and prognosis in lung adenocarcinoma. Front. Mol. Biosci. ;8. (2021). [DOI] [PMC free article] [PubMed]
- 66.Rotte, A. Combination of CTLA-4 and PD-1 blockers for treatment of cancer. J. Experimental Clin. Cancer Res.38 (1), 255 (2019). [DOI] [PMC free article] [PubMed] [Google Scholar]
- 67.Xu, L. et al. MiR-21/Sonic Hedgehog (SHH)/PI3K/AKT pathway is associated with NSCLC of primary EGFR-TKI resistance. Oncologie24 (3), 579–590(2022). [Google Scholar]
- 68.Awad, M. M. et al. An open-label, phase II study of the polo-like kinase-1 (Plk-1) inhibitor, BI 2536, in patients with relapsed small cell lung cancer (SCLC). Lung cancer (Amsterdam, Netherlands). ;104:126 – 30. (2017). [DOI] [PubMed]
Associated Data
This section collects any data citations, data availability statements, or supplementary materials included in this article.
Data Availability Statement
The datasets generated and/or analyzed during the current study are available in the [GSE78220] repository, [https://www.ncbi.nlm.nih.gov/geo/query/acc.cgi? acc= GSE78220] and [GSE31210] repository, [https://www.ncbi.nlm.nih.gov/geo/query/acc.cgi? acc= GSE31210]. The raw data is available in Github https://github.com/HongzhiLi579/raw-data.git and Zenodo https://doi.org/10.5281/zenodo.14603209 with DOI: 10.5281/zenodo.14603209.


