

Abstract
We report evidence of successful generation of field-reversed configuration plasmas by neutral beam injection. This is achieved by trapping the steady-state beams in an initial seed plasma, hence providing a direct source of toroidally directed energetic ion current and increase plasma density and temperature until plasma and magnetic pressures become comparable. Magnetic flux trapping occurs gradually, and the change in topology from open field line to fully a formed field-reversed configuration is complete within ~ 10 ms. Field reversal is first established using a traditional metric and complemented by advanced reconstruction algorithms of the magnetic topology and plasma pressure profiles; observations of characteristic changes to fast-ion orbits inferred from magnetic fluctuations; and an experimentally validated model of field reversal by neutral beam injection. These results establish a field-reversed configuration formation method which may offer technological and economic advantages on a path to a future fusion energy system.
Subject terms: Magnetically confined plasmas, Nuclear fusion and fission
The field-reversal configuration (FRC) represents a fusion device concept capable of high power density with a compact geometry. Here, the authors report on the generation and sustainment of a FRC by means of neutral beam injection in the C-2W machine at TAE technologies. This contributes towards establishing FRC as an alternative economic fusion device.
Introduction
Most magnetically-confined plasma systems with an eye on a fusion energy application have a core of closed magnetic flux surfaces, of which the field-reversed configuration (FRC) is no exception. The FRC is interesting as a fusion reactor concept due to its compact nature, high power density (typical average β ~90%), axisymmetric geometry with simple circular confinement coils, and linear unrestricted divertors which can facilitate power, ash, and impurity removal. The FRC has been explored in many experimental facilities1,2.
All FRC systems require an initial start-up method. Several approaches have successfully been implemented, creating a core of closed flux surfaces. These include electron-beam injection3,4, even- and odd-parity rotating magnetic fields (RMF)5,6, spheromak merging7, and theta pinch8,9. These differ in the physics and technology approaches for the startup. For example, the theta pinch method, which has received the most attention over the years, requires fast-pulsed power technology. In addition, one promising startup method failed to achieve field reversal, namely Neutral Beam Injection (NBI) in the 2XIIB experiments10. Various speculations about the requirements for field-reversal by this means have been postulated11,12.
The Norman machine (also known as C-2W) at TAE Technologies, Inc.13,14 was originally designed to use theta-pinch sections at each end to form, translate, collide, merge, and thermalize two FRCs in a central confinement vessel (CV). The resulting FRC is a suitable target for ionization and capture of the injected neutral beams. The beam ions enhance the stability of the plasma via large-orbit effects and help maintain plasma confinement by sourcing a fast-ion current15. The predecessors of C-2W at TAE had passed through several startup methods, beginning with an inductively accelerated ion ring in the C-1 facility16. The subsequent C-2 device was built to study NBI into the FRC17,18 based in part on simulations to optimize the neutral beam configuration. Later, after reports of rotational-shear stabilization19 in the GDT experiments20, plasma guns were added, creating the C-2U facility21–25.
The concept of steady state FRCs with current drive provided by neutral beam injection was studied by various authors in the 1980s26–30. Indeed, theta-pinch experiments exhibited noticeable increases in the confinement time with the addition of NBI31,32. Simulations also addressed the steady-state concept33–36.
In the present paper we demonstrate that in Norman, the combination of NBI with electrical biasing and other controls is sufficient to produce both startup of an FRC and its sustainment thereafter. This is achieved with inactive theta-pinch source sections. Moreover, in a major reconfiguration, both theta-pinch sections were removed, creating the modification known as Norm. This more compact configuration also achieves both startup and sustainment, with parameters similar to Norman.
Results
Machine configurations
Extensive details of the original configuration of Norman are given elsewhere13,14.
Both the original and present forms are illustrated in Fig. 1. In the Norm configuration, plasmas primarily reside in the CV bounded at each end by divertors. Between the CV and divertors is a fueling region located between the M1 magnetic coil (closest to the CV) and the mirror plug (MP) (closest to the divertor). The M2 coil adjusts the field in the fueling region to facilitate neutral-gas ionization and refueling on field lines closer to the separatrix. Current is driven in the plasma by 8 neutral beams with 15 keV energy, that can deliver up to 13 MW of neutral power37. Beams are injected 20° from normal to the CV with an impact parameter of 20 cm such that ionized particles will orbit in the ion-diamagnetic direction; the resulting ion current produces a field antiparallel to the external field produced by EQ magnet coils. Typically about 8 MW of NB power is attenuated by the plasma after accounting for duct losses and shine-through. NBI on its own tends to cause the plasma to rotate in the ion-diamagnetic direction. If the injection of angular momentum is left unchecked magneto hydrodynamic instabilities (typically n = 2 deformation) can arise. To counter this rotation concentric edge biasing electrodes in the divertors drive a radial current through the plasma that generates a torque in the electron diamagnetic direction38. This balance of forces stabilizes the FRC core enabling a steady-state equilibrium to persist39.
Fig. 1. Machine configuration evolution: the Norm configuration (top) with pure neutral beam injection field-reversed configuration (FRC) generation and Norman configuration (bottom) with theta pinch FRC formation tubes.

Contour lines are an example of typical magnetic flux surfaces and contour color is representative of typical plasma density profile.
Field reversal sequence
Seed plasmas are generated in Norman by an discharge of axial plasma guns and edge biasing electrodes fueled by gas injection in an open magnetic mirror configuration; plasma can be generated by the electrodes alone but this method is less reliable. Within 1 to 4 ms this generates a plasma target sufficient to begin trapping an injected neutral beam thereby providing a substantial fast-ion current. Over the next several ms plasma current grows leading to a robust FRC equilibrium in the CV. This is much longer than formation sequences in other formation methods, such as RMF40. This is likely due to the slow process of fast ion accumulation and resulting current drive. This elegant procedure stands in stark contrast to the startup sequence in the original Norman design and its predecessors: gas injection, pre-ionization, theta-pinch, translation, acceleration, and collision-merging. Direct measurements of field reversal were obtained via an internal magnetic field probe in the C-2 device using this formation method41. The FRC equilibria created by both methods are very similar, as demonstrated in Fig. 2 where core plasma emission is confined within the excluded flux radius42, defined as
| 1 |
where plasma and vac subscripts refer to the quantities with and without plasma present.
Fig. 2. Comparison of field-reversed configuration (FRC) equilibria generated by neutral beam injection (NBI) and theta-pinch.

(left) Images from a fast framing camera of O4+ emission at 650 nm with overlay of excluded flux radius and estimated X-points. Emission strongest in core where ne and Te are elevated. The magnetic axis points north, the camera’s view is mostly radial but pointed toward the midplane from −82 cm along the axis. This perspective accounts for the apparent lack of symmetry of the X-points. (right) Top figure depicts plasma excluded flux radius (proxy for separatrix) for both generation cases and an additional case with theta-pinch generation and NBI sustainment (Norman configuration); the theta-pinch generated FRC is established quickly while the NBI generated FRC forms gradually. Lower figures compare electron density (ne) and temperature (Te) profiles for each case at times indicated by dashed lines on upper plot. Theta-pinch profiles are taken before fast ions accumulate enough to dominate the equilibrium. NBI profiles are taken in the middle of the equilibrium phase when thermal and fast ion currents are similar. Density and temperature have both increased significantly due to NBI heating and configuration optimization: magnetic field shaping, edge biasing, and fueling.
The characteristics of the formation phase, i.e., the rise of plasma current, can be controlled by adjusting settings for magnet coil currents, neutral beam settings, electrode voltage, plasma-gun discharge, and gas fueling. During the formation the external magnetic field must be strong enough to balance the pressure of the diamagnetic object and weak enough to allow adequate field reversal. Section “Direct field reversal by neutral beam injection” will describe the criteria for these boundaries. Norman has been operated with both hydrogen and deuterium for both background plasma and beam species, but we typically use hydrogen and our analysis here will focus on those discharges for simplicity. After formation the FRC equilibrium parameters and shape can be manipulated.
Verification of field-reversal
A non-destructive direct measurement of the magnetic field inside the FRC is beyond current state-of-the-art diagnostic techniques. We are actively pursuing several methods, such as, Faraday rotation of far-infrared radiation, terahertz pulsed polarimetry, circular differential polarimetry, among others43, to make this measurement, but as of now we rely on model-based inferences. Now we describe those models in detail, from comparison with early methodology to more sophisticated Monte Carlo and Bayesian techniques.
Past methodology
The results from Norman will be contrasted with the efforts on 2XIIB10. That effort was in support of the concept then labeled a field-reversed mirror. While approaching field reversal, it was not achieved. Based on our findings this was due to inadequate neutral current and impact parameter given beam energy and external magnetic field. In the meantime, research on field-reversed configurations (FRC) continued using other formation methods. One of these employed the traditional theta-pinch (some including translation). The other applied rotating magnetic fields. Pursuit of these methods, which continue to this day, were surveyed in two review papers1,2. Since the 2XIIB experiments, FRC formation by NBI has not been attempted, until now.
This is the first experimental demonstration of successful NBI-based field reversal. To verify successful NBI-based field reversal, two non-direct approaches are taken here. The first adapts the field-reversal index method used in the 1979 paper10. The second approach builds on several fully two-dimensional (2D) reconstructions of experimental discharges to infer the trapped magnetic flux arising in true FRCs.
The original method defines the field reversal index ζ ≡ ∣ΔB∣/Bvac: here ΔB is the field increment on axis at the plasma mid-plane which is produced by plasma current, and Bvac is the on-axis vacuum field at the mid-plane. Field reversal requires ζ ≥ 1. The ΔB for an idealized thin current sheet is found by an integral of the fields from a ring current,
| 2 |
where I is the total sheet current, Rp and Lp are the sheet radius and half-length respectively. Complementing this is an equation for the field at the wall Bw (also a measurable). In the far-field approximation the field due to the sheet current at the wall is
| 3 |
where rw is the wall radius. The current inferred from Eq. (3) is substituted into Eq. (2) thence yielding
| 4 |
A maximum field reversal of ζ = 0.9 was claimed for 2XIIB10. The foregoing method applied to Norman is shown in Fig. 3, clearly exhibiting the achievement of field reversal according to this simple model.
Fig. 3. Estimate of field-reversal parameter in the Norm configuration during and after reversal process.
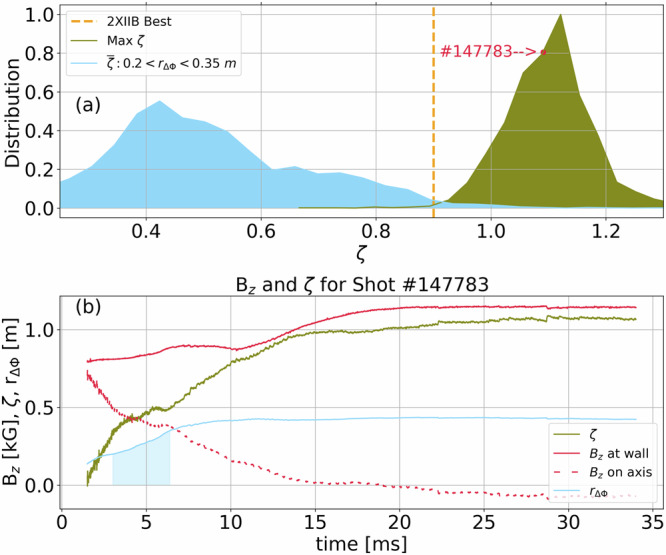
a Distribution of maximum ζ across 4671 shots with plasma radius (rΔΦ) greater than 40 cm which persisted longer than 30 ms and average ζ during the reversal process while 20 < rΔΦ < 35 cm. Dashed line indicates best result on 2XIIB. b Time history of a typical field-reversed configuration’s (shot #147783) magnetic field (Bz) at the wall (measured) and r = 0 cm (inferred by model described in Eq. (4)), as well as a calculation of ζ(t) itself. Shaded region indicates the pre-reversal averaging time window for the blue distribution in (a).
The model rests on assumptions about plasma current distribution. Using Norm’s large data set, more sophisticated techniques will be explored to strengthen the case.
Current Tomography equilibria reconstruction
Measurements verify the common assumption of azimuthal symmetry of the FRC. By exploiting this fact models can be developed to describe the equilibrium in 2D. In the following sections we examine two methods that rely on experimental data to produce plasma parameter profiles and magnetic field structures. Reconstructions of hundreds of shots showed field reversal; we will illustrate and compare results of both methods in Fig. 4 taking shot #147783 as an example. Neither of these reconstruction methods make any assumption about the presence of a field-reversed configuration; both methods can and do yield solutions where the field lines are open in some cases.
Fig. 4. Representation of the field-reversed configuration (FRC) equilibrium evolution and plasma parameters of shot #147783 as generated by both the Current Tomography and SEQUOIIA methods.

a–c Depiction of the FRC's magnetic topology as it is generated. Contours represent the current tomography reconstructions of 2D flux surfaces from magnet currents, magnetic probes, and eddy current model inputs, vertical lines in (d) indicate time of each reconstruction. d Time evolution of amount of trapped flux as determined by current tomography (red), total plasma current (green), and the probability that field-reversal is present at that time (blue), error bars represent the Bayesian inference uncertainty in the calculations. e–h Profiles of magnetic field, electron density, electron temperature, and fast ion and total plasma current density, respectively. They are generated by the SEQUOIIA code from edge magnetic field measurements averaged over the steady-state equilibrium period (21–30 ms) and compared to experimental data and the current tomography method.
The current tomography method uses Bayesian inversion to find the most likely plasma current distribution given the information from a variety of magnetic sensors, external magnet currents, and a physics model. Two advantages of the Bayesian inversion are its ability to combine sensor information from heterogeneous sources and its flexibility in incorporating physics models of variable complexity and certainty. This flexibility makes it ideally suited to study the time evolution of plasma during formation. The method has been validated extensively in axisymmetric plasmas in Tokamaks (JET, TCV) and FRCs (C-2U, Norman)44–47
The inference process takes place in two steps. First, the evolution of magnet currents are used to estimate the currents induced in the CV using an eddy current model. This gives an initial guess for the CV currents prior mean. In the second step Bayesian inference is used to calculate a posterior distribution of plasma currents and CV currents given the magnetic measurements and the magnet currents.
These parameters are obtained directly from the data by running an optimization algorithm that maximizes the evidence (empirical Bayes’), making the inference completely data driven. From the inferred currents, it is straightforward to obtain magnetic flux. Figure 4a–d shows the plasma flux evolution resulting from the inference process including a time history of trapped flux and total plasma current, which is determined to be ~300 kA. The inference process creates a distribution of possible states, and by interrogating that distribution we can arrive at the probability that the state is an FRC. This is written as P(FRC) in Fig. 4d.
Monte Carlo equilibria reconstruction
To gain further insight into the internal magnetic field structure of the FRC, TAE developed a 2D axisymmetric equilibrium reconstruction tool to solve Ampere’s law () called SEQUOIIA (Synthetic Equilibrium from Observational Input Interpretative Algorithm)48. It uses experimental measurements of density and temperature along with machine inputs, such as coil currents and neutral beam parameters, in a realistic Norm geometry.
The magnetic field is calculated from diamagnetic currents in the thermal background plasma, fast ion currents, and vacuum field with coil and eddy currents. Neutral beam fast ion density and current are calculated using a 2D full-orbit Monte Carlo code with realistic neutral beam sources and sinks.
The simulation begins with the vacuum magnetic field and thermal plasma. Profiles and currents are calculated in the initial field. Fast ions are introduced and parameters are recalculated using the quasi-neutrality condition ni = ne − nf, where nf is the fast ion density. In the modified magnetic field, the thermal diamagnetic and fast ion currents are calculated in an iterative manner until a steady state solution is achieved. The difference between experimental magnetic flux and simulated magnetic flux is minimized by adjusting nf by varying fast ion losses. The final steady state solution is also compared with the other experimental measurements.
Radial profiles from reconstructions of shot #147783 during its steady-state equilibrium (21–30 ms) are shown in Fig. 4e–h. The resulting equilibrium state is a field-reversed configuration with a separatrix radius of 0.4 m, axial length of 2 m, and trapped poloidal flux of ~ 6 mWb. A total plasma current, produced by thermal plasma and fast ions, of 350 kA is required to create the resulting FRC. Most of the thermal plasma current is near the boundary of the closed field region resulting in a peaking of total current near the separatrix as shown in Fig. 4h. The total energy of the plasma is 9 kJ with nearly equal contributions from the thermal plasma and fast ions.
Mirror-to-FRC transition
During the transition from a high-beta mirror plasma to a field-reversed configuration, the structures of certain fast-ion-driven wave modes observed in C-2W evolve consistent with the magnetic topology change. In C-2W, magnetic fluctuations are monitored using an array of 3-axis Mirnov probes mounted on the interior walls of the CV. These probes are arranged in arrays of eight rings of eight probes each that are spaced at nearly regular intervals azimuthally, and an additional linear array covering most of the length of the CV49. The ring arrays can be used to extract the azimuthal mode number, n, of the fluctuations and the linear array can inform on the axial structure of the modes. Here, we discuss two distinct observations: first, magnetic oscillations related to the azimuthal structure and precession of the fast-ion orbits; and second, an energetic-particle mode corresponding to the fast-ion axial bounce motion and axial turning points.
Precession motion
The evolution of fast-ion driven fluctuations from an n = 1 toroidal mode structure to n = 2 follows changes in the excluded flux radius. These fluctuations are attributed to the fast ion precession mode, a finite Larmor radius mode first described in the context of relativistic electron layers in the Astron device50,51. This mode arises from energetic particle orbit precession phase coherence induced by the self-field generated by the injected energetic particles (electrons in Astron, ions in Norman). The precession phase coherence leads to macroscopic perturbations to the magnetic field and density profiles observable in magnetic field measurements at the vessel wall52 and line-integrated density measurements through the plasma, respectively.
The macroscopic perturbations are expected to exhibit a toroidal mode structure matching that of the fast ion orbits themselves53. The mode frequencies evolve over the course of each discharge, but typically fall within the range of 50–400 kHz, consistent with expected precession frequencies of the fast ion orbits. The mode frequencies begin higher at the start of the shot and decrease as the field is reversed. The toroidal mode shape evolution is experimentally consistent with the expected evolution of the fast ion orbit types as the field reverses, in the absence of direct measurements of fast ion orbit types. Thus, as the field reversal parameter increases and fast ion orbit shapes transition from predominantly n = 1 (cyclotron orbits) to n = 2 (betatron orbits), the strength of fluctuations with the latter toroidal mode shape is expected to increase54.
Indeed, this transition is consistently observed during FRC formation. Figure 5 depicts this transition in the dominant fast ion mode structure during FRC formation for several shots with similar excluded flux evolutions taken from across the Norman operational campaign without the use of theta-pinch formation sections. The amplitude of these fluctuations are small in both cases due to the stabilizing effect of edge biasing electrodes55.
Fig. 5. Spectrally integrated amplitude of magnetic fluctuations measured in Bz showing the shift from predominantly n = 1 to n = 2 type fluctuations corresponding to the evolution in dominant fast ion orbit type during the field reversal period as the plasma radius grows.

Amplitudes of both of these fluctuations are small due to electrode biasing stabilization. Data from 25 neutral beam injection generated field-reversed configuration shots across the Norm experimental campaign used to generate this plot. Dark traces are the medians of all shots in the series.
Axial bounce motion
Energetic-particle modes (EPMs) are plasma wave modes that correspond to resonances of the characteristic periodic motions of fast ions56. In open field-line mirror-trapped plasmas, fast ions will bounce axially between turning points with a frequency ωz determined by the external magnetic field profiles. In FRC plasmas, fast ions will bounce axially between the ends of the FRC, a shorter distance leading to a higher ωz. During the mirror-to-FRC transition, the fast-ion turning points are expected to move toward the mid-plane and the axial bounce frequency will increase accordingly. Recently, an EPM was identified in C-2W that corresponds to a resonance of the axial bounce motion and its harmonics57. We have called this mode the Axial Bounce Mode (ABM) and will adopt this language herein. The results of several experiments on the ABM have been reported57, and we expect to publish a more detailed article soon.
The ABM in C-2W manifests as an axisymmetric magnetic fluctuation (n = 0 azimuthal mode structure) primarily in the Bz and Br components of the magnetic field; eddy currents in the wall artificially reduce the observed amplitudes of the Br fluctuations and we restrict ourselves to the Bz component in diagnosing this mode. In dedicated mirror experiments, the turning points of fast ions sourced from NBI were dynamically scanned using field shaping to establish that the ABM is a resonance of their axial bounce motion; the mode was shown to oscillate with frequency ω = ℓωz, where ℓ is a positive integer and ωz is the axial bounce frequency of the fast ions in the mirror field. The mode typically has a standing wave structure with odd parity about the mid-plane in Bz, the magnitude peaks near the fast ion turning points, and the amplitude increases with the total NBI power. We have established robust control of the mode using beam species, energy, and injection angle, and suppression of the ABM shows it is not detrimental to plasma confinement. The mode is understood to arise from the axial bunching of fast ions in phase space. A reduced model of ion rings in an axial potential well has been constructed to reproduce many experimentally observed features of the ABM58.
Since the mode is observed in both mirror and FRC plasmas, it can be used to assess changes to the magnetic topology after the mirror-to-FRC transition. Figure 6 shows an example of the transition from a mirror plasma to an FRC and how the features of the ABM evolve. The plasma is initially kept as a mirror plasma with a small rΔϕ using a lower level of NBI power, Fig. 6a. Applying additional NBI power at 10 ms increases the trapped flux until FRC formation at approximately 16 ms. Figure 6b shows a spectrogram of the Mirnov probe signals at z = ± 0.45 m decomposed into n = 0 fluctuations with the fundamental and two harmonics of the ABM mode indicated. In the mirror region, we can see the mode has a low amplitude due to the lower beam power and has a nearly constant frequency that matches well with the bounce frequency determined from the vacuum magnetic field; typically, the third harmonic has the largest amplitude in the mirror regime, as is the case here. When the beam power is increased, we see the amplitude of the mode increase rapidly, and the frequency begins to rise; this increase in frequency is due to a constriction of the fast-ion turning points towards the mid-plane.
Fig. 6. Mirror to FRC transition induced by an increase in total NBI power, the axial bounce frequency of the fast ions is observed to increase during the reversal process as the turning points (TP) move toward the mid-plane.

a Temporal evolution of excluded flux radius, rΔϕ, (left abscissa) and neutral-beam injection power (right abscissa); mirror and FRC plasma regimes are highlighted by orange and blue, respectively, with a transition zone between them. b Spectrogram of Bz fluctuations with n = 0 azimuthal structure and averaged over measurements at axial locations z = ± 0.48 m, the ABM and harmonics are indicated by arrows and the vacuum bounce frequency of fast ions sourced from NBI by the dashed white line. c Axial structure of the axial bounce mode in the Mirror and FRC regions (left abscissa) and vacuum field magnitude (right abscissa); the turning point regions identified by the peak amplitude of the mode (shaded regions) and the turning points of the vacuum field (black dashed lines) are indicated. Error bars represent the standard deviation of the mode amplitude over time.
In Fig. 6c, cross-correlation of the ring Mirnov array with the linear Mirnov array is used to extract the axial structure of the mode in the mirror and FRC regions of Fig. 6a. In the mirror, the mode is observed to peak around z = ±1.6 m, a good match for the vacuum field turning point at approximately z = ±1.5 m, calculated using ionization at the mid-plane of the vacuum field profile indicated and the nominal beam injection angle. Once the FRC has formed the mode peaks sharply at the probes located at z = ±0.48 m and rapidly decays indicating the reduced extent of the axial confinement of the fast ions. The evolution of this n = 0 ABM as presented for the shot here is consistently observed in the formation of FRC plasmas across all Norm campaigns and represents a clear signature of the changing magnetic topology induced by the NBI reversal process.
Direct field reversal by neutral beam injection
Now we construct a theoretical model to describe the generation of an FRC object. It is a zero-dimensional construct focusing on beam and plasma currents. It derives a minimum criterion for field reversal and is compared to experimental results.
A cylindrical ring of ion current creates a magnetic field,
| 5 |
where If is the total ion current and L is the length of the cylindrical ring of current. If the ion current is carried by fast ions injected by neutral beams then the ion current buildup is determined by the equation , and the steady-state fast ion current is , where τℓ is the lifetime of fast ions determined by loss mechanisms such as charge-exchange and collisions with background plasma, τ2π is the average orbit time about the cylindrical axis, and Ib is the portion of injected neutral beam current that has been trapped in the plasma (i.e., that part which is not lost to beam shine-through S), Ib = (1 − S)Iinj, where Iinj is the injected current of neutral particles.
A background magnetic field, B, is reversed by the neutral beam injected fast ion current if Bf > B. The condition for fast ion current to reverse the field, Bf > B, is that , or in other words,
| 6 |
In the initial vacuum magnetic field, the most efficient way to impart current from the beams is if the impact parameter of beam injection is equal to the initial ion gyroradius so that the fast ion orbits are Larmor orbits encircling the cylindrical axis and the average period of gyration is equal to the gyroperiod, . The requirement to reverse the field becomes
| 7 |
This expression is approximate because the magnetic field changes as the fast ion current builds up, however it is a useful rule of thumb which has been validated empirically. Experiments which scanned over various values of magnetic field and neutral beam current have been conducted on Norman to explore the operational boundaries between reversed and non-reversed mirror plasmas. Figure 7 shows estimated values of the field produced by the fast ions versus the external field for discharges that achieved rΔΦ > 35 cm (shown as green dots) and those that did not (as red crosses). The quantities shown are window-averaged between 1 and 5 milliseconds. The apparent boundary for FRC formation aligns well with theoretical arguments laid out above and reflects what has long been observed in our NBI generated FRC campaigns.
Fig. 7. Magnetic field produced by fast ions versus external magnetic field.

Discharges that eventually achieved rΔΦ > 35 cm are shown as green dots, while those that did not are shown as red crosses. The boundary where Bf = B0 is shown as the black dashed line. Only hydrogen plasma discharges with hydrogen beams are shown.
Discussion
Field-reversed configurations have been generated from seed mirror plasmas via neutral beam injection. The resulting equilibria have been shown to be comparable to those established through the merging and acceleration of theta-pinch generated FRCs. Historical metrics show conclusively that field reversal has been established. Additionally, many contemporary diagnostic techniques provide a preponderance of evidence for the same. Furthermore, simulations matching the conditions in Norman plasmas indicate that NBI generated field reversal has been realized.
This desired yet unexpected breakthrough discovery made during the operational campaign of Norman has vastly simplified the start-up requirements and operational complexities for FRC based fusion reactor designs. It also marks a material advance towards the ultimate goal of aneutronic power generation via high-beta self-confined plasmas, which are arguably the most magnetically efficient topology for an economic fusion reactor.
Methods
Ensemble results
After more than 50,000 individual shots on Norman extensive operational mastery has been attained. FRCs are generated by NBI which results in gradual increase of plasma diamagnetism; the FRCs are held in steady-state until the storage capacity of the power supplies that drive the neutral beams has been extinguished (40 ms). The plasma has been optimized in several stages which should be the topic of future publications, but the underlying result is that FRCs with thermal energies (determined by pressure balance and interferometry measurements59) approaching 10 kJ are now produced repeatedly. Figure 8 shows a representative ensemble of 39 shots.
Fig. 8. Typical plasma parameters of an ensemble of 39 repeated field-reversed configuration shots.

Shaded regions represent shot-to-shot standard deviation. (a) excluded flux radius, (b) average electron density, (c) electron temperature, (d) total temperature, (e) thermal energy, (f) external magnetic field.
Bayesian current tomography
Given a forward model D = H(X) relating a set of continuous variables , each a function of location , to a set of measurements arranged in a vector D, we can find all the solutions in X that explain the data in D and arrange them in a posterior probability distribution . The misfit between the measurements and model predictions is also modelled by a probability distribution , known as the likelihood function. Bayes’ theorem allows us to obtain the posterior from the likelihood given a model for the relationships of the variables in X expressed in probabilistic form, termed the prior distribution .
| 8 |
The denominator is the marginal likelihood or evidence and normalizes the volume of the posterior to 1.
For this work, the information from external magnetic sensors and magnet current time evolution are used to infer the most likely plasma current distribution. The CV and plasma region are described by a large set of discrete current carrying elements as in Fig. 9.
Fig. 9. Forward model schematics. Magnets, plasma, and vessel currents are represented by multiple axisymmetric current carrying elements with constant current density.

There are 8 arrays of 8 azimuthal Mirnov probes measuring the three magnetic field components plus 30 diamagnetic loops located outside the plasma. Additional flux loops and Bz probes are located outside the vessel.
Since the location of the current sources and magnetic measurements are fixed in space, the current sources on the plasma and CV in X can be linearly related to the magnetic sensor measurements in D through the matrix representation K of the Biot-Savart operator
| 9 |
Assuming additive measurement noise independent of X, the likelihood function can be modelled as a n-dimensional Gaussian distribution.
| 10 |
Where is the data covariance matrix. The prior distribution can also be approximated by a multivariate probability distribution over X
| 11 |
Where is the prior covariance matrix and is the prior mean. The posterior distribution can likewise be approximated by a k-dimensional Gaussian Probability distribution
| 12 |
Since all the probability distributions above are Gaussian, and Gaussian distributions are related to Gaussian distributions through linear operations, the posterior mean and covariance can be obtained explicitly from the prior and data covariances, prior mean and measurements
| 13 |
| 14 |
The prior probability distribution encapsulates the physics model expressed as a probability distribution. Our prior belief about is that it must be a smooth function of r, so we use a simple parametrization for the prior covariance matrix based on the expected current ranges and correlations between neighboring current elements parametrized with scale lengths along the spatial dimensions
| 15 |
With . The standard deviation σ determines the expected excursion level for the currents, while the scale lengths λi determine how quickly the currents can change with the coordinate ri.
Supplementary information
Acknowledgements
The TAE Team would like to thank its shareholders for the financial support.
Author contributions
T.R. executed initial NBI reversal experiments. T.R, A.F, S.G., J.A.R, M.T.T, E.M.G, and S.K. analyzed experimental data. S.D, A.F, M.O., L.G., and L.C.S. provided theoretical interpretation. R.M.M., P.Y, E.T., H.G., and M.W.B supported the development of this work. T.R., S.D., A.F., S.G., M.O., J.A.R., L.C.S., M.T.T., E.M.G., L.G., S.K., R.M.M., P.Y., E.T., H.G., S.A., I.A., R.A., V.A., J.A., D.C.B., M.B., N.G.B., D.B., F.C., R.C., T.D., B.D., A.V.D., P.F., D.K.G., K.H., J.S.K., K.K., B.K., S.A.K., A.K., C.K.L., D.L., D.MacD., D.M., J.A.M., J.M., P.M., T.M., M.P.M., R.Me., R.Mi., H.M., M.E.M., M.N., A.N., B.S.N., R.P, E.P., J.P., K.P., T.W.R., L.S., J.H.S., G.N.S., A.G.H.S., M.S., R.J.S., G.S., V.S., Y.S., G.L.S., L.T., J.B.T., J.U., T.V., C.E.W., S.W., C.W., M.W., K.Z., S.Z., M.T., A.S., S.P., T.T., M.W.B. supported the experimental program.
Peer review
Peer review information
Nature Communications thanks the anonymous reviewer(s) for their contribution to the peer review of this work. A peer review file is available.
Data availability
The data that support the findings of this study are available from the corresponding author upon request due to IP considerations.
Code availability
Code used to analyze experimental data can be made available upon request due to IP considerations.
Competing interests
TAE Technologies is a private corporation owned and financially supported by its shareholders. The authors of this manuscript may have financial interest in the company.
Footnotes
Publisher’s note Springer Nature remains neutral with regard to jurisdictional claims in published maps and institutional affiliations.
Supplementary information
The online version contains supplementary material available at 10.1038/s41467-025-58849-5.
References
- 1.Tuszewski, M. Field reversed configurations. Nucl. Fusion28, 2033 (1988). [Google Scholar]
- 2.Steinhauer, L. C. Review of field-reversed configurations. Phys. Plasmas18, 070501 (2011). [Google Scholar]
- 3.Christofilos, N.C. Astron thermonuclear reactor. Technical report, California. Univ., Livermore. Radiation Lab., October 1958. Prepared for the Second U.N. International Conference on the Peaceful Uses of Atomic Energy, 1958.
- 4.Davis, H. A., Meger, R. A. & Fleischmann, H. H. Generation of field-reversing e layers with millisecond lifetimes. Phys. Rev. Lett.37, 542–545 (1976). [Google Scholar]
- 5.Blevin, H. & Thonemann, P. Experimental studies of a theta-pinch discharge. Nucl. Fusion,Suppl. 1, 55, (1962).
- 6.Cohen, S. A. et al. Formation of collisionless high-β plasmas by odd-parity rotating magnetic fields. Phys. Rev. Lett.98, 145002 (2007). [DOI] [PubMed] [Google Scholar]
- 7.Wells, D. R. Injection and Trapping of Plasma Vortex Structures. Phys. Fluids9, 1010–1021 (1966). [Google Scholar]
- 8.Kolb, A. C., Dobbie, C. B. & Griem, H. R. Field mixing and associated neutron production in a plasma. Phys. Rev. Lett.3, 5–7 (1959). [Google Scholar]
- 9.Slough, J. T. et al. Confinement and stability of plasmas in a field-reversed configuration. Phys. Rev. Lett.69, 2212–2215 (1992). [DOI] [PubMed] [Google Scholar]
- 10.Turner, W. C. et al. Field-reversal experiments in a neutral-beam-injected mirror machine. Nucl. Fusion19, 1011 (1979). [Google Scholar]
- 11.Hammer, J. H. & Berk, H. L. A steady-state beam-driven field-reversed mirror. Nucl. Fusion22, 89 (1982). [Google Scholar]
- 12.Tsidulko, Yu. A. Adiabatic model of field reversal by fast ions in an axisymmetric open trap. Plasma Phys. Rep.42, 559–565 (2016). [Google Scholar]
- 13.Gota, H. et al. Overview of c-2w, high temperature, steady-state beam-driven field-reversed configuration plasmas. Nucl. Fusion61, 106039 (2021). [Google Scholar]
- 14.Gota, H. et al. Formationtion of hot, stable, long-lived field-reversed configuration plasmas on the c-2w device. Nucl. Fusion59, 112009 (2019). [Google Scholar]
- 15.Rostoker, N., Binderbauer, M. W. & Monkhorst, H. J. Colliding beam fusion reactor. Science278, 1419–1422 (1997). [DOI] [PubMed] [Google Scholar]
- 16.Rostoker, N., Binderbauer, M., Garate, E., & Bystritskii, V. Formation of a field reversed configuration for magnetic and electrostatic confinement of plasma, May 2005. U.S. Patent 6891911B2.
- 17.Binderbauer, M. W. et al. Dynamic formation of a hot field reversed configuration with improved confinement by supersonic merging of two colliding high-β compact toroids. Phys. Rev. Lett.105, 045003 (2010). [DOI] [PubMed] [Google Scholar]
- 18.Tuszewski, M. et al. A new high performance field reversed configuration operating regime in the C-2 devices. Phys. Plasmas19, 056108 (2012). [Google Scholar]
- 19.Anikeev, A. V., Bagryansky, P. A., Ivanov, A. A., Kuzmin, S. V. & Salikova, T. V. Experimental observation of non-mhd effects in the curvature driven flute instability. Plasma Phys. Control. Fusion34, 1185 (1992). [Google Scholar]
- 20.Anikeev, A. V. et al. Observation of magnetohydrodynamic stability limit in a cusp-anchored gas-dynamic trap. Phys. Plasmas4, 347–354 (1997). [Google Scholar]
- 21.Tuszewski, M. et al. Field reversed configuration confinement enhancement through edge biasing and neutral beam injection. Phys. Rev. Lett.108, 255008 (2012). [DOI] [PubMed] [Google Scholar]
- 22.Binderbauer, M. W. et al. A high performance field-reversed configurationa). Phys. Plasmas.22, 056110 (2015).
- 23.Guo, H. Y. et al. Achieving a long-lived high-beta plasma state by energetic beam injection. Nat. Commun.6, 6897 (2015). [DOI] [PubMed] [Google Scholar]
- 24.Binderbauer, M. W. et al. Recent breakthroughs on C-2U, Norman’s legacy. AIP Conf. Proc.1721, 030003 (2016). [Google Scholar]
- 25.Gota, H. et al. Achievement of field-reversed configuration plasma sustainment via 10 mw neutral-beam injection on the c-2u device. Nucl. Fusion57, 116021 (2017). [Google Scholar]
- 26.Hirano, K. A steady-state axisymmetric toroidal system. Nucl. Fusion24, 1159 (1984). [Google Scholar]
- 27.Hamada, S. A model of equilibrium transport and evolution of field reversed configurations. Nucl. Fusion26, 729 (1986). [Google Scholar]
- 28.Okamoto, M. A steady state solution to a field reversed configuration. Nucl. Fusion27, 833 (1987). [Google Scholar]
- 29.Ohnishi, M., Kuranaga, H. & Okamoto, M. Suppression, by ion beams, of the m = 2 rotational instability in a field reversed configuration. Nucl. Fusion28, 1427 (1988). [Google Scholar]
- 30.Okamoto, M., Berk, H. L. & Hammer, J. H. Relation between beam driven seed current and rotation in a steady state field reversed configuration. Nucl. Fusion29, 2063 (1989). [Google Scholar]
- 31.Asai, T. et al. Experimental evidence of improved confinement in a high-beta field-reversed configuration plasma by neutral beam injection. Phys. Plasmas7, 2294–2297 (2000). [Google Scholar]
- 32.Okada, S. et al. Experiments on additional heating of frc plasmas. Nucl. Fusion41, 625 (2001). [Google Scholar]
- 33.Takahashi, T., Kato, T., Kondoh, Y. & Iwasawa, N. Power deposition by neutral beam injected fast ions in field-reversed configurations. Phys. Plasmas11, 3801–3807 (2004). [Google Scholar]
- 34.Lifschitz, A. F., Farengo, R. & Arista, N. R. Monte carlo simulation of neutral beam injection into a field reversed configuration. Nucl. Fusion42, 863 (2002). [Google Scholar]
- 35.Lifschitz, A. F., Farengo, R. & Hoffman, A. L. Calculations of tangential neutral beam injection current drive efficiency for present moderate flux frcs. Nucl. Fusion44, 1015 (2004). [Google Scholar]
- 36.Yamada, M. et al. A self-organized plasma with induction, reconnection, and injection techniques, the spirit concept for field reversed configuration research. Plasma Fusion Res.2, 004–004 (2007). [Google Scholar]
- 37.Titus, J. B., Korepanov, S., Tkachev, A., Pirogov, K. & Knapp, K. Wire calorimeter for direct neutral beam power measurements on c-2w. Rev. Sci. Instrum.92, 053520 (2021). [DOI] [PubMed] [Google Scholar]
- 38.Nations, M., Romero, J. A., Gupta, D. K., Sweeney, J. & the TAE Team. High-fidelity inference of local impurity profiles in C-2W using Bayesian tomography. Rev. Sci. Instrum.93, 113522 (2022). [DOI] [PubMed] [Google Scholar]
- 39.Ryutov, D. D., Berk, H. L., Cohen, B. I., Molvik, A. W. & Simonen, T. C. Magneto-hydrodynamically stable axisymmetric mirrorsa. Phys. Plasmas18, 092301 (2011). [Google Scholar]
- 40.Cohen, S. A. et al. Laboratory study of the PFRC-2’s initial plasma densification stages. Phys. Plasmas30, 102503 (2023). [Google Scholar]
- 41.Gota, H. et al. Internal magnetic field measurement on C-2 field-reversed configuration plasmasa. Rev. Sci. Instrum83, 10D706 (2012). [DOI] [PubMed] [Google Scholar]
- 42.Tuszewski, Michel. Excluded flux analysis of a field reversed plasma. Informal Report LA-8512-MS, Los Alamos Scientific Laboratory, September (1980).
- 43.Nations, Marcel. Internal magnetic field measurements for beam-driven field-reversed configuration fusion devices. Technical report, TAE Technologies, Foothill Ranch, CA, January (2024).
- 44.Svensson, J., Werner, A. & JET-EFDA Contributors. Current tomography for axisymmetric plasmas. Plasma Phys. Control. Fusion50, 085002 (2008). [Google Scholar]
- 45.Romero, J. A. & Svensson, J. Optimization of out-vessel magnetic diagnostics for plasma boundary reconstruction in tokamaks. Nucl. Fusion53, 033009 (2013). [Google Scholar]
- 46.Romero, J. A., Dettrick, S. A., Granstedt, E., Roche, T. & Mok, Y. Inference of field reversed configuration topology and dynamics during alfvenic transients. Nat. Commun.9, 691 (2018). [DOI] [PMC free article] [PubMed] [Google Scholar]
- 47.Romero, J.A. Optimization and feedback control of the c-2w configuration. 29th IAEA Fusion Energy Conference, October 2023.
- 48.Gupta, S., Sato, I., Dettrick, S. Hubbard, K. & Yushmanov, P. Equilibrium reconstruction of beam driven c-2w plasmas. In APS Division of Plasma Physics Meeting Abstracts volume 2022, pages TP11–027, 2022.
- 49.Roche, T. et al. Magnetic diagnostic suite of the c-2w field-reversed configuration experiment. Rev. Sci. Instrum.89, 10J107 (2018). [DOI] [PubMed] [Google Scholar]
- 50.Briggs, R. J. et al. Astron program final report. Technical report, Lawrence Livermore National Laboratory, 8 (1975).
- 51.Furth, H. P. Unstable Precession under the Influence of Drag Forces. Phys. Fluids8, 2020–2025 (1965). [Google Scholar]
- 52.Tobin, M., Roche, T., Matsumoto, T. & TAE Team. MHD mode identification by higher order singular value decomposition of C-2W Mirnov probe data. Rev. Sci. Instrum.92, 043510 (2021). [DOI] [PubMed] [Google Scholar]
- 53.Deng, B. H. et al. First experimental measurements of a new fast ion driven micro-burst instability in a field-reversed configuration plasma. Nucl. Fusion58, 126026 (2018). [Google Scholar]
- 54.Harned, D. S. Kink instabilities in long ion layers. Phys. Fluids25, 1915–1921 (1982). [Google Scholar]
- 55.Schmitz, L. et al. Suppressed ion-scale turbulence in a hot high-beta plasma. Nat. Commun.7, 13860 (2016). [DOI] [PMC free article] [PubMed] [Google Scholar]
- 56.Heidbrink, W. W. & White, R. B. Mechanisms of energetic-particle transport in magnetically confined plasmas. Phys. Plasmas27, 030901 (2020). [Google Scholar]
- 57.Karbashewski, S. et al. Observation of an axisymmetric energetic particle mode driven by axial bounce oscillations of fast ions in c-2w. In APS Division of Plasma Physics Meeting Abstracts volume 2024, page TP12. 00127, (2024).
- 58.Granstedt, E. M. et al. Theory, control, and use of a fast ion axial bounce mode on c-2w. In APS Division of Plasma Physics Meeting Abstracts volume 2024, page TP12. 00128, (2024).
- 59.Roche, T. et al. The integrated diagnostic suite of the C-2W experimental field-reversed configuration device and its applications. Rev. Sci. Instrum.92, 033548 (2021). [DOI] [PubMed] [Google Scholar]
Associated Data
This section collects any data citations, data availability statements, or supplementary materials included in this article.
Supplementary Materials
Data Availability Statement
The data that support the findings of this study are available from the corresponding author upon request due to IP considerations.
Code used to analyze experimental data can be made available upon request due to IP considerations.