

Abstract
Olfactomedin 1 (OLFM1) is thought to be involved in neuronal development, synaptic structure and function. However, the expression level of peripheral OLFM1 in Alzheimer’s disease (AD) and its role in AD are unclear. The present study was conducted to assess the relationship of serum OLFM1 with AD and cognitive function. This study comprised 120 patients with AD and 118 healthy controls (HC). Serum OLFM1 levels, cognitive functions, and brain region volumes were evaluated in all participants. The results demonstrated a significant reduction in serum OLFM1 levels in AD patients (749.8 ± 42.3 pg/mL) compared to HC (804.4 ± 45.7 pg/mL). Among participants carrying the APOE ε4 allele, a significant positive correlation was observed between OLFM1 levels and cognitive assessments, including Mini-Mental State Examination (MMSE), Montreal Cognitive Assessment (MoCA), and Memory and Executive Screening (MES). Furthermore, reduced OLFM1 levels were significantly associated with hippocampus (β = 0.005, 95% CI = 0.001–0.011, p = 0.042) and angular gyrus (β = 0.012, 95% CI = 0.001–0.022, p = 0.025) atrophy. The integration of serum OLFM1 with basic clinical characteristics exhibited robust discriminatory power in differentiating AD patients from HC, evidenced by an area under the curve of 0.881 (95% CI = 0.834–0.926). In summary, serum OLFM1 is a potential peripheral biomarker for AD, that correlates with cognitive function and specific brain volumes. In addition, APOE ε4 may modulate the influence of OLFM1 on cognitive function.
Subject terms: Diagnostic markers, Psychiatric disorders
Introduction
Alzheimer’s disease (AD), predominantly affecting the global aging population, is a neurodegenerative disorder characterized by brain atrophy, progressive memory impairment, cognitive decline, and subsequent personality changes [1]. Current projections indicate that by 2050, the incidence of dementia will double in Europe and triple worldwide [2]. The annual rise in prevalence exerts substantial pressure on global healthcare systems. The hallmarks of AD are the accumulation of extracellular amyloid plaques, composed of aberrant β-amyloid (Aβ) peptides, and intracellular neurofibrillary tangles, characterized by the presence of misfolded tau proteins, within the brain [3]. Initially, AD diagnosis was based on the degree of dementia manifested through cognitive, functional, and behavioral symptoms [2]. However, recent advancements in biomarker technology have enabled researchers to identify the underlying pathophysiological traits of the disease in living subjects, thereby aiding in establishing a more precise diagnostic standard for AD. Cerebrospinal fluid (CSF), being in direct contact with the brain, mirrors the pathological alterations within the brain tissue, making it an ideal diagnostic indicator. However, obtaining CSF is an invasive procedure, significantly reducing its practicality in clinical settings. In recent years, research has identified new blood-based biomarkers for AD, which are considered promising due to their minimally invasive nature and cost-effective collection methods.
Olfactomedin 1 (OLFM1), also referred to as “noelin” or “pancortin”, is a significant secreted glycoprotein of the olfactomedin family that has garnered considerable interest from the scientific community [4]. This protein is highly expressed in the brain, particularly in regions critical to cognitive processes, such as the hippocampus and cortex [5]. Emerging research suggests a potential link between dysregulated OLFM1 expression and a spectrum of neuropsychiatric disorders. These disorders include multiple sclerosis, amyotrophic lateral sclerosis, mania, depressive disorder, Tourette syndrome, obsessive-compulsive disorder, and attention-deficit/hyperactivity disorder [6–8]. In the context of AD, the abnormal aggregation of Aβ is recognized as an early pathological hallmark. The accumulation of Aβ plaques is intricately linked to disrupted neuronal signaling and synaptic dysfunction. Studies have demonstrated that OLFM1 can suppress β-secretase-mediated cleavage of the amyloid precursor protein (APP), consequently reducing Aβ production [9]. Further studies have revealed that OLFM1 is highly enriched at synapses [10, 11], with neighborhood labeling techniques confirming its localization within the synaptic cleft [12]. OLFM1 engages with multiple receptors to preserve the structural and functional integrity of synapses. Its association with the Nogo A receptor complex facilitates axonal growth [13]. Additionally, it binds to glutamate-gated ion channels within the AMPA receptor family to regulate synaptic plasticity through alterations in the lateral mobility of AMPA receptors [11]. Synaptic plasticity is essential for the maintenance of normal learning, memory, and other higher brain functions; its disruption results in impaired neuronal activity, which compromises the overall functionality of the nervous system and can eventually precipitate neurological disorders. As early as the 1980s, synaptic damage was documented in the brain tissue of AD patients [14], with later studies substantiating that synaptic loss contributes to cognitive decline in these individuals [15]. These findings collectively suggest that OLFM1 may play a key role in the complex etiology of AD. However, the specific expression profile of OLFM1 in individuals with AD remains to be fully elucidated.
The aim of this study was to evaluate serum OLFM1 levels in AD patients and to analyze their correlation with cognitive function. We conducted a comprehensive exploration of the relationship between OLFM1 and AD, including its interplay with various clinical phenotypes such as cognitive scores, APOE ε4 genotype, and brain structural volume. Additionally, we assessed the potential of OLFM1 as a peripheral biomarker for the differential diagnosis of AD.
Materials and methods
Study design and participants
The study cohort comprised 120 AD patients recruited from the outpatient and inpatient departments of the First Hospital of Jilin University, alongside 118 healthy controls (HC) from the Medical Examination Center (MEC). The diagnostic criteria for AD is adopted from National Institute on Aging-Alzheimer’s Association (NIA-AA) Research Framework [16]. The inclusion and exclusion criteria for participants are detailed in Fig. S1. This study received approval from the Ethics Committee of the First Hospital of Jilin University in 2020 (registration number AF-IRB-036-01). Before officially and voluntarily joining this study, the patient and their legal guardian are introduced in detail to the purpose, procedures, risks, benefits of the study, as well as the voluntariness of the patient’s participation. Both parties sign a written informed consent form after fully understanding and being fully informed.
Clinical data and cognitive assessments
All participants provided demographic information, detailed medical histories (including hypertension, heart disease, diabetes mellitus, smoking, and drinking status), and underwent laboratory tests (such as homocysteine, creatinine, thyroid function, lipid profile, folic acid, and Vitamin B12 levels).
The cognitive and functional status of all participants was evaluated using the Mini-Mental State Examination (MMSE), Montreal Cognitive Assessment (MoCA), Memory and Executive Screening (MES), Clinical Dementia Rating (CDR), and Activities of Daily Living (ADL) scales. Anxiety and depression status, as well as overall mental status, were evaluated in all participants using the Hamilton Anxiety Scale (HAMA), Hamilton Depression Scale (HAMD), and Neuropsychiatric Inventory (NPI) scales. Blood samples were collected from all participants, and lumbar puncture with CSF markers (Aβ42, Aβ40, Aβ42/40, P-Tau181, and T-tau) were additionally performed in patients with cognitive impairment.
Collection of blood samples and detection of OLFM1
Peripheral blood was collected from the elbow vein of all participants by a specialized nurse after 6–8 h of fasting and was drawn into a sterile clotting container. The blood samples were allowed to clot naturally for 15 min at room temperature, centrifuged at 3000 × g for 20 min at 4 °C, and the supernatant was carefully collected and stored at −80 °C for future analysis. The aforementioned serum preparation process was standardized by the Department of Biobank, Division of Clinical Research, at the First Hospital of Jilin University.
The detection of OLFM1 concentration was performed by two professional testers, blinded to participant grouping, using the highly sensitive MEIMIAN Enzyme-Linked Immunosorbent Assay (ELISA) kit from Jiangsu, China. Five different concentration gradients of the standard (75, 150, 300, 600, and 1200 pg/mL) were established. Blank wells, standard wells, and sample wells were prepared as per protocol. The standard was initially added to the enzyme-labeled plate, followed by the addition of test samples and diluent (1:4) to the sample wells. After incubation at 37 °C for 30 min, the sealing film was carefully removed, and the liquid was discarded for washing. Except for the blank wells, 50 μL of enzyme-labeled reagent was added to each well and incubated for an additional 30 min. After five washes, 50 μL each of color reagent A and color reagent B were sequentially added to each well, gently shaken to mix, and incubated for 10 min at 37 °C in the dark. Then, 50 μL of the stopping solution was added to each well to terminate the reaction, causing an immediate color change from blue to yellow. Finally, with the blank well set to zero, the absorbance (OD, optical density value) of each well was measured at a wavelength of 450 nm using an ELISA reader (Labsystems Multiskan MS, Finland). Each sample was prepared in duplicate, and the final analysis result was taken as the average of the two measurements, expressed in pg/mL. The operational flowchart is detailed in Fig. S2.
The receiver operating characteristic (ROC) curves for OLFM1 in distinguishing AD was generated, identifying the optimal cutoff at 714 pg/mL, corresponding to the highest Youden’s Index value. OLFM1 levels below this threshold were classified as low, whereas those above were deemed high.
Evaluation of brain region volume
All Magnetic Resonance Imaging (MRI) data were obtained using Philips Ingenia 3.0 T MR equipment at the Radiology Department of the First Hospital of Jilin University. Each participant underwent scanning for a 3D-T1 weighted image (3D-T1WI). The structural MRI (sMRI) data were preprocessed using the Computational Anatomy Toolbox 12 (CAT12), following these steps: (1) Correcting T1WI head motion; (2) Spatial segmentation: T1WI images were segmented into gray matter, white matter, cerebrospinal fluid, and total intracranial volume using voxel-based morphometry (VBM); (3) Normalization: T1WI images were adjusted to standard space to account for individual brain variations and improve spatial segmentation; (4) Smoothing: segmented images were smoothed with a 6 mm full-width at half maximum Gaussian kernel. Using the CAT12 toolbox, the volumes of key brain structures were obtained from the Neuromorphometrics brain atlas.
Statistical analysis
Statistical analyses were conducted using R software (version 4.3.3), SPSS (version 26.0), and GraphPad Prism (version 9.0.0). Statistical significance was defined as a two-tailed p-value < 0.05.
Continuous data following a normal distribution are represented by the mean ± standard deviation, while non-normally distributed continuous data are represented by the median and interquartile range (IQR). Categorical variables are expressed as frequencies (%). Differences between the two groups were assessed using the t-test, Mann-Whitney U test, and χ2 test, respectively. Logistic regression models were employed to analyze the correlation of OLFM1 with AD, treating OLFM1 as both a continuous and categorical variable. General linear regression models were applied to analyze the correlation between OLFM1 levels, cognitive scores, and brain region volumes. A sensitivity analysis with an age cut-off of 65 years was performed to test the reliability of the correlation between OLFM1 and cognitive scores. The correlation between serum OLFM1 and CSF biomarkers was explored using Pearson correlation analysis. The diagnostic value of OLFM1, both alone and in combination with other indicators for AD, was assessed using ROC curves.
Results
Characteristics of the study population
Table 1 summarizes the demographic details of the participants. The mean age of the participants was 62.5 years, with a higher proportion of females (63%). Individuals with AD were older and had received less formal education compared to the HC group. Additionally, a higher prevalence of APOE ε4 allele carriers was observed in the AD group (45%) compared to the HC group (20%) (p < 0.001). The differences in past medical history, smoking, and drinking habits between the AD and HC groups were not statistically significant (p > 0.05).
Table 1.
Comparison of basic characteristics between AD and HC groups.
| Variables | Total n = 238 |
HC n = 118 |
AD n = 120 |
p-value |
|---|---|---|---|---|
| Demographic characteristics | ||||
| Agea, years | 62.5 ± 9.4 | 58.8 ± 7.7 | 66.6 ± 8.2 | <0.001*** |
| Sexb | 0.087 | |||
| Male | 88 (37.0) | 50 (42.4) | 38 (31.7) | |
| Female | 150 (63.0) | 68 (57.6) | 82 (68.3) | |
| Education levelb | 0.001** | |||
| Primary and below | 45 (18.9) | 12 (10.2) | 33 (27.5) | |
| Middle school | 124 (52.1) | 62 (52.5) | 62 (51.7) | |
| College and above | 69 (29.0) | 44 (37.3) | 25 (20.8) | |
| Employmentb | 0.646 | |||
| Mental | 94 (39.5) | 50 (42.4) | 44 (36.7) | |
| Physical | 126 (52.9) | 60 (50.8) | 66 (55.0) | |
| None | 18 (7.6) | 8 (6.8) | 10 (8.3) | |
| Smoking historyb | 18 (7.6) | 7 (5.9) | 11 (9.2) | 0.345 |
| Drinking historyb | 18 (7.6) | 5 (4.2) | 13 (10.8) | 0.054 |
| APOE ε4 carriersb | 78 (32.8) | 24 (20.0) | 54 (45.0) | <0.001*** |
| Medical historyb | ||||
| Hypertension | 38 (16.0) | 22 (18.6) | 16 (13.3) | 0.263 |
| Diabetes mellitus | 18 (7.6) | 9 (7.6) | 9 (7.5) | 0.970 |
| Heart disease | 16 (6.7) | 11 (9.3) | 5 (4.2) | 0.112 |
| Stroke history | 18 (7.6) | 8 (6.8) | 10 (8.3) | 0.650 |
| Family history of dementia | 28 (11.8) | 10 (8.5) | 18 (15) | 0.118 |
| Surgery history | 31 (81.6) | 10 (8.5) | 21 (17.5) | 0.051 |
| Laboratory indicesc | ||||
| Homocysteine (µmol/L) | 11.54 (9.63, 14.35) | 11.05 (9.59, 13.03) | 11.86 (9.44, 15.05) | 0.341 |
| Creatinine (µmol/L) | 61.35 (54.70, 72.85) | 62.05 (56.18, 72.68) | 60.70 (53.26, 73.13) | 0.520 |
| Cholesterol (mmol/L) | 4.71 (4.07, 5.34) | 4.63 (4.06, 5.27) | 4.82 (4.06, 5.45) | 0.497 |
| Triglyceride (mmol/L) | 1.33 (0.97, 1.76) | 1.47 (1.05, 1.93) | 1.26 (0.90, 1.62) | 0.015* |
| HDL-C (mmol/L) | 1.17 (1.04, 1.32) | 1.13 (0.99, 1.28) | 1.22 (1.06, 1.36) | 0.006** |
| LDL-C (mmol/L) | 2.97 (2.50, 3.41) | 2.95 (2.49, 3.46) | 2.98 (2.51, 3.36) | 0.929 |
| TSH (µIU/ml) | 1.70 (1.10, 2.50) | 1.72 (1.24, 2.40) | 1.56 (1.05, 2.53) | 0.543 |
| FT3 (pmol/L) | 4.13 (3.80, 4.39) | 4.15 (3.91, 4.38) | 4.10 (3.71, 4.41) | 0.158 |
| FT4 (pmol/L) | 12.53 (11.65, 13.57) | 12.73 (11.91, 13.63) | 12.38 (11.47, 13.54) | 0.197 |
| Folic acid (ng/mL) | 8.50 (6.50, 11.43) | 8.60 (7.20, 11.54) | 7.80 (5.65, 11.38) | 0.028* |
| Vitamin B12 (pmol/L) | 328.40 (231.83, 435.00) | 348.50 (261.38, 435.25) | 297.50 (203.50, 434.25) | 0.029* |
AD Alzheimer’s disease, HC health controls, APOE apolipoprotein E, HDL-C high density lipoprotein cholesterol, LDL-C low density lipoprotein cholesterol, TSH thyroid stimulating hormone, FT3 free triiodothyronine, FT4 free thyroxine.
*p < 0.05, **p < 0.01, ***p < 0.001.
aRepresented by the mean ± standard deviation.
bExpressed as frequencies (%).
cRepresented by the median and interquartile range (IQR).
Additional laboratory indices were also collected and analyzed (Table 1). Our analysis revealed that triglyceride, folic acid, and Vitamin B12 levels were significantly reduced in the AD group compared to the HC group (p < 0.05). Conversely, the AD group exhibited higher HDL-C levels compared to the HC group (p = 0.006).
Comparison of serum OLFM1 levels in AD and HC groups
Serum OLFM1 levels were significantly reduced in individuals with AD (749.8 ± 42.3 pg/mL) compared to the HC group (804.4 ± 45.7 pg/mL) (p < 0.001) (Fig. 1).
Fig. 1. Comparison of OLFM1 in the AD and HC groups among total participants.
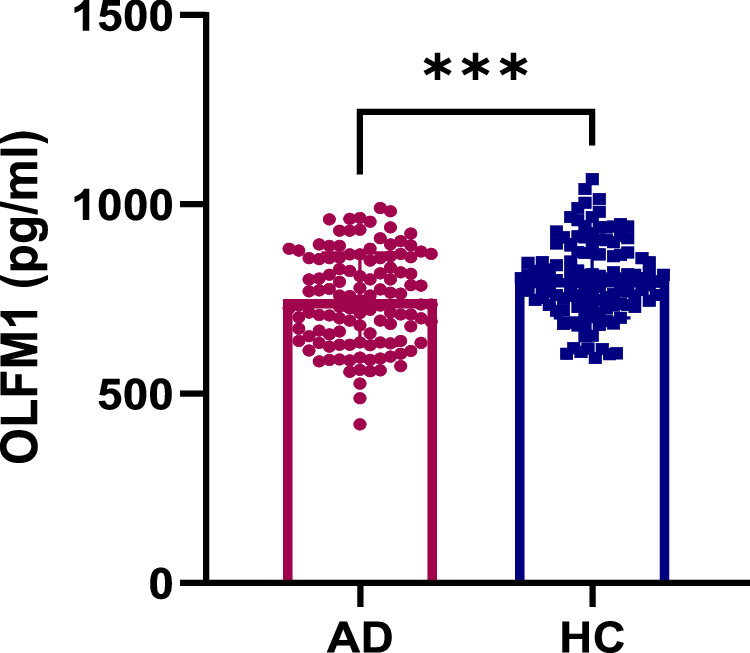
AD alzheimer’s disease, HC health controls, OLFM1 olfactomedin 1. ***p < 0.001.
Correlation between serum OLFM1 levels and AD
The association between OLFM1 levels and AD was evaluated using logistic regression, as detailed in Table 2. When OLFM1 was treated as a continuous variable, higher OLFM1 levels were associated with a reduced probability of AD after adjusting for age, sex, education level, APOE ε4, triglyceride, HDL-C, folic acid, and Vitamin B12 in the total study population (OR = 0.995, 95% CI = 0.992–0.999, p = 0.005). When OLFM1 was categorized, individuals with low OLFM1 levels had a 3.385 times likelihood of AD compared to those with high OLFM1 levels (OR = 3.385, 95% CI = 1.509–7.593, p = 0.003) after adjusting for age, sex, education level, APOE ε4, triglyceride, HDL-C, folic acid, and Vitamin B12.
Table 2.
Multivariate logistic regression models examining the relation between serum OLFM1 and AD.
| Variables | Model 1 | Model 2 | ||
|---|---|---|---|---|
| OR (95% CI) | p-value | OR (95% CI) | p-value | |
| aOLFM1(pg/mL) | 0.996 (0.993–0.999) | 0.008** | 0.995 (0.992–0.999) | 0.005** |
| bHigh | Reference | Reference | ||
| bLow | 3.201 (1.471–6.968) | 0.003** | 3.385 (1.509–7.593) | 0.003** |
Logistic regression analysis of OLFM1 as a linear (a) and categorical (b) variable with the risk of AD, respectively. Model 1: Adjust for age, sex, and education level. Model 2: Adjust for age, sex, education levels, APOE ε4, triglyceride, HDL-C, folic acid, and Vitamin B12 level. Low OLFM1 was defined as serum OLFM1 levels below 714 pg/mL.
AD Alzheimer’s disease, OLFM1 olfactomedin 1, APOE apolipoprotein E, HDL-C high density lipoprotein cholesterol, OR odds ratio, CI confidence interval.
**p < 0.01.
We have summarized the basic information of CSF biomarkers (Aβ42, Aβ40, Aβ42/40, P-Tau181, and T-tau) in AD patients (Table S1). Additionally, we used Pearson correlation analysis and found no significant correlation between serum OLFM1 and the aforementioned CSF biomarkers (Table S2).
Effect of APOE ε4 status on the relationship between serum OLFM1 levels and cognitive function
General linear regression models were employed to analyze the correlation between serum OLFM1 levels and cognitive scores among all participants. We found that higher serum OLFM1 levels were linked with better scores on the MMSE (β = 0.012, 95% CI = 0.004–0.020, p = 0.004), MoCA (β = 0.010, 95% CI = 0.002–0.018, p = 0.013), and MES-M (β = 0.017, 95% CI = 0.001–0.033, p = 0.042) after adjusting for age, sex, education level, triglyceride, HDL-C, folic acid, and Vitamin B12 in the whole population (Table 3). We further discovered through subgroup analysis that higher serum OLFM1 levels in APOE ε4 carriers were associated with better MMSE (p = 0.005, Fig. 2A), MoCA (p = 0.026, Fig. 2B), MES-M (p = 0.023, Fig. 2C), and MES-E (p = 0.057, Fig. 2D) scores. Further analysis revealed that OLFM1 levels were positively correlated with MMSE (β = 0.019, 95% CI = 0.007–0.030, p = 0.002), MoCA (β = 0.014, 95% CI = 0.002–0.025, p = 0.018), and MES-M (β = 0.028, 95% CI = 0.005–0.050, p = 0.018) in APOE ε4 carriers after adjusting for age, sex, education level, triglyceride, HDL-C, folic acid, and Vitamin B12 (Table 3). However, in APOE ε4 non-carriers, no association was observed between OLFM1 and the cognitive assessments of MMSE, MoCA, MES-M, or MES-E.
Table 3.
The relation between serum OLFM1 and cognitive function, across the whole sample and stratified by APOE ε4 status.
| Cognitive assessments | Whole sample | APOE ε4− | APOE ε4+ | ||||
|---|---|---|---|---|---|---|---|
| β (95% CI) | p-value | β (95% CI) | p-value | β (95% CI) | p-value | ||
| MMSE | |||||||
| Model 1 | 0.009 (0.000–0.018) | 0.047* | 0.002 (−0.011–0.014) | 0.790 | 0.019 (0.006–0.032) | 0.005** | |
| Model 2 | 0.011 (0.003–0.019) | 0.008** | 0.006 (−0.005–0.017) | 0.266 | 0.018 (0.006–0.031) | 0.004** | |
| Model 3 | 0.012 (0.004–0.020) | 0.004** | 0.006 (−0.005–0.017) | 0.262 | 0.019 (0.007–0.030) | 0.002** | |
| MoCA | |||||||
| Model 1 | 0.008 (−0.001–0.017) | 0.100 | 0.002 (−0.010–0.015) | 0.716 | 0.014 (0.002–0.027) | 0.026* | |
| Model 2 | 0.009 (0.001–0.017) | 0.023* | 0.007 (−0.004–0.018) | 0.195 | 0.013 (0.002–0.025) | 0.026* | |
| Model 3 | 0.010 (0.002–0.018) | 0.013* | 0.008 (−0.003–0.019) | 0.160 | 0.014 (0.002–0.025) | 0.018* | |
| MES-M | |||||||
| Model 1 | 0.014 (−0.003–0.031) | 0.116 | −0.015 (−0.039–0.010) | 0.249 | 0.029 (0.004–0.054) | 0.023* | |
| Model 2 | 0.016 (0.000–0.032) | 0.056 | −0.006 (−0.028–0.016) | 0.578 | 0.027 (0.004–0.050) | 0.024* | |
| Model 3 | 0.017 (0.001–0.033) | 0.042* | −0.008 (−0.030–0.014) | 0.466 | 0.028 (0.005–0.050) | 0.018* | |
| MES-E | |||||||
| Model 1 | 0.005 (−0.013, 0.022) | 0.610 | 0.006 (−0.018–0.030) | 0.613 | 0.024 (−0.001–0.049) | 0.057 | |
| Model 2 | 0.008 (−0.008–0.023) | 0.348 | 0.012 (−0.011–0.034) | 0.297 | 0.022 (−0.002–0.046) | 0.067 | |
| Model 3 | 0.008 (−0.008–0.024) | 0.309 | 0.012 (−0.011–0.034) | 0.299 | 0.023 (−0.001–0.046) | 0.061 | |
Linear regression analysis of serum OLFM1 and cognitive function assessment. Model 1: Not adjust. Model 2: Adjust for age, sex, and education level. Model 3: Adjust for age, sex, education level, triglyceride, HDL-C, folic acid, and Vitamin B12 level.
OLFM1 olfactomedin 1, APOE, apolipoprotein E, HDL-C high density lipoprotein cholesterol, MMSE mini-mental state examination, MoCA montreal cognitive assessment, MES-E memory and executive screening-execution, MES-M memory and executive screening-memory, CI confidence interval.
*p < 0.05, **p < 0.01.
Fig. 2. Correlation of serum OLFM1 with cognitive unctions.

A, B, memory C and executive D functions in participants of APOE ε4+ and APOE ε4-. OLFM1 olfactomedin 1, MMSE mini-mental state examination, MoCA montreal cognitive assessment, MES-M memory and executive screening-memory, MES-E memory and executive screening-execution.
Sensitivity analyses were conducted to determine whether OLFM1 levels were correlated with cognitive function in participants of younger and older age groups (Table S3). In participants aged <65 years, OLFM1 was significantly associated with MMSE (β = 0.026, 95% CI = 0.008–0.045, p = 0.006), MoCA (β = 0.023, 95% CI = 0.005–0.040, p = 0.014), and MES-E (β = 0.041, 95% CI = 0.004–0.079, p = 0.031) in APOE ε4 carriers after adjusting for age, sex, education level, triglyceride, HDL-C, folic acid, and Vitamin B12. In participants aged ≥ 65 years, OLFM1 was significantly associated with MMSE (β = 0.020, 95% CI = 0.007–0.032, p = 0.002), MoCA (β = 0.015, 95% CI = 0.003–0.027, p = 0.018), and MES-M (β = 0.029, 95% CI = 0.005–0.053, p = 0.018) in APOE ε4 carriers after adjusting for relevant covariates. However, OLFM1 was not correlated with MMSE, MoCA, MES-M, or MES-E in APOE ε4 non-carriers. In summary, the correlation between serum OLFM1 levels and cognitive function remains largely consistent with the initial research findings.
Correlation between serum OLFM1 levels and brain region volume
Brain region volumes in AD patients were compared to those in the HC group. Several cognitively relevant brain regions were significantly smaller in AD patients compared to the HC group (Table S4). General linear regression models were employed to analyze the correlation between serum OLFM1 levels and various brain regions, adjusting for age, sex, and total intracranial volume (Fig. 3). Interestingly, low serum OLFM1 levels were significantly associated with atrophy in the hippocampus (β = 0.005, 95% CI = 0.001–0.011, p = 0.042) and angular gyrus (β = 0.012, 95% CI = 0.001–0.022, p = 0.025). This finding suggests that serum OLFM1 may play a role in the pathogenesis of AD as well as in cognitive impairment.
Fig. 3. β coefficients (95% CI) of serum OLFM1 levels associated with brain volume among all participants (age, sex and total intracranial volume covariates are controlled in statistics model).

CI confidence intervals, OLFM1 olfactomedin 1. *p < 0.05.
Diagnostic value of serum OLFM1 for AD
The discriminant value of OLFM1 alone and in combination with other clinical indicators for AD was analyzed using ROC curves (Fig. 4). A ROC curve for OLFM1 alone in predicting AD showed an area under the curve (AUC) of 0.754 (95% CI = 0.690–0.819). The AUC for serum OLFM1 combined with age, sex, education level, and APOE ε4 was 0.881 (95% CI = 0.834–0.926). These results suggest that OLFM1, in combination with other clinical indicators, holds a valuable diagnostic potential for AD.
Fig. 4. Receiver operating characteristic curves for AD.
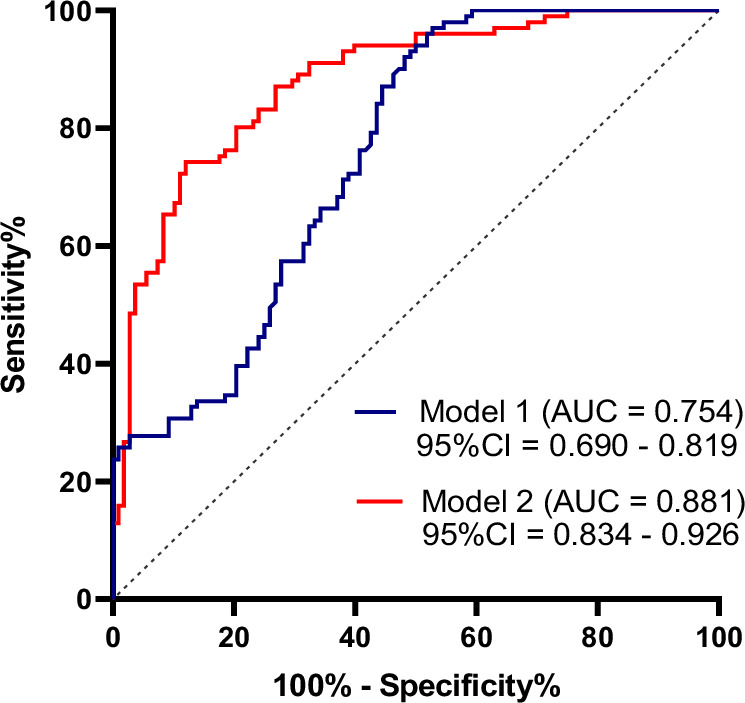
Model 1: Diagnostic value of serum OLFM1 in distinguishing AD patients from HC. Model 2: Diagnostic value of serum OLFM1 combined with age, sex, education level and APOE ε4 in distinguishing AD patients from HC. AD Alzheimer’s disease, HC health controls, OLFM1 olfactomedin 1, AUC area under the curve; CI confidence interval.
Discussion
This study is the first to confirm that serum OLFM1 levels are lower in AD patients than in HC, with further analysis revealing that higher OLFM1 levels serve as a protective factor against AD. Analyses based on APOE ε4 status showed that higher serum OLFM1 levels were associated with better cognitive scores in APOE ε4 carriers, with consistent results observed after age stratification. Furthermore, serum OLFM1 levels were associated with the volume of certain cognition-related brain regions. Serum OLFM1, combined with age, sex, education level, and APOE ε4 genotype, demonstrated excellent discriminatory value between AD and HC.
In 1991, researchers discovered a 57-kDa glycoprotein in the olfactory neuroepithelium of frogs, which they named “olfactomedin” [17]. There are eight major families of olfactomedin-containing structural domains, among which OLFM1 is a notable subfamily. Studies have shown that OLFM1 has been linked to cognitive function, with a significant correlation between the presence of anti-OLFM1 immunoglobulin G (IgG) autoantibodies and enhanced cognitive performance. This association was empirically validated in individuals who scored above the median on the Digit-Symbol Coding Test (DSCT), a standardized measure of cognitive processing speed and executive function [18]. Our study shows that serum OLFM1 levels are significantly reduced in AD patients, and lower OLFM1 levels are associated with poorer cognitive performance in whole participants. Previous studies have confirmed that OLFM1 interacts with multiple receptors to maintain synaptic structural and functional integrity. Specifically, OLFM1 interacts with the Nogo A receptor complex to promote axon growth [13]. Additionally, OLFM1 binds to glutamate-gated ion channels of the AMPA receptor family, regulating long-term potentiation, and modulates the surface mobility of AMPA receptors to influence synaptic plasticity [11]. Furthermore, OLFM1 interacts with Wingless-integrated (Wnt) pathway inhibitory factor-1 (WIF-1), playing a role in the regulation of the Wnt/β-catenin signaling pathway [19]. The Wnt signaling pathway, a conserved mechanism, is crucial for multiple physiological processes in neural development, including neuronal differentiation, proliferation, axonal and dendritic guidance, branching, synapse formation, and structural remodeling [20]. The Wnt/β-catenin pathway, the most classical Wnt pathway, plays a significant role in the development of numerous neurological disorders, most notably AD [21]. These findings highlight the critical role of OLFM1 in regulating synaptic plasticity, suggesting that its dysregulation may affect neuronal development, synaptic structure and functional plasticity, thereby leading to cognitive impairment.
In addition, our investigation revealed OLFM1 levels positively correlating with the volume of the hippocampus and angular gyrus-regions critical for cognition. The observation of more pronounced cerebral atrophy with diminished OLFM1 levels underscores its critical role in neuronal preservation and synaptic integrity, which are fundamental to cognitive decline in AD [22]. In recent years, the biological functions of OLFM1 have been increasingly recognized. An in vivo study revealed that a deletion at the N-terminus of OLFM1, which disrupts its interaction with synaptic proteins, resulted in cerebral dystrophy and aberrant behaviors in mice [23]. OLFM1 also plays a pivotal role in ischemic neuronal demise, where it associates with WAVE1 and Bcl-xl to form a complex that amplifies the anti-apoptotic signaling mediated by WAVE1 and Bcl-xl [24]. These findings reinforce the notion that OLFM1 is integral to the etiology of neurological diseases. Comprehensive genomic sequencing has revealed that mutations in the OLFM1 enhancer can precipitate intellectual disabilities [25]. Beyond its synaptic influence, OLFM1 interacts with the endogenous APP, mitigating β-secretase-mediated cleavage of APP and thereby curtailing the production of Aβ, a cardinal pathogenic entity in AD [9]. The reduction in OLFM1 may diminish its inhibitory effect on Aβ production, leading to increased accumulation of Aβ plaques, which can cause significant damage to brain tissue. This includes inducing neuronal damage and death, activating microglia and astrocytes, triggering inflammatory responses in the brain, raising oxidative stress levels, and causing damage to cell membranes, proteins, and DNA. Aβ deposition also increases the risk of blood-brain barrier (BBB) damage and the entry of harmful substances into the brain. All these pathological responses can exacerbate neuronal death, leading to reduced brain volume and brain atrophy. Collectively, these studies suggest that dysregulation of OLFM1 expression may be involved in the pathophysiology of AD, rendering it a potential peripheral biomarker for AD. Unraveling the intricate pathogenic mechanisms of OLFM1 in AD may open new avenues for effective preventative and therapeutic strategies against this debilitating condition.
The ε4 allele of APOE is a non-negligible genetic risk factor for late-onset AD. APOE ε4 not only increases the risk of AD, but also reduces the age of onset of AD in a dose-dependent manner [26]. An in vivo experimental study has shed light on the role of a mouse model bearing the human APOE ε4 gene; this model has been shown to hasten the aggregation of Aβ peptides, impede their clearance, and disrupt both synaptic plasticity and the integrity of the BBB [27, 28]. Beyond its implications for AD, the APOE ε4 genotype has been linked to the risk of age-related cognitive decline in cognitively intact individuals [29]. In our study, we found that a higher proportion of AD patients carried ε4 than HC, which is consistent with the conclusions reached in a previous study [30]. And among ε4 carriers, OLFM1 levels were strongly associated with overall cognitive function, memory, and executive ability. Age-stratified analyses yielded consistent findings among younger and older participants carrying ε4 that both overall cognitive functioning and memory capacity were significantly associated with OLFM1 levels. This suggests that APOE ε4 may mediate the correlation between OLFM1 and cognitive function and is not confounded by age. The use of serum OLFM1 in conjunction with age, sex, education levels, and APOE ε4 genotype in clinical work has good discriminatory value for AD and HC. It has been found that in human APOE ε4 carriers, even in the absence of disease pathology, show a reduction in dendritic spine density [31]. This is due to the fact that APOE ε4 alters the structural reorganization of neurons [32], reduces the expression of key synaptic proteins [33], and inhibits glutamatergic signaling, which is essential for neuroplasticity and network maintenance [34]. The precise role of APOE ε4 in mediating the influence of OLFM1 on AD and cognitive function warrants further investigation to clarify its underlying mechanisms and potential as a therapeutic target.
In our study, the proportion of females among AD patients is higher than that of males, which is consistent with previous studies [35, 36]. The possible reasons why females are more susceptible to AD are as follows. Firstly, the average life expectancy of females is longer than that of males. As age increases, the accumulation of abnormal substances in the brain, such as Aβ and tau proteins, leads to neuronal dysfunction and death, making females more likely to develop AD in old age [36]. Secondly, certain genetic variations are associated with the occurrence of AD. In particular, individuals carrying the APOE ε4 allele have a higher risk of developing AD. The proportion of females carrying the APOE ε4 allele is higher than that of males, which may be one of the genetic reasons why females are more susceptible to AD [37]. Additionally, females uniquely experience menopause, and after menopause, the decline of estrogen levels in females may increase the risk of developing AD [38]. Beyond these factors, the higher number of females with AD may also be related to the different social roles and lifestyle habits of females, as well as their willingness to seek medical help and undergo cognitive function assessments, leading to an overestimation of the number of female AD patients in statistical data. Another interesting phenomenon is that we found among AD patients, the proportion engaged in physical labor is higher than that in mental work. Previous studies have shown that compared with non-physical labor, physical labor is associated with a greater risk of developing AD [39]. Firstly, people engaged in mental work may have better education and intelligence quotient (IQ). A high-quality educational background and IQ may reduce the risk of developing AD by accumulating cognitive reserves [40, 41]. Secondly, mental workers may have long-term engagement in work that requires a high cognitive load. This continuous intellectual challenge may promote neuronal signaling, neurogenesis, and synaptic plasticity, which are beneficial to the maintenance and enhancement of cognitive function. In addition, people engaged in mental work may pay more attention to health maintenance issues and have more resources to obtain high-quality medical care services. This may include a healthier lifestyle, fewer chronic diseases, and less exposure to harmful environmental factors, all of which help to reduce the decline of cognitive function and the incidence of AD. Future research is necessary to further confirm the relationship between occupational type and AD risk within larger populations, as well as the specific impacts on the mechanisms of AD development.
Lipid metabolism imbalances and B vitamins deficiencies are inextricably linked to dementia and cognitive decline. Our study found that triglycerides levels were decreased in AD patients, while HDL-C levels were elevated. A study has noted that hypertriglyceridemia is a risk factor for non-AD dementia [42]. Another studies have reported HDL-C levels with reduced brain amyloid deposition, a lower risk of AD, enhanced cognitive function, and higher MMSE scores [43–45]. Nonetheless, recent findings emphasize that it is HDL functionality, rather than its total levels, that is critical in determining its effectiveness [46]. The dysregulation of lipid metabolism in our patients may be attributed to nutritional deficiencies in AD patients, dietary habits common in northeastern China, and the limitations of our sample size. In this study, peripheral folic acid and vitamin B12 levels were reduced in AD patients, consistent with previous finding [47]. Folic acid and vitamin B12 are B vitamins that play a role in single-carbon transfer reactions, including methylation, which is essential for producing monoamine neurotransmitters, phospholipids, and nucleotides in the brain [48]. Deficiency in these B vitamins is linked to increased levels of homocysteine [49], which has direct neurotoxic effects [50]. Moreover, vitamin B12 has antioxidant properties, primarily reflected in its ability to directly eliminate ROS such as superoxide anions in the cytoplasm and mitochondria, and indirectly promote ROS clearance by maintaining glutathione levels [51–53]. Additionally, vitamin B12 may prevent inflammation-induced oxidative stress by regulating the production of cytokines and growth factors, including interleukin-6 (IL-6), tumor necrosis factor-alpha (TNF-α), and epidermal growth factor. IL-6 has been shown to induce tau protein hyperphosphorylation, while TNF-α increases the Aβ burden by upregulating β-secretase production and enhancing γ-secretase activity [54]. In summary, maintaining appropriate folic acid and vitamin B12 levels is crucial for preventing or slowing the pathological progression of AD.
Several limitations of our study must be acknowledged. Firstly, serum OLFM1 levels may not fully represent OLFM1 levels in the CSF due to the BBB. Secondly, our study was cross-sectional, preventing us from monitoring the dynamic trend of OLFM1 levels in relation to cognitive function, and thus we cannot conclude whether reduced OLFM1 levels are a cause or consequence of AD. Thirdly, due to sample size limitations, we conservatively interpreted all conclusions drawn. In the future, we will expand the sample size and dynamically monitor the trend of serum and CSF OLFM1 levels in relation to cognitive function. Additionally, we are now prepared to conduct basic experiments to further confirm our findings and explore the mechanisms of OLFM1’s effects on AD.
Conclusion
In conclusion, our study is the first to report that serum OLFM1 expression is significantly downregulated in AD patients. Additionally, low levels of OLFM1 are associated with cognitive decline and volume atrophy in cognition-related brain regions. APOE ε4 may mediate the relationship between OLFM1 levels and cognitive function. Serum OLFM1, in combination with other basic clinical indicators, demonstrated promising discriminatory efficacy for distinguishing between AD and HC.
Supplementary information
Acknowledgements
We thank the Department of Biobank, Division of Clinical Research for the providing of human tissues.
Author contributions
LS, CW, and GZ designed the general project. XF and MZ did the data acquisition and sample collection. WJ and YS did the data analysis and interpretation. CW and GZ wrote the first draft of the manuscript. All authors contributed to the manuscript revising and given final approval of the version.
Funding
This study was supported by the General Program of the National Natural Science Foundation of China (No. 82071442), the Jilin Provincial Department of Finance (JLSWSRCZX2021-004), the Major Chronic Disease Program of the Ministry of Science and Technology of China (No. 2018YFC1312301), STI2030-Major Projects (No. 2021ZD0201802), Doctor of excellence program (DEP), The First Hospital of Jilin University (JDYY-DEP-2022015) and Youth Development Fund, The First Hospital of Jilin University (JDYY14202338).
Data availability
The original data presented in the study are included in the article/Supplementary Material, further inquiries can be directed to the corresponding author.
Competing interests
The authors declare no competing interests.
Ethics approval
All methods were performed in accordance with the relevant guidelines and regulations.
Footnotes
Publisher’s note Springer Nature remains neutral with regard to jurisdictional claims in published maps and institutional affiliations.
These authors contributed equally: Chunxiao Wei, Guimei Zhang.
Change history
4/28/2025
Supplementary [Correlation of peripheral olfactomedin 1 with Alzheimer's disease and cognitive functions] was missing from this article and has now been uploaded.
Supplementary information
The online version contains supplementary material available at 10.1038/s41398-025-03373-9.
References
- 1.2023 Alzheimer’s disease facts and figures. Alzheimers Dement. 2023;19:1598–695. 10.1002/alz.13016. [DOI] [PubMed]
- 2.Scheltens P, De Strooper B, Kivipelto M, Holstege H, Chetelat G, Teunissen CE, et al. Alzheimer’s disease. Lancet. 2021;397:1577–90. 10.1016/S0140-6736(20)32205-4 [DOI] [PMC free article] [PubMed] [Google Scholar]
- 3.Long JM, Holtzman DM. Alzheimer disease: an update on pathobiology and treatment strategies. Cell. 2019;179:312–39. 10.1016/j.cell.2019.09.001 [DOI] [PMC free article] [PubMed] [Google Scholar]
- 4.Barembaum M, Moreno TA, LaBonne C, Sechrist J, Bronner-Fraser M. Noelin-1 is a secreted glycoprotein involved in generation of the neural crest. Nat Cell Biol. 2000;2:219–25. 10.1038/35008643 [DOI] [PubMed] [Google Scholar]
- 5.Nagano T, Nakamura A, Mori Y, Maeda M, Takami T, Shiosaka S, et al. Differentially expressed olfactomedin-related glycoproteins (Pancortins) in the brain. Brain Res Mol Brain Res. 1998;53:13–23. 10.1016/s0169-328x(97)00271-4 [DOI] [PubMed] [Google Scholar]
- 6.Bertelsen B, Melchior L, Jensen LR, Groth C, Nazaryan L, Debes NM, et al. A t(3;9)(q25.1;q34.3) translocation leading to OLFM1 fusion transcripts in Gilles de la Tourette syndrome, OCD and ADHD. Psychiatry Res. 2015;225:268–75. 10.1016/j.psychres.2014.12.028 [DOI] [PubMed] [Google Scholar]
- 7.Kroksveen AC, Guldbrandsen A, Vaudel M, Lereim RR, Barsnes H, Myhr KM, et al. In-depth cerebrospinal fluid quantitative proteome and deglycoproteome analysis: presenting a comprehensive picture of pathways and processes affected by multiple sclerosis. J Proteome Res. 2017;16:179–94. 10.1021/acs.jproteome.6b00659 [DOI] [PubMed] [Google Scholar]
- 8.Le-Niculescu H, Roseberry K, Gill SS, Levey DF, Phalen PL, Mullen J, et al. Precision medicine for mood disorders: objective assessment, risk prediction, pharmacogenomics, and repurposed drugs. Mol Psychiatry. 2021;26:2776–804. 10.1038/s41380-021-01061-w [DOI] [PMC free article] [PubMed] [Google Scholar]
- 9.Rice HC, Townsend M, Bai J, Suth S, Cavanaugh W, Selkoe DJ, et al. Pancortins interact with amyloid precursor protein and modulate cortical cell migration. Development. 2012;139:3986–96. 10.1242/dev.082909 [DOI] [PMC free article] [PubMed] [Google Scholar]
- 10.Nakaya N, Sultana A, Tomarev SI. Impaired AMPA receptor trafficking by a double knockout of zebrafish olfactomedin1a/b. J Neurochem. 2017;143:635–44. 10.1111/jnc.14231 [DOI] [PMC free article] [PubMed] [Google Scholar]
- 11.Pandya NJ, Seeger C, Babai N, Gonzalez-Lozano MA, Mack V, Lodder JC, et al. Noelin1 affects lateral mobility of synaptic AMPA receptors. Cell Rep. 2018;24:1218–30. 10.1016/j.celrep.2018.06.102 [DOI] [PMC free article] [PubMed] [Google Scholar]
- 12.Loh KH, Stawski PS, Draycott AS, Udeshi ND, Lehrman EK, Wilton DK, et al. Proteomic analysis of unbounded cellular compartments: synaptic Clefts. Cell. 2016;166:1295–307.e21. 10.1016/j.cell.2016.07.041 [DOI] [PMC free article] [PubMed] [Google Scholar]
- 13.Nakaya N, Sultana A, Lee HS, Tomarev SI. Olfactomedin 1 interacts with the Nogo A receptor complex to regulate axon growth. J Biol Chem. 2012;287:37171–84. 10.1074/jbc.M112.389916 [DOI] [PMC free article] [PubMed] [Google Scholar]
- 14.Hamos JE, DeGennaro LJ, Drachman DA. Synaptic loss in Alzheimer’s disease and other dementias. Neurology. 1989;39:355–61. 10.1212/wnl.39.3.355 [DOI] [PubMed] [Google Scholar]
- 15.Griffiths J, Grant SGN. Synapse pathology in Alzheimer’s disease. Semin Cell Dev Biol. 2023;139:13–23. 10.1016/j.semcdb.2022.05.028 [DOI] [PubMed] [Google Scholar]
- 16.Jack CR Jr., Bennett DA, Blennow K, Carrillo MC, Dunn B, Haeberlein SB, et al. NIA-AA research framework: toward a biological definition of Alzheimer’s disease. Alzheimers Dement. 2018;14:535–62. 10.1016/j.jalz.2018.02.018 [DOI] [PMC free article] [PubMed] [Google Scholar]
- 17.Snyder DA, Rivers AM, Yokoe H, Menco BP, Anholt RR. Olfactomedin: purification, characterization, and localization of a novel olfactory glycoprotein. Biochemistry. 1991;30:9143–53. 10.1021/bi00102a004 [DOI] [PubMed] [Google Scholar]
- 18.Jernbom Falk A, Galletly C, Just D, Toben C, Baune BT, Clark SR, et al. Autoantibody profiles associated with clinical features in psychotic disorders. Transl Psychiatry. 2021;11:474 10.1038/s41398-021-01596-0 [DOI] [PMC free article] [PubMed] [Google Scholar]
- 19.Nakaya N, Lee HS, Takada Y, Tzchori I, Tomarev SI. Zebrafish olfactomedin 1 regulates retinal axon elongation in vivo and is a modulator of Wnt signaling pathway. J Neurosci. 2008;28:7900–10. 10.1523/JNEUROSCI.0617-08.2008 [DOI] [PMC free article] [PubMed] [Google Scholar]
- 20.He CW, Liao CP, Pan CL. Wnt signalling in the development of axon, dendrites and synapses. Open Biol. 2018;8:180116. 10.1098/rsob.180116 [DOI] [PMC free article] [PubMed] [Google Scholar]
- 21.Boonen RA, van Tijn P, Zivkovic D. Wnt signaling in Alzheimer’s disease: up or down, that is the question. Ageing Res Rev. 2009;8:71–82. 10.1016/j.arr.2008.11.003 [DOI] [PubMed] [Google Scholar]
- 22.Raulin AC, Doss SV, Trottier ZA, Ikezu TC, Bu G, Liu CC. ApoE in Alzheimer’s disease: pathophysiology and therapeutic strategies. Mol Neurodegener. 2022;17:72. 10.1186/s13024-022-00574-4 [DOI] [PMC free article] [PubMed] [Google Scholar]
- 23.Nakaya N, Sultana A, Munasinghe J, Cheng A, Mattson MP, Tomarev SI. Deletion in the N-terminal half of olfactomedin 1 modifies its interaction with synaptic proteins and causes brain dystrophy and abnormal behavior in mice. Exp Neurol. 2013;250:205–18. 10.1016/j.expneurol.2013.09.019 [DOI] [PMC free article] [PubMed] [Google Scholar]
- 24.Cheng A, Arumugam TV, Liu D, Khatri RG, Mustafa K, Kwak S, et al. Pancortin-2 interacts with WAVE1 and Bcl-xL in a mitochondria-associated protein complex that mediates ischemic neuronal death. J Neurosci. 2007;27:1519–28. 10.1523/JNEUROSCI.5154-06.2007 [DOI] [PMC free article] [PubMed] [Google Scholar]
- 25.De Vas MG, Boulet F, Joshi SS, Garstang MG, Khan TN, Atla G, et al. Regulatory de novo mutations underlying intellectual disability. Life Sci Alliance. 2023;6:e202201843. 10.26508/lsa.202201843 [DOI] [PMC free article] [PubMed] [Google Scholar]
- 26.Corder EH, Saunders AM, Strittmatter WJ, Schmechel DE, Gaskell PC, Small GW, et al. Gene dose of apolipoprotein E type 4 allele and the risk of Alzheimer’s disease in late onset families. Science. 1993;261:921–3. 10.1126/science.8346443 [DOI] [PubMed] [Google Scholar]
- 27.Huynh TV, Davis AA, Ulrich JD, Holtzman DM. Apolipoprotein E and Alzheimer’s disease: the influence of apolipoprotein E on amyloid-beta and other amyloidogenic proteins. J Lipid Res. 2017;58:824–36. 10.1194/jlr.R075481 [DOI] [PMC free article] [PubMed] [Google Scholar]
- 28.Yu JT, Tan L, Hardy J. Apolipoprotein E in Alzheimer’s disease: an update. Annu Rev Neurosci. 2014;37:79–100. 10.1146/annurev-neuro-071013-014300 [DOI] [PubMed] [Google Scholar]
- 29.Martens YA, Zhao N, Liu CC, Kanekiyo T, Yang AJ, Goate AM, et al. ApoE Cascade Hypothesis in the pathogenesis of Alzheimer’s disease and related dementias. Neuron. 2022;110:1304–17. 10.1016/j.neuron.2022.03.004 [DOI] [PMC free article] [PubMed] [Google Scholar]
- 30.Shen XN, Huang SY, Cui M, Zhao QH, Guo Y, Huang YY, et al. Plasma glial fibrillary acidic protein in the Alzheimer disease continuum: relationship to other biomarkers, differential diagnosis, and prediction of clinical progression. Clin Chem. 2023;69:411–21. 10.1093/clinchem/hvad018 [DOI] [PubMed] [Google Scholar]
- 31.Ji Y, Gong Y, Gan W, Beach T, Holtzman DM, Wisniewski T. Apolipoprotein E isoform-specific regulation of dendritic spine morphology in apolipoprotein E transgenic mice and Alzheimer’s disease patients. Neuroscience. 2003;122:305–15. 10.1016/j.neuroscience.2003.08.007 [DOI] [PubMed] [Google Scholar]
- 32.Arendt T, Schindler C, Bruckner MK, Eschrich K, Bigl V, Zedlick D, et al. Plastic neuronal remodeling is impaired in patients with Alzheimer’s disease carrying apolipoprotein epsilon 4 allele. J Neurosci. 1997;17:516–29. 10.1523/JNEUROSCI.17-02-00516.1997 [DOI] [PMC free article] [PubMed] [Google Scholar]
- 33.Love S, Siew LK, Dawbarn D, Wilcock GK, Ben-Shlomo Y, Allen SJ. Premorbid effects of APOE on synaptic proteins in human temporal neocortex. Neurobiol Aging. 2006;27:797–803. 10.1016/j.neurobiolaging.2005.04.008 [DOI] [PubMed] [Google Scholar]
- 34.Sweet RA, MacDonald ML, Kirkwood CM, Ding Y, Schempf T, Jones-Laughner J, et al. Apolipoprotein E*4 (APOE*4) genotype is associated with altered levels of glutamate signaling proteins and synaptic coexpression networks in the prefrontal cortex in mild to moderate Alzheimer disease. Mol Cell Proteomics. 2016;15:2252–62. 10.1074/mcp.M115.056580 [DOI] [PMC free article] [PubMed] [Google Scholar]
- 35.Lopez-Lee C, Torres ERS, Carling G, Gan L. Mechanisms of sex differences in Alzheimer’s disease. Neuron. 2024;112:1208–21. 10.1016/j.neuron.2024.01.024 [DOI] [PMC free article] [PubMed] [Google Scholar]
- 36.Snyder HM, Asthana S, Bain L, Brinton R, Craft S, Dubal DB, et al. Sex biology contributions to vulnerability to Alzheimer’s disease: a think tank convened by the women’s Alzheimer’s research initiative. Alzheimers Dement. 2016;12:1186–96. 10.1016/j.jalz.2016.08.004 [DOI] [PMC free article] [PubMed] [Google Scholar]
- 37.Farrer LA, Cupples LA, Haines JL, Hyman B, Kukull WA, Mayeux R, et al. Effects of age, sex, and ethnicity on the association between apolipoprotein E genotype and Alzheimer disease. a meta-analysis. APOE and Alzheimer disease meta analysis consortium. JAMA. 1997;278:1349–56. [PubMed] [Google Scholar]
- 38.Brinton RD, Yao J, Yin F, Mack WJ, Cadenas E. Perimenopause as a neurological transition state. Nat Rev Endocrinol. 2015;11:393–405. 10.1038/nrendo.2015.82 [DOI] [PMC free article] [PubMed] [Google Scholar]
- 39.Subramaniapillai S, Almey A, Natasha Rajah M, Einstein G. Sex and gender differences in cognitive and brain reserve: Implications for Alzheimer’s disease in women. Front Neuroendocrinol. 2021;60:100879 10.1016/j.yfrne.2020.100879 [DOI] [PubMed] [Google Scholar]
- 40.Stern Y, Gurland B, Tatemichi TK, Tang MX, Wilder D, Mayeux R. Influence of education and occupation on the incidence of Alzheimer’s disease. JAMA. 1994;271:1004–10. [PubMed] [Google Scholar]
- 41.Yasuno F, Minami H, Hattori H, Alzheimer’s Disease Neuroimaging I. Interaction effect of Alzheimer’s disease pathology and education, occupation, and socioeconomic status as a proxy for cognitive reserve on cognitive performance: in vivo positron emission tomography study. Psychogeriatrics. 2020;20:585–93. 10.1111/psyg.12552 [DOI] [PubMed] [Google Scholar]
- 42.Nordestgaard LT, Christoffersen M, Afzal S, Nordestgaard BG, Tybjaerg-Hansen A, Frikke-Schmidt R. Triglycerides as a shared risk factor between dementia and atherosclerotic cardiovascular disease: a study of 125 727 individuals. Clin Chem. 2021;67:245–55. 10.1093/clinchem/hvaa269 [DOI] [PubMed] [Google Scholar]
- 43.Atzmon G, Gabriely I, Greiner W, Davidson D, Schechter C, Barzilai N. Plasma HDL levels highly correlate with cognitive function in exceptional longevity. J Gerontol A Biol Sci Med Sci. 2002;57:M712–5. 10.1093/gerona/57.11.m712 [DOI] [PubMed] [Google Scholar]
- 44.Bates KA, Sohrabi HR, Rainey-Smith SR, Weinborn M, Bucks RS, Rodrigues M, et al. Serum high-density lipoprotein is associated with better cognitive function in a cross-sectional study of aging women. Int J Neurosci. 2017;127:243–52. 10.1080/00207454.2016.1182527 [DOI] [PubMed] [Google Scholar]
- 45.Reitz C, Tang MX, Schupf N, Manly JJ, Mayeux R, Luchsinger JA. Association of higher levels of high-density lipoprotein cholesterol in elderly individuals and lower risk of late-onset Alzheimer disease. Arch Neurol. 2010;67:1491–7. 10.1001/archneurol.2010.297 [DOI] [PMC free article] [PubMed] [Google Scholar]
- 46.Rosenson RS, Brewer HB Jr., Ansell BJ, Barter P, Chapman MJ, Heinecke JW, et al. Dysfunctional HDL and atherosclerotic cardiovascular disease. Nat Rev Cardiol. 2016;13:48–60. 10.1038/nrcardio.2015.124 [DOI] [PMC free article] [PubMed] [Google Scholar]
- 47.Ma F, Wu T, Zhao J, Ji L, Song A, Zhang M, et al. Plasma homocysteine and serum folate and vitamin B(12) levels in mild cognitive impairment and Alzheimer’s disease: a case-control study. Nutrients. 2017;9:725. 10.3390/nu9070725 [DOI] [PMC free article] [PubMed] [Google Scholar]
- 48.Penninx BW, Guralnik JM, Ferrucci L, Fried LP, Allen RH, Stabler SP. Vitamin B(12) deficiency and depression in physically disabled older women: epidemiologic evidence from the women’s health and aging study. Am J Psychiatry. 2000;157:715–21. 10.1176/appi.ajp.157.5.715 [DOI] [PubMed] [Google Scholar]
- 49.Hutto BR. Folate and cobalamin in psychiatric illness. Compr Psychiatry. 1997;38:305–14. 10.1016/s0010-440x(97)90925-1 [DOI] [PubMed] [Google Scholar]
- 50.Ho PI, Collins SC, Dhitavat S, Ortiz D, Ashline D, Rogers E, et al. Homocysteine potentiates beta-amyloid neurotoxicity: role of oxidative stress. J Neurochem. 2001;78:249–53. 10.1046/j.1471-4159.2001.00384.x [DOI] [PubMed] [Google Scholar]
- 51.Chan W, Almasieh M, Catrinescu MM, Levin LA. Cobalamin-associated superoxide scavenging in neuronal cells is a potential mechanism for vitamin B(12)-deprivation optic neuropathy. Am J Pathol. 2018;188:160–72. 10.1016/j.ajpath.2017.08.032 [DOI] [PMC free article] [PubMed] [Google Scholar]
- 52.Karamshetty V, Acharya JD, Ghaskadbi S, Goel P. Mathematical modeling of glutathione status in type 2 diabetics with vitamin B12 deficiency. Front Cell Dev Biol. 2016;4:16. 10.3389/fcell.2016.00016 [DOI] [PMC free article] [PubMed] [Google Scholar]
- 53.Moreira ES, Brasch NE, Yun J. Vitamin B12 protects against superoxide-induced cell injury in human aortic endothelial cells. Free Radic Biol Med. 2011;51:876–83. 10.1016/j.freeradbiomed.2011.05.034 [DOI] [PMC free article] [PubMed] [Google Scholar]
- 54.Quintanilla RA, Orellana DI, Gonzalez-Billault C, Maccioni RB. Interleukin-6 induces Alzheimer-type phosphorylation of tau protein by deregulating the cdk5/p35 pathway. Exp Cell Res. 2004;295:245–57. 10.1016/j.yexcr.2004.01.002 [DOI] [PubMed] [Google Scholar]
Associated Data
This section collects any data citations, data availability statements, or supplementary materials included in this article.
Supplementary Materials
Data Availability Statement
The original data presented in the study are included in the article/Supplementary Material, further inquiries can be directed to the corresponding author.