

Abstract
The role of dietary carbohydrates in weight loss has received considerable attention in light of the current obesity epidemic. The authors investigated the association of body mass index (weight (kg)/height (m)2) with dietary intake of carbohydrates and with measures of the induced glycemic response, using data from an observational study of 572 healthy adults in central Massachusetts. Anthropometric measurements, 7-day dietary recalls, and physical activity recalls were collected quarterly from each subject throughout a 1-year study period. Data were collected between 1994 and 1998. Longitudinal analyses were conducted, and results were adjusted for other factors related to body habitus. Average body mass index was 27.4 kg/m2 (standard deviation, 5.5), while the average percentage of calories from carbohydrates was 44.9 (standard deviation, 9.6). Mean daily dietary glycemic index was 81.7 (standard deviation, 5.5), and glycemic load was 197.8 (standard deviation, 105.2). Body mass index was found to be positively associated with glycemic index, a measure of the glycemic response associated with ingesting different types of carbohydrates, but not with daily carbohydrate intake, percentage of calories from carbohydrates, or glycemic load. Results suggest that the type of carbohydrate may be related to body weight. However, further research is required to elucidate this association and its implications for weight management.
Keywords: body mass index, carbohydrates, glycemic index
Abbreviations: BMI, body mass index; FFQ, food frequency questionnaire; SD, standard deviation; 7DDR, 7-day dietary recall
Over the last 20 years, the prevalence of obesity has increased despite a decrease in the reported percentage of energy intake derived from daily fat intake (1). Issues regarding the accuracy of dietary self-report notwithstanding, this observation suggests that factors other than dietary fat intake may be responsible for this observed increase in obesity. The role of dietary carbohydrates in weight gain has become an important question in the public consciousness (2–5). Carbohydrates have been traditionally classified as simple (monomeric and dimeric) or complex (polymeric) on the basis of their chemical structure. A critical defect of this classification is its inability to predict the plasma glucose and insulin responses associated with different types of carbohydrates (6). The glycemic index, developed two decades ago by Jenkins et al. (7), allows comparison of different foods based on their physiologic effects rather than on their chemical composition. A positive association between glycemic index and body weight has been shown in several short-term experimental studies and limited observational studies (8–15). The possible biologic mechanisms of glycemic index on body weight are thought to be related to insulin levels, hunger and satiation, and basic metabolic processes (16–18). However, the long-term effect of glycemic index and total carbohydrates on body weight is currently unknown.
Because controlled clinical trials are expensive and difficult to conduct, it is of value to obtain further insight into the impact of glycemic index and total carbohydrate intake on body mass index (BMI) from existing data sets derived from carefully conducted observational studies. The Seasonal Variation of Blood Cholesterol Study (SEASONS), a large prospective study, was designed to quantify the magnitude and timing of seasonal changes in blood lipids and to identify the major factors contributing to this variation, including diet and physical activity (19, 20). We used longitudinal data from this study to evaluate the relation between BMI and carbohydrate-related dietary factors (glycemic index, glycemic load, daily carbohydrate intake, and percentage of calories from carbohydrates) while controlling for the effects of physical activity and energy intake.
MATERIALS AND METHODS
Subject recruitment and study design
Details of the study design and recruitment have been described elsewhere (19, 20). Briefly, subjects were residents of Worcester County, Massachusetts; aged 20–70 years; and generally healthy. They were recruited between December 1994 and February 1997. The institutional review boards of the Fallon Healthcare System and the University of Massachusetts Medical School approved all subject recruitment and data collection procedures.
A total of 641 (51 percent) subjects completed the baseline questionnaire and at least one blood draw and were considered to have formally entered the study. Study participants were seen in the health maintenance organization clinic for an initial baseline interview and anthropometric measurements and then every 3 months over the next year (five visits per subject).
Assessment of diet
Dietary intake was assessed by using the 7-day dietary recall (7DDR) at each visit. The 7DDR, similar in appearance to a food frequency questionnaire (FFQ), was designed to measure short-term change in dietary intake, especially fat, in intervention trials (21). The 7DDR is a 119-food- and 13-beverage-item questionnaire that asks participants to recall specific meals and snacks over the last week. According to our analyses, the 7DDR-derived nutrients agree closely with those derived from multiple 24-hour recalls, in which a high-level correlation coefficient was found (r = 0.53–0.77) across nutrients (21). The 7DDR questionnaire and appropriate instructions were mailed to participants prior to each of their visits. Nutrient scores, such as total caloric and carbohydrate intake, and percentage of calories from fat and carbohydrates, were computed from the data collected from the 7DDR.
Physical activity assessment
Data on physical activity patterns were collected by using telephone-administered 24-hour recall interviews within a 42-day window surrounding each clinic visit (i.e., −28 to 14 days). Three unannounced 24-hour recalls were conducted by trained, registered dietitians on randomly selected days (two weekdays and one weekend). The 24-hour physical activity data collection method was adapted from those developed for a 7-day recall of physical activity (22). We used methods described by Ainsworth et al. (23) to estimate total daily energy expenditure in metabolic equivalent task hours based on the reported time spent at each activity and the activity intensity (light, moderate, vigorous, and very vigorous) level (24, 25). The 24-hour recall was validated against both accelerometers and standard questionnaires; results were comparable to published data from other short-term activity assessments using the Baecke Questionnaire and activity monitors as criterion measures (25).
Assessment of body weight
Body weight was measured at each visit. Height was measured at baseline. Relative mass was expressed as BMI (weight (kg)/height (m)2).
Assessment of demographic characteristics
Data on demographic variables were collected by a self-administered questionnaire at the baseline clinic visit.
Calculation of glycemic index and glycemic load from the 7DDR
Daily dietary glycemic index and glycemic load were calculated from the 7DDR. Glycemic index is a measure of the quality of carbohydrates in foods and of glycemic response. The recommended formulas (26) for calculating overall dietary glycemic index and glycemic load are the following:
and
where GIi is the glycemic index for food i, CHOi is the carbohydrate content in food i (g/day), and n is the number of foods eaten per day. To determine the glycemic index, each food item from the 7DDR was matched directly to foods in the international table of glycemic index (27) and the comprehensive table from The New Glucose Revolution (4). White bread was used as the reference. If glucose was used as the reference, the glycemic index value for the food could be converted by multiplying by 1.43 to standardize the glycemic index value derived from a comparison with white bread (27). If a food item from the United States was not available in the international tables, a corresponding Canadian food was chosen or a best match was made. Each food was “best matched” to a similar food in a particular food group. Carbohydrate content in particular food groups was the first consideration in matching of a particular food to an available food listed in the tables.
Mixed foods and groups of foods containing multiple ingredients were broken down into individual food components by using the Nutrition Data System for Research (version 4.03-64; Nutrition Coordinating Center, University of Minnesota, Minneapolis, Minnesota). The carbohydrate content of each component, per serving, was determined according to the Nutrition Data System for Research and the recipes for mixed foods. Glycemic index values of mixed foods were determined according to information from the Nutrition Data System for Research and their recipes and were weighted by the carbohydrate content of each component in the mixed food (4, 7, 28).
For some foods or components without a glycemic index value, foods with similar glycemic index nutrition factors and similar features, such as starch gelatinization, physical entrapment, amylose-to-amylopectin ratio, particle size, soluble fiber content, acidity, and fat, were substituted. The food substitution was guided by a senior nutritionist. These seven features were emphasized because they are critical factors in determining glycemic potential (7). Foods with a very low carbohydrate content were excluded because their glycemic index values cannot be tested. The cutoff point to exclude foods was set at 3.5 g of carbohydrate per serving (4).
Alcoholic beverages contain little carbohydrate, and a glycemic index for them has not been established. Large quantities of beer may raise glucose levels slightly, but the glycemic index, by definition, is based on 50 g of carbohydrate. For this reason, we ignored beer, wine, and spirits in calculating glycemic index and glycemic load (29). Of the total 132 food and beverage items reported in the 7DDR, 16 (12.1 percent) contain no carbohydrate and 30 (22.7 percent) contain no more than 3.5 g of carbohydrate per serving. However, the daily average amount of carbohydrate in these foods, including 3.9 g from alcohol, is 8.2 g, which represents 3.8 percent of daily carbohydrate intake (8.2/217.5). The methodology we used to calculate the glycemic index of mixed or group foods has been cited widely (4, 28).
Statistical methods
Chi-square tests or the t test was used to compare the baseline sample characteristics of men and women. Data from all five time points were used for the final analyses to examine the relation between BMI and carbohydrate-related factors. We used exploratory graphic techniques (locally weighted regression) and fractional polynomial regression to determine the appropriate bivariate relation of BMI with glycemic index, glycemic load, carbohydrates, physical activity, and total energy intake. The associations were determined to be approximately linear. The association between BMI and glycemic index was assessed by using longitudinal analysis, and generalized estimating equations models (30–32) were used for modeling BMI over time while accounting for within-subject correlations.
To develop the “best” model, we included sociodemo-graphic and physiologic variables known to be associated with BMI (such as those listed in tables 1 and 2). We forced total energy intake, physical activity, and age into the model and then used a stepwise process to eliminate those nonsignificant (p > 0.10) covariates. Because the serial autocorrelation was estimated as 0.82, we specified the serial correlation between observations of the same subject as autoregressive of order one. We examined the association of BMI with glycemic index by gender and found that a consistent trend was presented for both genders. Seasonality also was accounted for in the analysis; season of the year was categorized by using the light-season definition, centered at the equinoxes, to maximize variation in light exposure (winter: November 6–February 4; spring: February 5–May 6; summer: May 7–August 5; and fall: August 6–November 5).
TABLE 1.
Characteristics of study participants at baseline, Seasonal Variation of Cholesterol Study, Worcester, Massachusetts, 1994–1998
| Total (n = 572)
|
Men (n = 297)
|
Women (n = 275)
|
||||
|---|---|---|---|---|---|---|
| Variable | No. | % | No. | % | No. | % |
| Age in years (mean (SD†)) | 47.8 (12.3) | 48.3 (12.4) | 47.2 (12.0) | |||
| Race/ethnicity | ||||||
| White | 484 | 86.7 | 250 | 88.7 | 225 | 84.6 |
| Hispanic | 44 | 7.9 | 18 | 6.16 | 26 | 9.8 |
| Other | 30 | 5.4 | 15 | 5.14 | 15 | 5.6 |
| Educational level* | ||||||
| Less than high school | 32 | 5.6 | 13 | 4.4 | 19 | 7.0 |
| High school or vocational degree | 137 | 24.1 | 58 | 19.6 | 79 | 28.9 |
| Some college or associates degree | 179 | 31.5 | 99 | 33.4 | 80 | 29.3 |
| College/graduate | 221 | 38.8 | 126 | 42.6 | 95 | 34.8 |
| Employment* | ||||||
| Full-time | 384 | 67.4 | 224 | 75.4 | 160 | 58.6 |
| Part-time | 87 | 15.3 | 31 | 10.4 | 56 | 20.5 |
| Unemployed/retired | 99 | 17.4 | 42 | 14.1 | 57 | 20.9 |
| Current smoking‡ | ||||||
| Yes | 96 | 17.1 | 53 | 18.4 | 43 | 15.8 |
| No§ | 464 | 82.9 | 235 | 81.6 | 229 | 84.2 |
| Body mass index¶ classification* | ||||||
| Normal (18.5–24.9) | 205 | 37.5 | 81 | 28.6 | 124 | 47.0 |
| Overweight (25–29.9) | 210 | 38.4 | 127 | 44.9 | 83 | 31.4 |
| Obese (≥30) | 132 | 24.1 | 75 | 26.5 | 57 | 21.6 |
| Mean (SD) | 27.38 (5.5) | 27.9 (4.5) | 26.8 (6.3) | |||
p < 0.05 in chi-square tests comparing men and women.
SD, standard deviation.
Because of missing values, the total number of subjects differs.
Defined as never having smoked or having quit smoking at least 1 year prior to enrollment.
Weight (km)/height (m)2).
TABLE 2.
Relevant dietary factors and physical activity (mean (standard deviation)) of study participants at baseline, Seasonal Variation of Cholesterol Study, Worcester, Massachusetts, 1994–1998
| Variable | Total (n = 572) | Men (n = 297) | Women (n = 275) |
|---|---|---|---|
| Dietary factor | |||
| Total energy (kcal/day)* | 2,055 (9.55) | 2,227 (895) | 1,882 (983) |
| % of energy from carbohydrate* | 44.9 (9.6) | 43.4 (9.3) | 46.4 (9.7) |
| % of energy from fat | 36.7 (9.0) | 37.2 (8.9) | 36.1 (9.1) |
| Carbohydrate (g/day) | 231.2 (125.1) | 241.1 (106.5) | 221.2 (141.1) |
| Glycemic index* | 81.7 (5.5) | 82.3 (5.2) | 81.1 (5.8) |
| Glycemic load | 197.8 (105.2) | 202.7 (91.1) | 192.8 (118.0) |
| Physical activity (MET†-hours/day) | |||
| Total* | 30.6 (6.2) | 32.2 (7.6) | 29.0 (4.0) |
| Household | 4.7 (5.0) | 4.4 (5.6) | 5.0 (4.3) |
| Occupational* | 4.9 (7.1) | 6.5 (8.7) | 3.3 (4.1) |
| Leisure-time/sports* | 2.0 (3.1) | 2.2 (3.5) | 1.8 (2.7) |
p < 0.05 in a t test comparing men and women.
MET, metabolic equivalent task.
We distinguished cross-sectional (between-subject) effects from longitudinal (temporal change within subject) effects of predictors (33, 34). For example, concurrent glycemic index was separated into two components: 1) the subject-specific average and 2) within-subject quarterly differences from this average. Physical activity, energy intake, and percentage of calories from fat were treated similarly. Both the cross-sectional and longitudinal effects were included in the model.
Because glycemic index, carbohydrates, percentage of calories from carbohydrates, and glycemic load are related to each other, similar models were run for each variable separately. Similar analyses also were conducted to evaluate the association of glycemic index with total energy intake.
RESULTS
Of the 641 subjects entering the Seasonal Variation of Blood Cholesterol Study, 572 (89.2 percent) participated in at least two clinic visits yielding both BMI and glycemic index values and were included in the analyses. Tables 1 and 2 present the characteristics of the study sample. About half (51.9 percent) of the subjects were men. They were middle-aged, primarily White, well educated, employed, non-smokers, and generally overweight. The distribution of glycemic index (mean = 81.7, standard deviation (SD), 5.5; white bread = 100) is illustrated in figure 1. Differences in educational levels, BMI, total caloric intake, percentage of calories from fat, glycemic index, and physical activity levels were found between men and women. Between included and excluded participants, only age (47.8 years (SD, 12.3) for those included and 42.0 years (SD, 11.3) for those excluded) and race/ethnicity (86.7 percent White for those included vs. 76.6 percent for those excluded) were significantly different (p < 0.01 and p = 0.01, respectively). Gender, BMI, and smoking status were comparable.
FIGURE 1.
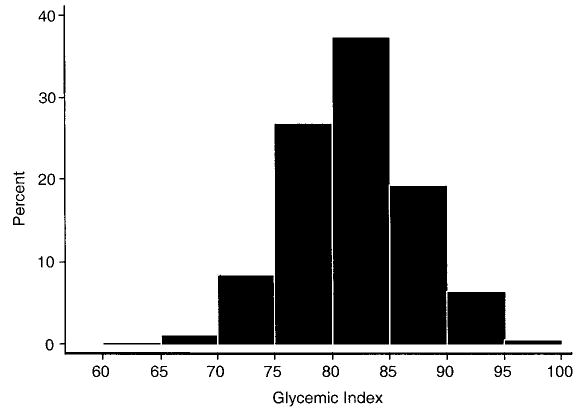
Distribution of baseline dietary glycemic index in 572 healthy adults, Seasonal Variation of Cholesterol Study, Worcester, Massa-chusetts, 1994–1998.
Table 3 presents determinants of BMI. Daily dietary glycemic index, percentage of calories from fat, and caloric intake were associated with higher BMI; female gender, increased physical activity, and higher educational levels were associated with lower BMI. The BMI of study participants was lower in the fall compared with the winter. As a focus of this paper, we report associations of BMI with glycemic index, glycemic load, and carbohydrates, adjusted for daily caloric intake, percentage of calories from fat, physical activity, age, gender, educational level, and season of the year. Daily dietary glycemic index was positively associated with BMI, with a five-unit increase in glycemic index being significantly associated with an increase of 0.75 units in BMI (p = 0.01) from cross-sectional (between-subject) effects and an increase of 0.04 unit in BMI (p = 0.02) from longitudinal effects (temporal change within subject). We conducted similar analyses with separate models to evaluate percentage of calories from carbohydrates, total carbohydrate intake, and glycemic load, and the results showed no significantly statistical associations with BMI regarding both cross-sectional and longitudinal effects (data not shown). However, we noted that the cross-sectional effects of percentage of calories from carbohydrates and total carbohydrates on BMI had small negative regression coefficients: −0.08 and −0.002, respectively.
TABLE 3.
Predictors of body mass index,* Seasonal Variation of Cholesterol Study, Worcester, Massachusetts, 1994–1998
| Coefficient | 95% CI† | p value | |
|---|---|---|---|
| Daily dietary glycemic index‡ | |||
| Cross-sectional effect | 0.75 | 0.21, 1.30 | 0.007 |
| Longitudinal effect | 0.04 | 0.01, 0.07 | 0.02 |
| % of calories from fat | |||
| Cross-sectional effect | 0.09 | 0.03, 0.16 | 0.005 |
| Longitudinal effect | 0.005 | −0.0004, 0.01 | 0.07 |
| Energy intake (kcal/day)§ | |||
| Cross-sectional effect | −0.01 | −0.08, 0.05 | 0.68 |
| Longitudinal effect | 0.005 | 0.001, 0.009 | 0.02 |
| Total physical activity (MET†-hours/day)¶ | |||
| Cross-sectional effect | −0.61 | −1.14, –0.08 | 0.02 |
| Longitudinal effect | −0.03 | −0.06, –0.0001 | 0.049 |
| Gender (male as referent) | |||
| Female | −1.65 | −2.62, –0.68 | 0.001 |
| Age (years)# | 0.03 | −0.34, 0.41 | 0.86 |
| Educational level (<high school as referent) | |||
| High school or vocational degree | −1.67 | −3.69, 0.36 | 0.11 |
| Some college or associates degree | −2.41 | −4.44, –0.38 | 0.02 |
| College/graduate | −4.01 | −6.07, –1.96 | <0.001 |
| Season of the year (winter as referent) | |||
| Spring | 0.02 | −0.04, 0.08 | 0.44 |
| Summer | −0.05 | 0.12, 0.02 | 0.14 |
| Fall | −0.11 | −0.17, –0.05 | 0.001 |
Weight (kg)/height (m)2.
CI, confidence interval; MET, metabolic equivalent task.
A five-unit change in glycemic index.
A 100-kcal change in energy intake.
A five-unit change in total physical activity.
A 10-year change in age.
Similarly, we examined the association between daily dietary glycemic index and caloric intake adjusted for physical activity, age, gender, educational level, and season of the year. Glycemic index was not found to be a significant predictor of energy intake (data not shown).
DISCUSSION
Results from our study support the hypothesis that type of carbohydrate may be related to body weight. However, percentage of calories from carbohydrates, daily total carbohydrate intake, and glycemic load were not found to be related to BMI, and glycemic index was also found not to be related to daily caloric intake.
Validity and reliability of glycemic index and glycemic load are of vital importance to our investigation and to some extent depend on the characteristics of the dietary assessment method. The 7DDR has been shown to be extremely competent in terms of both cross-sectional and longitudinal assessment of diet, especially macronutrients (21). To minimize the influence of missing values, we identified and assigned substitute values of glycemic index for the foods with a higher carbohydrate content, for which glycemic index values were not available. The glycemic index, glycemic load, and total carbohydrate values in our study are also comparable to those reported in several studies that used an FFQ as a dietary assessment tool (35–39). For example, for the 131-item FFQ used in the Women’s Health Study (40), the reported overall dietary glycemic index was 75 (SD, 5.0), glycemic load was 166 (SD, 32), and total carbohydrate intake was 221 g/day (SD, 36) (40).
The hypothetical association between glycemic index and body weight is supported by evidence from short-term animal studies as well as from epidemiologic studies (8–15). Short-term studies in humans and animals have provided evidence that a high-glycemic-index diet affects hunger and nutrient partitioning in a way that promotes body fat storage. Compared with rats fed amylose (a low-glycemic-index starch), those fed amylopectin (a high-glycemic-index starch), under nutrient- and energy-controlled conditions for 3–5 weeks, exhibited physiologic changes that favored fat deposition, including larger adipocyte diameter, increased glucose incorporation into lipids, greater fatty acid synthase, and Glut 4 gene expression in fat tissue (41, 42). By 7 weeks, animals fed a high-glycemic-index diet developed increased epididymal fat mass (9); by 32 weeks, they developed marked obesity compared with animals fed a low-glycemic-index diet (8).
Furthermore, several short-term experimental studies in humans suggest that body weight is positively associated with dietary glycemic index (13). Obese, hyperinsulinemic women appear to lose more weight after 12 weeks of consuming an energy-restricted, low-glycemic-index diet compared with women who consume an energy-restricted, high-glycemic-index diet (11). Similarly, it has been observed that obese men have reduced adiposity, as assessed by dual-energy x-ray absorptiometry, after 5 weeks on an energy- and nutrient-controlled, low-glycemic-index diet compared with a high-glycemic-index diet (13). BMI decreased significantly during an average of 4 months in obese children prescribed an ad libitum low-glycemic-index diet compared with those prescribed an energy-restricted, low-fat diet (12).
Some epidemiologic studies provide further evidence that the glycemic effect of the diet might influence weight control. For example, a lower-glycemic-index diet has been found to predict lower waist-to-hip ratio and waist circumference independent of carbohydrate, fat, and fiber intakes (14), and, in a study of young adults, low fiber consumption (glycemic index was not assessed) predicted higher 10-year weight gain, higher waist-to-hip ratio, and higher 2-hour postprandial glucose insulin concentrations (a measure of insulin resistance) to a greater extent than did total or saturated fat consumption (15). Although fiber and glycemic index are not equivalent, they tend to be related because viscous dietary fibers and foods in which the natural cell wall architecture remains intact (e.g., legumes) generally have lower glycemic indexes.
Results from analysis of both cross-sectional and longitudinal data in our study support findings from a retrospective cohort study of 107 children attending an outpatient obesity program, in which a low-glycemic-index diet was associated with greater weight loss within 4 months of follow-up (12). The average height of subjects in our study was 5 feet 7 inches (170 cm). Given this height, the cross-sectional effect of glycemic index on BMI from our study is calculated to be the equivalent of a difference of 4.8 pounds of weight (2.2 kg of mass) for a five-unit change in glycemic index across subjects, or 9.5 pounds (4.3 kg) for a 10-unit change. This effect is clinically relevant, since it is comparable to that achieved in clinical trials involving changes in dietary intake of fat and saturated fat (43, 44). With knowledge of how foods containing carbohydrate may be classified (e.g., the glycemic indexes for Kellogg’s Corn Flakes (Kellogg’s, Battle Creek, Michigan) and Cheerios (General Mills, Golden Valley, Minnesota) are 92 and 74, respectively), persons are able to make appropriate substitutions acceptable to their palate and lifestyle. Therefore, a change of 5–10 units in glycemic index is possible and of practical significance in terms of their BMI (45).
Because there were only small changes in glycemic index and BMI longitudinally over the 1-year observational period of this study, the association between glycemic index and BMI that was found comes from the cross-sectional analysis in which we observed a larger association between glycemic index and BMI than in the longitudinal analysis. This observation is essentially the converse of what is seen in large-scale intervention trials, where large, relatively predictable changes in serum cholesterol values occur with large changes in dietary fatty acid intake, but there is no observable difference cross-sectionally (46). Here, the spontaneous change in glycemic index or BMI was small, so the variance became very large in relation to the change score because of the simple fact that the variance of a difference is the sum of the variance of the two measures from which the difference is computed (e.g., here, mean weight change = −0.01 pounds (variance, 83.36) and mean change in glycemic index = −0.14 (variance, 38.81)). Therefore, we were unable to detect a stronger association in the longitudinal analyses from this observational study.
Diets low in carbohydrates have been purported to enhance weight loss (2, 3, 47). Studies have reported greater weight loss in those who consumed a low-carbohydrate diet compared with a diet higher in carbohydrate at 6 months (48–50), but weight loss was not sustained at 12 months (48, 51). Therefore, the long-term effect of a low-carbohydrate diet on weight loss remains controversial (52). Our data, derived from a free-living population, did not support the hypothesis that low total carbohydrate intake is related to lower BMI and are consistent with 1-year follow-up data from clinical trials (48, 51).
The glycemic load is the glycemic index of a food multiplied by its carbohydrate content in grams. It has been suggested that glycemic load better reflects a food’s physiologic effect than either the amount of carbohydrate or the glycemic index alone (5). Ebbeling et al. (53) tested a reduced-glycemic-load diet for treating obesity in 14 pediatric subjects aged 13–21 years. Results showed that a decrease of 17 units in glycemic load led to a 1.3-unit decrease in BMI, which was significant in comparison with the control group that consumed a conventional low-fat, low-calorie diet. However, our data did not support this hypothesis. The possible explanation is that daily total carbohydrate intake appeared to be negatively associated with BMI, and glycemic index was positively associated with BMI. Therefore, the combination of glycemic index and carbohydrates diminished the association between glycemic load and BMI. Further investigation is warranted.
It has also been suggested that glycemic index influences hunger (16, 17) and therefore may be related to overeating (18). Ludwig (54) summarized 16 studies that examined the effects of glycemic index on hunger, and all but one demonstrated that low-glycemic-index foods increased satiety, delayed return of hunger, and decreased ad libitum food intake compared with high-glycemic-index foods in humans. For example, a study by Leathwood and Pollet (10) reported lower blood glucose levels and slower return of hunger after meals containing bean puree (a low-glycemic-index starch) compared with meals containing potato (a high-glycemic-index starch). Holt et al. (55) showed that glycemic and insulinemic responses to various breakfast cereals are inversely related to satiety score. Ludwig et al. (56) found that high-glycemic-index meals induce a sequence of hormonal and metabolic changes that promote excessive food intake in obese subjects. However, our data indicated that high glycemic index is unrelated to total caloric intake. Again, further research is warranted.
Strengths of this study include the following: 1) Longitudinal analysis was conducted, and two to five measures for dietary factors and BMI from each subject provided more reliable values for the analyses and therefore more stable results; 2) recall bias was less likely in our study because the 7DDR is a food assessment tool designed to recall food intake during 7 days, in contrast to an FFQ requiring estimation of average exposure over a much longer period, typically 3 months to 1 year; 3) information on physical activity also was collected and controlled for in the analyses; and 4) the data analysis method used in this study enabled us to examine the presence of cross-sectional and longitudinal effects in the same model. This method has been widely used and accepted in the statistical field (33, 34, 57), although it has not been widely used in most epidemiologic analyses of longitudinal data.
There are some potential limitations to this study. Unlike in an intervention study, we were not able to create large contrasts over time, thus obscuring a possible causal relation between high-glycemic-index foods and weight. Published glycemic index values are also subject to error. The average coefficient of variation for glycemic responses from 11 normal subjects who consumed 50 g of glucose an average of eight times each was 25 percent. The mean coefficient of variation for the glycemic index for 22 normal subjects who consumed 50 g of carbohydrate from white bread was 22 percent (58). The coefficients of variation were 13 percent for the glycemic index value of Kellogg’s Corn Flakes as tested in four laboratories and 26 percent for potato as tested in 10 laboratories (28), although, if a standardized method is used, the results for glycemic index agree about as well as data on carbohydrate, protein, fat, and fiber from 24-hour dietary recalls (i.e., with a coefficient of variation of ±5 percent) (59–61). Although the 7DDR may have minimized recall bias compared with the FFQ, it was designed to focus on dietary fat. As with most FFQs, it underestimates total carbohydrate (by an average of 33 g; SD, 68) compared with multiple 24-hour recalls (21). Still, to estimate effect, the absolute amount of bias is relatively unimportant if the degree of linear agreement is good.
Dietary fiber, particularly soluble fiber, is a very important factor affecting food digestion and absorption rate, which in turn affects the glycemic index value (62, 63). We attempted to break food items down into individual components to calculate glycemic index and glycemic load, but the process is not as precise as it is with the detail available from 24-hour dietary recall data. However, to our knowledge, there are no published glycemic index data based on 24-hour recalls.
Other potential limitations to our study include the fact that our study population consisted largely of White, middle-class subjects who were members of a health maintenance organization. In addition, because the study protocol involved a lengthy series of clinic visits and diet assessments, participants who stayed in the study were highly motivated. Selection factors relating to the participants’ interest in their own health and time availability for participation may have created a fairly homogeneous and health-conscious study group. For these reasons, our findings might not be generalizable to other socioeconomic strata or to other cultural and ethnic groups.
In conclusion, results from our study suggest that daily dietary glycemic index is independently and positively associated with BMI. This finding is consistent with the hypothesis that with increased glycemic index, more insulin is produced and more fat is stored, suggesting that type of carbohydrate may be related to body weight. Our data did not support the current public trend of lowering total carbohydrate intake for weight loss or of lowering glycemic load for weight loss, as suggested by other researchers (5, 53). These results add valuable information about the role of glycemic index, glycemic load, carbohydrates, and management of body weight and about the potential prevention of obesity. However, further research is needed to deepen understanding of the relation between body weight and dietary carbohydrates.
Acknowledgments
The project described in this paper was supported by grant R01-HL52745 to Dr. Ira S. Ockene and grant 1 R21 HL074895-01 to Dr. Yunsheng Ma from the National Heart, Lung, and Blood Institute (NHLBI).
The contents of this paper are solely the responsibility of the authors and do not necessarily represent the official views of the NHLBI.
The authors thank Philip Merriam, Laura Robidoux, and Priscilla Cirillo for their assistance with study recruitment and data collection; Kelly Scribner for coordinating the 24-hour recalls; and the following Seasonal Variation of Blood Cholesterol Study dietitians who conducted the 24-hour recalls: Susan Nelson, Christine Singelton, Pat Jeans, Karen Lafayette, Deborah Lamb, Stephanie Olson, Eileen Capstraw, and Barbara Olendzki. The authors also thank Drs. Charles Matthews and Patty Freedson for their contribution regarding physical activity measurements. They thank Marilyn Sarnie for her insightful critiques of early drafts of the manuscript.
References
- 1.Willett WC. Is dietary fat a major determinant of body fat? Am J Clin Nutr. 1998;67:556S–562S. doi: 10.1093/ajcn/67.3.556S. [DOI] [PubMed] [Google Scholar]
- 2.Atkins RC. Dr. Atkins’ new diet revolution. New York, NY: Avon Books, 1998.
- 3.Agatston A. The South Beach diet: the delicious, doctor designed, foolproof plan for fast and healthy weight loss. Emmaus, PA: Rodale Press, 2003.
- 4.Brand-Miller J, Wolever TM, Foster-Powell K, et al. The new glucose revolution: the authoritative guide to the glycemic index—the dietary solution for lifelong health. New York, NY: Marlowe & Company, 2003.
- 5.Willett W. Eat drink and be healthy: the Harvard Medical School guide to healthy eating. New York, NY: Simon & Schuster Source, 2001.
- 6.Crapo PA, Reaven G, Olefsky J. Plasma glucose and insulin responses to orally administered simple and complex carbohydrates. Diabetes. 1976;25:741–7. [PubMed] [Google Scholar]
- 7.Jenkins DJ, Wolever TM, Taylor RH, et al. Glycemic index of foods: a physiological basis for carbohydrate exchange. Am J Clin Nutr. 1981;34:362–6. doi: 10.1093/ajcn/34.3.362. [DOI] [PubMed] [Google Scholar]
- 8.Pawlak DB, Denyer GS, Brand-Miller JC. Low post-prandial fat oxidation after a high glycemic index meal leads to increased body fat in chronically fed rats (Abstract) Obes Res. 2000;8:128S. [Google Scholar]
- 9.Pawlak DB, Bryson JM, Denyer GS, et al. High glycemic index starch promotes hypersecretion of insulin and higher body fat in rats without affecting insulin sensitivity. J Nutr. 2001;131:99–104. doi: 10.1093/jn/131.1.99. [DOI] [PubMed] [Google Scholar]
- 10.Leathwood P, Pollet P. Effects of slow release carbohydrates in the form of bean flakes on the evolution of hunger and satiety in man. Appetite. 1988;10:1–11. doi: 10.1016/s0195-6663(88)80028-x. [DOI] [PubMed] [Google Scholar]
- 11.Slabber M, Barnard HC, Kuyl JM, et al. Effects of a low-insulin-response, energy-restricted diet on weight loss and plasma insulin concentrations in hyperinsulinemic obese females. Am J Clin Nutr. 1994;60:48–53. doi: 10.1093/ajcn/60.1.48. [DOI] [PubMed] [Google Scholar]
- 12.Spieth LE, Harnish JD, Lenders CM, et al. A low-glycemic index diet in the treatment of pediatric obesity. Arch Pediatr Adolesc Med. 2000;154:947–51. doi: 10.1001/archpedi.154.9.947. [DOI] [PubMed] [Google Scholar]
- 13.Bouche C, Rizkalla SW, Luo J, et al. Five-week, low-glycemic index diet decreases total fat mass and improves plasma lipid profile in moderately overweight nondiabetic men. Diabetes Care. 2002;25:822–8. doi: 10.2337/diacare.25.5.822. [DOI] [PubMed] [Google Scholar]
- 14.Todd AD. Intimate adversaries: cultural conflict between doctors & women patients. Philadelphia, PA: University of Pennsylvania Press, 1989.
- 15.Ludwig DS, Pereira MA, Kroenke CH, et al. Dietary fiber, weight gain, and cardiovascular disease risk factors in young adults. JAMA. 1999;282:1539–46. doi: 10.1001/jama.282.16.1539. [DOI] [PubMed] [Google Scholar]
- 16.Ludwig DS. The glycemic index: physiological mechanisms relating to obesity, diabetes, and cardiovascular disease. JAMA. 2002;287:2414–23. doi: 10.1001/jama.287.18.2414. [DOI] [PubMed] [Google Scholar]
- 17.Warren JM, Henry CJ, Simonite V. Low glycemic index breakfasts and reduced food intake in preadolescent children. Pediatrics. 2003;112:e414. doi: 10.1542/peds.112.5.e414. [DOI] [PubMed] [Google Scholar]
- 18.Roberts SB. High-glycemic index foods, hunger, and obesity: is there a connection? Nutr Rev. 2000;58:163–9. doi: 10.1111/j.1753-4887.2000.tb01855.x. [DOI] [PubMed] [Google Scholar]
- 19.Merriam PA, Ockene IS, Hebert JR, et al. Seasonal variation of blood cholesterol levels: study methodology. J Biol Rhythms. 1999;14:330–9. doi: 10.1177/074873099129000669. [DOI] [PubMed] [Google Scholar]
- 20.Ockene IS, Chiriboga DE, Stanek EJ, et al. Seasonal variation in serum cholesterol levels: treatment implications and possible mechanisms. Arch Intern Med. 2004;164:863–70. doi: 10.1001/archinte.164.8.863. [DOI] [PubMed] [Google Scholar]
- 21.Hebert JR, Ockene IS, Hurley TG, et al. Development and testing of a seven-day dietary recall. J Clin Epidemiol. 1997;50:925–37. doi: 10.1016/s0895-4356(97)00098-x. [DOI] [PubMed] [Google Scholar]
- 22.Sallis JF, Haskell WL, Wood PD, et al. Physical activity assessment methodology in the Five-City Project. Am J Epidemiol. 1985;121:91–106. doi: 10.1093/oxfordjournals.aje.a113987. [DOI] [PubMed] [Google Scholar]
- 23.Ainsworth BE, Haskell WL, Whitt MC, et al. Compendium of physical activities: an update of activity codes and MET intensities. Med Sci Sports Exerc. 2000;32:S498–504. doi: 10.1097/00005768-200009001-00009. [DOI] [PubMed] [Google Scholar]
- 24.Matthews CE, Freedson PS, Hebert JR, et al. Seasonal variation in household, occupational, and leisure time physical activity: longitudinal analyses from the Seasonal Variation of Blood Cholesterol Study. Am J Epidemiol. 2001;153:172–83. doi: 10.1093/aje/153.2.172. [DOI] [PubMed] [Google Scholar]
- 25.Matthews CE, Freedson P, Hebert J, et al. Comparison of physical activity assessment methods in the Seasonal Variation of Blood Cholesterol Levels Study. Med Sci Sports Exerc. 2000;32:976–84. doi: 10.1097/00005768-200005000-00015. [DOI] [PubMed] [Google Scholar]
- 26.Pi-Sunyer FX. Glycemic index and disease. Am J Clin Nutr. 2002;76:290S–8S. doi: 10.1093/ajcn/76.1.264S. [DOI] [PubMed] [Google Scholar]
- 27.Foster-Powell K, Holt SH, Brand-Miller JC. International table of glycemic index and glycemic load values: 2002. Am J Clin Nutr. 2002;76:5–56. doi: 10.1093/ajcn/76.1.5. [DOI] [PubMed] [Google Scholar]
- 28.Wolever TM, Jenkins DJ, Jenkins AL, et al. The glycemic index: methodology and clinical implications. Am J Clin Nutr. 1991;54:846–54. doi: 10.1093/ajcn/54.5.846. [DOI] [PubMed] [Google Scholar]
- 29.Brand-Miller J, Liu V, Holt SH. Alcohol beverages lower acute glucose and insulin response in the healthy subjects. Asia Pac J Clin Nutr. 2002;11:309S. [Google Scholar]
- 30.Zeger SL, Liang KY. Longitudinal data analysis for discrete and continuous outcomes. Biometrics. 1986;42:121–30. [PubMed] [Google Scholar]
- 31.Zeger SL, Liang KY. An overview of methods for the analysis of longitudinal data. Stat Med. 1992;11:1825–39. doi: 10.1002/sim.4780111406. [DOI] [PubMed] [Google Scholar]
- 32.Zeger SL, Liang KY, Albert PS. Models for longitudinal data: a generalized estimating equation approach. Biometrics. 1988;44:1049–60. [PubMed] [Google Scholar]
- 33.Neuhaus JM, Kalbfleisch JD. Between- and within-cluster covariate effects in the analysis of clustered data. Biometrics. 1998;54:638–45. [PubMed] [Google Scholar]
- 34.Diggle PJ, Liang K, Zeger SL. Analysis of longitudinal data. New York, NY: Oxford University Press, 1994.
- 35.Frost G, Leeds AA, Dore CJ, et al. Glycaemic index as a determinant of serum HDL-cholesterol concentration. Lancet. 1999;353:1045–8. doi: 10.1016/s0140-6736(98)07164-5. [DOI] [PubMed] [Google Scholar]
- 36.Liu S, Manson J, Stampfer M, et al. Dietary glycemic load assessed by food-frequency questionnaire in relation to plasma high-density-lipoprotein cholesterol and fasting plasma triacylglycerols in postmenopausal women. Am J Clin Nutr. 2001;73:560–6. doi: 10.1093/ajcn/73.3.560. [DOI] [PubMed] [Google Scholar]
- 37.Ford ES, Liu S. Glycemic index and serum high-density lipoprotein cholesterol concentration among US adults. Arch Intern Med. 2001;161:572–6. doi: 10.1001/archinte.161.4.572. [DOI] [PubMed] [Google Scholar]
- 38.Liu S, Willett WC, Stampfer MJ, et al. A prospective study of dietary glycemic load, carbohydrate intake, and risk of coronary heart disease in US women. Am J Clin Nutr. 2000;71:1455–61. doi: 10.1093/ajcn/71.6.1455. [DOI] [PubMed] [Google Scholar]
- 39.van Dam RM, Visscher AW, Feskens EJ, et al. Dietary glycemic index in relation to metabolic risk factors and incidence of coronary heart disease: the Zutphen Elderly Study. Eur J Clin Nutr. 2000;54:726–31. doi: 10.1038/sj.ejcn.1601086. [DOI] [PubMed] [Google Scholar]
- 40.Liu S, Manson JE, Buring JE, et al. Relation between a diet with a high glycemic load and plasma concentrations of high-sensitivity C-reactive protein in middle-aged women. Am J Clin Nutr. 2002;75:492–8. doi: 10.1093/ajcn/75.3.492. [DOI] [PubMed] [Google Scholar]
- 41.Kabir M, Rizkalla SW, Quignard-Boulange A, et al. A high glycemic index starch diet affects lipid storage-related enzymes in normal and to a lesser extent in diabetic rats. J Nutr. 1998;128:1878–83. doi: 10.1093/jn/128.11.1878. [DOI] [PubMed] [Google Scholar]
- 42.Kabir M, Rizkalla SW, Champ M, et al. Dietary amyloseamy-lopectin starch content affects glucose and lipid metabolism in adipocytes of normal and diabetic rats. J Nutr. 1998;128:35–43. doi: 10.1093/jn/128.1.35. [DOI] [PubMed] [Google Scholar]
- 43.Ockene IS, Hebert JR, Ockene JK, et al. Effect of physician delivered nutrition counseling training and an office support system on saturated fat intake, weight, and serum lipid measurements in a hyperlipidemic population: the Worcester Area Trial for Counseling in Hyperlipidemia (WATCH) Arch Intern Med. 1999;159:725–31. doi: 10.1001/archinte.159.7.725. [DOI] [PubMed] [Google Scholar]
- 44.Jeffery RW, Hellerstedt WL, French SA, et al. A randomized trial of counseling for fat restriction versus calorie restriction in the treatment of obesity. Int J Obes Relat Metab Disord. 1995;19:132–7. [PubMed] [Google Scholar]
- 45.Nantel G. Glycemic carbohydrate: an international perspective. Nutr Rev. 2003;61:S34–9. doi: 10.1301/nr.2003.may.S34-S39. [DOI] [PubMed] [Google Scholar]
- 46.Jacobs DJ, Jr, Anderson JT, Blackburn H. Diet and serum cholesterol: do zero correlations negate the relationship? Am J Epidemiol. 1979;110:77–87. doi: 10.1093/oxfordjournals.aje.a112791. [DOI] [PubMed] [Google Scholar]
- 47.Agnew B. Rethinking Atkins. New research suggests that the famous low-carb diet may be safe—at least in the short term. Diabetes Forecast 2004;57:64–6, 68–70. [PubMed]
- 48.Foster GD, Wyatt HR, Hill JO, et al. A randomized trial of a low-carbohydrate diet for obesity. N Engl J Med. 2003;348:2082–90. doi: 10.1056/NEJMoa022207. [DOI] [PubMed] [Google Scholar]
- 49.Samaha FF, Iqbal N, Seshadri P, et al. A low-carbohydrate as compared with a low-fat diet in severe obesity. N Engl J Med. 2003;348:2074–81. doi: 10.1056/NEJMoa022637. [DOI] [PubMed] [Google Scholar]
- 50.Yancy WS, Jr, Olsen MK, Guyton JR, et al. A low-carbohydrate, ketogenic diet versus a low-fat diet to treat obesity and hyperlipidemia: a randomized, controlled trial. Ann Intern Med. 2004;140:769–77. doi: 10.7326/0003-4819-140-10-200405180-00006. [DOI] [PubMed] [Google Scholar]
- 51.Stern L, Iqbal N, Seshadri P, et al. The effects of low-carbohydrate versus conventional weight loss diets in severely obese adults: one-year follow-up of a randomized trial. Ann Intern Med. 2004;140:778–85. doi: 10.7326/0003-4819-140-10-200405180-00007. [DOI] [PubMed] [Google Scholar]
- 52.Willett WC. Reduced-carbohydrate diets: no role in weight management? Ann Intern Med. 2004;140:836–7. [PubMed] [Google Scholar]
- 53.Ebbeling CB, Leidig MM, Sinclair KB, et al. A reduced-glycemic load diet in the treatment of adolescent obesity. Arch Pediatr Adolesc Med. 2003;157:773–9. doi: 10.1001/archpedi.157.8.773. [DOI] [PubMed] [Google Scholar]
- 54.Ludwig DS. Dietary glycemic index and obesity. J Nutr. 2000;130:280S–283S. doi: 10.1093/jn/130.2.280S. [DOI] [PubMed] [Google Scholar]
- 55.Holt S, Brand J, Soveny C, et al. Relationship of satiety to post-prandial glycaemic, insulin and cholecystokinin responses. Appetite. 1992;18:129–41. doi: 10.1016/0195-6663(92)90190-h. [DOI] [PubMed] [Google Scholar]
- 56.Ludwig DS, Majzoub JA, Al-Zahrani A, et al. High glycemic index foods, overeating, and obesity. Pediatrics. 1999;103:E26. doi: 10.1542/peds.103.3.e26. [DOI] [PubMed] [Google Scholar]
- 57.Palta M, Yao TJ. Analysis of longitudinal data with unmeasured confounders. Biometrics. 1991;47:1355–69. [PubMed] [Google Scholar]
- 58.Wolever TM. The glycemic index. World Rev Nutr Diet. 1990;62:120–85. [PubMed] [Google Scholar]
- 59.Wolever TM. Effect of blood sampling schedule and method of calculating the area under the curve on validity and precision of glycaemic index values. Br J Nutr. 2004;91:295–301. doi: 10.1079/bjn20031054. [DOI] [PubMed] [Google Scholar]
- 60.Beaton GH, Milner J, McGuire V, et al. Source of variance in 24-hour dietary recall data: implications for nutrition study design and interpretation. Carbohydrate sources, vitamins, and minerals. Am J Clin Nutr. 1983;37:986–95. doi: 10.1093/ajcn/37.6.986. [DOI] [PubMed] [Google Scholar]
- 61.Beaton GH, Milner J, Corey P, et al. Source of variance in 24-hour dietary recall data: implications for nutrition study design and interpretation. Am J Clin Nutr. 1979;32:2546–59. doi: 10.1093/ajcn/32.12.2546. [DOI] [PubMed] [Google Scholar]
- 62.Jenkins DJ, Josse RG, Jenkins AL, et al. Implications of altering the rate of carbohydrate absorption from the gastrointestinal tract. Clin Invest Med. 1995;18:296–302. [PubMed] [Google Scholar]
- 63.Chandalia M, Garg A, Lutjohann D, et al. Beneficial effects of high dietary fiber intake in patients with type 2 diabetes mellitus. N Engl J Med. 2000;342:1392–8. doi: 10.1056/NEJM200005113421903. [DOI] [PubMed] [Google Scholar]