

Abstract
Purpose:
To evaluate the reproducibility of important biomarkers like wall shear stress (WSS), pulse wave velocity (PWV), and net flow across two 4D flow MRI imaging protocols with different coverages: aorta-targeted 4D flow MRI (AT4D) and whole-heart 4D flow (WH4D) protocols.
Methods:
Thirty-eight control subjects (43.2 ± 10.1 years old; 22 males) and ten patients (45.7 ± 8.9 years old; 7 males) with bicuspid aortic valve (BAV) were included. Each subject underwent AT4D and WH4D scans. Absolute WSS, PWV, and net flow were assessed for each patient across both protocols and compared using Bland-Altman analysis. Areas of elevated WSS were assessed for BAV patients across different WSS thresholds that define WSS to be elevated compared to a normal population average. A sensitivity analysis was conducted to determine the best WSS threshold at which WH4D-derived areas most closely resemble AT4D-derived areas. Inter-rater reproducibility was evaluated in twenty-four subjects.
Results:
AT4D and WH4D PWV and WSS estimates demonstrated good agreement (PWV: −0.12 ± 1.84 m/s, p = 0.4; Median WSS: 0.06 ± 0.13 Pa, p < 0.01; Maximum WSS: 0.04 ± 0.27 Pa, p = 0.07). Good agreement was also found for AAo net flow (8.14 ± 24.86 mL/cycle, p < 0.01). PWV correlated with age across protocols (AT4D: r = 0.68, p < 0.01; WH4D: r = 0.72, p < 0.01). Sensitivity analysis identified a WSS threshold where WH4D-derived areas of elevated WSS most closely resembled AT4D-derived areas. Inter-rater assessment of the tested parameters resulted in a small mean difference percentage of < 3%.
Data conclusion:
PWV, WSS, and net flow demonstrated good agreement across protocols. The WSS threshold should be adjusted for WH4D estimates to optimally match AT4D-derived output. Reproducibility analysis showed good test-retest agreement. This study demonstrates the reproducibility of certain hemodynamic parameters across two 4D flow MRI protocol.
Keywords: 4D-flow MRI, Wall shear stress, Aortic stiffness, Pulse wave velocity, Net flow, Reproducibility
Introduction
Time-resolved 3D phase contrast magnetic resonance imaging (4D flow MRI) is an important imaging technique that provides in-vivo information on cardiovascular 3D blood flow dynamics. Due to its volumetric nature, 4D flow MRI data enables post-hoc 3D visualization and quantification of hemodynamics, at any time during the cardiac cycle, to study blood flow in different cardiac or vascular areas of interest within the acquired 3D volume [1-3]. Over the past two decades, 4D flow MRI studies and applications focused on diseases of the thoracic aorta namely bicuspid aortic valve (BAV) as well as other valvular abnormalities (aortic valve stenosis and regurgitation), aortic aneurysm, or dissection [4-12]. As a result, aorta-targeted 4D flow MRI (AT4D) acquisition protocols were initially utilized. AT4D protocol utilized a narrow sagittal-oblique 3D volumetric coverage focusing on the thoracic aorta, along with respiratory gating techniques using navigators or bellows to control for breathing motion [13-16]. While AT4D protocols were acquired in under 10 min, their utility was confined to the investigation of the thoracic aorta, and did not extend to adjacent structures due to constraints associated with acquisition time [1]. However, recent technical developments including compressed sensing and parallel imaging have enabled the development of a whole-heart 4D flow MRI (WH4D) protocol capable of imaging the entire heart and surrounding vasculature in under 15 min [1, 17, 18]. WH4D acquisition allows for a more complete and comprehensive assessment of the entire heart and vessels by utilizing a wide coronal three-dimensional volumetric coverage of the chest and upper abdomen, coupled with a free-breathing acquisition, simplifying scan planning and integration into other clinical protocols [17, 18].
Despite the increased adoption of WH4D, most data analysis workflows for quantifying hemodynamic parameters, such as net flow, pulse wave velocity (PWV), wall shear stress (WSS), and WSS-derived heatmaps, were developed using AT4D protocols. Emerging evidence has been indicating the potential for these parameters to gain increased clinical adoption in the future. For instance, PWV, a biomarker of aortic stiffness, has been demonstrated to offer prognostic significance for predicting future cardiovascular events, stroke, and mortality [19-22]. Additionally, WSS has been shown to influence endothelial cell function and thus could serve as a biomarker to anticipate aortic complications, including wall degeneration, dilation, or dissection [4, 5, 23-25]. On the other hand, WSS-derived heatmaps, which are visual representations of aortic regions exhibiting elevated relative WSS compared to age- and sex-matched controls, have been linked with ascending aorta (AAo) medial wall degeneration upon histologic examination in BAV patients [23, 26].
It is crucial to obtain reliable and reproducible output for such important biomarkers and thus, it is essential to understand the impact of different scan protocols (AT4D vs. WH4D) on PWV and WSS quantification. This study systematically evaluated PWV, WSS heatmaps, and net flow differences in a cohort of healthy controls and patients with BAV who had consecutive AT4D and WH4D scans. We also conducted a sensitivity analysis to adapt the WSS threshold (age- and sex- matched normal population threshold outside of which WSS estimates are deemed elevated or depressed) for the WH4D protocol with the goal of obtaining robust detection of elevated WSS across the two protocols.
Methods
Cohort and acquisition
Healthy controls
Thirty-eight control subjects (43.2 ± 10.1 years old; 22 males) with no previous cardiovascular disease or intervention were prospectively enrolled. All control subjects underwent back-to-back AT4D and WH4D scans during the same MRI exam. The study was approved by the local Institutional Review Board (IRB) and informed consent was obtained from all subjects.
BAV patients
Ten BAV patients (45.7 ± 8.9 years old; 7 males) who required no surgical intervention before or between scans were retrospectively enrolled. Four patients had AT4D and WH4D back-to-back on the same day, four patients had a 6 months interval, and two patients had 9 months interval between the scans. IRB approval for retrospective enrollment was obtained. Consent was waived and these scans were acquired as part of the clinical routine assessment.
MR imaging
Two separate 4D flow MRI protocols were used, AT4D and WH4D. The AT4D protocol is focused on the 3D coverage of the thoracic aorta and is acquired in a sagittal-oblique orientation. AT4D protocol is acquired during free-breathing states with respiratory navigator and ECG gating. The WH4D protocol provided 3D volume coverage over the full whole heart and was acquired in a coronal orientation. Both protocols used the same 4D flow MRI sequence with some adjustments to the sequence parameters such as lowering spatial resolution for the WH4D to accommodate for the increased 3D volume coverage while maintaining a scan time on the order of 10–12 min. The temporal resolution was similar for both protocols and Venc was adjusted for each patient individually depending on the expected maximum flow velocities. BAV patients’ scans were acquired after standard-of-care administration of a contrast agent (Gadavist, Bayer Healthcare, Berlin, Germany).
All 4D flow MRI scans were acquired using 1.5T MR systems (Aera, Avanto, and Sola; Siemens Healthineers, Germany). The acceleration technique was standard parallel imaging (GRAPPA technique) with an acceleration factor of R = 2. Scan parameters for both acquisitions are summarized in Table 1. The scan parameters for the AT4D protocol were as follows: echo time/repetition time (TE/TR) = 2.1–2.3/3.8–5.1 ms, flip angle = 7–15°, temporal resolution = 30–52 ms, matrix size = 285–355 × 340–460 × 72–90 mm3, acquired spatial resolution = 2.1–2.6 × 2.1–2.6 × 2.4–3.4 mm3, reconstructed spatial resolution 2.1–2.6 × 2.4–3.4 mm2 velocity encoding (Venc) along all three directions = 150–325 cm/s. The WH4D acquisition protocol parameters were as follows: echo time/repetition time (TE/TR) = 2.1–2.3/3.6–5.1 ms, flip angle = 7–15°, temporal resolution = 30–50 ms, matrix size = 355–481 × 460–480 × 130–171 mm3, acquired spatial resolution = 2.6–2.7 × 2.6–2.7 × 2.5–3.3 mm3, reconstructed spatial resolution 2.6–2.7 × 2.5–3.3mm2, Venc along all three directions = 150–325 cm/s.
Table 1.
Scan parameters for each acquisition protocol
| Parameter | AT4D | WH4D |
|---|---|---|
| TE/TR (ms) | 2.1–2.3/3.8–5.1 | 2.1–2.3/3.6–5.1 |
| Acquired Spatial resolution (mm3) | 2.1-2.6 × 2.1-2.6 × 2.4-3.4 | 2.6-2.7 × 2.6-2.7 × 2.5-3.3 |
| Recon spatial resolution (mm2) | 2.1-2.6 × 2.4-3.4 | 2.6-2.7 × 2.5-3.3 |
| Acceleration Technique | GRAPPA | GRAPPA |
| Acceleration Factor | 2 | 2 |
| Temporal resolution (ms) | 30–52 | 30–50 |
| Flip angle (°) | 7–15 | 7–15 |
| Matrix size (mm3) | 285–355 × 340–460 × 72–90 | 355–481 × 460–480 × 130–171 |
| Respiratory gating | Navigator | Free breathing with no respiratory gating |
| ECG gating | Retrospective | Retrospective |
| Venc (cm/s) | 150–325 | 150–325 |
Data processing
Both the AT4D and WH4D 4D flow MRI data for all subjects underwent preprocessing for eddy current background phase correction, noise masking, and velocity anti-aliasing using previously described MATLAB-based algorithms [27-29]. A phase contrast magnetic resonance angiogram was calculated from the 4D flow MRI data and used to create a manual 3D segmentation of the thoracic aorta using a dedicated software (Mimics Innovation Suite 20.0, Materialize, Leuven, Belgium). The segmented aorta was then used to mask the 4D flow MRI velocity data for subsequent PWV, WSS, and net flow analysis.
PWV and WSS quantification and analysis
PWV and WSS were quantified using a custom in-house analysis tool (Programmed in MATLAB R2020b, Mathworks, Natick, MA, USA). PWV was calculated using cross-correlation in a repeated approach [30]. Briefly, 2D analysis planes, 4 mm apart, were automatically placed along a calculated 3D aortic centerline to capture flow waveforms at each plane location (Fig. 1). The time-delay for each flow waveform was calculated using cross-correlation [31]. The time-delay and the distance travelled along the centerline were used to estimate aortic PWV via linear regression (PWV = 1/slope) using the first plane as reference. The PWV estimation using cross-correlation was repeated n times (n being the number of planes placed along the centerline) until all planes were used as reference. The repeated cross-correlation analysis (after using each plane along the centerline as a reference plane) resulted in a global aortic PWV distribution for each scan (Fig. 1). The final PWV value was derived from either the median or mean of the PWV distribution, depending on the normality of the global PWV distribution [30].
Fig. 1.

Schematic illustration of the data analysis workflow for 4D flow MRI based pulse wave velocity (PWV) analysis. Automated centerlines were placed on the 3D segmentations of the aorta allowing the placement of planes 4 mm apart to capture flow waveforms. PWV estimation was repeatedly performed using the technique of cross-correlation (Xcor) until all planes were used as reference. The final PWV was the mean or median of the resulting PWV values, depending on the distribution’s normality
The 3D WSS distribution, along the surface of the aorta, was calculated at peak systole (Fig. 2A) as described previously [32]. A region of interest was manually contoured to select the AAo and arch. A histogram of the calculated 3D WSS distribution across the regions of interest was generated and the median and maximum WSS were calculated (Fig. 2B). Maximum WSS was calculated as the median of the top 5% measurements to mitigate noise. Individual components of WSS (axial, circumferential) were not separately analyzed.
Fig. 2.
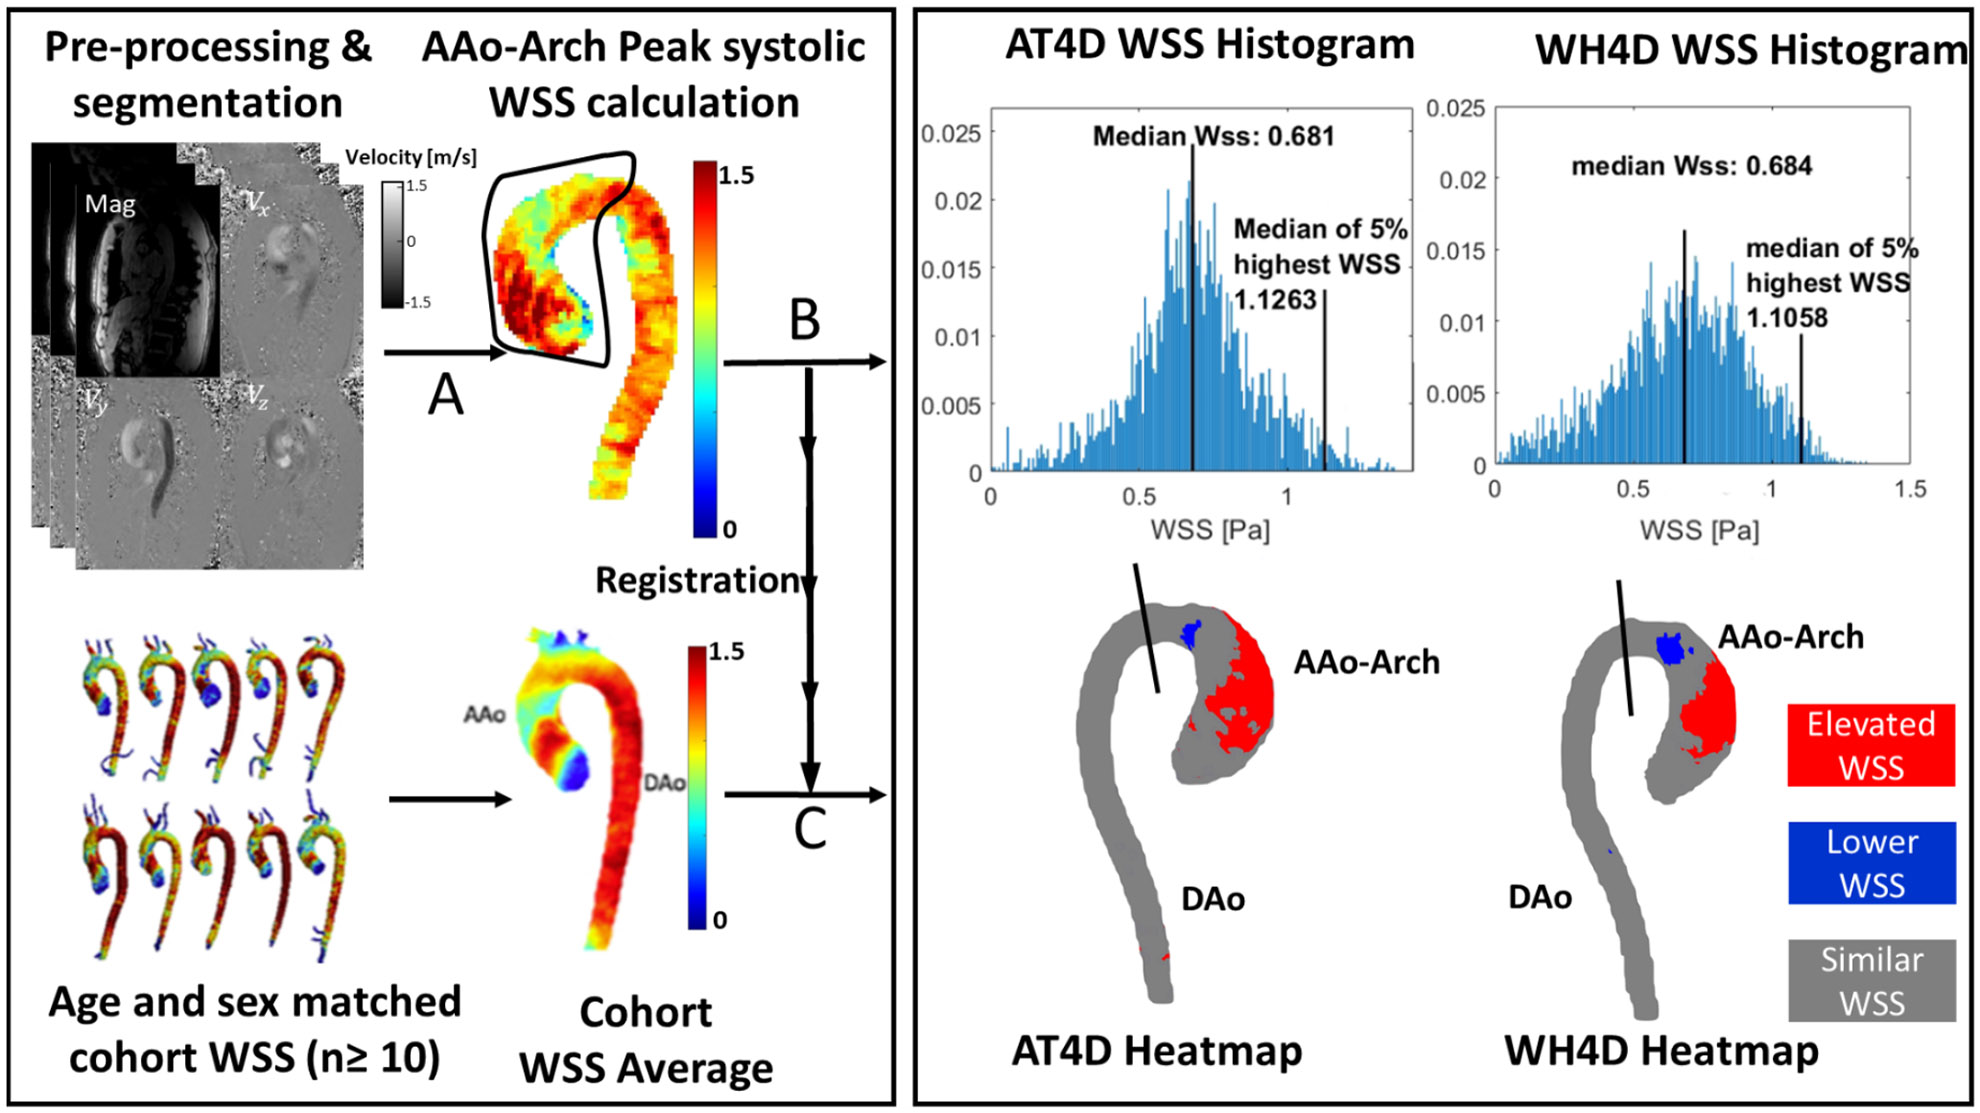
WSS analysis and WSS heatmap calculation. 4D flow data were processed and the thoracic aorta was segmented using a dedicated software. 3D WSS was calculated by selecting a region of interest on the ascending aorta and arch (A). A WSS histogram was output showing median and maximum (median of top 5% values) WSS (B). Next, the segmented aorta was registered on age and sex matched control cohort. After registration (C), a “WSS heatmap” was created that illustrates areas of elevated or reduced WSS compared to the WSS distribution of an age and sex matched control population
To identify regions of abnormal WSS, the three-dimensional WSS distribution for BAV patients was compared to that of an age and sex matched healthy subjects to derive a wall shear stress “heat map” (Fig. 2, bottom left) as previously described [32-35]. The healthy subjects were obtained from a previously recruited cohort of 136 (67 male, 69 female [19–81 years]) participants with no known cardiovascular disease who underwent AT4D scans [36]. 4D flow MRI derived WSS data from the healthy subjects was used to establish a normal population WSS distribution “atlas” for each sex and age group. Each age group consisted of at least 10 healthy subjects and were divided as follows: 18–30, 31–40, 41–50, 51–60, and 61–80. The BAV patients’ aortas were spatially registered to the corresponding age- and sex- matched normal population average WSS distribution (Fig. 2, left). Based on reported strategies, AT4D-derived WSS estimates outside the age- and sex- matched healthy control 95% CIs were considered abnormal [23]. For example, estimates higher than the age- and sex- matched 95% CI are deemed elevated, estimates below the 95% CI are deemed depressed and estimates within the 95% CI are considered similar. Aortic regions with elevated, depressed, or similar WSS were mapped onto each patient’s aorta to create a WSS heatmap (Fig. 2, bottom right). The obtained heatmap regions of the AAo and arch with increased WSS relative to the tailored healthy ensemble-averaged WSS map are referred to in this study as areas of elevated WSS. To quantify areas of elevated wall shear stress in the AAo and arch, a 2D plane perpendicular to the aortic lumen was placed to include the ascending aorta and arch. The areas of elevated WSS were expressed as a fraction (%) of the total area of the AAo and arch.
A sensitivity analysis was conducted to determine the most optimal threshold to achieve WH4D-derived areas of elevated WSS that are comparable to those derived from AT4D scans. This was done by calculating the areas of elevated WSS for the WH4D scans across a series of CIs (1.0 to 2.5 standard deviations) of the age- and sex- matched healthy control. Then, the WH4D-derived areas of elevated WSS for each threshold was compared to the AT4D-derived areas of elevated WSS obtained at a 95% CI of the age- and sex- matched healthy control.
Net flow
We calculated net aortic flow at the level of mid AAo using a semi-automated plane analysis as previously described [37]. Net flow was quantified using a custom in-house analysis tool (Programmed in MATLAB R2020b, Mathworks, Natick, MA, USA). Briefly, a 2D plane perpendicular to the aortic lumen was positioned to select the AAo. This was followed by an automated centerline calculation and selection of the plane that corresponds to the mid AAo. Net flow (mL/ cycle) was defined as the sum of forward and reverse flow through the selected plane over an entire cardiac cycle.
Primary analysis and inter-rater variability
Primary analysis of the entire cohort was done by a primary rater who segmented the aorta for all patients. Aorta segmentations of AT4D and WH4D for each patient were done independently. The resulting segmentations were used to quantify WSS, PWV, and AAo net flow using tools over which the rater had no control.
To assess inter-rater variability, PWV, WSS, and net flow were evaluated separately by the primary rater and a secondary independent rater. The raters were blinded to each other’s results. The cohort used for the inter-rater variability assessment was randomly selected and consisted of half the total number of BAV patients (n = 5) and controls (n = 19).
Statistical analysis
Continuous variables were reported as mean ± standard deviation. AT4D and WH4D agreement as well as inter-rater variability were evaluated using Bland-Altman analysis by calculating mean differences and limits of agreement (LOA). Mean difference percentage is reported to portray differences in estimates across the two protocols.
Paired t-tests and Wilcoxon signed rank were used depending on normality. Normality was assessed using the Shapiro-Wilk test. P-value < 0.05 was used to indicate statistical significance. In addition, the well-established PWV-age correlation was assessed using values obtained from the two acquisition protocols.
Results
PWV
PWV was successfully quantified for all AT4D and WH4D scans. PWV was similar across the two 4D flow MRI acquisition protocols for BAV patients and control groups (BAV: AT4D-PWV = 6.97 ± 1.00 m/s vs. WH4D-PWV of 7.06 ± 1.85 m/s, p = 0.83; Controls AT4D-PWV = 6.77 ± 1.28 m/s vs. WH4D-6.89 ± 1.31 m/s, p = 0.36). We explored the effect of the time interval between scans on PWV for the BAV patients and obtained no significant correlation between time between scans and PWV differences across the two scans (r = 0.11 and p = 0.84).
For the entire cohort, Bland-Altman analysis (Fig. 3) showed no significant systematic difference between the two protocols (Bias = −0.12 ± 1.84 m/s; p = 0.39) with moderate limits of agreement and a mean percent difference of 1%. A strong correlation was found between PWV results across the two protocols (r = 0.76, p < 0.01).
Fig. 3.
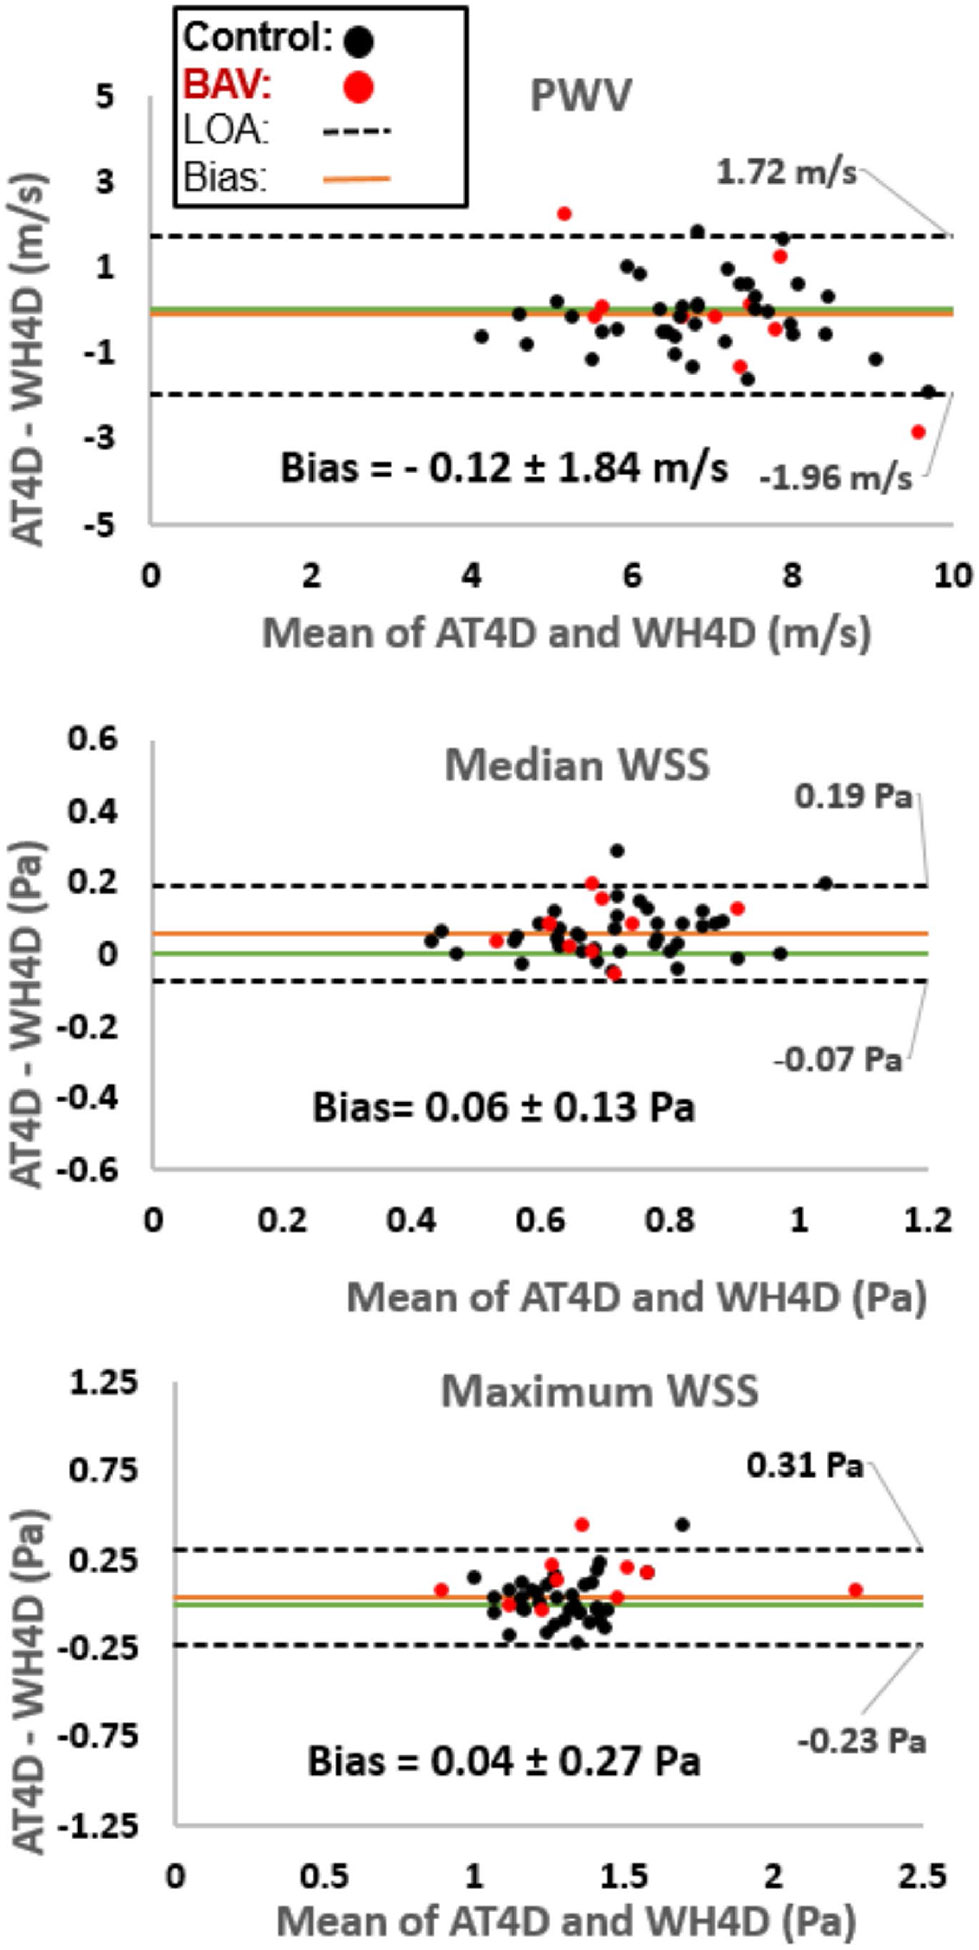
Bland-Altman plots comparing PWV and WSS between aorta-targeted 4d flow (AT4D) and whole-heart 4d flow (WH4D) protocols for controls and patients with bicuspid aortic valve (BAV). LOA: limit of agreement
Correlation analysis (Fig. 4) showed highly similar associations between PWV and age for both 4D flow MRI protocols (AT4D: r = 0.68, p < 0.01; WH4D: r = 0.72, p < 0.01). Notably, the relationship of PWV with age for BAV patients closely paralleled that of healthy controls.
Fig. 4.

Correlation analysis between AT4D-PWV (blue) and WH4D-PWV (red) with age. Data points are differentiated for controls (circle) and BAV patients (triangle)
bicuspid aortic valve (BAV). LOA: limit of agreement.
Table 2 summarizes the results of the inter-rater analysis for PWV quantification, which indicates no systematic difference between the two methods (AT4D-PWV: bias = 0.16 ± 1.19 m/s and WH4D-PWV: bias = 0.10 ± 0.86 m/s; p = 0.21 and 0.24, respectively) with good limits of agreement (both showing 1% mean difference percentage) for both the AT4D and WH4D -based PWV analysis.
Table 2.
Inter-rater assessment biases and limits of agreements (LOA) for pulse wave velocity (PWV) and wall shear stress (WSS) output for each acquisition protocol. AT4D: aorta-targeted 4D flow. WH4D: whole-heart 4D flow
| Inter-rater PWV WH4D (m/s) |
Inter-rater PWV AT4D (m/s) |
Inter-rater median WSS WH4D (Pa) |
Inter-rater median WSS AT4D (Pa) |
Inter-rater maximum WSS WH4D (Pa) |
Inter-rater maximum WSS AT4D (Pa) |
|
|---|---|---|---|---|---|---|
| Bias ± LOA | 0.10 ± 0.86 | −0.16 ± 1.19 | 0.05 ± 0.11 | 0.02 + 0.12 | 0.07 ± 0.15 | 0.01 ± 0.15 |
| p-value | 0.24 | 0.21 | < 0.01* | 0.08 | 0.01* | 0.11 |
WSS and WSS heatmaps
WSS
AT4D-derived median WSS was higher than WH4D-derived median WSS for both BAV patients and controls (BAV: 0.72 ± 0.11 Pa vs. 0.65 ± 0.09 Pa, respectively; p = 0.01 and Controls: 0.75 ± 0.15 Pa and 0.69 ± 0.13 Pa, respectively; p < 0.01). Regarding maximum WSS, AT4D-derived estimates were higher than WH4D-derived estimates for the patients but not the controls (BAV: 1.46 ± 0.38 Pa and 1.34 ± 0.37 Pa, respectively; p = 0.01 and 1.30 ± 0.17 Pa and 1.29 ± 0.14 Pa, respectively; p = 0.54). Similar to PWV, we obtained no significant correlation between scan time intervals and WSS differences across the two protocols (AT4D vs. WH4D WSS estimates) for BAV patients (Mean WSS: r = −0.66 and p = 0.15; Maximum WSS: r = 0.49 and p = 0.32).
For the entire cohort, Bland-Altman analysis (Fig. 3) showed a small bias for the median WSS and no bias for the maximum WSS with moderate-good limits of agreement between the two protocols and a mean difference percentage of 9% and 3%, respectively (median WSS: 0.06 ± 0.13 Pa; p < 0.01 and maximum WSS: 0.04 ± 0.27 Pa; p = 0.07). Both median and maximum WSS were strongly correlated across protocols (r = 0.82, p < 0.01 and r = 0.87, p < 0.01, respectively).
The inter-rater analysis of each protocol (Table 2) shows small biases for the WH4D median WSS and the AT4D maximum WSS with good limits of agreement (mean difference percentage between 1% and 3%).
WSS heatmaps
Results of the sensitivity analysis are shown in Fig. 5A. The bias and limits of agreement are plotted for each WSS threshold (1.0-2.5) used to calculate WH4D-derived areas of elevated WSS. The best agreement, among the tested thresholds, between WH4D- and AT4D- derived estimates, was found at a standard deviation of 1.5 (Fig. 5B). This implies that WH4D-derived areas of elevated WSS in the AAo and arch most closely resemble those of AT4D estimates when WH4D derived WSS estimates outside the 1.5 standard deviation of an age- and sex- matched control group are considered abnormal.
Fig. 5.

Plot A depicts biases and limits of agreement for heatmaps output of AT4D vs. WH4D across standard deviations of 1-2.5. Standard deviations resemble limits outside of which WH4D-derived WSS output is considered abnormal when compared to WSS average estimates of age and sex control subjects. Plot B represents the Bland-Altman plot showing best agreement between AT4D and WH4D heatmap calculation at standard deviation of 1.5
Net flow
We have successfully quantified AAo net flow for all patients across the two protocols. Bland-Altman analysis for the entire cohort showed a small significant bias (8.14 ± 24.86 mL/cycle, p < 0.01). We also obtained a strong significant correlation between the two protocols for AAo net flow (r = 0.84 and p < 0.01).
The inter-rater analysis showed that the mean difference for each protocol was not statistically significant (AT4D-AAo net flow: bias = −0.73 ± 4.46 mL/cycle and WH4D-AAo net flow: bias = 1.50 ± 7.56 mL/cycle; p = 0.13 and 0.08, respectively). The mean difference percentage was 1% for AT4D estimates and 1.5% for WH4D net flow estimates.
Discussion
This study aimed to examine the agreement between two 4D flow MRI acquisition protocols for quantifying important aortic hemodynamic parameters. To our knowledge, comparing hemodynamic output acquired from AT4D vs. WH4D has not been extensively studied. Our results demonstrated good agreement across both protocols for PWV and absolute WSS estimates. PWV also correlated with age for both protocols. Optimal agreement for areas of elevated WSS was determined by a sensitivity analysis across different WSS thresholds.
Regarding PWV, our results showed no statistically significant differences between the two acquisition protocols. These results are comparable to other findings of test-retest reliability on AT4D scans only [38]. It is important to note that our cohort is entirely different from all cohorts in the studies that were cited in this manuscript. We found a significant positive association between PWV and age with a consistent rise of 0.09 m/s per year across both protocols. This suggests that PWV-age relation is conserved when using WH4D protocols. These results align with the literature findings of an average increase of 0.09 m/s per year with a cohort of similar mean age to the one in our study further elucidating the robustness of PWV estimation [39]. This consistency between the protocols could benefit longitudinal studies on vascular aging, especially in high risk patients, who might have PWV assessments using both protocols. Control subjects had similar PWV results to BAV patients as well as similar trends of change with age adding to the growing evidence that no significant PWV differences exist between BAV patients and control groups [40]. The time interval between scans could be a significant confounder especially since hemodynamic parameters like WSS and PWV could change with time. To address this, we studied the effect of the time difference between scans on PWV and WSS differences across scans. We did not obtain a significant correlation between scan time intervals and the quantified hemodynamic parameters. This indicates that time difference did not have a significant impact on blood flow assessment in patients who had up to 9 months interval between scans. Although our analysis is limited by the small number of BAV patients, it is important for future studies to consider a stricter control on the time gap between scans. This is especially crucial in pathologic states like BAV where hemodynamic changes occur progressively.
Our inter-rater assessment for PWV and WSS showed good agreement and small mean differences. PWV inter-rater results were in congruence with a study assessing PWV inter-rater variability using AT4D [38]. In addition, a voxel-by-voxel WSS inter-rater analysis showed a small bias comparable to the biases obtained in our whole cohort comparison as well as our inter-rater assessment [24]. This indicates that inter-rater variability is similar across the two protocols.
We observed higher AT4D-derived median and maximum WSS estimates in BAV patients. While the small sample could have contributed to the mentioned finding, the inherent protocol differences could have played a role. AT4D is targeted to provide a higher aortic spatial resolution than WH4D. Thus, AT4D might be more sensitive in capturing sharp velocity gradients at the vessel wall especially in small or complex regions of the aorta. This is supported by evidence that WSS variability increases with lower spatial resolution [32, 41, 42]. It is also worth mentioning that the choice of the Venc for each scan could affect WSS as well as PWV measurements. If the Venc is too high, it may reduce the sensitivity to lower velocities. Conversely, if the Venc is too low, aliasing could occur which may distort velocity measurements. In both cases, the erroneous velocity estimation could lead to inaccurate WSS and PWV estimates. In addition, variations in Venc across the two protocols could explain some discrepancies in WSS and PWV results [43, 44]. In addition, the respiratory gating method used could influence blood flow quantification. The WH4D protocol had no respiratory gating to maintain acceptable scan times while acquiring data over a large 3D volume. The use of free breathing without respiratory gating may cause ghosting artifacts and blurring of the 4D flow data, particularly in the regions around the diaphragm or in the great vessels such as the aorta and pulmonary arteries. Although respiratory gating could reduce breathing artifacts, it will prolong scan times by 30–50%. However, prior studies have demonstrated that respiratory gating had minimal impact on image quality and blood flow analysis [45]. While our 4D flow MRI protocol agrees with current guideline recommendations, it is important to highlight the need to further explore the robustness of imaging biomarkers using consistent protocol parameters.
Net flow in the mid AAo showed good agreement across protocols, with strong inter-rater agreement for each protocol. Our results are consistent with the findings of Kharabish et al., demonstrating the robustness of flow measurements using 4D flow MRI [46]. It is important to consider variations in imaging protocols when studying net flow measurements. Confounders include, but are not limited to, spatial resolution, temporal resolution, and post-processing techniques. Lower temporal resolution can miss rapid changes in blood velocity, while lower spatial resolution can blur the details of flow patterns near vessel walls, affecting the accuracy of net flow calculations. Post-processing during aortic segmentation could also introduce inconsistencies, especially when using automated methods for plane placement.
In our study we have assessed how AT4D-acquired output of elevated WSS (considered ground truth) compared to those obtained by WH4D. Previous heat map studies were based on AT4D calculations whereby WSS output for BAV patients outside 2 standard deviations (95% confidence interval) of age- and sex- matched controls WSS average were considered abnormal [35]. We have found that WH4D-acquired WSS estimates outside 1.5 standard deviations of the normal population WSS average most closely resembles the data that would have been acquired by AT4D. This method of evaluating areas of elevated WSS is possibly superior to absolute WSS comparisons due to possible 4d flow underestimation of absolute WSS values compared to computational fluid dynamics [47, 48]. This correction should be further validated in a larger cohort to allow the refinement of a WSS-based risk stratification method in diseases like BAV and aortic aneurysm. Future efforts should aim to minimize differences between AT4D and WH4D protocols, minimize the time gap between scans, and study whether differences between AT4D- and WH4D- derived estimates affect the diagnostic or prognostic ability of the parameter in question.
Limitations
This is a single center study and systematic bias depend on local protocols and the set scan parameters. The sample size included in our study is small, however, our results provide insight and potential consideration for future work using WH4D protocols. The retrospective design prevents the assessment of factors that could affect the hemodynamic output such as treatments or blood pressure especially in patients with time intervals between AT4D and WH4D scans. The manual selection of a 2D ROI for WSS calculation introduces a margin of subjective variability that could affect WSS output. However, this could be overcome with the implementation of 3D ROI selection. Regarding heatmaps area output, the planes for selecting the ascending aorta and arch could have a slight mismatch in plane location when comparing AT4D to WH4D output. Thus, it is important to make sure that plane selection is as close as possible between acquisition protocols for future studies. One way to ensure similar plane selection could be by implementing a registration of the segmented aortas acquired from each protocol and then selecting the planes although that method could also have its limitations. The individual components of WSS (axial and circumferential) were not assessed in this study. While circumferential WSS has been strongly correlated with aortic growth rates, WSS magnitude has also been shown to correlate with aortic growth rates [36, 49]. Further studies are required to assess the robustness of different parameters like vorticity, kinetic energy, and viscous energy loss.
Conclusion
In a cohort of healthy controls and BAV patients, PWV, absolute WSS, and net flow estimates had good reproducibility across AT4D and WH4D protocols. A WSS threshold, which resulted in good agreement of quantified areas of elevated WSS across the two protocols, was identified. This study demonstrates the robustness of hemodynamic quantification across AT4D and WH4D and highlights the possible need for some adjustments for certain parameters.
Funding
The authors declare that no funds, grants, or other support were received during the preparation of this manuscript.
Footnotes
Competing interests The authors declare no competing interests.
Data availability
No datasets were generated or analysed during the current study.
References
- 1.Markl M, Frydrychowicz A, Kozerke S, Hope M, Wieben O (2012) 4D flow MRI. J Magn Reson Imaging 36(5):1015–1036. 10.1002/jmri.23632 [DOI] [PubMed] [Google Scholar]
- 2.Markl M, Kilner PJ, Ebbers T (2011) Comprehensive 4D velocity mapping of the heart and great vessels by cardiovascular magnetic resonance. J Cardiovasc Magn Reson 13:1–22. 10.1186/1532-429X-13-7 [DOI] [PMC free article] [PubMed] [Google Scholar]
- 3.Dyverfeldt P, Bissell M, Barker AJ et al. (2015) 4D flow cardiovascular magnetic resonance consensus statement. J Cardiovasc Magn Reson 17(1):1–19. 10.1186/s12968-015-0174-5 [DOI] [PMC free article] [PubMed] [Google Scholar]
- 4.Malek AM, Alper SL, Izumo S (1999) Hemodynamic shear stress and its role in atherosclerosis. JAMA 282(21):2035–2042. 10.1001/jama.282.21.2035 [DOI] [PubMed] [Google Scholar]
- 5.Reneman RS, Arts T, Hoeks AP (2006) Wall shear stress–an important determinant of endothelial cell function and structure–in the arterial system in vivo: discrepancies with theory. J Vasc Res 43(3):251–269. 10.1159/000091648 [DOI] [PubMed] [Google Scholar]
- 6.Hope MD, Hope TA, Crook SES et al. (2011) 4D flow CMR in assessment of valve-related ascending aortic disease. JACC-Cardiovascular Imaging 4:781–787. 10.1016/j.jcmg.2011.05.004 [DOI] [PubMed] [Google Scholar]
- 7.Hope MD, Hope TA, Meadows AK et al. (2010) Bicuspid aortic valve: four-dimensional MR evaluation of ascending aortic systolic flow patterns. Radiology 255:53–61. 10.1148/radiol.09091437 [DOI] [PubMed] [Google Scholar]
- 8.Silber HA, Bluemke DA, Ouyang P, Du YPP, Post WS, Lima JAC (2001) The Relationship between Vascular Wall Shear stress and Flow-mediated dilation: endothelial function assessed by phase-contrast magnetic resonance angiography. J Am Coll Cardiol 38:1859–1865. 10.1016/S0735-1097(01)01649-7 [DOI] [PubMed] [Google Scholar]
- 9.Mahadevia R, Barker AJ, Schnell S et al. (2014) Bicuspid aortic cusp fusion morphology alters aortic three-dimensional outflow patterns, wall shear stress, and expression of aortopathy. Circulation 129:673–682. 10.1161/CIRCULATIONAHA.113.003026 [DOI] [PMC free article] [PubMed] [Google Scholar]
- 10.Bissell MM, Hess AT, Biasiolli L et al. (2013) Aortic dilation in bicuspid aortic valve disease: flow pattern is a major contributor and differs with valve fusion type. Circulation: Cardiovasc Imaging 6:499–507. 10.1161/CIRCIMAGING.113.000528 [DOI] [PMC free article] [PubMed] [Google Scholar]
- 11.Rose MJ, Rigsby CK, Berhane H et al. (2019) 4-D flow MRI aortic 3-D hemodynamics and wall shear stress remain stable over short-term follow-up in pediatric and young adult patients with bicuspid aortic valve. Pediatr Radiol 49:57–67. 10.1007/s00247-018-4257-y [DOI] [PMC free article] [PubMed] [Google Scholar]
- 12.den Reijer PM, van der Sallee D III et al. (2010) Hemodynamic predictors of aortic dilatation in bicuspid aortic valve by velocity-encoded cardiovascular magnetic resonance. J Cardiovasc Magn Reson 12:1–13. 10.1186/1532-429X-12-4 [DOI] [PMC free article] [PubMed] [Google Scholar]
- 13.McConnell MV, Khasgiwala VC, Savord BJ et al. (1997) Comparison of respiratory suppression methods and navigator locations for MR coronary angiography. Am J Roentgenol 168(5):1369–1375. 10.2214/ajr.168.5.9129447 [DOI] [PubMed] [Google Scholar]
- 14.Ehman RL, Felmlee JP (1989) Adaptive technique for high-definition MR imaging of moving structures. Radiology 173(1):255–263. 10.1148/radiology.173.1.2781017 [DOI] [PubMed] [Google Scholar]
- 15.Wang Y, Rossman PJ, Grimm RC, Riederer SJ, Ehman RL (1996) Navigator-echo-based real-time respiratory gating and triggering for reduction of respiration effects in three-dimensional coronary MR angiography. Radiology 198(1):55–60. 10.1148/radiology.198.1.8539406 [DOI] [PubMed] [Google Scholar]
- 16.Baltes C, Kozerke S, Atkinson D, Boesiger P (2004) Retrospective respiratory motion correction for navigated cine velocity mapping. J Cardiovasc Magn Reson 6(4):785–792. 10.1081/JCMR-200036119 [DOI] [PubMed] [Google Scholar]
- 17.Uribe S, Beerbaum P, Sørensen TS, Rasmusson A, Razavi R, Schaeffter T (2009) Four-dimensional (4D) flow of the whole heart and great vessels using real-time respiratory self-gating. Magn Reson Medicine: Official J Int Soc Magn Reson Med 62(4):984–992. 10.1002/mrm.22090 [DOI] [PubMed] [Google Scholar]
- 18.Stankovic Z, Allen BD, Garcia J, Jarvis KB, Markl M (2014) 4D flow imaging with MRI. Cardiovasc Diagnosis Therapy 4(2):173. 10.3978%2/j.issn.2223-3652.2014.01.02 [DOI] [PMC free article] [PubMed] [Google Scholar]
- 19.Pereira T, Correia C, Cardoso J (2015) Novel methods for pulse wave velocity measurement. J Med Biol Eng 35(5):555–565. 10.1007/s40846-015-0086-8 [DOI] [PMC free article] [PubMed] [Google Scholar]
- 20.Sethi S, Rivera O, Oliveros R, Chilton R Aortic stiffness: pathophysiology, clinical implications, and approach to treatment. Integr Blood Press Control 2014:29–34. 10.2147/IBPC.S59535 [DOI] [PMC free article] [PubMed] [Google Scholar]
- 21.Vlachopoulos C, Aznaouridis K, Stefanadis C (2010) Prediction of cardiovascular events and all-cause mortality with arterial stiffness: a systematic review and meta-analysis. J Am Coll Cardiol 55(13):1318–1327. 10.1016/j.jacc.2009.10.061 [DOI] [PubMed] [Google Scholar]
- 22.Pereira T, Maldonado J, Pereira L, Conde J (2013) Aortic stiffness is an independent predictor of stroke in hypertensive patients. Arquivos brasileiros de cardiologia 100(5):437–443. 10.5935/abc.20130079 [DOI] [PubMed] [Google Scholar]
- 23.Guzzardi D, Barker A, van Ooij P et al. (2015) Valve-related Hemodynamics Mediate Human Bicuspid Aortopathy. J Am Coll Cardiol 66(8):892–900. 10.1016/j.jacc.2015.06.1310 [DOI] [PMC free article] [PubMed] [Google Scholar]
- 24.Van Ooij P, Powell AL, Potters WV, Carr JC, Markl M, Barker AJ (2016) Reproducibility and interobserver variability of systolic blood flow velocity and 3D wall shear stress derived from 4D flow MRI in the healthy aorta. J Magn Reson Imaging 43(1):236–248. 10.1002/jmri.24959 [DOI] [PMC free article] [PubMed] [Google Scholar]
- 25.Lehoux S, Tedgui A (2003) Cellular mechanics and gene expression in blood vessels. J Biomech 36(5):631–643. 10.1016/S0021-9290(02)00441-4 [DOI] [PubMed] [Google Scholar]
- 26.Bollache E, Guzzardi DG, Sattari S et al. (2018) Aortic valve-mediated wall shear stress is heterogeneous and predicts regional aortic elastic fiber thinning in bicuspid aortic valve-associated aortopathy. J Thorac Cardiovasc Surg 156(6):2112–2120. 10.1016/j.jtcvs.2018.05.095 [DOI] [PMC free article] [PubMed] [Google Scholar]
- 27.Frydrychowicz A, François CJ, Turski PA (2011) Four-dimensional phase contrast magnetic resonance angiography: potential clinical applications. Eur J Radiol 80(1):24–35. 10.1016/j.ejrad.2011.01.094 [DOI] [PMC free article] [PubMed] [Google Scholar]
- 28.Walker PG, Cranney GB, Scheidegger MB, Waseleski G, Pohost GM, Yoganathan AP (1996) Semiautomated method for noise reduction and background phase error correction in MR phase velocity data. J Magn Reson Imaging 3(3):521–530. 10.1002/jmri.1880030315 [DOI] [PubMed] [Google Scholar]
- 29.Bernstein MA, Zhou XJ, Polzin JA et al. (1998) Concomitant gradient terms in phase contrast MR: analysis and correction. Magn Reson Med 39(2):300–308. 10.1002/mrm.1910390218 [DOI] [PubMed] [Google Scholar]
- 30.Jarvis K, Soulat G, Scott M et al. (2021) Investigation of aortic wall thickness, stiffness and flow reversal in patients with cryptogenic stroke: a 4D flow MRI study. J Magn Reson Imaging 53(3):942–952. 10.1002/jmri.27345 [DOI] [PubMed] [Google Scholar]
- 31.Fielden SW, Fornwalt BK, Jerosch-Herold M, Eisner RL, Stillman AE, Oshinski JN (2008) A new method for the determination of aortic pulse wave velocity using cross-correlation on 2D PCMR velocity data. J Magn Reson Imaging 27(6):1382–1387. 10.1002/jmri.21387 [DOI] [PubMed] [Google Scholar]
- 32.Potters WV, van Ooij P, Marquering H, vanBavel E, Nederveen AJ (2015) Volumetric arterial wall shear stress calculation based on cine phase contrast MRI. J Magn Reson Imaging 41(2):505–516. 10.1002/jmri.24560 [DOI] [PubMed] [Google Scholar]
- 33.Van Ooij P, Potters WV, Collins J et al. (2015) Characterization of abnormal wall shear stress using 4D flow MRI in human bicuspid aortopathy. Ann Biomed Eng 43:1385–1397. 10.1007/s10439-014-1092-7 [DOI] [PMC free article] [PubMed] [Google Scholar]
- 34.Van Ooij P, Potters WV, Nederveen AJ et al. (2015) A methodology to detect abnormal relative wall shear stress on the full surface of the thoracic aorta using four-dimensional flow MRI. Magn Reson Med 73(3):1216–1227. 10.1002/mrm.25224 [DOI] [PMC free article] [PubMed] [Google Scholar]
- 35.Van Ooij P, Garcia J, Potters WV et al. (2016) Age-related changes in aortic 3D blood flow velocities and wall shear stress: implications for the identification of altered hemodynamics in patients with aortic valve disease. J Magn Reson Imaging 43(5):1239–1249. 10.1002/jmri.25081 [DOI] [PMC free article] [PubMed] [Google Scholar]
- 36.Soulat G, Scott MB, Allen BD et al. (2022) Association of regional wall shear stress and progressive ascending aorta dilation in bicuspid aortic valve. Cardiovasc Imaging 15(1):33–42. 10.1016/j.jcmg.2021.06.020 [DOI] [PMC free article] [PubMed] [Google Scholar]
- 37.Shen X, Schnell S, Barker AJ, Suwa K, Tashakkor L, Jarvis K, Carr JC, Collins JD, Prabhakaran S, Markl M (2018) Voxel-by-voxel 4D flow MRI-based assessment of regional reverse flow in the aorta. J Magn Reson Imaging 47(5):1276–1286. 10.1002/jmri.25862 [DOI] [PMC free article] [PubMed] [Google Scholar]
- 38.Markl M, Wallis W, Strecker C, Gladstone BP, Vach W, Harloff A Analysis of pulse wave velocity in the thoracic aorta by flow-sensitive four-dimensional MRI: reproducibility and correlation with characteristics in patients with aortic atherosclerosis. J Magn Reson Imaging 2012:35(5):1162–1168. 10.1002/jmri.22856 [DOI] [PubMed] [Google Scholar]
- 39.Van Hout MJ, Dekkers IA, Westenberg JJ et al. (2021) Normal and reference values for cardiovascular magnetic resonance-based pulse wave velocity in the middle-aged general population. J Cardiovasc Magn Reson 23(1):1–10. 10.1186/s12968-021-00739-y [DOI] [PMC free article] [PubMed] [Google Scholar]
- 40.Johnson EM, Scott MB, Jarvis K et al. (2023) Global aortic pulse wave velocity is unchanged in bicuspid aortopathy with normal valve function but elevated in patients with aortic valve stenosis: insights from a 4D Flow MRI study of 597 subjects. J Magn Reson Imaging 57(1):126–136. 10.1002/jmri.28266 [DOI] [PMC free article] [PubMed] [Google Scholar]
- 41.Montalba C, Urbina J, Sotelo J, Andia ME, Tejos C, Irarrazaval P, Hurtado DE, Valverde I, Uribe S (2018) Variability of 4D flow parameters when subjected to changes in MRI acquisition parameters using a realistic thoracic aortic phantom. Magn Reson Med 79(4):1882–1892. 10.1002/mrm.26834 [DOI] [PubMed] [Google Scholar]
- 42.Cibis M, Potters WV, Gijsen FJ, Marquering H, Van Ooij P, Van-Bavel E, Wentzel JJ, Nederveen AJ (2016) The effect of spatial and temporal resolution of cine phase contrast MRI on wall shear stress and oscillatory shear index assessment. PLoS ONE 11(9):e0163316. 10.1371/journal.pone.0163316 [DOI] [PMC free article] [PubMed] [Google Scholar]
- 43.Srichai MB, Lim RP, Wong S, Lee VS (2009) Cardiovascular applications of phase-contrast MRI. Am J Roentgenol 192(3):662–675. 10.2214/AJR.07.3744 [DOI] [PubMed] [Google Scholar]
- 44.Ha H, Kim GB, Kweon J, Kim YH, Kim N, Yang DH, Lee SJ (2016) Multi-VENC acquisition of four-dimensional phase-contrast MRI to improve precision of velocity field measurement. Magn Reson Med 75(5):1909–1919. 10.1002/mrm.25715 [DOI] [PubMed] [Google Scholar]
- 45.van Ooij P, Semaan E, Schnell S, Giri S, Stankovic Z, Carr J, Barker AJ, Markl M (2015) Improved respiratory navigator gating for thoracic 4D flow MRI. Magn Reson Imaging 33:992–999 [DOI] [PMC free article] [PubMed] [Google Scholar]
- 46.Kharabish A, Belker K, Martinoff S, Ewert P, Hennemuth A, Huellebrand M, Stern H, Meierhofer C (2020) Intraindividual validation of 4D flow measurement against 2D flow measurements in complex flow patterns in routine clinical cardiovascular magnetic resonance of bicuspid aortic valve. Egypt J Radiol Nuclear Med 51:1–8 [Google Scholar]
- 47.van Ooij P, Potters WV, Guédon A et al. (2013) Wall shear stress estimated with phase contrast MRI in an in vitro and in vivo intracranial aneurysm. J Magn Reson Imaging 38(4):876–884. 10.1002/jmri.24051 [DOI] [PubMed] [Google Scholar]
- 48.Cibis M, Potters WV, Gijsen FJ et al. (2014) Wall shear stress calculations based on 3D cine phase contrast MRI and computational fluid dynamics: a comparison study in healthy carotid arteries. NMR Biomed 27(7):826–834. 10.1002/nbm.3126 [DOI] [PubMed] [Google Scholar]
- 49.Guala A, Dux-Santoy L, Teixido-Tura G, Ruiz-Muñoz A, Galian-Gay L, Servato ML, Valente F, Gutiérrez L, González-Alujas T, Johnson KM, Wieben O (2022) Wall shear stress predicts aortic dilation in patients with bicuspid aortic valve. Cardiovasc Imaging 15(1):46–56 [DOI] [PubMed] [Google Scholar]
Associated Data
This section collects any data citations, data availability statements, or supplementary materials included in this article.
Data Availability Statement
No datasets were generated or analysed during the current study.