

Summary
Tolerance to dietary antigens is critical for avoiding deleterious type 2 immune responses resulting in food allergy (FA) and anaphylaxis1,2. However, the mechanisms resulting in both the maintenance and failure of tolerance to food antigens are poorly understood. Here we demonstrate that the goblet cell-derived resistin-like molecule beta (RELMβ)3,4 is a critical regulator of oral tolerance. RELMβ is abundant in the sera of both patients with FA and mouse models of FA. Deletion of RELMβ protects micefrom FA and the development of food-antigen-specific IgE and anaphylaxis. RELMβ disrupts food tolerance through modulation of the gut microbiome and depletion of indole metabolite producing Lactobacilli and Alistipes. Tolerance is maintained via local production of indole derivatives driving FA protective RORγt+ regulatory T (Treg) cells5 through activation of the aryl hydrocarbon receptor. RELMβ antagonism in the peri-weaning period restores oral tolerance and protects genetically proneoffspring from developing FA later in life. Together, we show that RELMβ mediates a gut immune-epithelial circuit regulating tolerance to food antigens-a novel mode of innate control of adaptive immunity through microbiome editing-and identify targetable candidates in this circuit for prevention and treatment of FA.
Main text
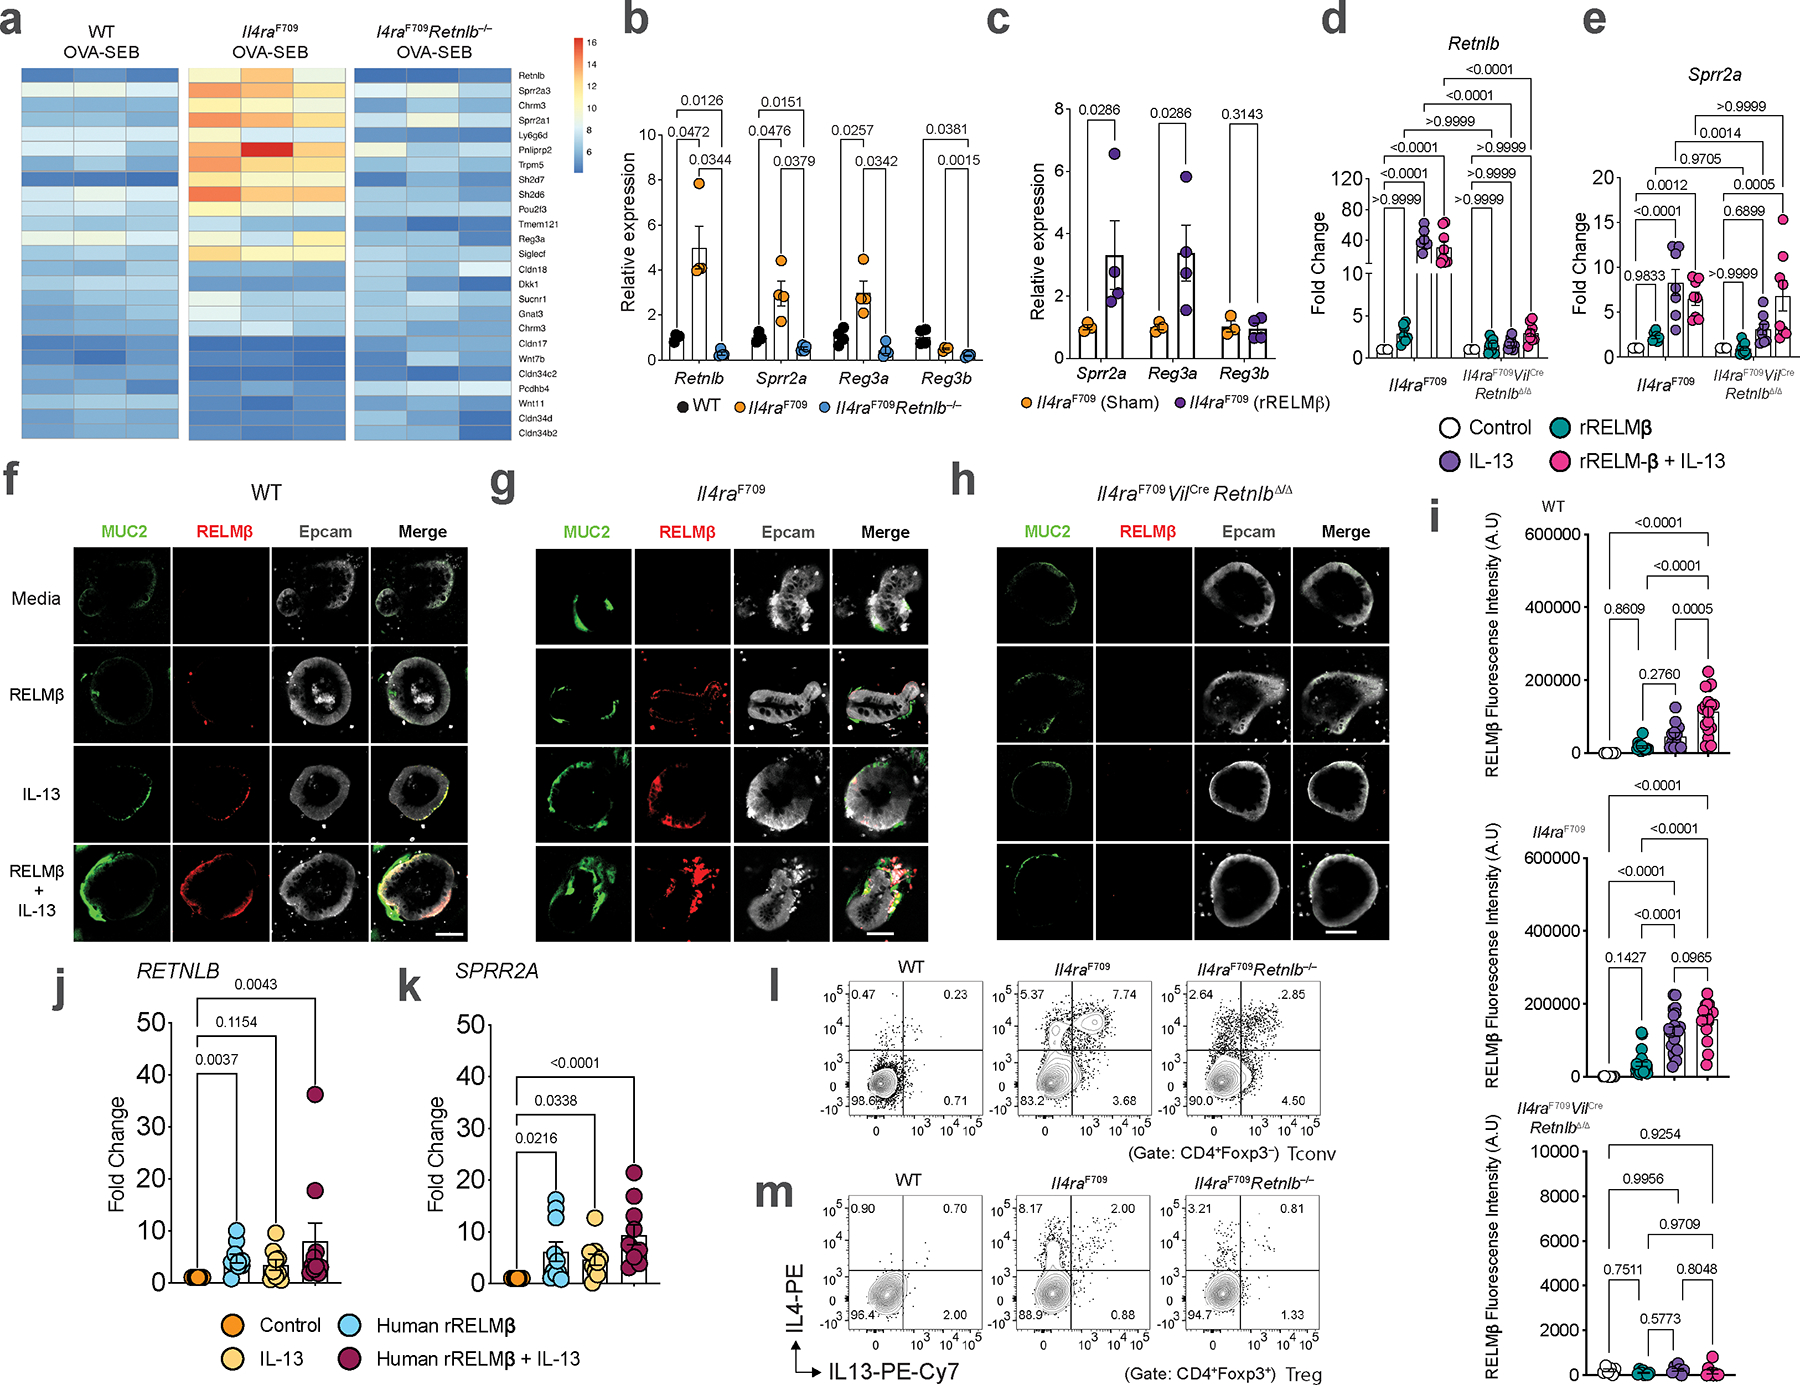
Type 2 immunity plays a critical role in effecting protective tissue responses to parasites and toxins6,7. Its dysregulation gives rise to pathologic responses including food allergy (FA) and anaphylaxis2,8,9. Notably, type 2 immune cytokines including IL-4 and IL-13 induce a number of gut epithelial derived proteins including RELMβ10,11. Using a mouse model of aberrant type 2 immunity due to gain of function signaling of the IL-4 receptor (Il4raF709)12,13, we found increased expression of Retnlb transcripts in Il4raF709 mice relative to wild-type (WT) mice (Fig. 1a). Il4raF709 mice orally sensitized with the food antigen chicken egg ovalbumin and the mucosal adjuvant staphylococcal enterotoxin B (OVA-SEB) demonstrate robust food allergic and anaphylactic responses13. Induction of FA following OVA-SEB oral sensitization markedly augmented both gut expression (Fig. 1a) and systemic protein levels (Fig. 1b) of RELMβ, compared to minimal differential regulation of its homologue RELMα14 in WT or Il4raF709 mice at baseline or after FA induction (Fig. 1a, b).
Fig. 1 |. Critical role of RELMβ in FA induction.
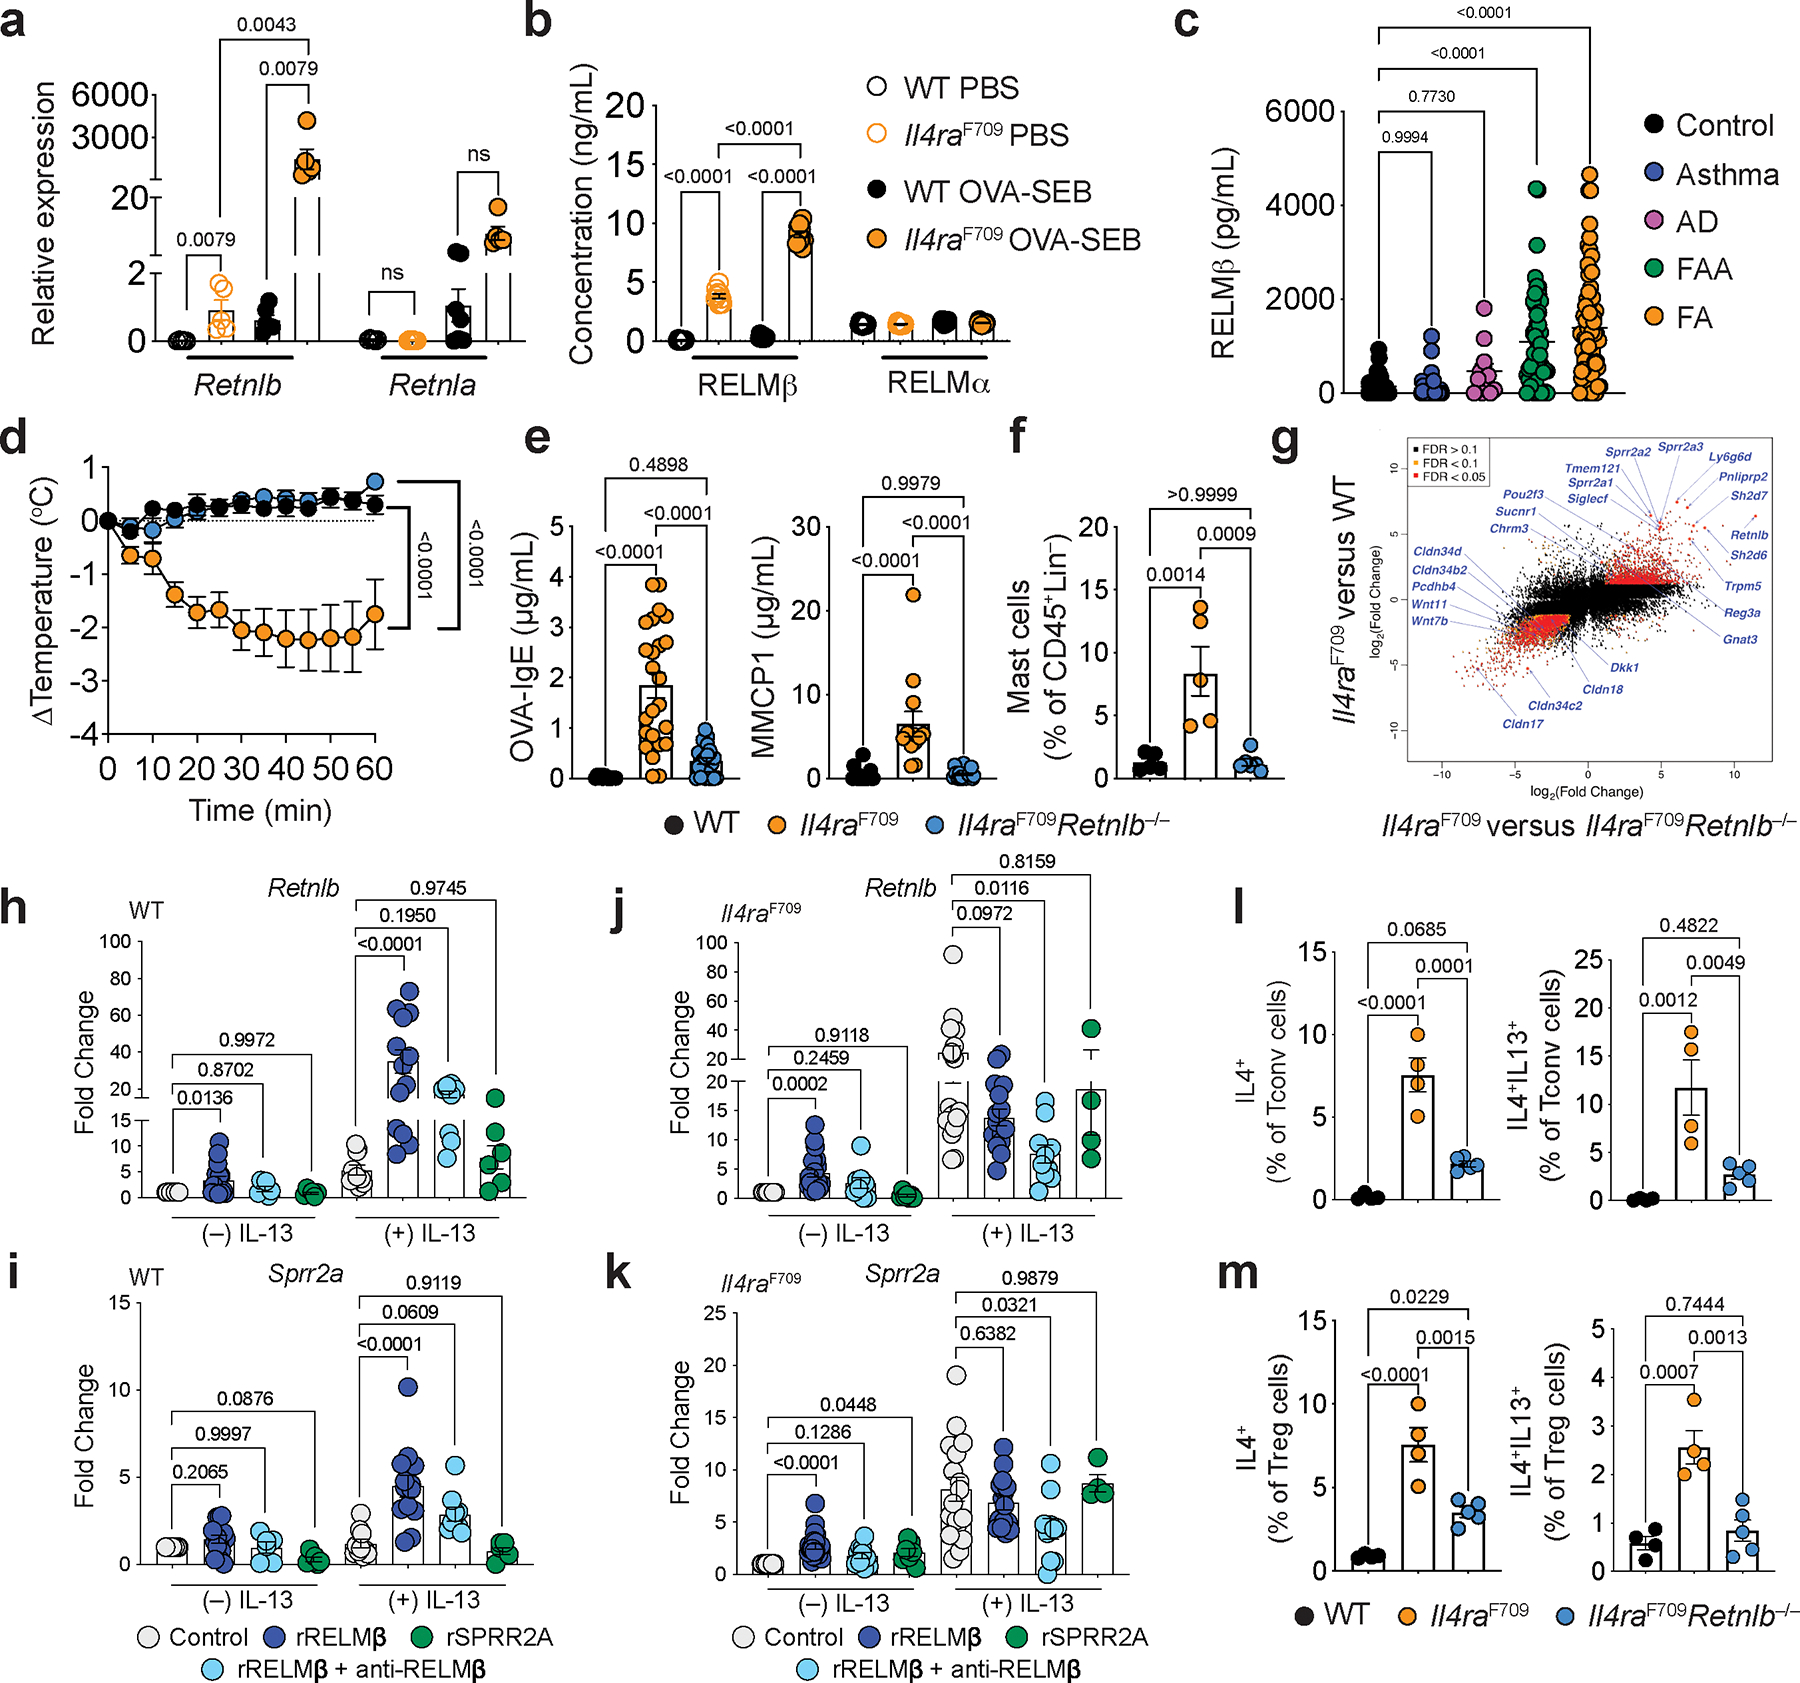
a, qPCR analysis of Retnlb and Retnla transcripts (relative expression over baseline) in jejunal tissues of WT and FA-prone Il4raF709 mice that were either sham sensitized (PBS) (n=5,5,6 and 6) or sensitized with OVA-SEB (n=6,5,7 and 5) then challenged with OVA. b, Serum levels of RELMβ in PBS or OVA-SEB sensitized WT (n=10) and Il4raF709 (n=10) mice, as determined by ELISA. c, levels of RELMβ in human serum from healthy control subjects (n=44) and, asthma (n=34), atopic dermatitis (AD) (n=12), food allergy and asthma (FAA) (n=52), or food allergy (FA) (n=67) patients. d, Core body temperature changes in WT, Il4raF709 and Il4raF709Retnlb−/− mice that were sensitized with OVA-SEB and then challenged with OVA (n=7,12 and 11). e, OVA-specific serum IgE concentrations (n=12,24 and 24). and serum MMCP1 concentrations post-challenge (n=19,13 and 19). f, Jejunal mast cells frequencies post-challenge (n=5,5 and 6). g, Log-log plot of SI epithelial cell RNA-seq analysis comparing Il4raF709 versus Il4raF709Retnlb−/− (X-axis) and Il4raF709 versus WT mice (Y-axis) (n=3/group). h, i, j, k, qPCR analysis of Retnlb and Sprr2a transcripts in intestinal organoids derived from WT (h,i) and Il4raF709 (j,k) mice that were treated with sham (media), recombinant RELMβ (rRELMβ), recombinant SPRR2A (rSPRR2A), or rRELMβ plus anti-RELMβ mAb without (WT:12,15, 6, 6; Il4raF709:15, 23, 9 and 10, 7) or with IL-13 (WT:10,13,9,6; Il4raF709:18,15,10,4). l, m, Flow cytometric frequency of Tconv cells (l) or Treg (m) IL-4+ and IL-13+ CD4+ T cell populations from SI-LPL of WT (n=4), Il4raF709 (n=4) and Il4raF709Retnlb−/− (n=5) mice. For a–m, data are mean ± s.e.m. Statistical analysis was performed using one-way ANOVA (a-c,e,f,h-m) with Šídák’s (a-b), Tukey’s (c,e,f,l,m), or Dunnett’s (h-k) post hoc tests, or repeat measure two-way ANOVA (d) with Tukey’s (d) post hoc test.
Having established that RELMβ is both locally and systemically aberrantly expressed in mouse models of FA, we analyzed the RELMβ concentrations in the sera of children with FA, either without or with concurrent asthma, compared to those with asthma, isolated atopic dermatitis (AD), or subjects with no known allergies or atopy. RELMβ was highly increased in most subjects with FA irrespective of their asthma status compared to subjects with asthma alone, AD or non-allergic controls (Fig. 1c; Supplemental Table 1).
We next sought to determine if RELMβ played a mechanistic role in the development of FA by deleting Retnlb in Il4raF709 mice. RELMβ deficiency completely abrogated anaphylaxis upon oral challenge (Fig. 1d), suppressed levels of serum OVA-specific IgE, mucosal mast cell protease 1 (MMCP1) (Fig. 1e), and inhibited expansion of small intestinal (SI) tissue mast cells (Fig. 1f). Furthermore, RELMβ regulated broader type 2 immune associated programs in SI epithelial cells. These included RELMβ-dependent increases in goblet cell-associated anti-microbial gene transcripts such as Sprr2a1/2/3 and Reg3a11, Tuft cell-associated gene transcripts (Trpm5, Pou2f3, Sucnr1 and Gnat3)15–19, and decreased expression of transcripts encoding several tight junction-associated Claudins (Fig. 1g; Extended Data Fig. 1a, b). Treatment of naïve Il4raF709 mice with recombinant RELMβ in vivo induced expression of Sprr2a, Reg3a and Reg3b (Extended Data Fig. 1c). To determine the direct effect of RELMβ on intestinal epithelial type 2 immune programs we treated WT or Il4raF709-derived murine gut epithelial organoids with recombinant RELMβ. RELMβ regulated the expression of both Retnlb and Sprr2a (Fig. 1h–k; Extended Data Fig. 1d, e) and RELMβ protein levels (Extended Data Fig. 1f–i) by gut epithelial cells in synergy with both IL-13 and IL-4 receptor gain of function signaling (Il4raF709) (Fig. 1h–k; Extended Data Fig. 1d, e). This synergy was dependent on endogenous RELMβ as it was inhibited by anti-RELMβ antibody treatment or, in the case of Sprr2a, by deletion of Retnlb (Fig. 1h–k; Extended Data Fig. 1d, e–i). In contrast, treatment with SPRR2A, which we demonstrate as regulated by RELMβ did not induce either Retnlb or Sprr2a expression (Fig. 1h–k; Extended Data Fig. 1d, e). In a human intestinal organoid model, RELMβ induced RETNLB and SPRR2A transcripts both alone and in combination with IL-13 (Extended Data Fig. 1j, k). Together, our findings demonstrate that RELMβ is a master regulator of type 2 epithelial programs acting through both autoregulatory and IL-13-dependent feedback loops.
To determine if RELMβ proximally regulated type 2 gut T cell immune responses we measured the frequency of IL-4 and IL-13 expressing CD4+ T cell populations within small intestinal lamina propria lymphocytes (SI-LPL) and found both T conventional (Tconv) and T regulatory (Treg) IL-4+ and IL-13+ cell populations in the LPL were decreased in Il4raF709Retnlb−/− mice compared with Il4raF709 mice (Fig. 1l, m; Extended Data Fig. 1l, 1m). RELMβ deficiency suppressed the frequencies of IL-4 and the IL-4 and IL-13 co-expressing anaphylaxis-associated T follicular helper cell 13 (Tfh13)20 in the mesenteric lymph nodes (MLN) as well as the production of anaphylaxis-promoting high affinity anti-OVA IgE antibodies (Extended Data Fig. 2a–f). Together these findings demonstrate that RELMβ orchestrates pathological local and systemic type 2 effector immune responses.
Having established a critical role of RELMβ in the development of FA in Il4raF709 mice, we next sought to determine a generalized role of RELMβ in FA in a genotype- and adjuvant-independent manner using an epicutaneous sensitization model employing WT BALB/c mice, which mimics FA associated with eczema21. In this model, anaphylaxis following epicutaneous OVA sensitization and oral challenge was abrogated in RELMβ-deficient mice compared with WT mice (Extended Data Fig. 3a–d). Together our findings demonstrate a requirement for RELMβ in the development of FA in mice across different genetic backgrounds and routes of sensitization.
Gut epithelial RELMβ suppresses FA-protective RORγt+ Treg cells.
RORγt+ Treg cells play a central role in immune regulation, including in maintenance of tolerance to food allergens5,22–26. Il4raF709 mice have diminished populations of RORγt+ Treg in SI-LPL relative to WT mice, which underlies the breakdown of oral tolerance in these mice23. Deletion of Retnlb reversed the RORγt+ Treg depletion (Fig. 2a, b). Importantly, deletion of Rorc, encoding RORγt, in Treg cells of Il4raF709Retnlb−/− mice abrogated the protection against local and systemic FA provided by RELMβ deficiency (Fig. 2c–f). Together, our results demonstrate RELMβ as a central regulator of both type 2 mediators and effector responses in FA through suppression of tolerogenic and protective RORγt+ Treg cells.
Fig. 2 |. RELMβ suppresses FA-protective RORγt+ Treg cells.
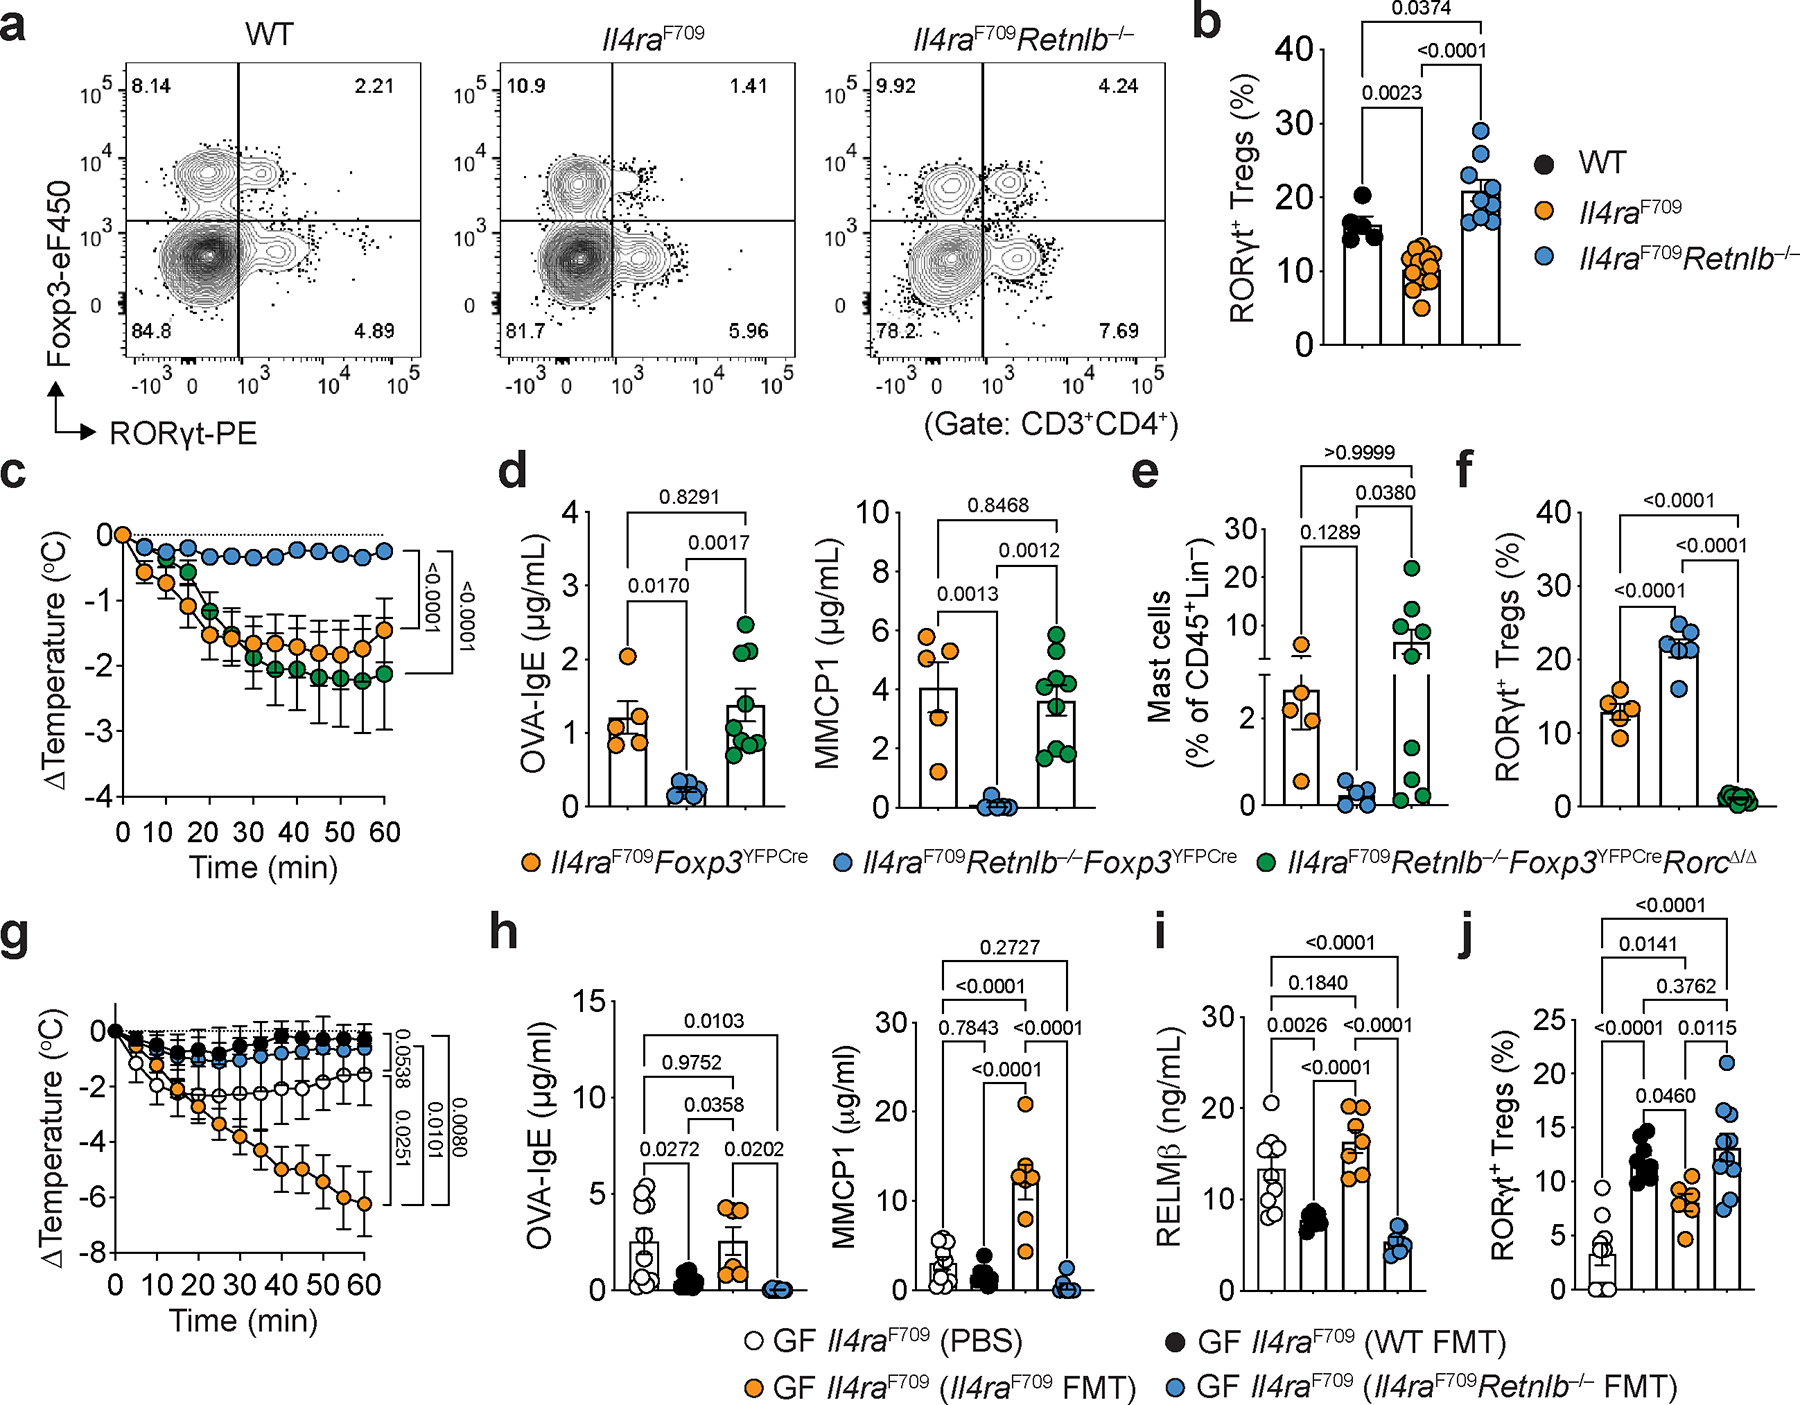
a, b, Flow cytometric analysis of SI-LPL RORγt+ Treg cells in OVA-SEB sensitized WT, Il4raF709 and Il4raF709Retnlb−/− mice (a) and frequencies of SI-LPL CD4+Foxp3+RORγt+ Treg cells in each respective mouse strain (n=5,14 and 9) (b). c, Core body temperature changes in Il4raF709Foxp3YFPCre (n=18), Il4raF709Retnlb−/−Foxp3YFPCre (n=17), and Il4raF709Retnlb−/−Foxp3YFPCreRorcΔ/Δ (n=13), that were sensitized with OVA-SEB and then challenged with OVA. d, OVA-specific serum IgE concentrations (n=5, 6 and 9) and serum MMCP1 concentrations (n=5, 5 and 9). e, Jejunal mast cells frequencies (n=5, 5 and 9). f, SI-LPL RORγt+ Treg cell frequencies (n=5,6 and 9). g, Core body temperature changes in germ-free Il4raF709 that received shame (PBS) (n=10), fecal microbiome transplant (FMT) from WT mice (n=4), Il4raF709 mice (n=7), or Il4raF709Retnlb−/− (n=7) mice then sensitized with OVA-SEB and challenged with OVA. h, i, Serum OVA-specific IgE concentrations, (h) (n=10,7,6 and 7), serum MMCP1 concentrations, (h) (n=10,7,7 and 7) and serum RELMβ concentrations, (i) (n=10,7,7 and 7). j, Frequencies of SI-LPL RORγt+ Treg cells in each respective mouse strain (n=10,9,6 and 10). For b–j, data are mean ± s.e.m. Statistical analysis was performed using one-way ANOVA (b,d,e,f,h,i,j) with Tukey’s (b,d,e,f,h,i,j) post hoc test, or repeat measure two-way ANOVA (c,g) with Tukey’s (c,g) post hoc test.
RELMβ is expressed by a number of cell types across organs and tissue, including gut epithelia, in particular goblet cells3,4. To determine the role of intestinal epithelium-derived RELMβ in driving FA, we created mice deficient for RELMβ in intestinal epithelial cells using a floxed Retnlb allele (Retnlbfl) crossed to Cre recombinase driven by the villin promoter on an Il4raF709 background, confirmed by loss of gut epithelial Retnlb transcripts and suppression of the elevated serum RELMβ levels in Il4raF709 mice both at baseline and following allergic sensitization (Extended Data Fig. 4a, b). Deletion of either single (Il4raF709VilCreRetnlbΔ/+) or both alleles of Retnlb (Il4raF709VilCreRetnlbΔ/Δ) in gut epithelia protected mice from anaphylaxis (Extended Data Fig. 4c) with decreased serum OVA-specific IgE and MMCP1 levels and reduced gut epithelial Sprr2a1 and Reg3a transcript expression (Extended Data Fig. 4d, e). Importantly, Retnlb deletion in the gut epithelium reversed the suppression of tolerogenic Helios−RORγt+ Treg cells and reciprocally decreased pathogenic Helios+GATA3+ Treg cell frequencies in SI-LPL and MLN (Extended Data Fig. 4f, g), demonstrating that gut epithelial cell derived RELMβ is required to break tolerance to food antigens.
We next drove deletion of the RELMβ gene specifically in gut secretory cells creating a Math1 (Atoh1) gene-driven Cre recombinase crossed to Retnlbfl/fl mice both on a Il4raF709 background. Mice deficient for RELMβ in gut secretory lineages were protected from anaphylaxis (Extended Data Fig. 4h) with decreased serum OVA-specific IgE and MMCP1 levels (Extended Data Fig. 4i). The frequencies of tolerogenic Helios−RORγt+ Treg cells in SI-LPL were increased while those of pathogenic Helios+GATA3+ Treg cells were decreased (Extended Data Fig. 4j,k). OVA325–335-specific I-Ab tetramer staining revealed enrichment of OVA specificity in MLN and SI-LP RORγt+ Treg cells of sensitized Il4raF709Math1CreRetnlbΔ/Δ compared to Il4raF709Math1Cre mice. These results suggested that protection mediated by loss of RELMβ is confered by food allergen-specific RORγt+ Treg cells (Extended Data Fig. 5a–f). Altogether these results confirmed that gut secretory cell-derived RELMβ is required to break tolerance to food antigens.
RELMβ deficiency structures a tolerogenic gut microbiome.
RELMβ is known for its anti-microbial function10. Given that RELMβ is secreted into the gut lumen by goblet cells and our demonstration of the role of gut epithelial secretory cell-derived RELMβ in driving FA (Extended Data Figures 4 and 5), we hypothesized that RELMβ breaks food antigen tolerance via restructuring the gut microbiome. To test this, we performed fecal microbiome transplantation (FMT) from otherwise unsensitized adult WT, Il4raF709 and Il4raF709Retnlb−/− donors to germ-free Il4raF709 mice. Whereas FMT from Il4raF709 mice failed to protect germ-free Il4raF709 mice from FA, FMT from Il4raF709Retnlb−/− mice protected against FA (Fig. 2g). Il4raF709Retnlb−/− FMT suppressed the OVA-specific IgE response and mast cell release (serum MMCP1) while concomitantly suppressing dysregulated RELMβ levels and increasing RORγt+ SI-LPL Treg cells relative to FMT from conventional Il4raF709 mice (Fig. 2h–j). These results indicated that protection against FA provided by RELMβ deficiency was due to compositional and functional differences of the gut microbiome in the development of FA.
We next analyzed the gut microbiome of OVA-sensitized Il4raF709 and Il4raF709Retnlb−/− mice (both on BALB/c background). Il4raF709 mice had decreased abundance of Lactobacilli and Alistipes compared to similarly treated Il4raF709Retnlb−/− mice (Fig. 3a), consistent with a previous study implicating RELMβ in dysbiosis in the setting of Muc2 deficiency-associated colitis27. Deletion of RELMβ in the intestinal epithelium protected Il4raF709VilCreRetnlbΔ/Δ mice (on a C57BL/6 background) against FA and restored gut Lactobacillus levels compared to RELMβ-sufficient and FA-susceptible Il4raF709Retnlbfl/fl litter and cage mates (Fig. 3b). This restoration of Lactobacilli was similarly observed in an OVA allergen epicutaneous sensitization model (Extended Data Fig. 3e). Together these data suggest that RELMβ restructures the composition of the gut microbiome to a pro-food allergenic state.
Fig. 3 |. RELMβ deficiency structures a tolerogenic gut microbiome.
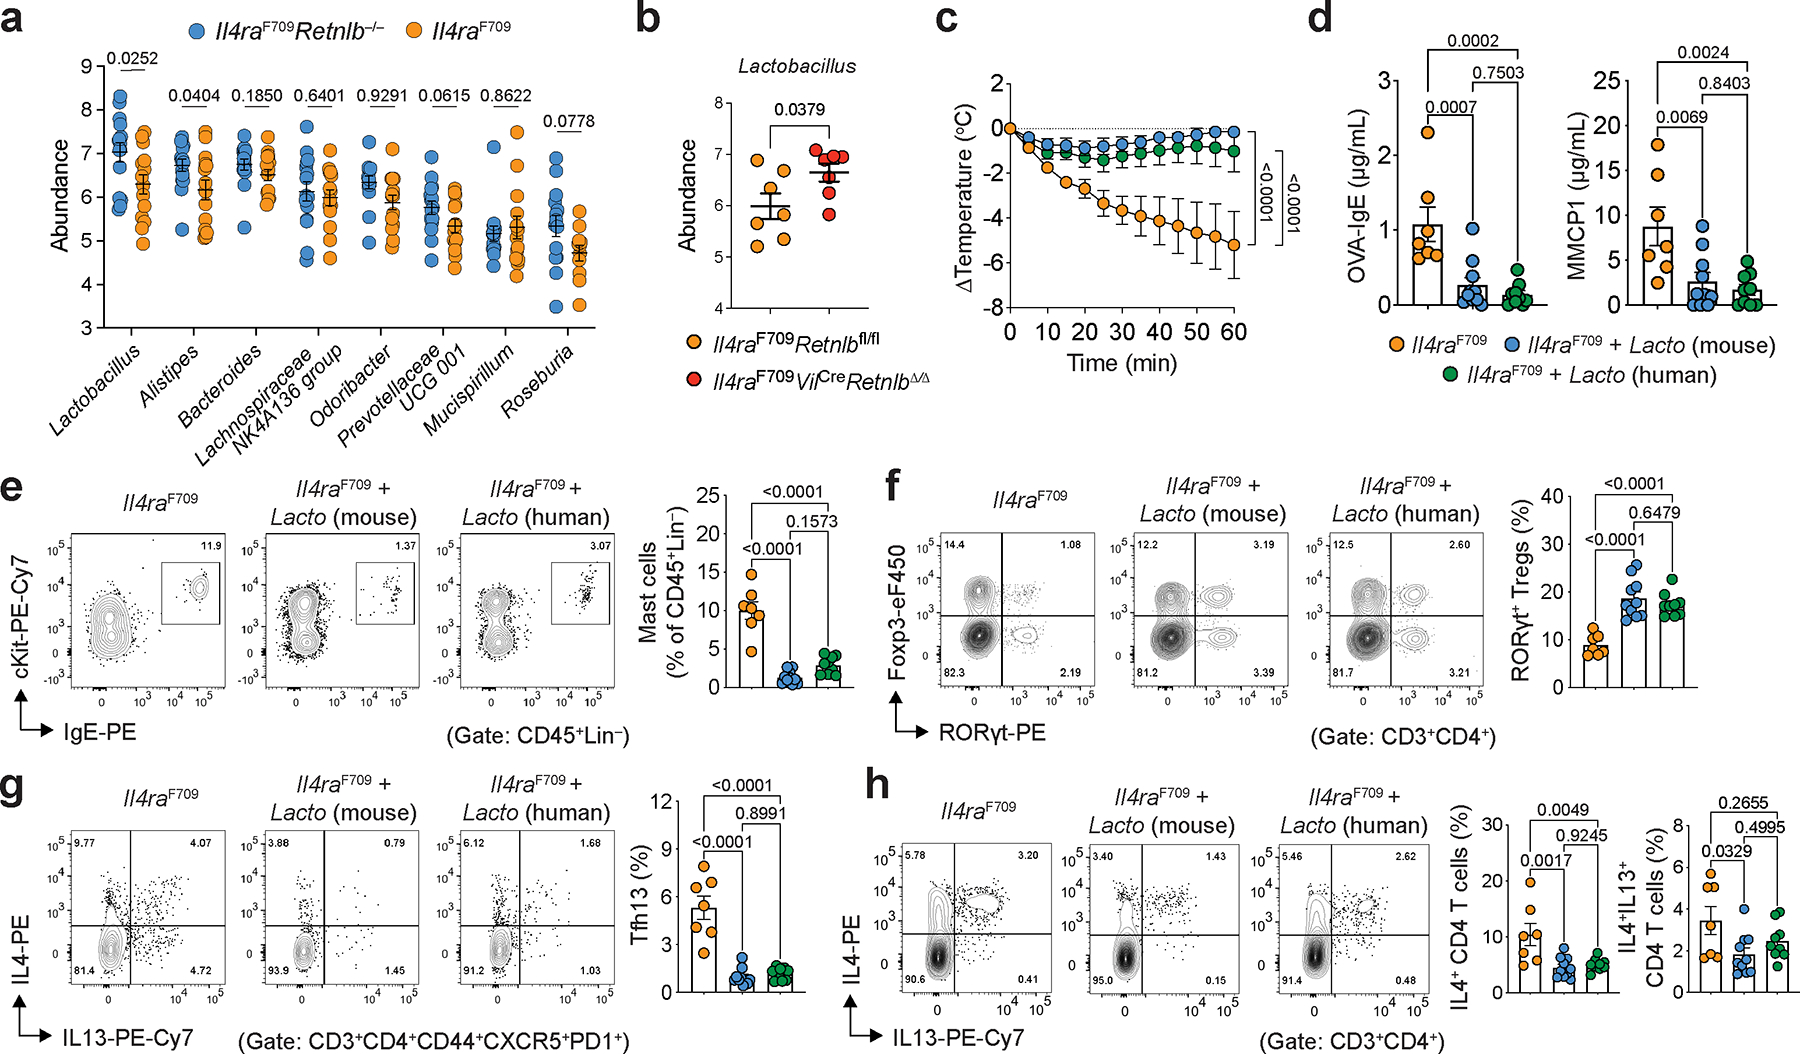
a, Eight most abundant gut bacterial genera enriched in OVA-SEB sensitized Il4raF709Retnlb−/− (n=15) versus Il4raF709 (n=14) mice (BALB/c background). b, Lactobacillus genus abundance in OVA-SEB sensitized and challenged Il4raF709Retnlbfl/fl (n=7) and Il4raF709VilCreRetnlbΔ/Δ (n=7) mice (C57BL/6 background). c, Protection of Il4raF709 mice from FA upon bacteriotherapy with mouse Lactobacillus species found enriched in Il4raF709Retnlb−/− mice (L. reuteri and L. murinus) or human Lactobacillus species.(L. gasseri, L.reuteri and L. rhamnosus). The mice were sensitized weekly with OVA-SEB without or with the respective bacteriotherapy, then challenged orally with OVA (n=7, 10 and 9). d, OVA-specific serum IgE concentrations and serum MMCP1 concentrations in bacteriotherapy- or sham-treated mice (n=7, 10 and 9). e, f, Flow cytometric analysis and cell frequencies of C-kit+IgE+ small intestinal mast cells (n=7, 10 and 9) (e) and small intestinal RORγt+ Treg cells (n=7, 10 and 9) (f) in mice shown in (c). g, h, Flow cytometric analysis and cell frequencies of small intestinal Tfh13 cells (g) and IL-4+ and IL-4+IL-13+ CD4+ small intestinal T cells (h) (n=7, 10 and 9). For a–h, data are mean ± s.e.m. Statistical analysis was performed using unpaired two-tailed t-tests (a,b), one-way ANOVA (d–h) with Tukey’s (d–h) post hoc test, or repeat measure two-way ANOVA (c) with Tukey’s (c) post hoc test.
We next sought to determine the mechanism by which RELMβ depletes Lactobacillus in vivo. RELMβ did not demonstrate direct anti-microbial against Lactobacilli in vitro (Extended Data Fig. 5g). Given our demonstration of RELMβ as a master regulator upstream of Sprr2a (Fig. 1h–k; Extended Data Fig. 1d, e) and the anti-microbial function of SPRR2A against Gram-positive bacteria11, we tested whether RELMβ-regulated SPRR2A inhibited Lactobacillus. We found a potent anti-microbial effect of SPPR2A against Lactobacillus (Extended Data Fig. 5g). We next generated Il4raF709 on a SPRR2A-deficient backgroud. Compared to Il4raF709 mice, Il4raF709Sprr2a−/− mice were protected against FA with decreased serum OVA-specific IgE and MMCP1 levels, increased levels of Lactobacilli and increased frequencies of Helios−RORγt+ Treg cells (Extended Data Fig. 5h–k).
Indole derivatives maintain food antigen tolerance
As depletion of gut Lactobacilli correlated with breaking of food tolerance by RELMβ, we sought to definitively determine a role for gut Lactobacilli in maintenance of food tolerance. To begin, we isolated Lactobacilli from the stool of Il4raF709Retnlb−/− mice (including L. murinus and L. reuteri species). We next assessed the capacity of these mouse Lactobacilli to protect Il4raF709 mice from the development of FA. Il4raF709 mice fed a cocktail of mouse Lactobacilli were protected against anaphylaxis and demonstrated suppression of mast cell release and serum OVA-specific IgE responses (Fig. 3c–d). Similar to the functional effects of the endogenous murine gut Lactobacilli, a cocktail of three related human Lactobacillus isolates (L. gasseri, L. reuteri and L. rhamnosus) protected against the development of FA and demonstrated increased frequencies of SI-LPL RORγt+ Treg cells together with decreased frequencies of Tfh13 cells (Fig. 3e–h). Together, these data demonstrate that gut Lactobacilli both increase gut RORγt+ Treg and protect from FA.
We next sought to determine the mechanistic basis for how gut Lactobacilli protect from RELMβ-driven FA. Gut bacteria including Lactobacilli are known to catabolize tryptophan into several indole derivatives (Extended Data Fig. 6a) with potential immunoregulatory functions28,29. Targeted mass spectrometric detection revealed decreased levels of several key tryptophan-derived indole metabolites in fecal samples of OVA-SEB sensitized FA-prone Il4raF709 mice, which were restored in FA-protected Il4raF709Retnlb−/−mice, including indole, indole-3-carboxaldehyde (I3A), indole-3-acetic acid (IAA), indole-3-ethanol (I3E), indole-lactic acid (ILA) and tryptamine (Fig. 4a, Extended Data Fig. 6b). Indole derivatives were also regulated by RELMβ in the OVA allergen epicutaneous sensitization model (Extended Data Fig. 3f). In a pediatric human cohort, we find decreased levels of indole derivatives in the stool samples of FA patients compared with those of healthy controls (Fig. 4b, Extended Data Fig. 6c). Restricting tryptophan, the nutrient source of bacterial indole metabolites, in the diet of Il4raF709Retnlb−/− mice abrogated the protection against FA provided by RELMβ deficiency with increased mast cell release and serum OVA-specific IgE responses and decreased frequencies of SI-LPL RORγt+ Treg cells (Fig. 4c–f). In contrast, administration of IAA but not vehicle protected Il4raF709 mice from FA in association with increased levels of RORγt+ Treg cells (Extended Fig. 6d–f).
Fig. 4 |. Gut microbiome-derived indole derivatives induce FA protective Treg cells via AhR.
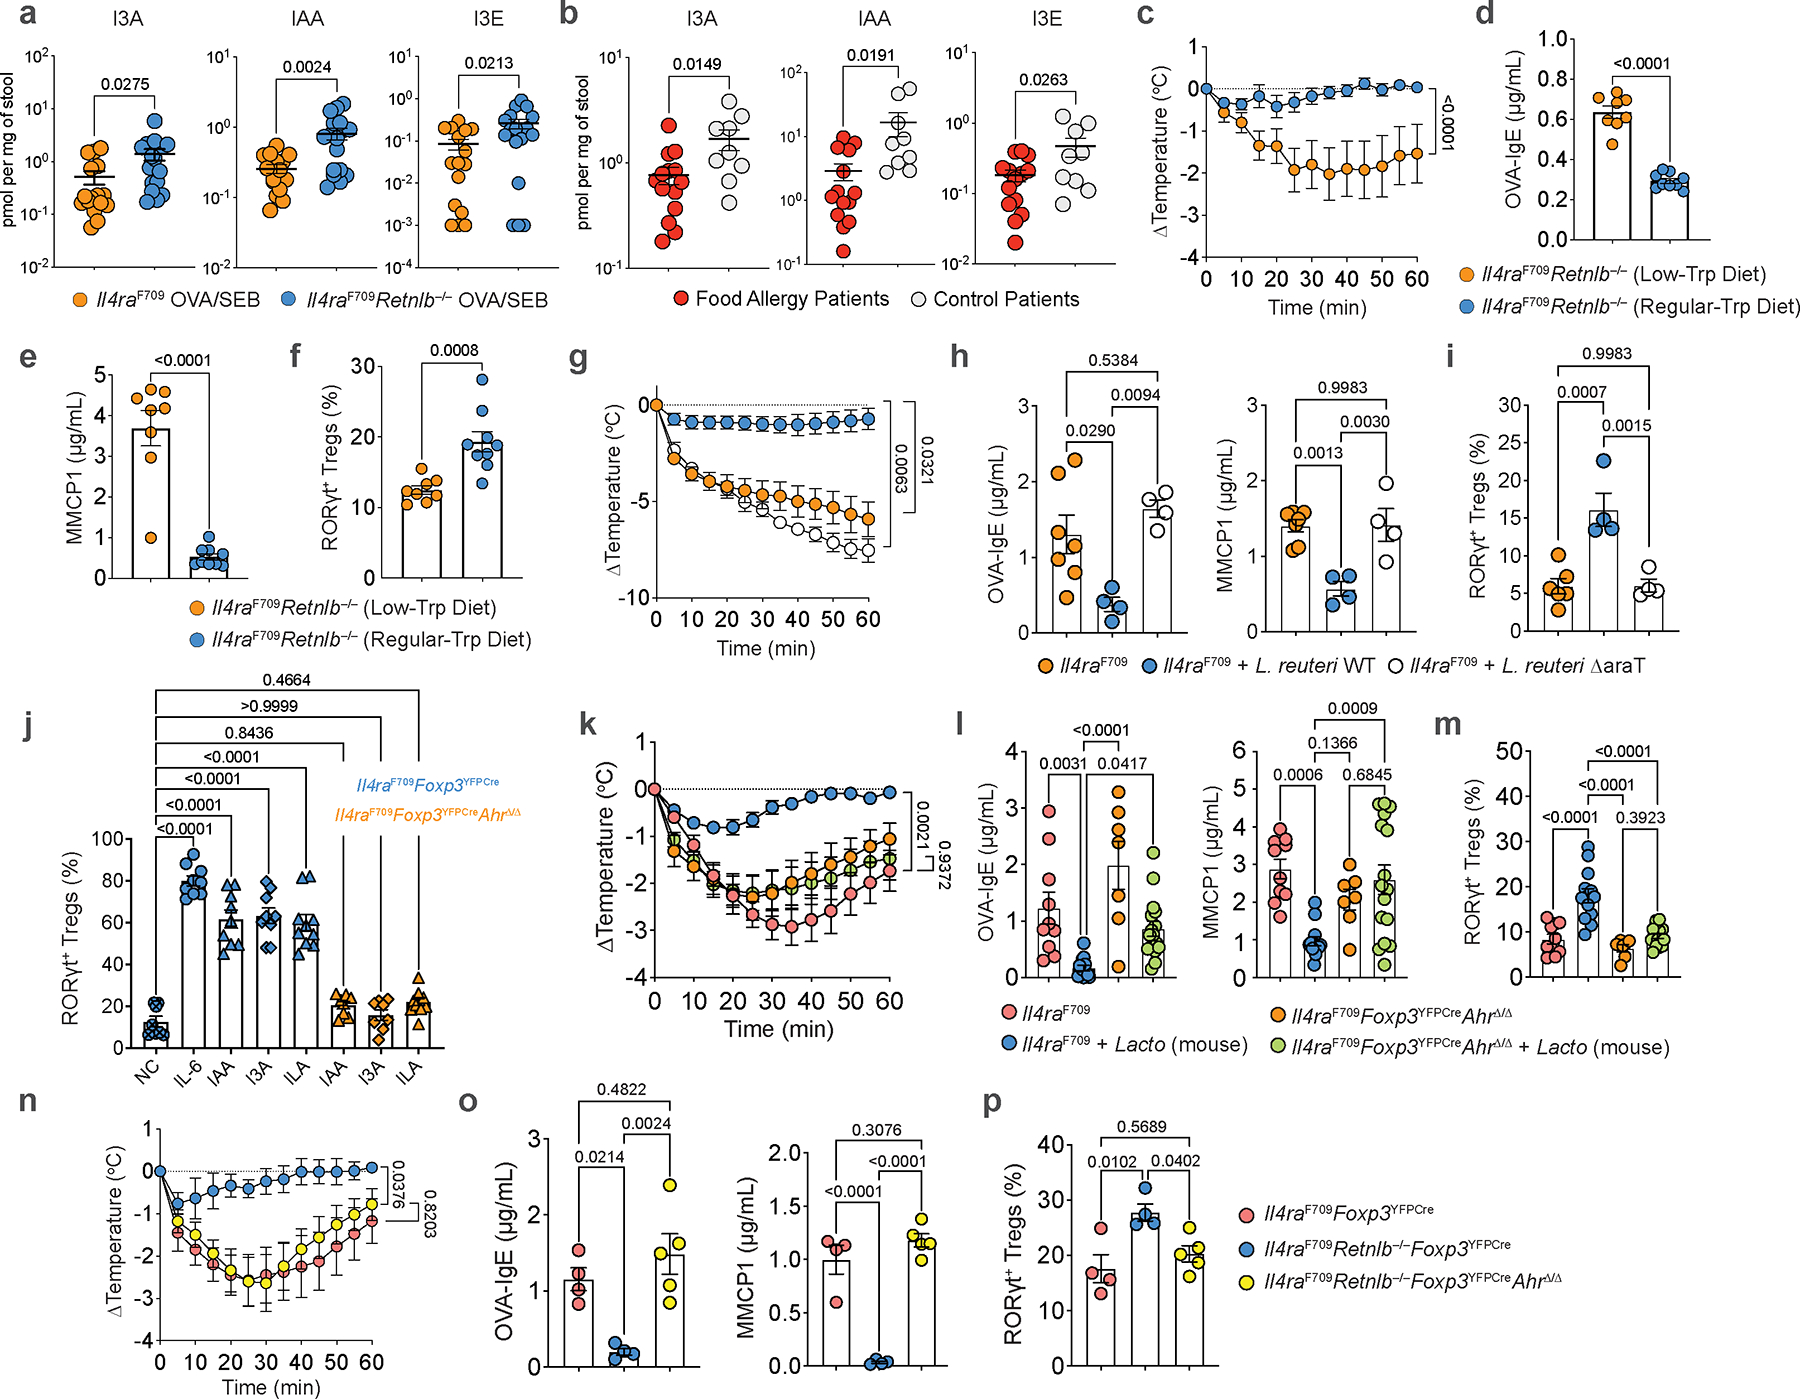
a, Quantitation of indole-3-carboxaldehyde (I3A), indole-3-acetic acid (IAA), indole-3-ethanol (I3E) acid in feces of OVA-SEB sensitized Il4raF709 (n=16, 15 and 16) vs. OVA-SEB sensitized Il4raF709Retnlb−/− (n=17, 17 and 17) mice. b, Quantitation of indole-3-carboxaldehyde (I3A), indole-3-acetic acid (IAA), indole-3-ethanol (I3E) acid in the stools of active FA patients (n=14) vs. control subjects (n=9). c, Temperature changes in Il4raF709Retnlb−/− mice fed a tryptophan-regular (n=9) or low diet (n=8), then sensitized with OVA-SEB and challenged with OVA. d, e, f, Serum OVA-specific IgE (n=9 and 8) (d) and MMCP1 concentrations (n=9 and 8) (e) and SI-LPL RORγt+ Treg cell frequencies (n=9 and 8) (f). g, Temperature changes in sham- (n=7), wild-type L. reuteri 100–23-(n=9), or L. reuteri 100–23 ΔaraT-treated Il4raF709(n=4) treated mice. h, i, Serum OVA-specific IgE (h) and MMCP1 concentrations (h) (n=7,4 and 4), and SI-LPL RORγt+ Treg cell frequencies (i) (n=6,4 and 4). j, Frequencies of RORγt+ Treg cells differentiated from naïve Il4raF709Foxp3YFPCre or Il4raF709Foxp3YFPCreAhRΔ/Δ T cells treated with anti-CD3, anti-CD28, IL-2, TGF-β either alone [negative control (NC) (n=8)], or together with IL-6 (n=9), or with IAA (n=9 and 8), I3A (n=9 and 10), and ILA (n=10 and 10). k, Temperature changes in sham-(n=10) or mouse Lactobacillus-treated Il4raF709 mice (n=13), versus sham-(n=7) or mouse Lactobacillus-treated Il4raF709Foxp3YFPCreAhRΔ/Δ mice (n=16), all sensitized with OVA-SEB and challenged with OVA. l, m, Serum OVA-specific IgE (n=10, 13, 7 and 16) and MMCP1 concentrations (n=10, 13, 7 and 16) (l), and SI-LPL RORγt+ Treg cell frequencies (n=10,13,7 and 15) (m). n, Temperature changes in OVA-SEB sensitized and OVA-challenged Il4raF709Foxp3YFPCre (n=4), Il4raF709Foxp3YFPCreRetnlb−/− (n=4), or Il4raF709Foxp3YFPCreAhRΔ/ΔRetnlb−/− (n=5) mice. o, p, Serum OVA-specific IgE (n=4, 4 and 5) and MMCP1 concentrations (n=4, 4 and 5) (o), and SI-LPL RORγt+ Treg cell frequencies (n=4, 4 and 5) (p). For a-p, data are mean ± s.e.m. Statistical analysis was performed using unpaired two-tailed t-tests (a,b,d-f), one-way ANOVA (h-j,l,m,o,p) with Šídák’s (j) or Tukey’s post hoc test (h,i,l,m,o,p), or repeat measure two-way ANOVA (c,g,k,n) with Tukey’s (c,g,k,n) post hoc test.
To definitively determine the role of gut microbiome-derived indole derivatives in protection from FA, we generated a gut L. reuteri isolate with deletion of the araT gene, responsible for generating IAA and I3A from tryptophan (Extended Data Fig. 7a, b;28). Deletion of this gene did not impact the in vivo fitness of L. reuteri (Extended Data Fig. 7c, d). Compared to protection from FA after colonization with wild-type L. reuteri, Il4raF709 mice colonized with L. reuteri ΔaraT demonstrated decreased levels of fecal IAA despite comparable levels of L. reuteri WT and ΔaraT colonization (Extended Data Fig. 7d, e) and were not protected from FA demonstrating robust anaphylaxis following food antigen challenge (Fig. 4g). Mice treated with L. reuteri ΔaraT also had hightened levels of serum OVA-IgE and MMCP1 (Fig. 4g, h). Together, these data identified suppression of tryptophan-derived gut microbiome indole metabolites as a mechanism by which RELMβ promotes FA.
Given our observation of decreased gut levels of FA protective immunoregulatory indole metabolites in patients with FA compared to healthy controls (Fig. 4b, Extended Data Fig. 6d), we sought to determine if differential indole metabolite levels correlated with differences in the gut microbiome. By profiling the gut microbiome of human control subjects (with low serum RELMβ) versus patients with active FA (and elevated levels of RELMβ), we found depletion of Alistipes and Parabacteroides, members of the predominant Bacteroidales order of Gram-negative bacteria in the human gut30, in the latter group (Extended Fig. 8a). Notably, and as the Lactobacilli, Alistipes were also depleted in FA susceptible Il4raF709 mice compared to FA-protected RELMβ-deficient Il4raF709 mice (Fig. 3a). This suggested that similar to Lactobacillus and Alistipes in the mouse, the human gut Alistipes are regulated by RELMβ (Extended Data Fig. 8b). We found that a model member of the human gut Alistipes, Alistipes shahii, was killed by SPRR2A and, unique from Lactobacillus, also inhibited directly by RELMβ (although to a lesser extent then SPRR2A) (Extended Data Fig. 8c,d).
Having demonstrated that RELMβ regulates Alistipes in our mouse model of FA, that Alistipes is directly inhibited by the RELMβ-regulated SPRR2A, and that it is reduced in human FA in correlation with increased RELMβ and decreased indole metabolites, we asked whether Alistipes, similar to Lactobacillus, may operate in the Goblet cell-RELMβ-gut microbiome-indole axis in FA. Examining 166 genomes of the human gut Alistipes, a homolog of tnaA, necessary for generating indole from tryptophan, was found in 72% of the genomes. In species commonly associated with human health and diseases such as A. finelgodi, A. putredinis, A. onderdonkii and A. shahii31, the tnaA prevalence ranges from 94% to 100% (Supplementary Table 3), consistent with a previous report demonstrating tryptophanse abundance in human gut Bacteroidales32. We found significant production of indole via tryptophan catabolism by Alistipes shahii (Extended Data Fig. 8c). As Alistipes are not amenable to genetic manipulation precluding our ability to test the role of Alistipes-derived indole in protection from FA, we identified an indole-producing member of the human gut Bacteroidales, Bacteroides ovatus, which contains tnaA and produces indole (Extended Data Fig. 8c). To determine if Bacteroidales-derived indole induces protection from FA, we constructed a clean, non-polar deletion of tnaA in Bacteroides ovatus (B. ovatus ΔtnaA) and confirmed defective indole production from this mutant compared to WT B. ovatus (Extended Data Fig. 8c). Il4raF709 mice were colonized with either B. ovatus WT or ΔtnaA. Mice colonized with B. ovatus ΔtnaA failed to rescue FA in Il4raF709 mice compared with mice treated with B. ovatus WT, despite similar colonization (Extended Data Fig. 8e–k). Notably, B. ovatus, similar to Alistipes and Lactobacillus, is inhibited by RELMβ-dependent SPRR2A (Extended Data Fig. 8d). Together, these results demonstrate that in addition to Lactobacillus, other gut microbiome members including Bacteroidales species are controlled by gut epithelial RELMβ, correlate with protection from FA in humans, and are sufficient to mediate oral tolerance to food antigens in mouse models of FA via production of indole or indole derivatives.
Gut microbiome-derived indole derivatives induce FA protective Treg cells.
ΔaraT L. reuteri-colonized Il4raF709 mice were unable to drive expansion of tolerogenic RORγt+ Treg cells in FA compared to L. reuteri WT (Fig. 4i). This suggested that FA-protective indole metabolites derived from the microbiome might directly influence RORγt+ Treg generation. To begin, we tested the ability of microbiome-derived indole derivatives such as IAA, I3A, and ILA to drive RORγt+ Treg differentiation from naïve T cells of Il4raF709 mice. Specific indole derivatives induced robust differentiation of RORγt+ Treg cells substituting for the role of IL-6 (Fig. 4j, Extended Data Fig. 7f). We next sought to determine the mechanism by which microbiome-derived indole derivatives drive RORγt+ Treg differentiation. The chemosensory aryl hydrocarbon receptor (AhR) has been shown to be expressed in Treg cells and AhR-activating xenobiotics have been shown to drive Treg cell expansion33–35. IAA, I3A, and ILA are known agonists of AhR suggesting that microbiome metabolism of dietary tryptophan to indole derivatives in the gut lumen could physiologically drive oral tolerance through Treg differentiation. To formally test how microbiome-derived indole derivatives impact RORγt+ Treg cells, we constructed mice with a floxed Ahr allele crossed to Il4raF709Foxp3YFPCre mice. Deletion of AhR in Treg cells ablated the ability of microbiome-derived indole derivatives to induce RORγt+ Treg cell differentiation (Fig. 4j). We next sought to test the role of microbiome-derived indole derivatives on tolerance to food antigens. In Il4raF709Foxp3YFPCreAhrΔ/Δ mice, compared to Il4raF709 mice in which introduction of gut Lactobacilli rescues oral tolerance, ablation of AhR in Treg cells on the FA-prone Il4raF709 background abrogated Lactobacillus-mediated protection against FA, demonstrating robust anaphylaxis, increased OVA-IgE and serum MMCP1 levels and importantly an inability to expand tolerogenic RORγt+ Treg cells (Fig. 4k–m). Furthermore, Treg cell-specific deletion of Ahr abrogated the protection against FA provided by RELMβ deficiency in Il4raF709Retnlb−/− mice, giving rise to robust anaphylaxis and reduced RORγt+ Treg cells in sensitized and challenged Il4raF709Retnlb−/−Foxp3YFPCreAhrΔ/Δ mice (Fig. 4n–p). Overall, our data indicates that the goblet cell secreted factor RELMβ restrains tolerance to food antigens by restricting colonization of indole metabolite-producing members of the gut microbiome, which drive tolerogenic regulatory T cells via the chemoreceptor AhR to mediate oral tolerance and prevent FA.
Early life RELMβ dysregulation promotes adulthood FA
FA is particularly common in infancy and early childhood36, with evidence suggesting that both genetic factors37 as well as early life microbial exposures38,39 play a role in predisposition to FA. To determine the role of RELMβ in oral tolerance in early life we first examined whether protection from FA by RELMβ deficiency could be transmitted vertically. In Il4raF709Retnlb−/+ × Il4raF709Retnlb−/+ matings, Retnlb-sufficient Il4raF709 offspring mice were protected from FA to the same extent as their Il4raF709Retnlb−/− littermates in association with enrichment of gut Lactobacilli, indicating that FA outcomes may be influenced in a RELMβ-regulated, vertically-transmitted manner (Extended Data Fig. 9a–f).
We next examined the impact of RELMβ on oral tolerance acquisition during weaning, a critical period early in life that is thought to shape later life susceptibility to FA40,41 and which correlates with the acceleration of RORγt+ Treg cell differentiation1,23,40,42. Notably, while Retnlb transcripts increased during the peri-weaning period [week (wk)3 and wk4 of life] and declined thereafter, the magnitude of the increase was much greater in Il4raF709 compared with WT mice (Fig. 5a). The dysregulated Retnlb expression in Il4raF709 mice was mirrored by reduced frequencies of RORγt+ Treg cells in the SI-LPL at peri-weaning compared with WT mice (Fig. 5b). To directly link the role of RELMβ expression with inhibition of RORγt+ Treg cells, we treated WT mice every other day starting wk2 through wk4 of life with recombinant RELMα, RELMβ, or vehicle. RELMβ but not RELMα or vehicle inhibited SI-LPL RORγt+ Treg cell differentiation at wk4 (Fig. 5c). Furthermore, the early life RELMβ-injected WT mice (wk2 to wk4) became susceptible to FA induction in adulthood (Extended Data Fig. 10a–c). Reciprocally, treatment of unsensitized Il4raF709 mice in early life with anti-RELMβ mAb induced RORγt+ Treg cell differentiation (Fig. 5d), which was associated with increased abundance of Lactobacilli (Fig. 5e). These data indicate that expression of RELMβ in early life regulates RORγt+ Treg cell differentiation.
Fig. 5 |. Suppression of RELMβ in early life prevents future development of FA.
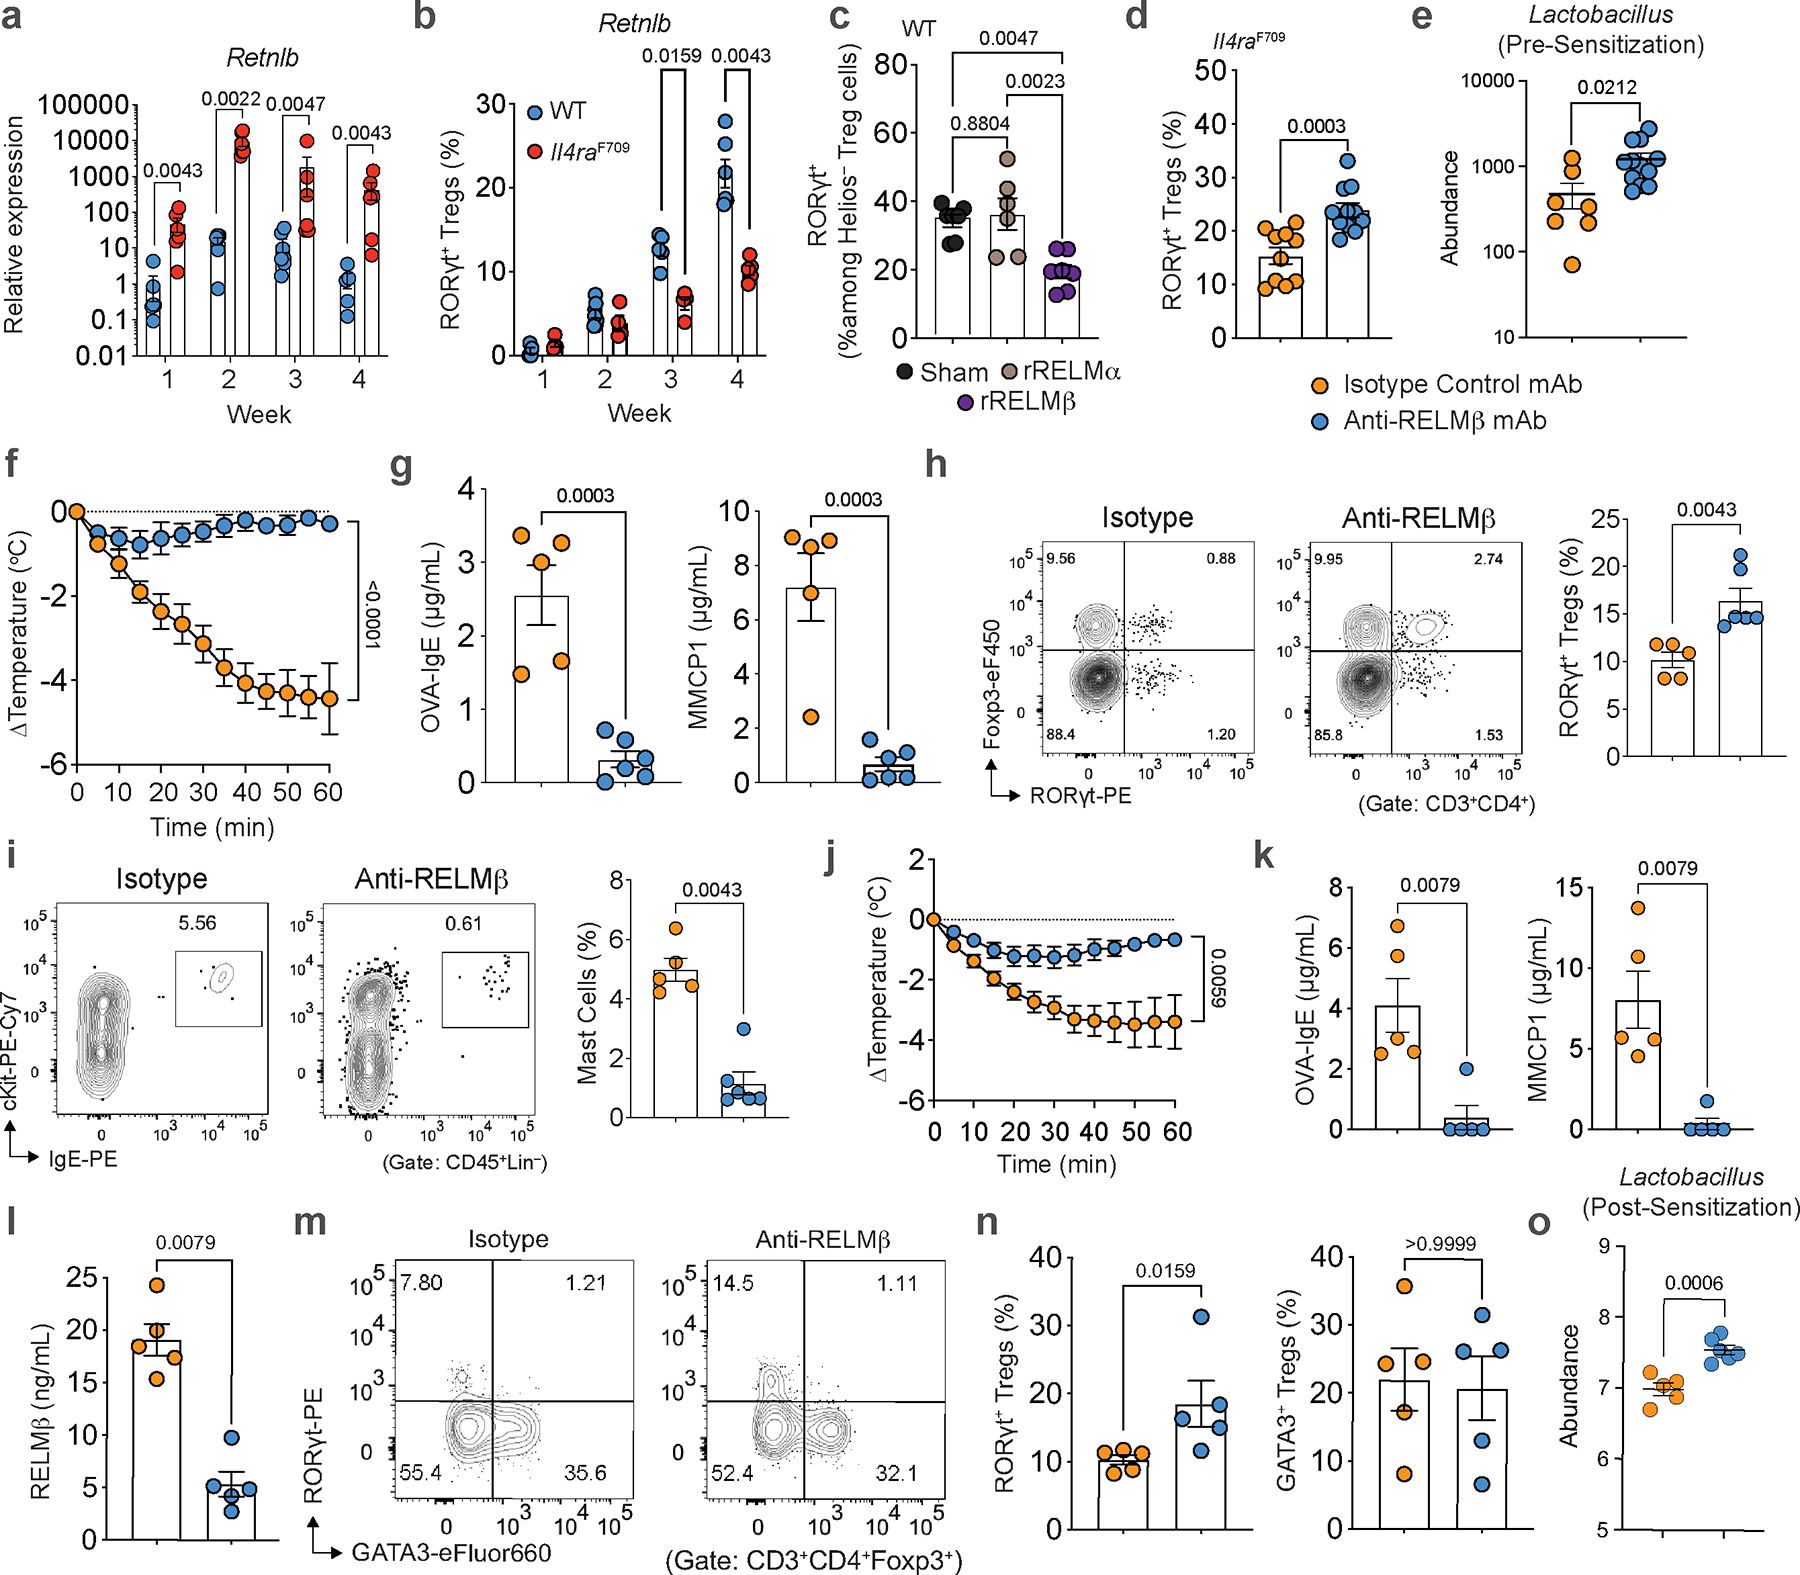
a, qPCR analysis of Retnlb transcripts in SI tissues of WT versus FA-prone Il4raF709 mice during the first four weeks of life (WT: 6,6,7 and 5; Il4raF709: 6). b, SI-LPL RORγt+ Treg cell frequencies of WT versus FA-prone Il4raF709 mice during the first four weeks of life (WT: 3,7,5 and 5; Il4raF709: 4 or 5). c, SI-LPL RORγt+ Treg cell frequencies in WT mice treated with RELMβ (n=7), RELMα (n=6), or vehicle (n=6) in early life (wk2 to wk4). d, SI-LPL RORγt+ Treg cell frequencies in Il4raF709 mice treated with anti-RELMβ (n=12) or isotype control mAb (n=10) from wk2 to wk4 of life (every other day). e, Lactobacillus genus abundance at wk4 of life in Il4raF709 mice treated with anti-RELMβ (n=7) or isotype control mAb (n=12) from wk2 to wk4 of life (every other day). f, Core body temperature changes in Il4raF709 mice treated with anti-RELMβ (n=6) or isotype control mAb (n=3) from wk2 to wk4 of life, and OVA-SEB sensitized and then OVA challenged. g, Total serum IgE, OVA-specific IgE, and MMCP1 concentrations in early-life mAb-treated mice (n=5 and 6). h, i, SI-LPL RORγt+ Treg cell (h) and mast cell frequencies (i) of early-life mAb-treated mice (n=5 and 6). j, Temperature changes in Il4raF709 mice treated with anti-RELMβ (n=10) or isotype control mAb (n=12) and concomitantly sensitized with OVA-SEB for eight weeks, and then challenged with OVA. k, OVA-specific IgE and MMCP1 concentrations in mice from (j) (n=5 and 5). l, RELMβ concentrations in mice from (j) (n=5 and 5). m, n, Flow cytometric analysis (m) and cell frequencies of SI-LPL RORγt+ Treg cells or GATA3+ Treg cells (n) in mice from (j) (n=5 and 5). o, Lactobacillus genus abundance post challenge in Il4raF709 mice treated with anti-RELMβ or isotype control mAb (n=5 and 6). For a–o, data are mean ± s.e.m. Statistical analysis: mixed-effects two-way ANOVA with Šídák’s post-hoc test (b), unpaired two-tailed t-tests (a,d,e,g–i,k,l,n,o), one-way ANOVA (c) with Tukey’s (c) post hoc test, or repeat-measure two-way ANOVA (f,j) with Šídák’s (f,j) post-hoc test.
Targeting RELMβ prevents and treats FA.
To determine if inhibition of RELMβ during early-life could prevent FA-predisposed mice from developing later life FA, Il4raF709 mice were treated every other day during peri-weaning (wk2 to wk4) with anti-RELMβ mAb and later orally sensitized at ten weeks of age followed by oral food antigen challenge. Early life treatment with anti-RELMβ mAb protected mice from FA, suppressing anaphylaxis (Fig. 5f) and mast cell expansion and resulting in increased frequencies of SI-LPL RORγt+ Treg cells (Fig. 5g–i). Overall, these results indicated that RELMβ activity early in life can influence long-term susceptibility to FA and that targeting RELMβ can prevent the development of FA later in life.
We next determined the capacity of treatment with anti-RELMβ mAb to reset immune dysregulation and restructure the microbiome towards a tolerogenic state in adult food allergic Il4raF709 mice. Treatment of adult Il4raF709 mice during sensitization with anti-RELMβ mAb, but not isotype control mAb, abrogated the anaphylactic response upon food antigen oral challenge and suppressed the FA-associated Th2 response in association with increased abundance of Lactobacilli (Fig 5j–o, Extended Data Fig. 10d–f). These results indicated that in pre-clinical models of FA aberrant tolerance imprinting early in life can be reset later in life by targeting RELMβ.
Here we define a novel immune-epithelial-microbiome circuit which regulates type 2 intestinal immunity and FA. Thus, type 2 immunity to food antigens in the gut may operate by two circuits acting in parallel. The first is an afferent microbiome-epithelial-immune circuit whereby a chemoreceptive gut epithelial cell sensing microbiome metabolites drives type 2 immune mediators (IL-4 and IL-13)15–19. The second is an efferent immune-epithelial-microbiome circuit in which the type 2 mediators induce secretory epithelial cell production of RELMβ, which in turn regulates RORγt+ Treg cell control of food antigen-specific immune response via microbiome editing. Our identification of the cellular (gut secretory epithelia, RORγt+ Treg cells and Lactobacilli) and molecular (RELMβ, indole derivatives and AhR) modules of this circuit each defines novel targets for interventions in the prevention and therapy of FA. Dysregulation of RELMβ early in life may predispose to long-term disease suceptibility to FA by compromising the RORγt+ Treg cell response during the weaning reaction, a period during which the expanding gut microbiome associated with the introduction of solid food imprints the mucosal immune system in favor of tolerance. Targeting RELMβ may thus allow not only for the suppression of FA but also foster long-term oral tolerance by means of a restructured microbiome.
Methods
Human subjects.
A total of 209 subjects were recruited: 67 children with FA alone, 52 children with both FA and asthma, 34 with asthma alone, 12 with atopic dermatitis but no FA or asthma, and 44 non-atopic controls. Children ages 18 and younger were included, except for the atopic dermatitis group which included subjects up to 25 years of age. Participants were recruited in the Allergy and Primary Care clinics at Boston Children’s Hospital and from the SICAS (School Inner City Asthma Study) cohort, a NIH funded prospective study of environmental risk factors in inner city school children with asthma. Five patients with isolated AD were recruited at Stanford University School of Medicine. The human studies were approved by the Institutional Review Boards (IRB) at the Boston Children’s Hospital (IRB-P00021163 and IRB-P00044512) and at Stanford University (IRB 8629), respectively.
FA diagnosis was made by the treating physician and was based on the combination of positive IgE testing (skin testing and/or specific IgE) and a recent history of IgE-mediated symptoms (hives, angioedema, emesis, wheezing, hypotension etc.) developing within 2 hours of ingestion of the culprit food. Asthma diagnosis was based on validated questionnaire and ATS criteria. Asthmatic patients requiring treatment with systemic steroids were excluded. Atopic dermatitis was diagnosed based on the presence of eczematous, itchy and relapsing lesions with typical morphology and age-related distribution (facial, neck and extensor involvement in infants/children; flexural lesions at any age; sparing of the groin and axillary regions). Non-atopic controls had no personal history of IgE mediated conditions. Exclusion criteria included history of non-IgE mediated or chronic inflammatory gastrointestinal disorders, use of immunosuppressive medications, and use of antibiotics within the previous 6 weeks.
Human RELMβ ELISA.
RELMβ concentrations were measured in the sera from patients using the RETNLB ELISA kit (LSBio) according to the manufacturer’s protocol.
Mice.
All of the following strains, except where indicated, were obtained from or rederived at The Jackson Laboratory (Jax). C.129X1-Il4ratm3.1Tch (Il4raF709 BALB/c congenic) and B6.129X1-Il4raF709 (Il4raF709 C57BL/6J congenic) have been previously described43,44. B6.129(Cg)-Foxp3tm4(YFP/icre)Ayr/J) (Foxp3YFPCre), C57BL/6-Retnlbem1Lvh/J (Retnlb−/−) and B6(Cg)-Rorctm3Litt/J were backcrossed 12 generations on BALB/cBYJ to generate the respective BALB/c congenic strains. Separately, C57BL/6-Retnlbem1Lvh/J (Retnlb−/−) were crossed with Foxp3YFPCre and Il4raF709 to obtain the C57BL/6 congenic strains Retnlb−/−Foxp3YFPCre and Il4raF709Retnlb−/−Foxp3YFPCre. B6(Cg)-Rorctm3Litt/J), B6.129(Cg)-Foxp3tm4(YFP/cre)Ayr/J)(Foxp3YFPCre), and B6.129(Cg)-Il4raF709 were crossed to generate the C57BL/6 congenic strains Il4raF709Foxp3YFPCre, Foxp3YFPCreRorcΔ/Δ, Il4raF709Foxp3YFPCreRorcΔ/Δ.
The following C57BL/6 congenic strains B6N.Cg-Tg(Vil1-cre)20Syr/J (VilCre) and B6.Cg-Tg(Atoh1-cre)1Bfri/J (Math1Cre)45 were crossed with newly derived C57BL/6N-Retnlbem1cyagen (Retnlbfl/fl), and B6.129(Cg)-Il4raF709 to obtain Il4raF709Retnlbfl/fl, Il4raF709VilCreRetnlbΔ/Δ, Il4raF709Math1Cre and Il4raF709Math1CreRetnlbΔ/Δ. B6.129(Cg)-Foxp3tm4(YFP/cre)Ayr/J) (Foxp3YFPCre) and B6.129(Cg)-Il4raF709 were crossed with Ahrtm3.1Bra/J (AhrΔ/Δ) to generate Il4raF709Foxp3YFPCreAhrΔ/Δ and also with C57BL/6-Retnlbem1Lvh/J (Retnlb−/−) to obtain the C57BL/6 congenic Retnlb−/−Il4raF709Foxp3YFPCreAhrΔ/Δ.
Mice were housed under specific-pathogen-free or germ-free conditions as specified. Experimental mice were 2–16 weeks of age unless otherwise indicated. Within the respective experiments, mice were matched for strain background, age and sex, and both male and female mice were used in closely related proportions. Sample sizes were determined based on power calculations. Mice were identified based on their verified genotype, and they were randomized into different treatment groups. Experiments were not blinded. All studies were carried out under protocols approved by the Institutional Animal Care and Research Committee at the Boston Children’s Hospital.
Antibiotic treatment.
Mice were treated with an antibiotic cocktail (Sigma-Aldrich) containing ampicillin (2.5 mg/mL), metronidazole (2.5 mg/mL), gentamycin (0.4 mg/mL), streptomycin (0.5 mg/mL), vancomycin (0.5 mg/mL), administered intra-gastrically (i.g.) by oral gavage in a final total volume of 100 μL PBS once daily for 1 week, as indicated.
Oral allergic sensitization and challenge of mice.
Mice were treated i.g. with either sterile PBS or OVA (Sigma-Aldrich) (250 μg) together with 10mg SEB (Toxin Technology) in PBS once weekly for 8 weeks5. On week 9, mice were challenged with 150mg OVA in 300μL of PBS/mouse. Anaphylaxis was assessed by measuring changes in total body core temperature with transponders placed subcutaneously 2 days before challenge (IPTT-300; Bio Medic Data Systems) and a DAS-6001 console (Bio Medic Data Systems).
Fecal microbiome transplant (FMT).
Germ-free mice were gavaged with 50 mg of fecal material in 100 μl PBS obtained from the indicated mouse strains maintained under specific pathogen free (SPF) conditions. The FMT-reconstituted mice were left for 3 weeks to equilibrate their newly introduced microbiota before being analyzed or subjected to further allergen-sensitization as indicated.
Skin allergic sensitization of mice.
Mice were anesthetized, and the back of each mouse was shaved then tape stripped six times with Tegaderm dressings. OVA (at a concentration of 5 mg/ml OVA in a final volume of 100μl PBS) or PBS alone was applied directly on the skin. The sensitization was repeated every alternative day for a total of 11 sensitizations. At the end of the sensitization period, mice were challenged with 150mg OVA in 300μl of PBS per mouse via oral gavage.
Promotion of oral tolerance in FA.
Il4raF709 mice were sensitized with OVA-SEB for 8 weeks and then further sensitized for an additional 4 weeks with anti-RELMβ antibody or isotype control treatment. Post-sensitization, mice were challenged with 150 mg OVA in 300 μL of PBS per mouse via oral gavage.
Generation of Anti-RELMβ mAb.
Anti-mouse RELMβ mAb was derived by immunizing then boosting Retnlb−/− mice with recombinant mouse RELMβ (Peprotech), followed by fusion of the spleen/lymph node cells of the immunized mice with SP 2/0 myeloma cells, as described46. The generated hybridomas were screened by ELISA for anti-RELMβ mAbs. The RELMβ mAb thus identified was an IgG1 kappa mAb and was reactive to the overlapping mouse RELMβ peptides EPKTISCTSVTSSGRLASCP and TSSGRLASCPAGMVVTGCAC but no other overlapping RELMβ peptides, thus identifying its target as the RELMβ sequence TSSGRLASCP. It was non-reactive with mouse RELMα.
Early life treatment.
Il4raF709 mice were injected intra-peritoneally (i.p.) with 100 μg of anti-RELMβ (Boston Molecules MA, USA) or the corresponding isotype control IgG1κ (MOPC-21) every other day starting at week 2 through week 4 post-birth. Following the same experimental procedure, WT mice were treated with 10 μg of recombinant murine RELMα, RELMβ (Peprotech) or vehicle.
RNA-Seq Epithelial Cell Isolation.
WT, Il4raF709 and Il4raF709Retnlb−/− mice were sensitized with OVA/SEB once weekly for 8 weeks. On week 9, mice were euthanized, and the small intestine was dissected. Fecal contents were flushed with ice cold FACS buffer and Peyer’s patches were excised. The intestines were cut into 1cm pieces and treated with FACS buffer, 1.5 mM DTT and 10 mM EDTA at 37 °C for 30 min with constant stirring. The supernatant was filtered and centrifuged, and the cell pellet was treated with Dispase (1mg/ml) for 10min at 37°C. The supernatant was filtered and centrifuged to obtain cell pellet, the cells were stained with Amcyan for 15 mins and then with CD45 and Epcam1. 100,000 epithelial cells were sorted on a BD FACS Aria as live Epcam1+CD45−cells.
RNA-Seq Library Preparation.
Cell populations were double sorted straight into 1 ml Trizol reagent (Thermo Fisher). After addition of 200 mL chloroform, RNA was precipitated from the aqueous phase by addition of isopropanol and linear acrylamide. RNA was washed with 75% ethanol and resuspended in RNase-free water. RNA extraction from low-input samples was performed using the miRNAeasy Micro Kit (Qiagen) on the QIAcube Connect (Qiagen) according to manufacturer’s protocol. After RiboGreen quantification and quality control by Agilent BioAnalyzer, 0.4 – 2.0 ng total RNA was amplified using the SMART-Seq v4 Ultra Low Input RNA Kit (Clontech: 63488), with 12 cycles of amplification. Subsequently, 1.5 – 15 ng of amplified cDNA was used to prepare libraries with the KAPA Hyper Prep Kit (Kapa Biosystems KK8504), using 8 cycles of PCR. Samples were barcoded and run on a HiSeq 4000 or HiSeq 2500 in either a 50bp/50bp end run, using the HiSeq 3000/4000 SBS Kit (HiSeq 4000) or HiSeq Rapid SBS Kit v2 (HiSeq 2500) (Illumina).
RNA-Seq Analysis.
Gene-level read counts were quantified using feature Counts and the latest Ensembl mouse annotation (GRCm38.R101). Raw data were trimmed using Trimmomatic (version 0.39, default parameters), tool for Illumina NGS data. To identify differentially expressed genes, we used 3 algorithms: DESeq2 (version 1.26.0), edgeR (version 3.28.1) and Lima (3.42.2) Bioconductor packages with default parameters. Count tables were normalized to TPM (Transcripts per Million) for visualizations and QC. Sample clustering, path analyses and integration of the results were performed using a custom-made pipeline available upon request (Variant Explorer RNAseq). Transcripts were called as differentially expressed when the adjusted p values were below 0.05, fold-changes over ±1.5 and false discovery rate (FDR) were below 0.05. For our path analyses, we tested 10,715 biological pathways from KEGG and GO annotations. We filtered the results using an adjusted p value below 0.001.
Passive Cutaneous Anaphylaxis (PCA) Model.
Serum (20 μL) from OVA-SEB sensitized and challenged Il4raF709 or Il4raF709Retnlb−/− were injected into ear pinnae of naïve BALB/c recipients. Twenty-four hours later, the recipient mice were challenged intravenously with 100 μg OVA together with 1% Evans Blue in 200ml PBS/mouse. Thirty minutes later, the mice were euthanized, and ear pinnae were harvested. The absorbance of the supernatant was measured at 655 nm to quantify the extravasation of the dye.
In vitro T-cell differentiation.
Spleens and MLNs from Il4raF709Foxp3YFPCre and Il4raF709Foxp3YFPCreAhrΔ/Δ mice were physically disrupted and washed to obtain single cell suspensions and pooled for isolation. Naïve CD4+ T cells (CD4+CD44−CD62L+) were isolated by cell sorting (Sony Sorter, MA900). Isolated T cells were seeded at a concentration of 1×10⁶ cells/mL with plate-bound anti-CD3 (10 μg/mL) and soluble anti-CD28 (1 μg/mL) (see Supplementary Table 4 for antibody details) in the presence of IL-2 (10 ng/mL), TGF-β1 (3 ng/mL) for negative differentiation control; IL-6 (5 ng/mL) was added as a differentiation positive control. Cells were cultured in DMEM media supplemented with 10% FBS. A panel of indole derivatives ((indole-3-carboxaldehyde (I3A) (Sigma); indole-3-acetic acid (IAA) (Sigma); and indole-3-lactic Acid (ILA) (Sigma)) were added to culture at 10 μM instead of IL-6. Cells were harvested after 72 hours. RORγt expression on Foxp3+ Treg cells was then assessed by flow cytometry.
Isolation of MLN and LP lymphocytes.
MLNs were isolated and homogenized in FACS buffer (1x PBS supplemented with 2% FCS). Cells were washed once with FACS buffer and used for experiments. Small intestine tissue was dissected from mice and fecal contents were flushed with FACS buffer. Peyer’s patches were excised, and the intestines were cut into 1cm pieces and treated with FACS buffer, 1.5 mM DTT, and 10 mM EDTA at 37 °C for 30 min with constant stirring to remove mucous and epithelial cells. For epithelial cells isolation, the supernatant was kept after this step and centrifuged to obtain a cell pellet. Intestinal tissue was minced and the cells were dissociated in RPMI-1640 supplemented with collagenase (2 mg/mL collagenase VIII; Sigma), DNase I (100 μg/mL; Sigma), 5 mM MgCl2, 5 mM CaCl2, 5 mM HEPES, and 10% FBS with constant stirring at 37 °C for 45 min. Leukocytes were collected at the interface of a 40%/70% Percoll gradient (GE Healthcare). The cells were washed with FACS buffer and used for downstream experimentation.
Flow cytometry.
The following anti-mouse monoclonal antibodies (mAb) were used: CD3-FITC/BV711 (17A2), CD4-BV605 (RM4–5), CD44-PE-Cy7 (IM7), IgE-PE (RME-1), Lineage Cocktail (Ms CD3/Gr-1/CD11b/CD45R(B220)/Ter-119)-FITC, CD45-BV605 (30-F11), cKit-PE-Cy7 (2B8), FceR1a-PerCP Cy5.5 (MAR-01), IgE-PE (RME-1), PD-1-BV605 (29F.1A12), IL-4-PE (11B11), were from Biolegend. CXCR5-PerCP-eFluor710 (SPRCL5), Foxp3-eF450(FJK-16S), GATA-3-eF660 (TWAJ), ROR-gt-PE (B2D), Helios APC Cy7 (22F6), IL-13-APC (eBio13A) were from eBiosciences. For cytokines, cells were stimulated during 4 hours with PMA (50 ng/ml; Sigma-Aldrich) and ionomycin (500 ng/ml; Sigma-Aldrich) in the presence of Golgi Plug (BD Biosciences), then stained with the BD Cytofix/Cytoperm buffers (BD Biosciences) and the indicated anti-cytokine antibody. For intracellular staining of nuclear factors, the Foxp3 Transcription Factor buffer set (eBioscience) was used. Dead cells were routinely excluded from the analysis based on the staining of eFluor 506 fixable viability dye (eBioscience), and analyses were restricted to single cells using FSC-H and FSC-A signals. Stained cells were analyzed on an LSR Fortessa (BD Biosciences) and data were processed using Flowjo (Tree Star Inc.). Full details of the antibodies used and their respective dilutions are found in Supplementary Table 4.
ELISA.
Total IgE, OVA-specific IgE, and Murine mast cell protease 1 (MMCP1) concentrations were measured in the sera of treated mice by ELISA, as previously described23. RELMα and RELMβ concentrations were measured by using sandwich ELISAs. The capture and biotinylated detection antibodies (rabbit anti-murine RELMα and RELMβ) and recombinant murine RELMα and RELMβ were from (PeproTech).
High Affinity ELISA.
High affinity antibody was analyzed by ELISA as previously described20. Mice were immunized with 10 μg house dust mite extract together with 25 μg NP16-OVA via intra-nasal (i.n.) treatment for primary immunizations. Mice were boosted twice (i.n.) with 2 μg of the extract and 10 μg NP16-OVA 12 after the primary immunization. Mice were euthanized one week after the last boost and sera was collected for the analysis of high affinity antibodies by ELISA. Briefly, for antigen-specific antibodies, 20 μg/ml of NP9-BSA (for high affinity) or NP27-BSA (for low affinity) was coated on 96-well MaxiSorp plates overnight. Plates were blocked with 1% BSA in 1x PBS (37°C, 1 hour) followed by the addition of serially diluted serum with a 2 hour incubation at 37°C. Antigen-specific IgE was detected using anti-mouse IgE-HRP and incubated at 37°C for 1 hour. Plates were developed with tetramethylbenzidine and stopped with 3 N hydrochloric acid and read at 450 nm on a microplate reader.
qPCR analysis.
RNA extraction from tissue was carried out for low-cell count samples (sorted Treg cell or Tconv cell samples) with the Zymo Direct-zol RNA Microprep kit (Zymo Research), high-cell count samples (intestinal epithelial cell samples) with the Zymo Quick-RNA Miniprep Plus Kit (Zymo Research) or miRNAeasy Micro Kit (Qiagen) for organoids cultures. cDNA generation from isolated RNA was carried out with the iScript Reverse Transcription Supermix (BioRad) following the manufacturer’s protocol. qPCR reactions were performed using the iTaq Universal SYBR Green Supermix (BioRad).
Colon Murine crypt isolation and organoid cultures.
Colon intestinal crypts were isolated from WT, Il4raF709 and Il4raF709VilCreRetnlbΔ/Δ C57BL/6 mice of both sexes, aged between 6 to 10 weeks in all experiments, following the guidelines provided by the Organoids Core from Harvard Digestive Disease Center (HDDC). Briefly, colon was collected, opened longitudinally, and washed with 5mM EDTA/PBS to clear the luminal contents. Tissue was cut into 5 mm pieces with scissors and washed repeatedly by gently pipetting the fragments using a 10 mL pipette until the supernatant was clear. Fragments were rocked on ice with 5 mM/EDTA buffer (15 min), and then this process was repeated with fresh buffer (30 min). Fragments were washed with buffer by shaking vigorously to release the crypts from the tissue and by pipetting up and down to release the crypts. Crypt-containing fractions were passed through a 70 μm cell strainer (BD Bioscience) and centrifuged at 300 rpm (5 min).
The cell pellet was resuspended in advanced DMEM/F12 (Life Technologies) and centrifuged at 200 rpm (2 min) to remove single cells. Crypts were then cultured in Corning Matrigel membrane matrix–GFR (Thermo Fisher) and plated in 24-well plates. Following Matrigel polymerization, 500 μL of crypt culture medium (ENRW) containing growth factors EGF (50 ng/ml, Life Technologies) was added to each well. ROCK inhibitor Y-27632 (10 μM, R&D Systems) was added for the first pass only. Crypts were then cultured at 37 °C in 5% CO2, medium changed every 2–3 days and organoids passaged once a week. Organoids were stimulated with rRELMβ (Peprotech) at 10 μg/mL, rSPRR2A (Aviva Systems Biology CA, USA) at 10 μg/mL, anti-RELMβ (Boston Molecules) at 50 ng/mL alone or in combination with rIL-13 (Peprotech) at 1 ng/mL (24 hours) before RNA extraction and immunofluorescence staining.
Human Intestinal Organoid culture.
Human duodenal organoid lines were derived from de-identified biopsies from grossly unaffected tissue in patients undergoing endoscopy at Boston Children’s Hospital. Informed consent and developmentally appropriate assent were obtained at Boston Children’s Hospital from the donors’ guardian and the donor, respectively. All methods were approved and carried out in accordance with the Institutional Review Board of Boston Children’s Hospital (Protocol number IRB-P00000529). For organoid derivation, intestinal crypts were isolated from frozen tissue and then resuspended and plated in Matrigel domes. Once established, human duodenal organoids were sustained in specialized growth media as previously described47. To induce differentiation, organoids were grown in growth media for two days post passage to allow for stem cell expansion; after which, they were transitioned to differentiation media with Rimonabant and SP600125 (RSP) as previously described47. Media was changed every two days for the length of the experiment, with organoids being stimulated by rhRELMβ (Peprotech) at 10 μg/mL, alone or in combination with rhIL-13 (Peprotech) at 1 ng/mL after eight days of RSP treatment. Organoids were collected for analysis 24 hours for RNA extraction.
Immunofluorescence.
Mice colon organoids were cultured in 8-well cell culture Slides (MatTek). Following stimulation with rIL-13 (Peptrotech), rRELMβ (Peprotech), or a combination of both rIL-13 and rRELMβ, the organoids were incubated overnight. The culture medium was used as a negative control. After stimulation, the culture medium was aspirated away from the Matrigel domes and the domes were washed with 500 μL RT PBS, three times. Wells were fixed with 4% paraformaldehyde in PBS (30 mins) and subsequently rinsed with 500 μL RT PBS, three times. The organoids were then permeabilized with 500 μL 0.3% Triton X-100 in RT PBS. Wells were incubated with 500 μL of 5% RT BSA to block for 1.5 h. After blocking, the primary antibodies, including mouse anti-RELMβ Antibody (Santa Cruz), Rabbit anti-MUC2 (GeneTex), and mouse anti-EpCAM (Thermo Fisher), were added at a 1:200 dilution in 500 μL block buffer (overnight, 4°C). Following primary antibody incubation, the wells were washed four times with PBS and then incubated with secondary antibodies, including Goat anti-Mouse IgG2a Alexa Fluor555 (Thermo Fisher), Goat anti-Rabbit IgG (H+L) Alexa Fluor Plus 647 (Thermo Fisher), and Goat anti-Mouse IgG1 Alexa Fluor 488 (Thermo Fisher), all at a 1:500 dilution in 500 μL block buffer (1 hour, RT) (see Supplementary Table 4 for a full listing of the antibodies used). After four washes with PBS, the PBS was removed and organoids were stained with a 1:10,000 dilution of 4′-6-diamidino-2-phenylindole, dihydrochloride (Sigma-Aldrich) (10 min). Slides were blocked with 50 μL of SlowFade antifade mountant (Thermo Fisher). The organoids were imaged using a Zeiss LSM880 confocal microscope (Oberkochen) and ZEN imaging software (Zeiss). Random fields were selected in each organoid, and the fluorescence intensity of RELMβ was analyzed using ImageJ2 Fiji (NIH, Bethesda, MD).
Tetramer staining.
MLN and SI-LPL lymphocytes from OVA-SEB sensitized mice were collected and incubated for 2 hours at room temperature with I-Ab OVA325–335 Tetramer-PE and I-Ab OVA325–335 Tetramer-APC or I-Ab human CLIP 87–101 Tetramer-PE and I-Ab human CLIP 87–101 Tetramer-APC. All tetramers were obtained from the NIH tetramer core facility and used at 0.03 mg/ml. The cells were then stained for additional markers for flow cytometry and analyzed accordingly.
Sample collection and 16S rDNA phylo-typing.
Fecal samples were collected as raw stool and stored at −80°C. Raw genomic DNA for downstream 16S amplicon next generational sequencing was isolated using the ZymoBIOMICS™ – 96 DNA Kit (Zymo Research). To allow quantification of bacterial cells in each sample, a gut-external “spike” bacterium (Salinibacter ruber DSM 13855) was added to each pre-massed stool sample. Briefly, 10−2 OD of S. ruber was added to each sample per 10 mg of mouse stool such that the final amount of S. ruber per sample would be approximately 1% of the total bacterial 16S abundance. The 16S amplicon library was prepared using dual-index barcodes in a 96-well format. The library pool was cleaned with the DNA Clean and Concentrator ™ – 5 (Zymo Research) before quantification by qPCR (NEBNext Library Quant Kit). Approximately 20 pM of DNA were loaded on an Illumina MiSeq and sequenced (v3, 600-cycle, 300nt paired-end). To generate the OTU table for downstream analyses of murine gut microbiome composition and diversity, the obtained Illumina raw reads were de-multiplexed, paired end joined, adapter trimmed, quality filtered, dereplicated, and denoised. Sequences were mapped against the publicly available 16S rDNA databases SILVA and UNITE and clustered into OTUs at greater than or equal to 97% nucleotide sequence identity. Differential abundance analyses were performed with LEfSe with significantly different features having an alpha value ≤0.1 and a logarithmic LDA score ≥0.5.
OTU filtering & quantification.
Post processing of raw reads, OTU taxonomic assignment, and generation of an OTU table, all samples with less than 1500 total reads and 200 reads assigned to the internal standard “Salinibacter” were discarded. To calculate OTU absolute abundance, a previously described method was followed48. The genus “N/A” was discarded from all downstream analyses as it lacked a taxonomic assignment confounding our ability to functionally study this taxon. In those analyses where absolute bacterial quantification was not possible due to statistical or sample limitations, filtered read counts were used. Samples with total read counts that fell within the 95th percentile were discarded as outliers in those comparisons in which no sample had more than 10,000 total filtered read counts. Samples with read counts that fell within the bottom 5th percentile were discarded as outliers in those comparisons in which samples had greater than 10,000 total filtered read counts. Absolute quantification was used in Main Figures 3a, 3b, and 5o, and Extended Figures 3e and 9b. Relative quantification was used in Main Figure 5e (because insufficient Salinibacter spike reads were measured in enough samples to allow absolute count determination and statistical analysis).
Tryptophanase gene identification in Alistipes species genomes.
Tryptophanases (tnaA) were identified by BLAST alignment tools49 using the B. ovatus ATCC 8483 tryptophanase (tnaA, Bovatus_01573) protein sequence with a protein identity higher that 60% on 166 Alistipes spp. genomes recovered from NCBI database from isolated strain or shotgun metagenomics projects from human samples (Supplementary Table 3).
Bacterial cultivation.
Frozen stock cultures of the bacteria isolates were stored at −80°C in cryogenic vials (Wheaton). Mouse Lactobacillus isolates cultivated included L. reuteri and L. murinus. Human Lactobacillus isolates cultivated included L. gasseri ATCC 33323, L. reuteri CF48–3A, and L. rhamnosus ATCC 53103 (GG). All Lactobacillus species were grown on modified De Man, Rogosa and Sharpe (MRS broth (52 g/L), Cysteine (5 g/L), Agar (15 g/L)) (mMRS) agar plates or modified De Man, Rogosa and Sharpe (MRS broth (52 g/L), Cysteine (5 g/L)) (mMRS) media. Human Bacteroidales isolates cultivated included B. ovatus ATCC 8483 WT, B. ovatus ATCC 8483 ΔtnaA, and Alistipes shahii DSM 19121. All Bacteroidales were grown on brain-heart-infusion supplemented with hemin (50 mg/L) and vitamin K1 (0.25 mg/L) (BHIS) agar plates, in basal media (BSG; proteose peptone (20 g/L), yeast (5 g/L), NaCl (5 g/L), glucose (5 g/L), potassium phosphate dibasic (5 g/L), cysteine (0.5 g/L), hemin (50 mg/L), and vitamin K1 (0.25 mg/L), or in YBHIS (yeast extract (5 g/L), brain-heart-infusion powder (37 g/L), cysteine (0.5 g/L), hemin (50 mg/L), and vitamin K1 (0.25 mg/L)) media. All bacteria were recovered and grown anaerobically at 37°C for 48 hours in a coy anaerobic chamber until visible growth was observed (Coy Labs).
Mouse Lactobacillus isolation.
Stool recovered from OVA-SEB sensitized Il4raF709 Retnlb−/− mice was homogenized in pre-reduced 1x PBS (0.2 mg/mL) in a coy anaerobic chamber (Coy Labs), filtered through a 70 μm cell strainer, and then 50 μL of this solution was plated on pre-reduced mMRS agar plates (in triplicate). After two days, morphologically unique colonies were isolated in individual wells of a 96-well plate in 200 μL of 30% Glycerol-PBS. To distinguish the identity of each isolate, each isolate was alkaline-lysed50, the whole length 16s rRNA gene was amplified, sequenced by sanger sequencing, and identified by nBLAST against rRNA/ITS databases (NCBI). For long-term storage, both unique isolates of each endogenous mouse Lactobacillus species were streaked to single colonies to generate frozen stock cultures that were stored at −80°C in cryogenic vials (Wheaton).
Lactobacillus mutant generation.
A clean deletion mutant was generated wherein the gene encoding the putative aromatic amino acid aminotransferase (araT) Lreu23DRAFT_4905 was cleanly deleted from the genome of Limosilactobacillus reuteri subsp. rodentium (previously Lactobacillus reuteri) 100–23 using a counter-selectable allelic exchange procedure which imparts sensitivity to vancomycin in naturally vancomycin-resistant lactic acid bacteria51. Briefly, 1,000-basepair regions flanking the genomic region to be deleted were amplified by PCR (Platinum SuperFi PCR Master Mix), purified, and cloned into the pVPL3002 plasmid in a three-piece ligation reaction at the multi-cloning site to generate pGAK000152. To construct L. reuteri 100–23 ΔaraT, 1 μg targeting plasmid (pGAK0001) DNA and 200 ng helper plasmid (pTRK669) DNA were co-transformed by electroporation into L. reuteri 100–23. Cells were recovered in 1 mL of pre-reduced mMRS broth for 3 hours before the entire solution was plated on mMRS agar supplemented with erythromycin (10 μg/mL) to select for single cross-over (SCO) clones. Single clones were re-streaked onto mMRS agar supplemented with erythromycin (10 μg/mL) to isolate erythromycin-resistant SCO clones. To remove the helper plasmid from SCO clones, each erythromycin-resistant clone was serial passaged three times (0.1% inoculum) in mMRS supplemented with erythromycin (5 μg/mL). Loss of the helper plasmid from erythromycin-resistant colonies was confirmed by PCR screening. To enable a double cross-over event, each SCO clone was grown up individually overnight in 1 mL of mMRS broth before 2 μL of each culture was streaked out onto mMRS agar supplemented with vancomycin (350 μg/mL) to drive a DCO event. Single colonies that grew on mMRS agar supplemented with vancomycin (350 μg/mL) were isolated and ΔaraT clones were identified by antibiotic resistance profiling (erythromycin-sensitivity and vancomycin-resistance), PCR screening and sanger sequencing analysis to confirm gene loss. The resulting mutant was named L. reuteri 100–23 ΔaraT.
Bacteroides mutant generation.
A clean deletion mutant was created by allelic replacement whereby the tryptophanase (tnaA) gene (Bovatus_01573) in B. ovatus ATCC 8483 was deleted. We leveraged a modified pKNOCK-bla-ermGb suicide vector, pKNOCK-bla-ermGb_pheS*, we previously engineered with a counter-selection system mediated by a variant phenylalanyl-tRNA synthetase (PheS A303G), lethal in the presence of 4-chloro-phenylalanine53. To generate deletion constructs, 1kb regions flanking the tnaA gene were amplified by PCR (Platinum SuperFi PCR Master Mix), purified, and cloned into the pKNOCK-bla-ermGb_pheS* plasmid in a three-piece ligation reaction52. A triparental mating strategy was implemented to mobilize resulting plasmids into Bacteroides. Overnight cultures of Bacteroides grown in BSG were diluted 50-fold into fresh pre-reduced BSG and grown to early exponential phase (OD600 ~0.1). The recipient strain was centrifuged (max speed, 5 minutes) and resuspended in 1x PBS (f.v. 200 μL). E. coli DH5α lambda pir donor strain containing the allelic replacement construct and E. coli DH5α helper strain with the RK231 helper plasmid were scrapped from LB agar plates into 1x PBS (f.v. 200 μL). Donor, helper, and recipient strains were combined at a 1:1:1 donor:helper:recipient culture volume ratio (f.v. 90 μL) and spotted on non-selective BHIS agar plate (18 hours, 37°C) under aerobic conditions to allow for conjugation. Mating lawns were scrapped onto BHIS agar plates containing gentamicin (200 μg/mL) and erythromycin (5 μg/mL) to select for Bacteroides transconjugants. Single colonies were isolated onto BHIS agar plates containing erythromycin (5 μg/mL). A single colony was re-streaked onto Bacteroides minimal media (BMM; ammonium sulfate (1 g/L), sodium carbonate (1 g/L), potassium phosphate monobasic (0.9 g/L), sodium chloride (0.9 g/L), calcium chloride dihydrate (26.5 mg/L), magnesium chloride hexahydrate (2 mg/L), manganese(II) chloride tetrahydrate (1 mg/L), cobalt(II) chloride hexahydrate (1 mg/L), hemin (50 mg/L), vitamin K1 (0.25 mg/L), ferrous sulfate heptahydrate (4 mg/L), vitamin B12 (5 mg/L)) agar plates supplemented with 4-Chloro-DL-phenylalanine (2 mg/mL, Acros Organics) and glucose (15 mM, Sigma) to select for the loss of the pKNOCK-bla-tetQ-pheS* vector. Individual clones were replica-plated onto BHIS agar and BHIS agar supplemented with erythromycin (5 μg/mL). Those clones that did not grow on erythromycin were confirmed for tnaA deletion by PCR and sanger sequencing.
Preparation of Lactobacillus mono-culture or consortia inoculum.
For preparation of inoculum for gavage, pre-reduced mMRS broth (3 mL) was inoculated with 3 colonies of each individual Lactobacillus strain and grown for 15 hours. This culture was used to inoculate a larger growth sub-culture of pre-reduced mMRS broth (30 mL) at a final dilution of 1:10 to generate adequate amounts of bacterial biomass for gavage. Each bacterial sub-culture was grown for three hours before harvest. To normalize the bacterial components of each inoculum prior to gavage, the optical density at 600 nm (OD600) of each sub-culture was measured with a Genesys 140 visible spectrophotometer (Thermo Scientific) and then 15 OD units of each culture were isolated and sealed for concentration then centrifuged at 10,000 rpm for 10 minutes at room temperature. Post-centrifugation, each tube was recovered to a Coy anaerobic chamber before spent media was decanted and each bacterial pellet was re-suspended in 200 μL of pre-reduced 1x PBS per OD unit (f.v. 3 mL). Equivalent volumes of each strain were combined and then each consortium was aliquoted into cryogenic vials (Wheaton) before transport in a 2.5 Liter rectangular jar (Mitsubishi Gas Chemical Co., Inc.) and direct gavage of 1 OD unit of individual bacteria or bacterial consortia (1 × 10⁹ CFU/mL) per mouse in 200 μL.
Preparation of Bacteroides mono-inoculum.
For preparation of inoculum for gavage, pre-reduced BSG broth (f.v. 3 mL) was inoculated with 3 colonies of each isolate (B. ovatus ATCC WT or B. ovatus ATCC ΔtnaA) and grown overnight (15 hours, 37°C). Each culture was used to inoculate a larger growth sub-culture of pre-reduced BSG broth (f.v. 30 mL) at a final dilution of 1:10 to generate adequate amounts of bacterial biomass for gavage. Each bacterial sub-culture was grown expanded (3 hours, 37°C) before harvest. To normalize the bacterial bolus for gavage, the optical density at 600 nm (OD600) of each sub-culture was measured with a Genesys 140 visible spectrophotometer (Thermo Fisher) and then 15 OD units of each culture were isolated and sealed for concentration then centrifuged (10,000 rpm, 10 minutes) at room temperature. Post-centrifugation, each tube was recovered to a Coy anaerobic chamber before spent media was decanted and each bacterial pellet was re-suspended in 200 μL of pre-reduced 1x PBS per OD unit (f.v. 3 mL). Each isolate was aliquoted into cryogenic vials (Wheaton) before transport in an anaerobic 2.5 Liter rectangular jar (Mitsubishi Gas Chemical Co., Inc.) and direct gavage of 1 OD unit of any one bacterial isolate (1 × 10⁹ CFU/mL) per mouse in 200 μL each week for 8 weeks.
In vivo bacterial colonization.
To confirm Lactobacillus or Bacteroides colonization in vivo, stool from mice colonized with either bacterium was spiked with 0.01 OD of Salinibacter ruber DSM 13855 per 10 mg of mouse stool such that the final amount of S. ruber per sample would be approximately 1% of the total bacterial 16S abundance. Total gDNA was isolated from each sample (ZymoBiomics DNA Miniprep Kit). Relative quantification of Lactobacillus using Lactobacillus-specific primers or Bacteroides using Bacteroides-specific primers was performed by real-time PCR (QuantStudio 3) using Fast SYBR Green Master Mix (Applied Biosystems). The abundance of bacterial colonization was calculated versus PBS-treated mice using S. ruber as a standard wherein the resulting −ΔΔCt value was a measure of bacterial colonization in bacteria-treated versus non-bacteria-treated mice.
Bacterial killing assay.
To assess the anti-microbial capacity of RELMβ and SPRR2A, mouse L. murinus and mouse L. reuteri were grown to late-log (OD~1.0) in mMRS, pelleted by centrifugation (10,000 rpm, 2 minutes), and then washed in experimental buffer (10 mM MES, 25 mM NaCl, pH 5.5). Recombinant RELMβ (rRELMβ) or recombinant SPRR2A (rSPRR2A) were added to each bacterium (106 CFUs/mL) at 10 μM. Bacteria were incubated anaerobically (37°C, 1 hour), plated onto MRS agar plates at various dilutions, and incubated (37°C, overnight). Surviving CFUs were counted.
Bacterial Indole Production.
All isolates were recovered on and grown in pre-reduced media in a Coy anaerobic chamber (Coy Labs). B. ovatus ATCC 8483 WT, B. ovatus ATCC 8483 ΔtnaA, and Alistipes shahii DSM 19121 were grown (16 hours) in YBHIS media. This starter culture was then used to inoculate at a final dilution of 1:50 into an experimental media culture consisting of a modified YCFA (mYCFA) media supplemented with glucose (0.0625%) and tryptophan (0.5 mM) (mYCFA; casitone (10 g/L), yeast extract (2.5 g/L), cysteine (1 g/L), magnesium sulfate heptahydrate (f.c. 365 μM), calcium chloride dihydrate (f.c. 82 μM), sodium bicarbonate (4 g/L), dipotassium phosphate (0.45 g/L), monopotassium phosphate (0.45 g/L), sodium chloride (0.9 g/L), sodium acetate (2.71 g/L), Hemin (50 mg/L), Vitamin K1 (0.25 mg/L), ferrous sulfate (4 μg/mL), ATCC vitamin mix (1% v/v), ATCC mineral solution (1% v/v)). These cultures were incubated anaerobically at 37°C for 24 h. Each culture (1 mL) was centrifuged (21,000 rpm, 3 minutes, 21°C), and the supernatant (100 μL) was mixed with 250 μL of a fresh prepared DMACA solution (0.1 g p-Dimethylaminocinnamaldehyde (DMACA), 2.7 mL HCl (37%), 7.3 mL water). A calibration curve was constructed using the concentrations 0, 2.5, 5, 10, 25, 50, 100, 250, 500, 1000 μM indole. Mix solution (200 μL) was transfer into a 96 well plate and the optical density at 624 nanometers was measured with a Synergy|HTX spectrophotometer (BioTek Instruments).
Sample preparation for metabolite analysis.
To extract metabolites from fecal samples, 200 μL of 0.1 mm zirconia/silica beads (BioSpec Products) and 1 mL of organic solvent (methanol:water, 5:1) supplemented with internal standard (canonical amino acid mix (Cambridge Isotope Laboratories) at 250 nM in organic solvent (methanol:water, 1:1)) were added to 5–50 mg of pre-weighed fecal matter. Material was homogenized by vortexing at maximum speed for 30 seconds before mechanical disruption with a bead beater (BioSpec Products) 5 minutes on high setting at room temperature. Samples were subsequently incubated in an ultrasonicator for 5 minutes before incubation at −20°C overnight. Samples were subsequently thawed at room temperature before centrifugation (15,000 rpm, RT) for 5 minutes. 800 μL of supernatant was isolated from each sample for analysis by LC-MS.
LC-MS quantification of metabolites.
Samples for LC-MS analysis were prepared as described above. Samples were dried under nitrogen flow and resuspended in 40 μL of organic solvent (acetonitrile: water, 1:1). A standard curve was prepared using the same extraction solution as for the samples. The standard curve was prepared as an 8-points 1:5 dilution series with 10 μM as the highest concentration. Samples were analyzed on a QEplus mass spectrometer coupled to an Ultimate 3000 LC (Thermo Fisher). Chromotographic separation was performed on an Allure PFPP column (2 mm × 150 mm; Restek) maintained at 30°C. The mobile phases were A: H2O, 0.1% formic acid and B: acetonitrile, 0.1% formic acid. 5 μL of sample was injected and the following gradient was followed: 5% B and 0.2 mL/min flow for 4 minutes followed by a linear gradient to 100% B over 11 minute and 0.2 mL/min. 100% B was maintained for 5 minutes at 0.2 mL/min followed by re-equilibration at 5% B for 5 minutes. The orbitrap (ThermoFisher QE+) was operated in positive scanning mode (100 – 400 m/z) and the following source parameters: HESI Sheath gas 45, Aux gas 10, Sweep gas 2, Capillary 250°C, S-lens 50, Aux gas 250°C.
Metabolite Analyses.
Metabolite quantification was achieved using Tracefinder (Thermo Fisher), using the ratio of the area under the peak for each compound and of the internal standard, using the accurate mass of the [M+H]+ ions. To account for low-abundance chemical species (not found (N/F)) in downstream statistical analyses, all quantities of each metabolite (fmol/mg) were normalized by 1000x (fmol/g) and then a value of “1” was added to each quantity. For those low-abundance chemical species below the quantifiable limit (BQL), each compound’s limit of detection divided by two was used in all downstream statistical analyses.
Statistical Analyses.
Anaphylaxis-related core body temperature measurements were analyzed using repeat measures 2-way ANOVA with the indicated post-test analysis. Student unpaired 2-tailed t-tests were used for 2-group comparisons. For more than 2 groups, 1-way ANOVA with the indicated post-test analysis was used. Results are presented as means and SEMs, where each point represents 1 sample. In cases in which values were spread across multiple orders of magnitude, data were log-transformed for analysis with parametric tests.
Extended Data
Extended Data Fig. 1 |. RELMβ directs the gut epithelial AMP response in synergy with IL-13.
a, Heat-map of gene transcripts of SI epithelial cells isolated from OVA-SEB sensitized WT, Il4raF709, and Il4raF709Retnlb−/− mice (n=3/group). b, Relative expression of Retnlb, Sprr2a, Reg3a and Reg3b transcripts in SI tissue of WT, FA-prone Il4raF709, and FA-resistant Il4raF709Retnlb−/− mice (n=4/group). c, Relative expression of host AMP transcripts (Sprr2a, Reg3a, Reg3b) from qPCR analysis of small intestinal epithelial cells from mice treated with recombinant RELMβ (n=4) or vehicle (n=3). d, Relative expression of Retnlb in organoids derived from Il4raF709 mice or Il4raF709VilCreRetnlbΔ/Δ mice treated with media, rRELMβ, IL-13, and rRELMβ + IL-13 (n=6 or 8/condition). e, Relative expression of Sprr2a in organoids derived from Il4raF709 mice or Il4raF709VilCreRetnlbΔ/Δ mice treated with media, rRELMβ, IL-13, and rRELMβ + IL-13 (n=6 or 8/condition). f, Immunofluorescent microscopic imaging of organoids derived from WT mice treated with media, rRELMβ, IL-13, and rRELMβ + IL-13. g, Immunofluorescent microscopic imaging of organoids derived from Il4raF709 mice treated with media, rRELMβ, IL-13, and rRELMβ + IL-13. h, Immunofluorescent microscopic imaging of organoids derived from Il4raF709VilCreRetnlbΔ/Δ mice treated with media, rRELMβ, IL-13, and rRELMβ + IL-13. Data represent two independent experiments. i, Quantification of RELMβ in organoids derived from WT (n=5,14,12 and 17)., Il4raF709 (n=11,23,21 and 17), or Il4raF709VilCreRetnlbΔ/Δ (n=6,8,7 and 9) mice treated with media, rRELMβ, IL-13, and rRELMβ + IL-13. j, Relative expression of RETNLB in organoids derived from healthy humans treated with media, human rRELMβ, IL-13, and human rRELMβ + IL-13 (n=10, 9 and 10). k, Relative expression of SPRR2A in organoids derived from healthy humans treated with media, human rRELMβ, IL-13, and human rRELMβ + IL-13 (n=10/group). l, m, Flow cytometric analysis and frequency of Tconv cells (l) or Treg (m) IL-4+ and IL-13+ CD4+ T cell populations from SI-LPL of Il4raF709Retnlb−/− and Il4raF709 mice. For a–e,i–k, data are mean ± s.e.m. Statistical analysis was performed using unpaired two-tailed t-tests (c), one-way ANOVA (d,e,i) with Tukey’s (i), Šídák’s (d,e), or Dunn’s (j,k) post hoc tests, or repeat measure two-way ANOVA (b) with Tukey’s (b) post hoc test.
Extended Data Fig. 2 |. Retnlb promotes the generation of high affinity anaphylactic IgE.
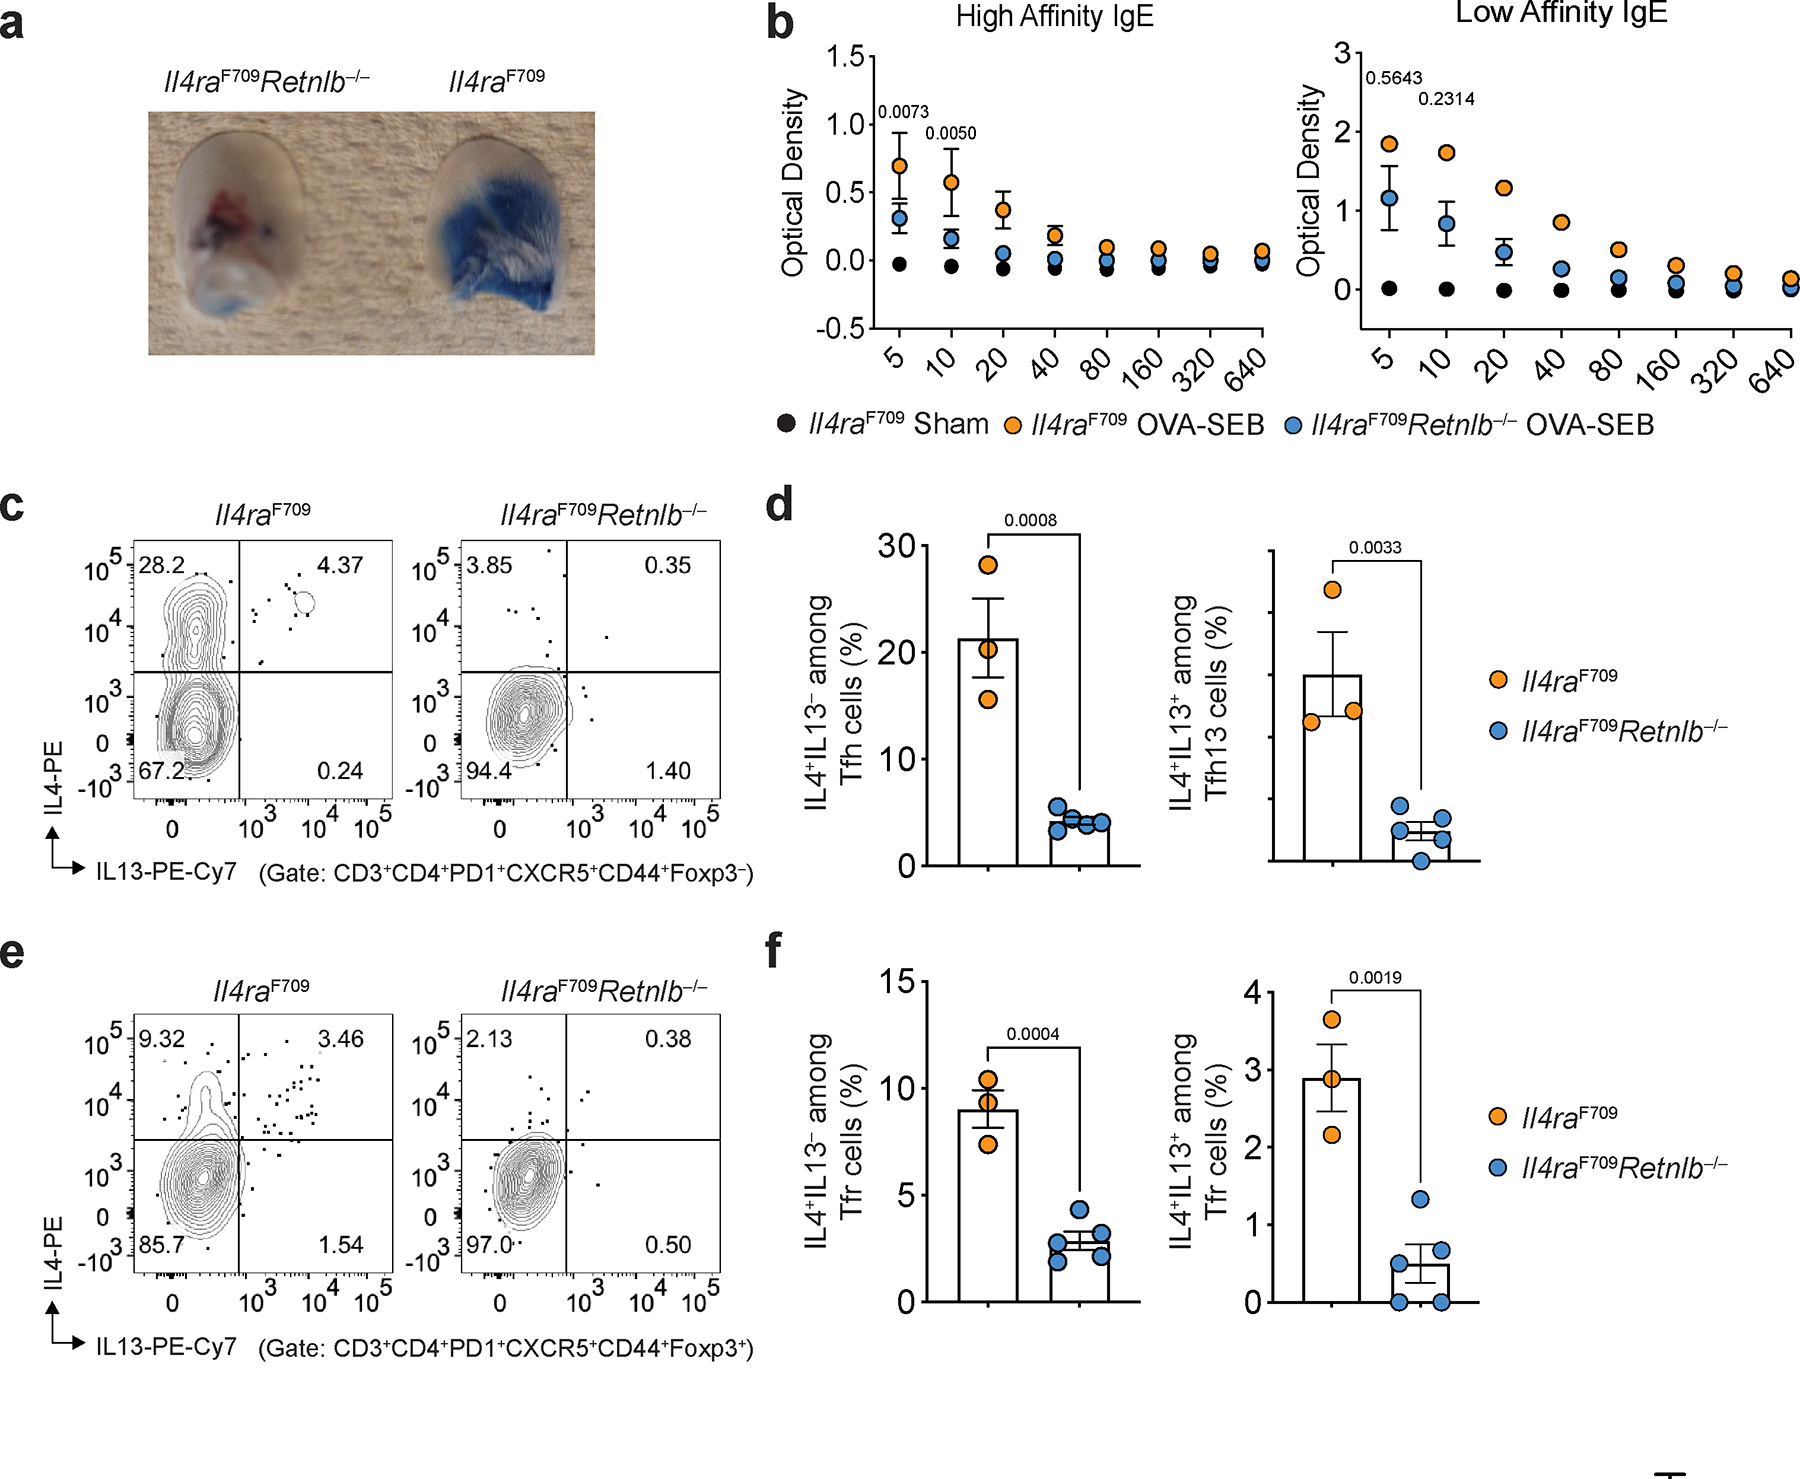
a, Differential extravasation of Evan’s blue dye into the earlobes of naïve BALB/c mice that received serum from FA-prone, OVA-SEB sensitized Il4raF709 or FA-protected Il4raF709Retnlb−/− and were then challenged with OVA. b, Quantification of high- versus low-affinity IgE from Il4raF709 (n=5) or Il4raF709Retnlb−/− (n=4) mice immunized with house dust mite extract plus OVA, or Il4raF709 mice treated with vehicle (n=3). c, d, Flow cytometric analysis (c) and cell frequencies of small intestinal IL-4+ and IL-4+IL-13+ cells among Tfh cells from Il4raF709 and Il4raF709Retnlb−/− mice (n=3 and 5) (d). e, f, Flow cytometric analysis (e) and cell frequencies of small intestinal IL-4+ and IL-4+IL-13+ cells among Tfr cells from Il4raF709 and Il4raF709Retnlb−/− mice (n=3 and 5) (f). For a–f, data are mean ± s.e.m. Statistical analysis was performed using unpaired two-tailed t-tests (d,f) or repeat measure two-way ANOVA (b) with Šídák’s (b) post hoc test.
Extended Data Fig. 3 |. Retnlb-deficient mice are protected from FA in an epicutaneous model.
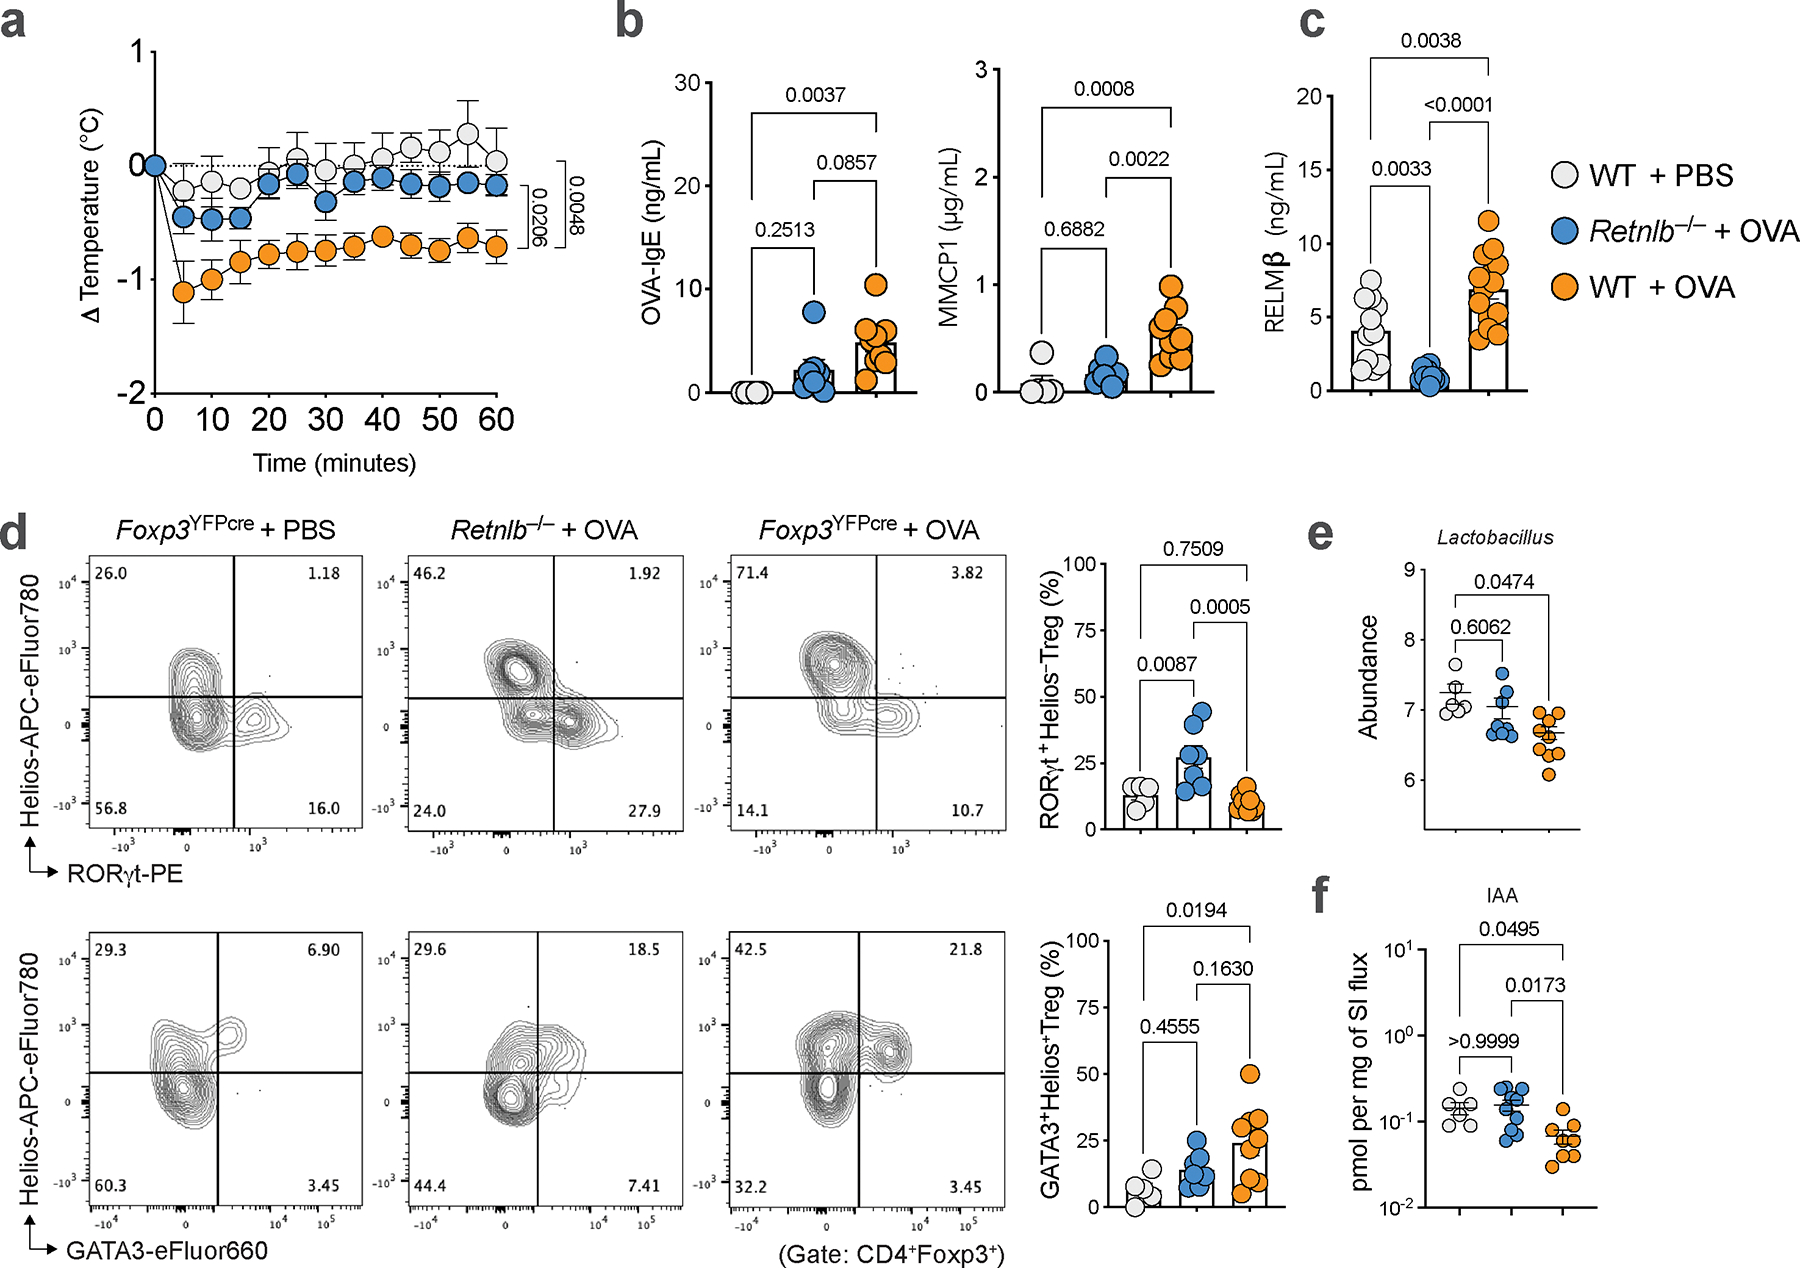
a, Core body temperature changes in WT mice epicutaneously sensitized with either PBS (n=5) or OVA (n=9) and Retnlb−/− (n=9) mice epicutaneously sensitized with OVA. b, Serum OVA-IgE concentrations, MMCP1 concentrations (n=5,9 and 7). c, Serum RELMβ concentrations (n=11,14 and 10). d, Flow cytometric analysis and frequencies of small intestinal RORγt+ Treg cells (n=5,8 and 7) or GATA3+ Treg cells (n=5,9 and 7). e, Abundance of small intestinal Lactobacilli in mice from (a) (n=6,9 and 8). f, Quantity of small intestinal indole-3-acetic acid (IAA) (n=6, 8 and 10). For a–f, data are mean ± s.e.m. Statistical analysis was performed using unpaired one-way ANOVA (b–f) with Tukey’s (b-d), Dunnett’s (e), and Dunn’s (f) post hoc tests, or repeat measure two-way ANOVA (a) with Tukey’s (a) post hoc test.
Extended Data Fig. 4 |. Intestinal epithelial cell derived RELMβ is essential for loss of tolerance in FA.
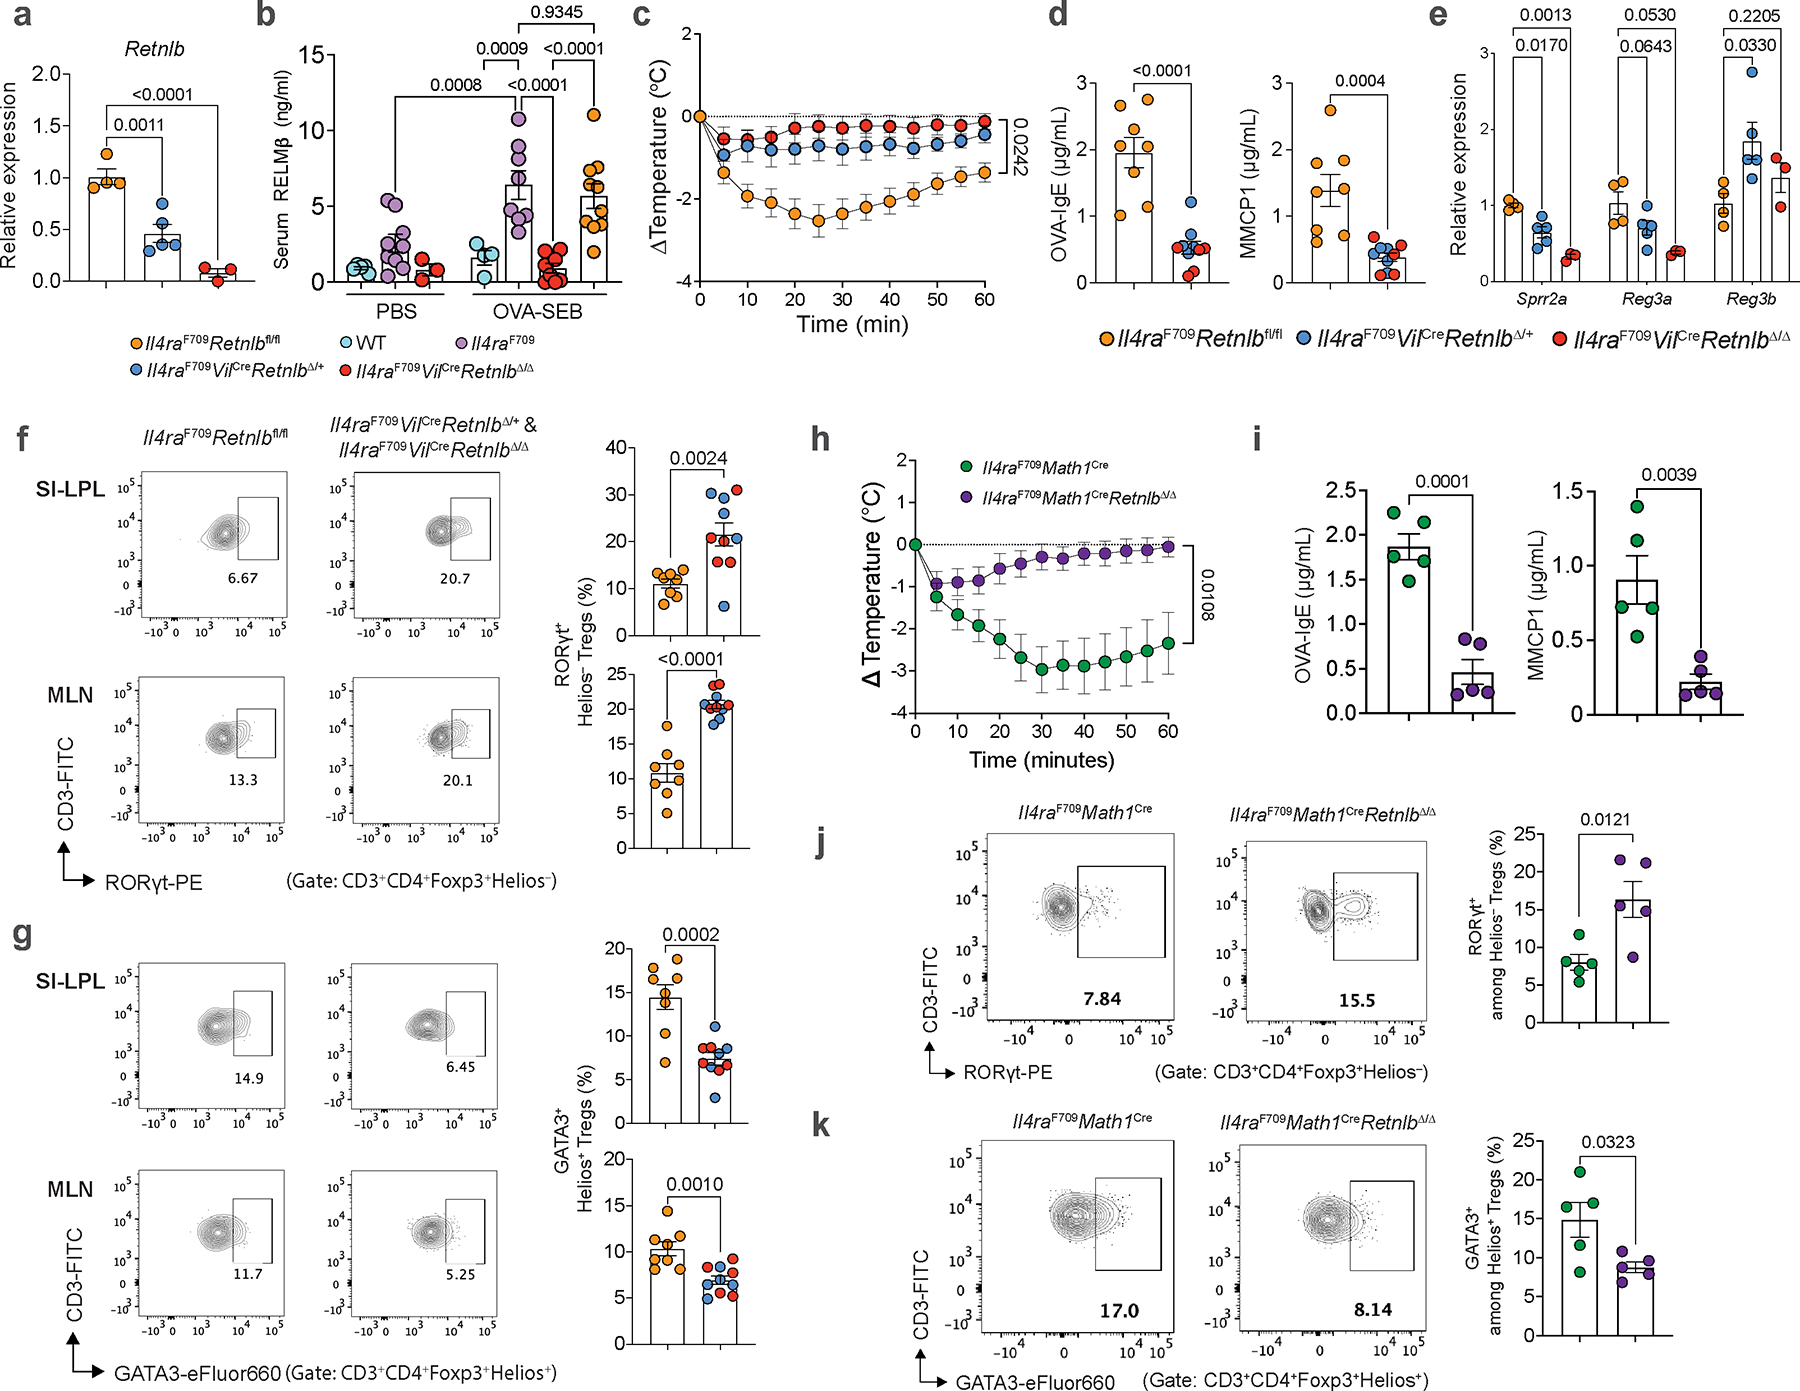
a, Relative expression of Retnlb from qPCR analysis of small intestinal tissue from Il4raF709Retnlbfl/fl (n=4), Il4raF709VilCreRetnlbΔ/+ (n=5) and Il4raF709VilCreRetnlbΔ/Δ (n=3) mice. b, Serum levels of RELMβ in sham (PBS)-sensitized WT, Il4raF709, Il4raF709VilCreRetnlbΔ/Δ mice (n=5, 9, 3) or OVA-SEB sensitized WT, Il4raF709, Il4raF709VilCreRetnlbΔ/Δ and Il4raF709Retnlbfl/fl mice (n=4, 8, 8 and 10), as determined by ELISA. c, Core body temperature changes in OVA-SEB sensitized and challenged Il4raF709Retnlbfl/fl (n=7), Il4raF709VilCreRetnlbΔ/+ (n=5) and Il4raF709VilCreRetnlbΔ/Δ mice (n=5). d, Serum OVA-specific IgE concentrations and MMCP1 concentrations (n=8 and 10). e, Relative expression of host AMP transcripts (Sprr2a, Reg3a, Reg3b) from qPCR analysis of small intestinal tissue from Il4raF709Retnlbfl/fl (n=4), Il4raF709VilCreRetnlbΔ/+ (n=5) and Il4raF709VilCreRetnlbΔ/Δ (n=3) mice. f, g, Flow cytometric analysis (f, g) and frequencies of Helios−RORγt+ (f) or Helios+GATA3+ Treg cells (g) from SI-LPL or MLN (n= 8 and 10). h, Core body temperature changes in OVA-SEB sensitized and OVA-challenged Il4raF709Math1Cre and Il4raF709Math1CreRetnlbΔ/Δ mice (n=5/group). i, Serum OVA-specific IgE concentrations and MMCP1 concentrations of mice in (n=5/group) (h). j, k, Flow cytometric analysis and frequencies of small intestinal Helios−RORγt+ Treg cells (j) or Helios+GATA3+ (k) of mice in (h) (n=5/group). For a-k, data are mean ± s.e.m. Statistical analysis was performed using unpaired two-tailed t-tests (a,d–g,i–k), one-way ANOVA with Šídák’s (b), or repeat measure two-way ANOVA (c,h) with Šídák’s (c,h) post hoc tests.
Extended Data Fig. 5 |. Goblet cell derived RELMβ is required for loss of tolerance in FA.
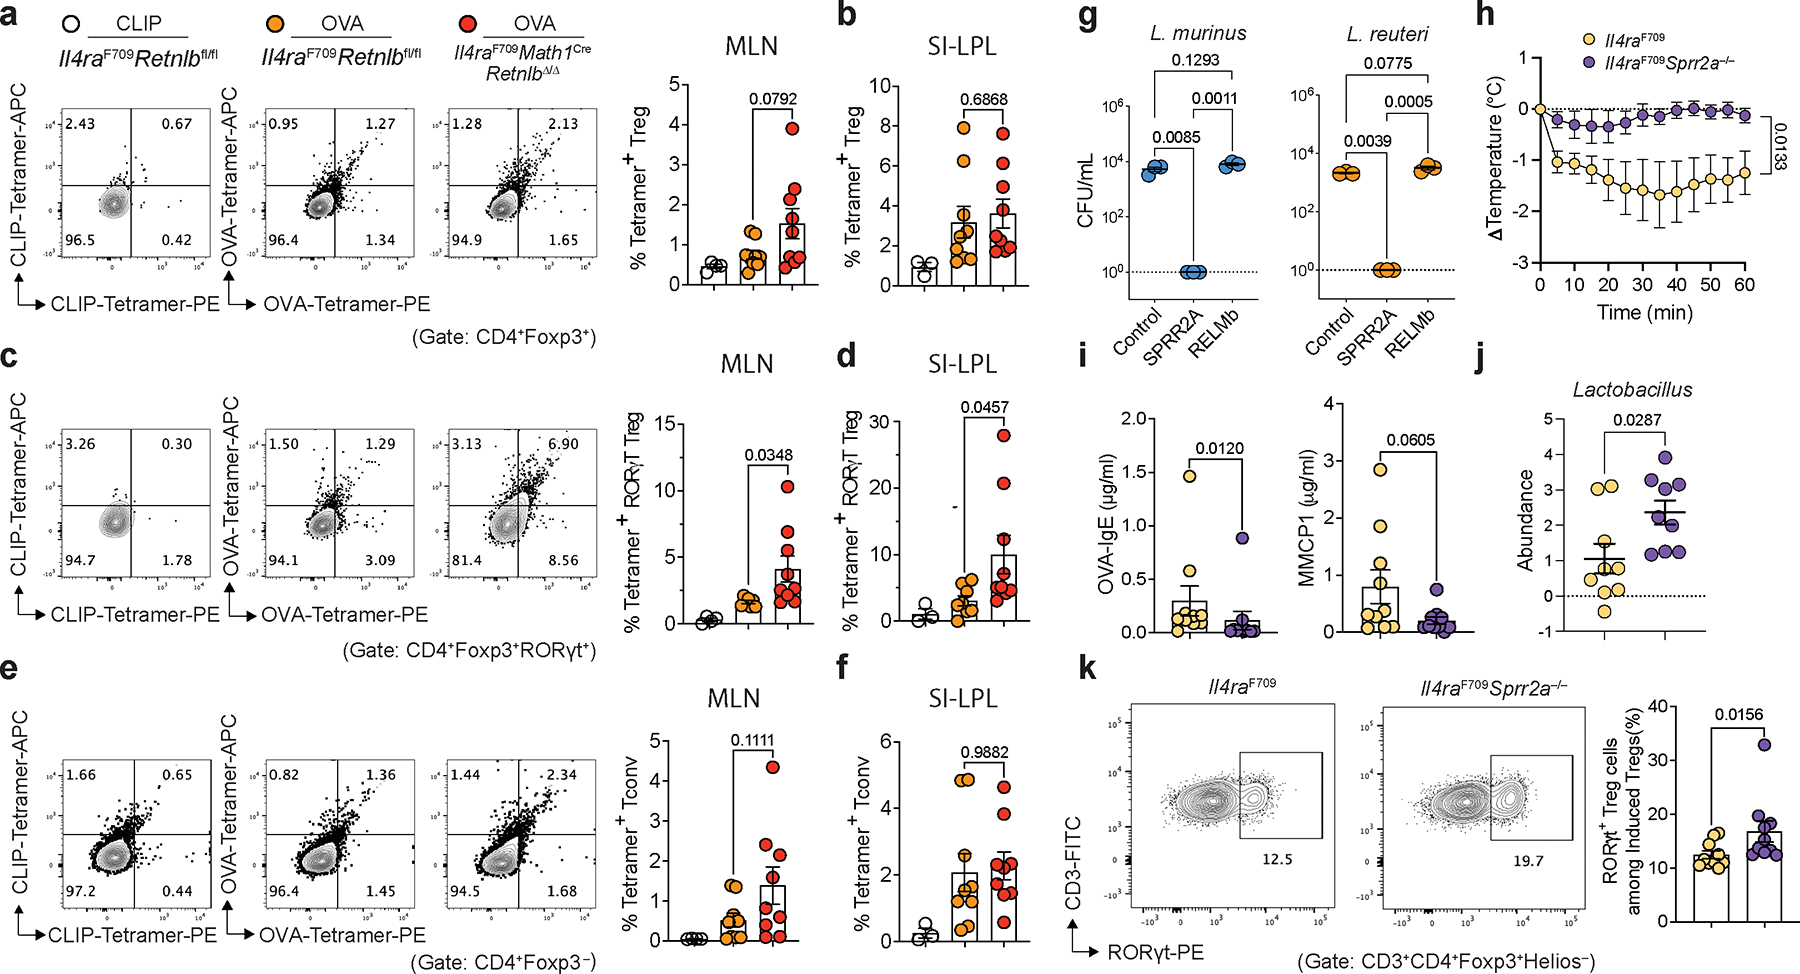
a,b, Flow cytometric analysis and frequencies of CLIP103–117I-Ab in Il4raF709Retnlbfl/fl (n=4) or OVA323–339I-Ab tetramer staining in Il4raF709Retnlbfl/fl OVA-SEB-sensitized mice (n=9) vs. Il4raF709Math1CreRetnlbΔ/Δ OVA-SEB-sensitized mice (n=9) in MLN CD4+Foxp3+ Treg cells (a), and the respective frequencies in SI-LPL CD4+Foxp3+ Treg cells (n=3, 9 and 9) (b). c,d, Flow cytometric analysis and frequencies of CLIP103–117I-Ab in Il4raF709Retnlbfl/fl (n=4) or OVA323–339I-Ab tetramer staining in Il4raF709Retnlbfl/fl OVA-SEB-sensitized mice (n=7) vs. Il4raF709Math1CreRetnlbΔ/Δ OVA-SEB-sensitized mice (n=9) in MLN Foxp3+RORγt+ Treg cells (c) and the respective frequencies in SI-LPL Foxp3+RORγt+ Treg cells (n=3, 8 and 9) (d). e,f, Flow cytometric analysis and frequencies of CLIP103–117I-Ab in Il4raF709Retnlbfl/fl (n=4) or OVA323–339I-Ab tetramer staining in Il4raF709Retnlbfl/fl (n=9) vs. Il4raF709Math1CreRetnlbΔ/Δ (n=9) in MLN CD4+Foxp3−Tconv cells (e) and the respective frequencies in SI-LPL CD4+Foxp3−Tconv cells (n=3, 9 and 9) (f). g, Antimicrobial activity of PBS, rSPRR2A, or rRELMβ on mouse L. murinus and mouse L. reuteri (n=3/condition). h, Core body temperature changes in OVA-SEB sensitized and OVA-challenged Il4raF709 and Il4raF709Sprr2a−/− mice (n=10/group). i, Serum OVA-specific IgE concentrations and MMCP1 concentrations of mice in (e) (n=10/group). j, Relative fold abundance of Lactobacilli in Il4raF709 and Il4raF709Sprr2a−/− mice post OVA-SEB sensitization and OVA-challenge (normalized against Lactobacilli in Il4raF709 mice at baseline) (n=9/group). k, Flow cytometric analysis and frequency of MLN RORγt+ Treg cells of mice in (h) (n=10/group). For a–k, data are mean ± s.e.m. Statistical analysis was performed using unpaired two-tailed t-tests (a-f; i–k), one-way ANOVA with Tukey (g), or repeat measure two-way ANOVA with Šídák’s (h) post hoc test.
Extended Data Fig. 6 |. Microbiome-derived indole derivatives are associated with protection from food allergy.
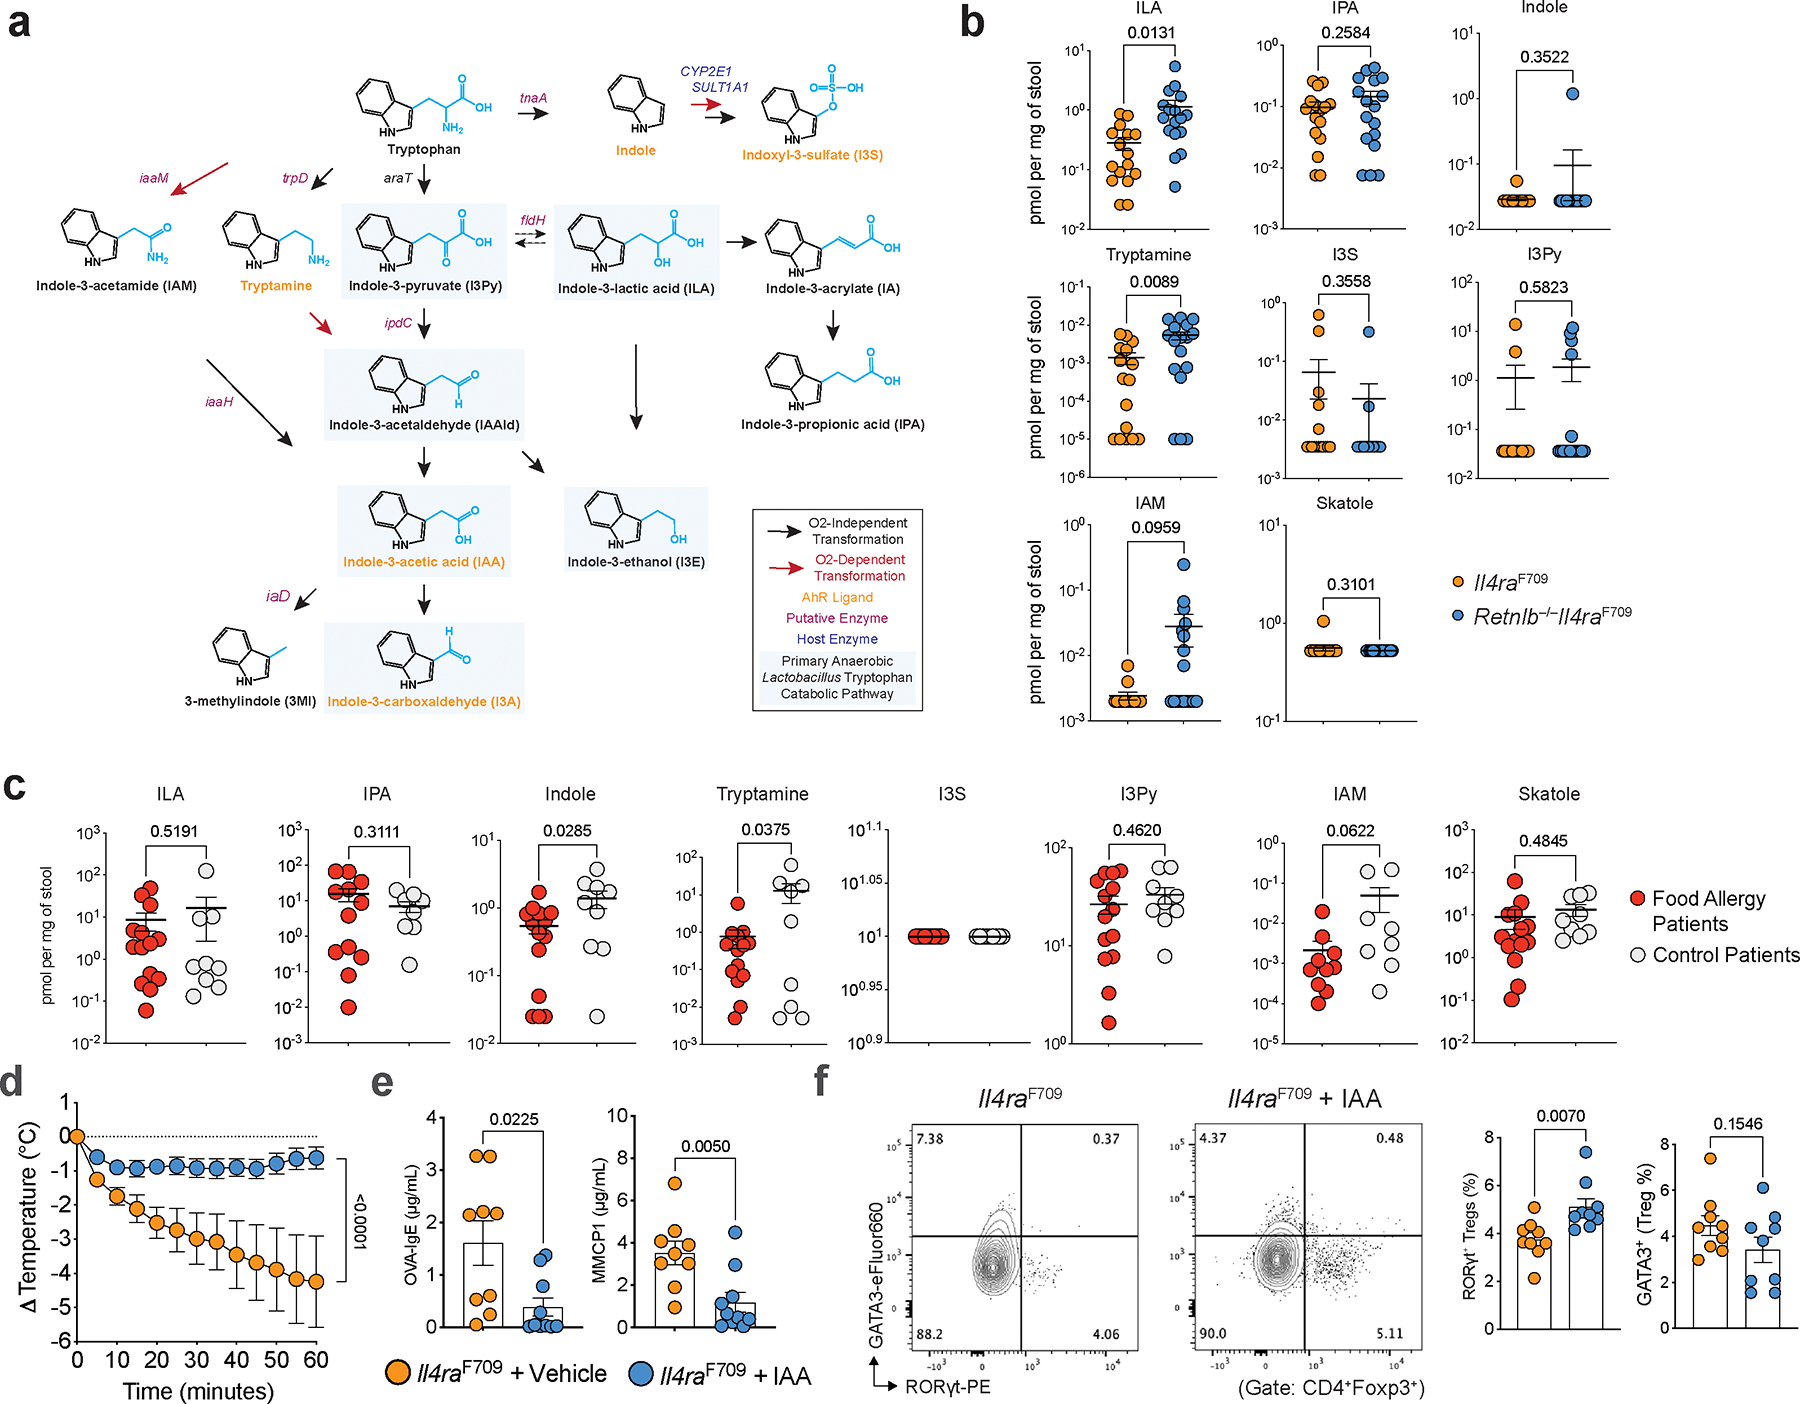
a, Putative enteric tryptophan catabolic pathway(s) and primary Lactobacillus tryptophan catabolic pathway highlighted in blue. b, Quantities of gut bacterial- and host-derived indole derivatives including indole-lactic acid (ILA), indole-3-propionic acid (IPA), indole, tryptamine, indoxyl-3-sulfate (I3S), indole-3-pyruvic acid (I3Py), indole-3-acetamide (IAM), skatole (3MI) in stool of OVA-SEB sensitized Il4raF709 (n=16) vs. Il4raF709Retnlb−/− (n=17) mice. c, Quantities of gut bacterial- and host-derived indole derivatives including indole-lactic acid (ILA), indole-3-propionic acid (IPA), indole, tryptamine, indoxyl-3-sulfate (I3S), indole-3-pyruvic acid (I3Py), indole-3-acetamide (IAM), skatole (3MI) in stool of control patients (n=14) or patients with food allergy (n=8 or 9). d, Core body temperature changes in OVA-SEB sensitized and OVA-challenged Il4raF709 mice treated with vehicle (n=9) or indole-3-acetic acid (IAA) (n=10). e, Serum OVA-specific IgE concentrations and MMCP1 concentrations in both groups (n=9 and 10) (d). f, Flow cytometric analysis and frequencies of small intestinal RORγt+ and GATA3+ Treg cells (d) (n=9/group). For b–f, data are mean ± s.e.m. Statistical analysis was performed using unpaired two-tailed t-tests (b,c,e,f) or repeat measure two-way ANOVA (d) with Šídák’s (d) post-hoc test.
Extended Data Fig. 7 |. Genetic manipulation of tryptophan catabolism in L. reuteri.
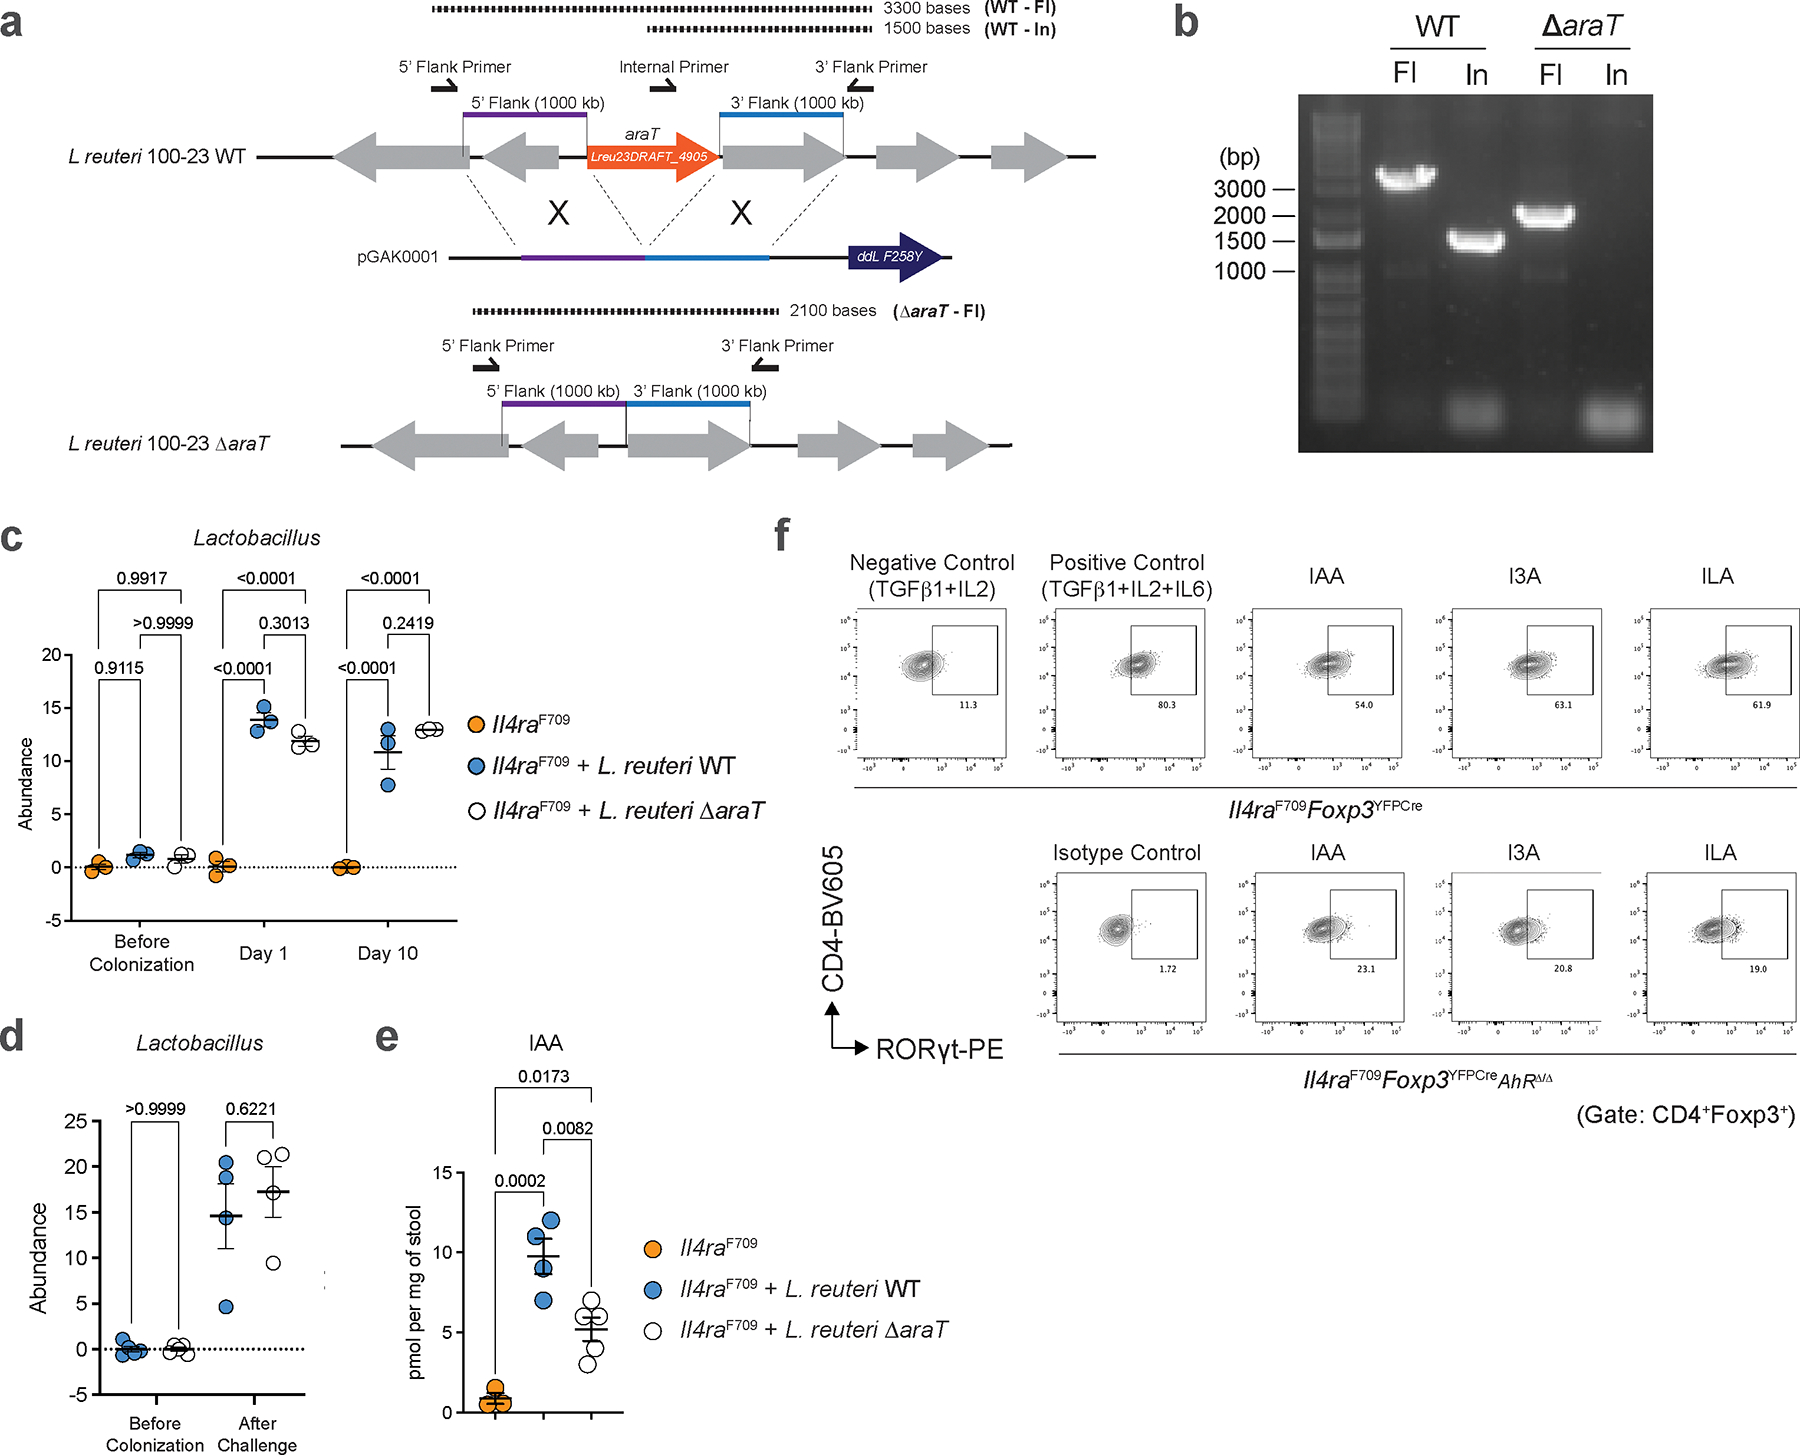
a, Genomic structure of the aromatic amino acid aminotransferase gene Lreu23DRAFT_4905 of L. reuteri 100–23 WT, the targeting vector (pGAK0001) containing the ddL-F258Y counter-selection system, and the resulting mutant (L. reuteri 100–23 ΔaraT) generated by homologous recombination. b, PCR analysis of genomic DNA from L. reuteri 100–23 WT and L. reuteri 100–23 ΔaraT using one pair of primers flanking the targeted deletion region and another pair of primers internal to the targeted deletion region. Data represent at least two independent gene deletion confirmations. c, relative colonization of L. reuteri WT and L. reuteri ΔaraT in Il4raF709 BALB/c mice before colonization and at days 1 and 10 post gavage (n=3/group). d, Relative colonization of L. reuteri WT and L. reuteri ΔaraT in Il4raF709 BALB/c mice before colonization (n=5/group) and after OVA-SEB sensitization and challenge (n=4/group). e, Quantity of small intestinal indole-3-acetic acid (IAA) in mice treated with vehicle (n=3) or colonized with L. reuteri WT (n=4) or L. reuteri ΔaraT (n=5) post OVA-SEB sensitization and challenge. f, Flow cytometric analysis of RORγt+ Treg cells from naïve WT T cells or naïve AhRΔ/Δ T cells stimulated with a positive differentiation cocktail (anti-CD3, anti-CD28, IL-2, TGF-β1, IL-6), negative differential cocktail (positive control minus IL-6), or negative differentiation cocktail supplemented with the indicated indole derivatives. For c-e, data are mean ± s.e.m. Statistical analysis was performed using one-way ANOVA (c-e) with Šídák’s post hoc test (c-e).
Extended Data Fig. 8 |. Indole production by immunomodulatory human bacteria protects against FA.
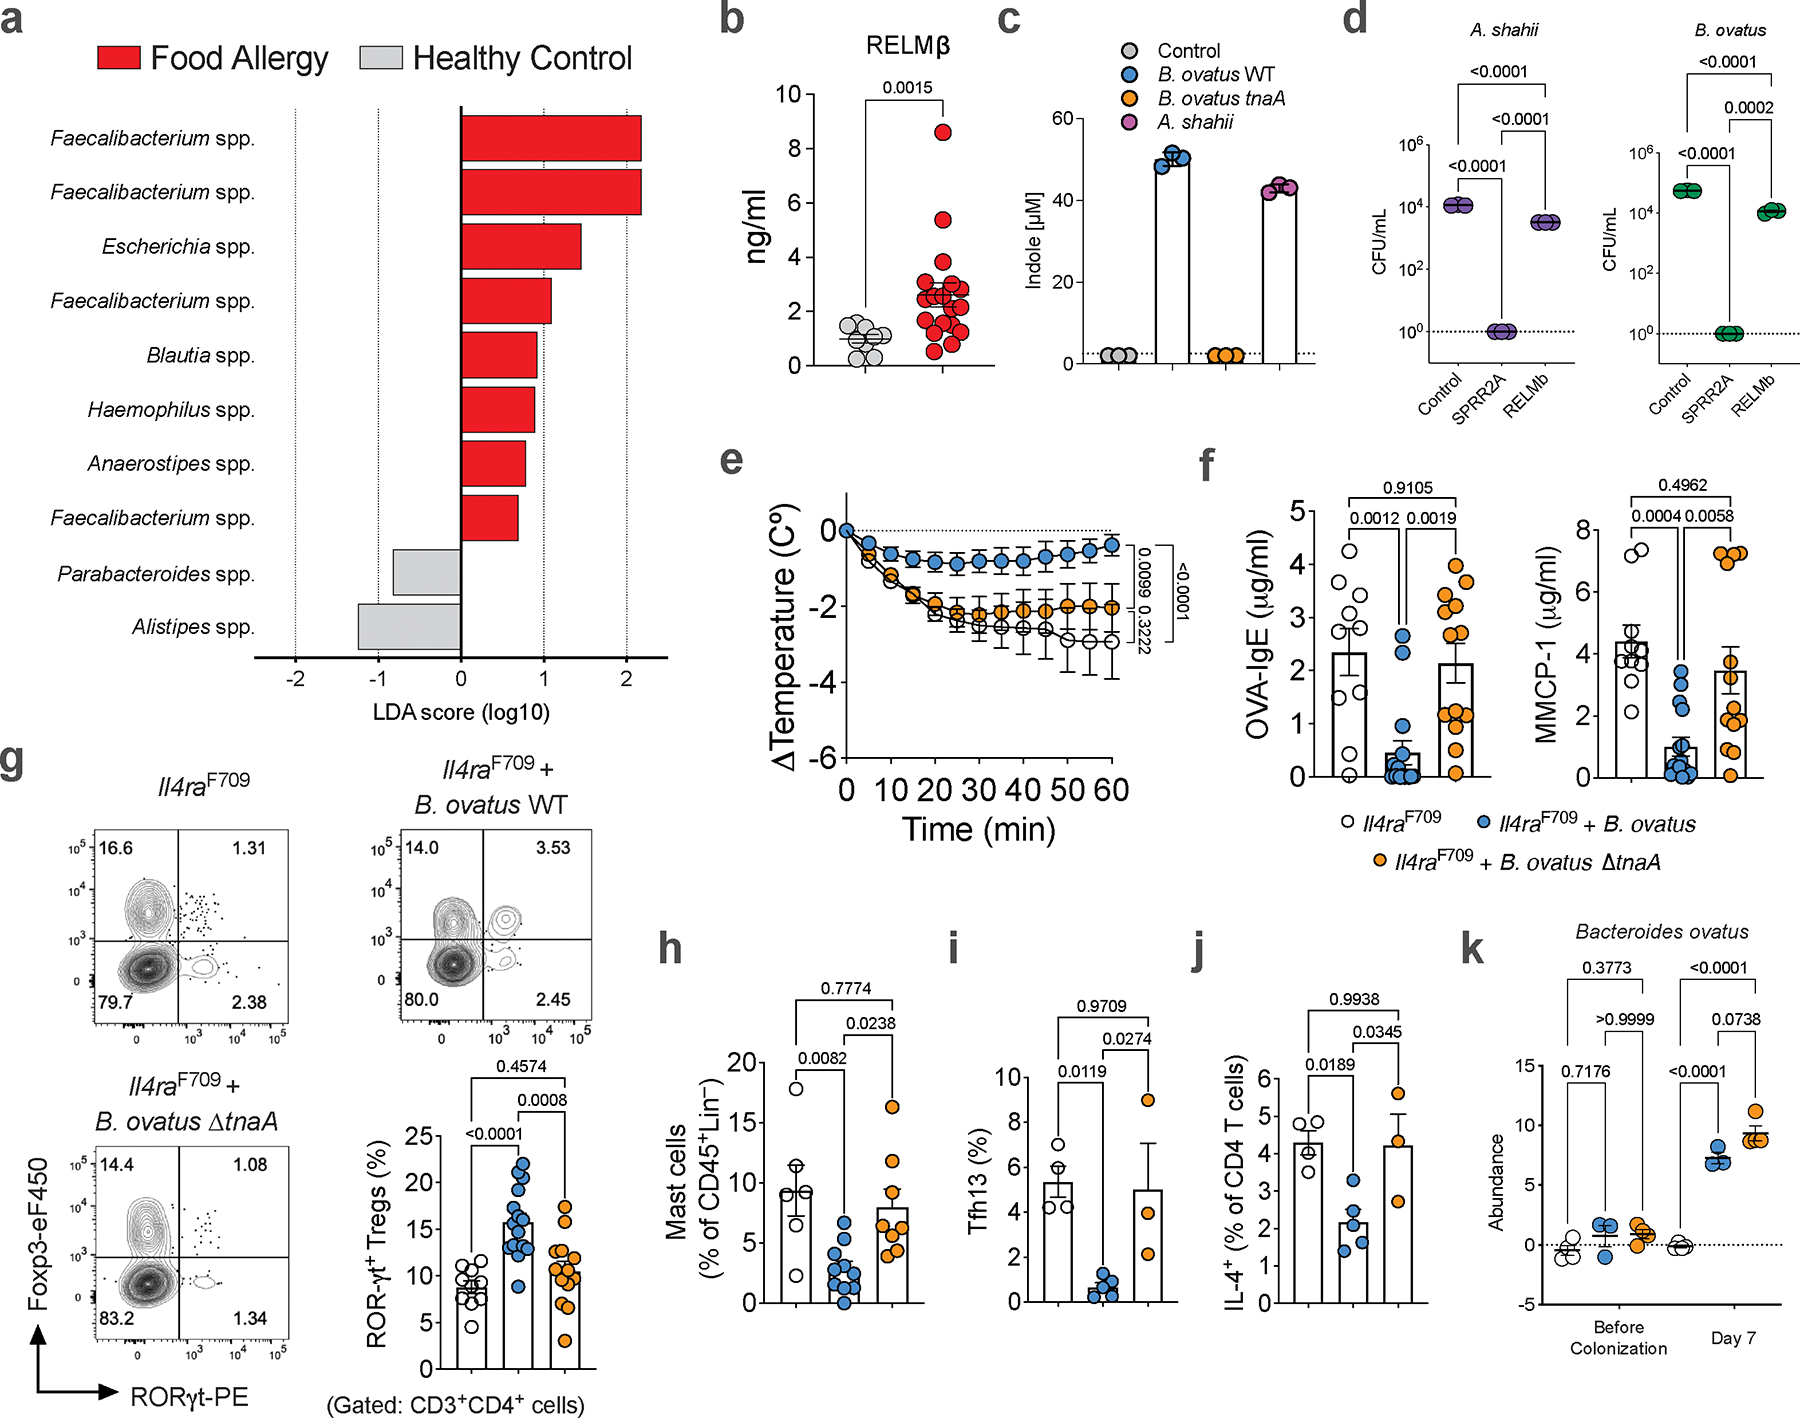
a, OTU-level comparison of gut microbiota in control patients (n=10) versus food allergy patients (n=18). b, Serum RELMβ concentrations in control patients (n=10) versus food allergy patients (n=18). c, Indole production by wild-type B. ovatus, B. ovatus ΔtnaA, A. shahii all versus mock (media) (n=3/condition). d, Antimicrobial activity of mock (experimental media), rSPRR2A, or rRELMβ on A. shahii and B. ovatus (n=3/condition). e, Core body temperature changes in OVA-SEB sensitized and OVA-challenged WT mice treated with vehicle, B. ovatus WT, and B. ovatus ΔtnaA (n=10, 15 and 13). f, Serum OVA-IgE concentrations and MMCP1 concentrations (n=10, 15 and 13). g, Flow cytometric analysis and frequencies of small intestinal RORγt+ Treg cells (n=10, 15 and 13). h, Flow cytometric frequency of mast cells (n=5,10 and 8). i, j, Flow cytometric analysis and cell frequencies of small intestinal Tfh13 cells (i) and IL-4+ CD4+ small intestinal T cells (j) (n=4,5 and 3). k, Relative colonization of B. ovatus WT and B. ovatus ΔtnaA in WT BALB/c mice before colonization and at day 7 post gavage (n=4,3 and 4/group). For b-k, data are mean ± s.e.m. Statistical analysis was performed using linear discriminant analysis effect size (LEfSe) with an alpha level of 0.1 and a logarithmic LDA score of 0.5 (a), unpaired two-tailed t-test (b), one-way ANOVA with Tukey’s (d,f-k) post hoc test, or repeat measure two-way ANOVA (e) with Šídák’s (e) post hoc test.
Extended Data Fig. 9 |. Parental microbiome transmission protects against FA development.
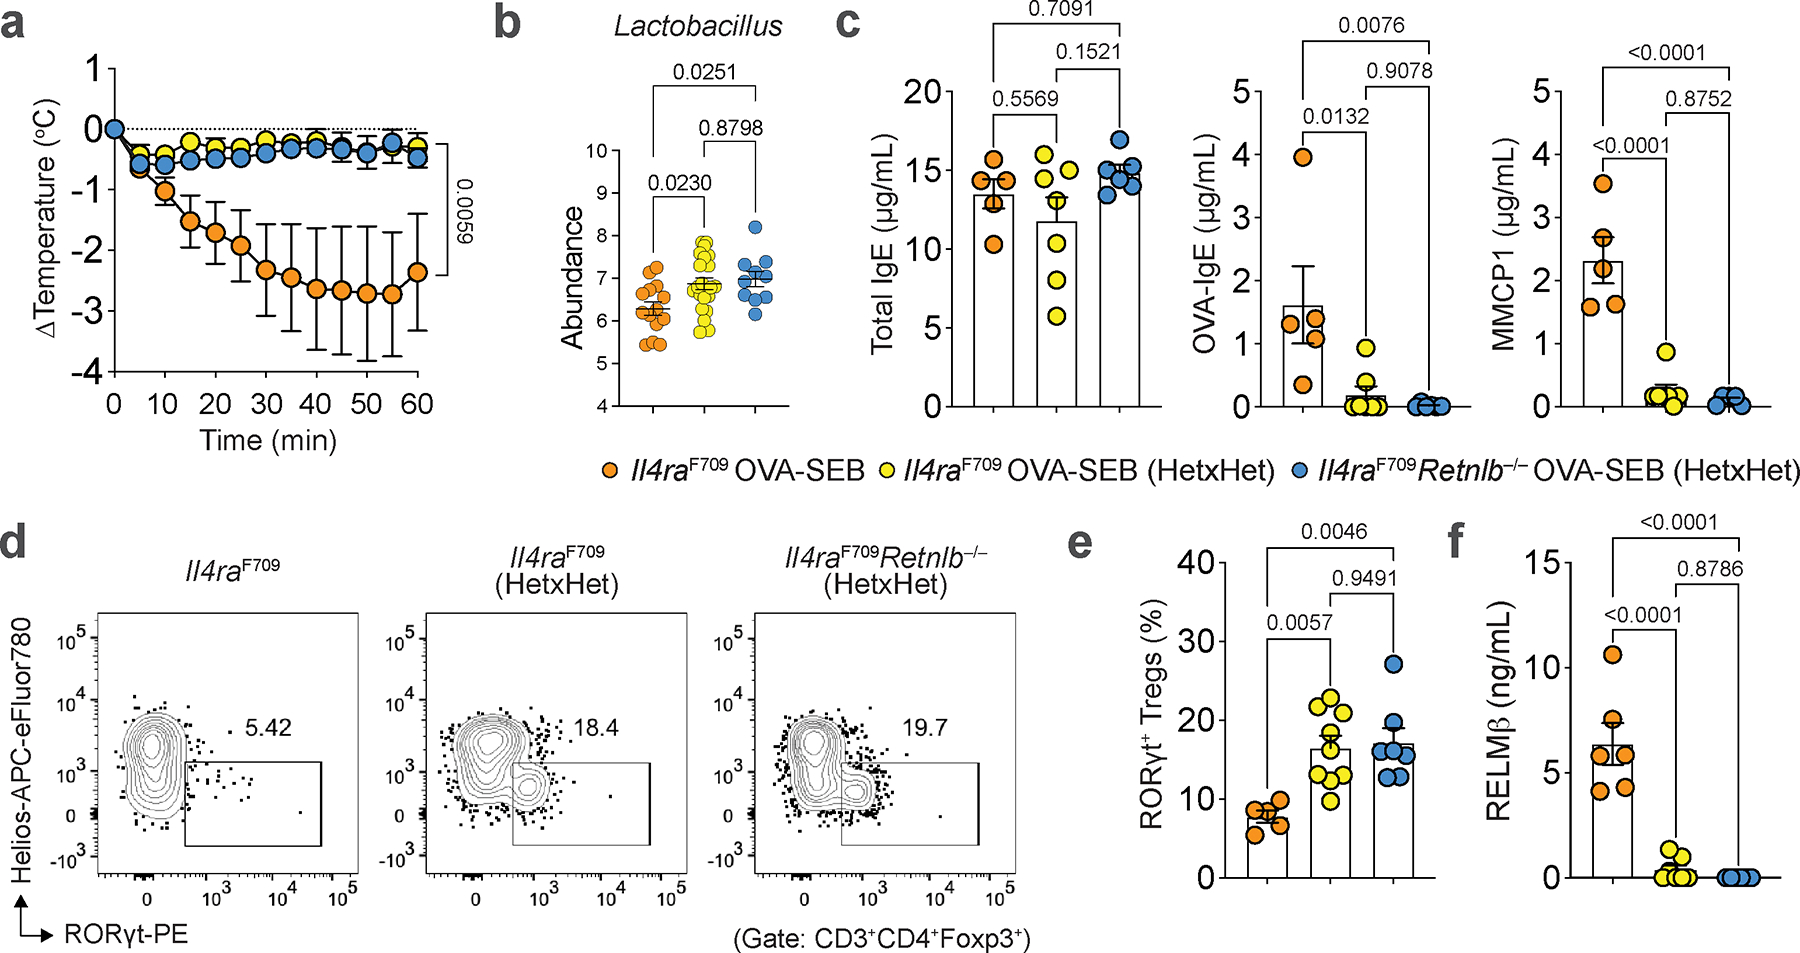
a, Core body temperature changes in Il4raF709 mice (n=8), Il4raF709 mice derived from Il4raF709Retnlb−/+ × Il4raF709Retnlb−/+ cross (n=11), or Il4raF709Retnlb−/− mice derived from Il4raF709Retnlb−/+ × Il4raF709Retnlb−/+ cross (n=8) sensitized with OVA-SEB and challenged with OVA. b, Lactobacillus genus abundance in OVA-SEB sensitized mouse groups represented in (a): Il4raF709 mice (n=14, same mice as in Fig. 3a), Il4raF709 mice derived from Il4raF709Retnlb−/+ × Il4raF709Retnlb−/+ cross (n=22), or Il4raF709Retnlb−/− mice derived from Il4raF709Retnlb−/+ × Il4raF709Retnlb−/+ cross (n=10). c, Serum total IgE concentrations (n=5,7 and 6), OVA-specific IgE concentrations (n=5,7 and 6), and MMCP1 concentrations (n=5,7 and 5). d, e, Flow cytometric analysis (d) and frequency of small intestinal RORγt+ Treg cells (e) (n=5,9 and 7). f, Serum concentration of RELMβ (ng/mL) (n=6,7 and 6). For a–f, data are mean ± s.e.m. Statistical analysis was performed using one-way ANOVA (b,c,e,f) with Tukey’s (b,c,e,f) post hoc test, or repeat measure two-way ANOVA (a) with Tukey’s (a) post hoc test.
Extended Data Fig. 10 |. Therapeutic antagonism of RELMβ in adulthood suppresses FA.
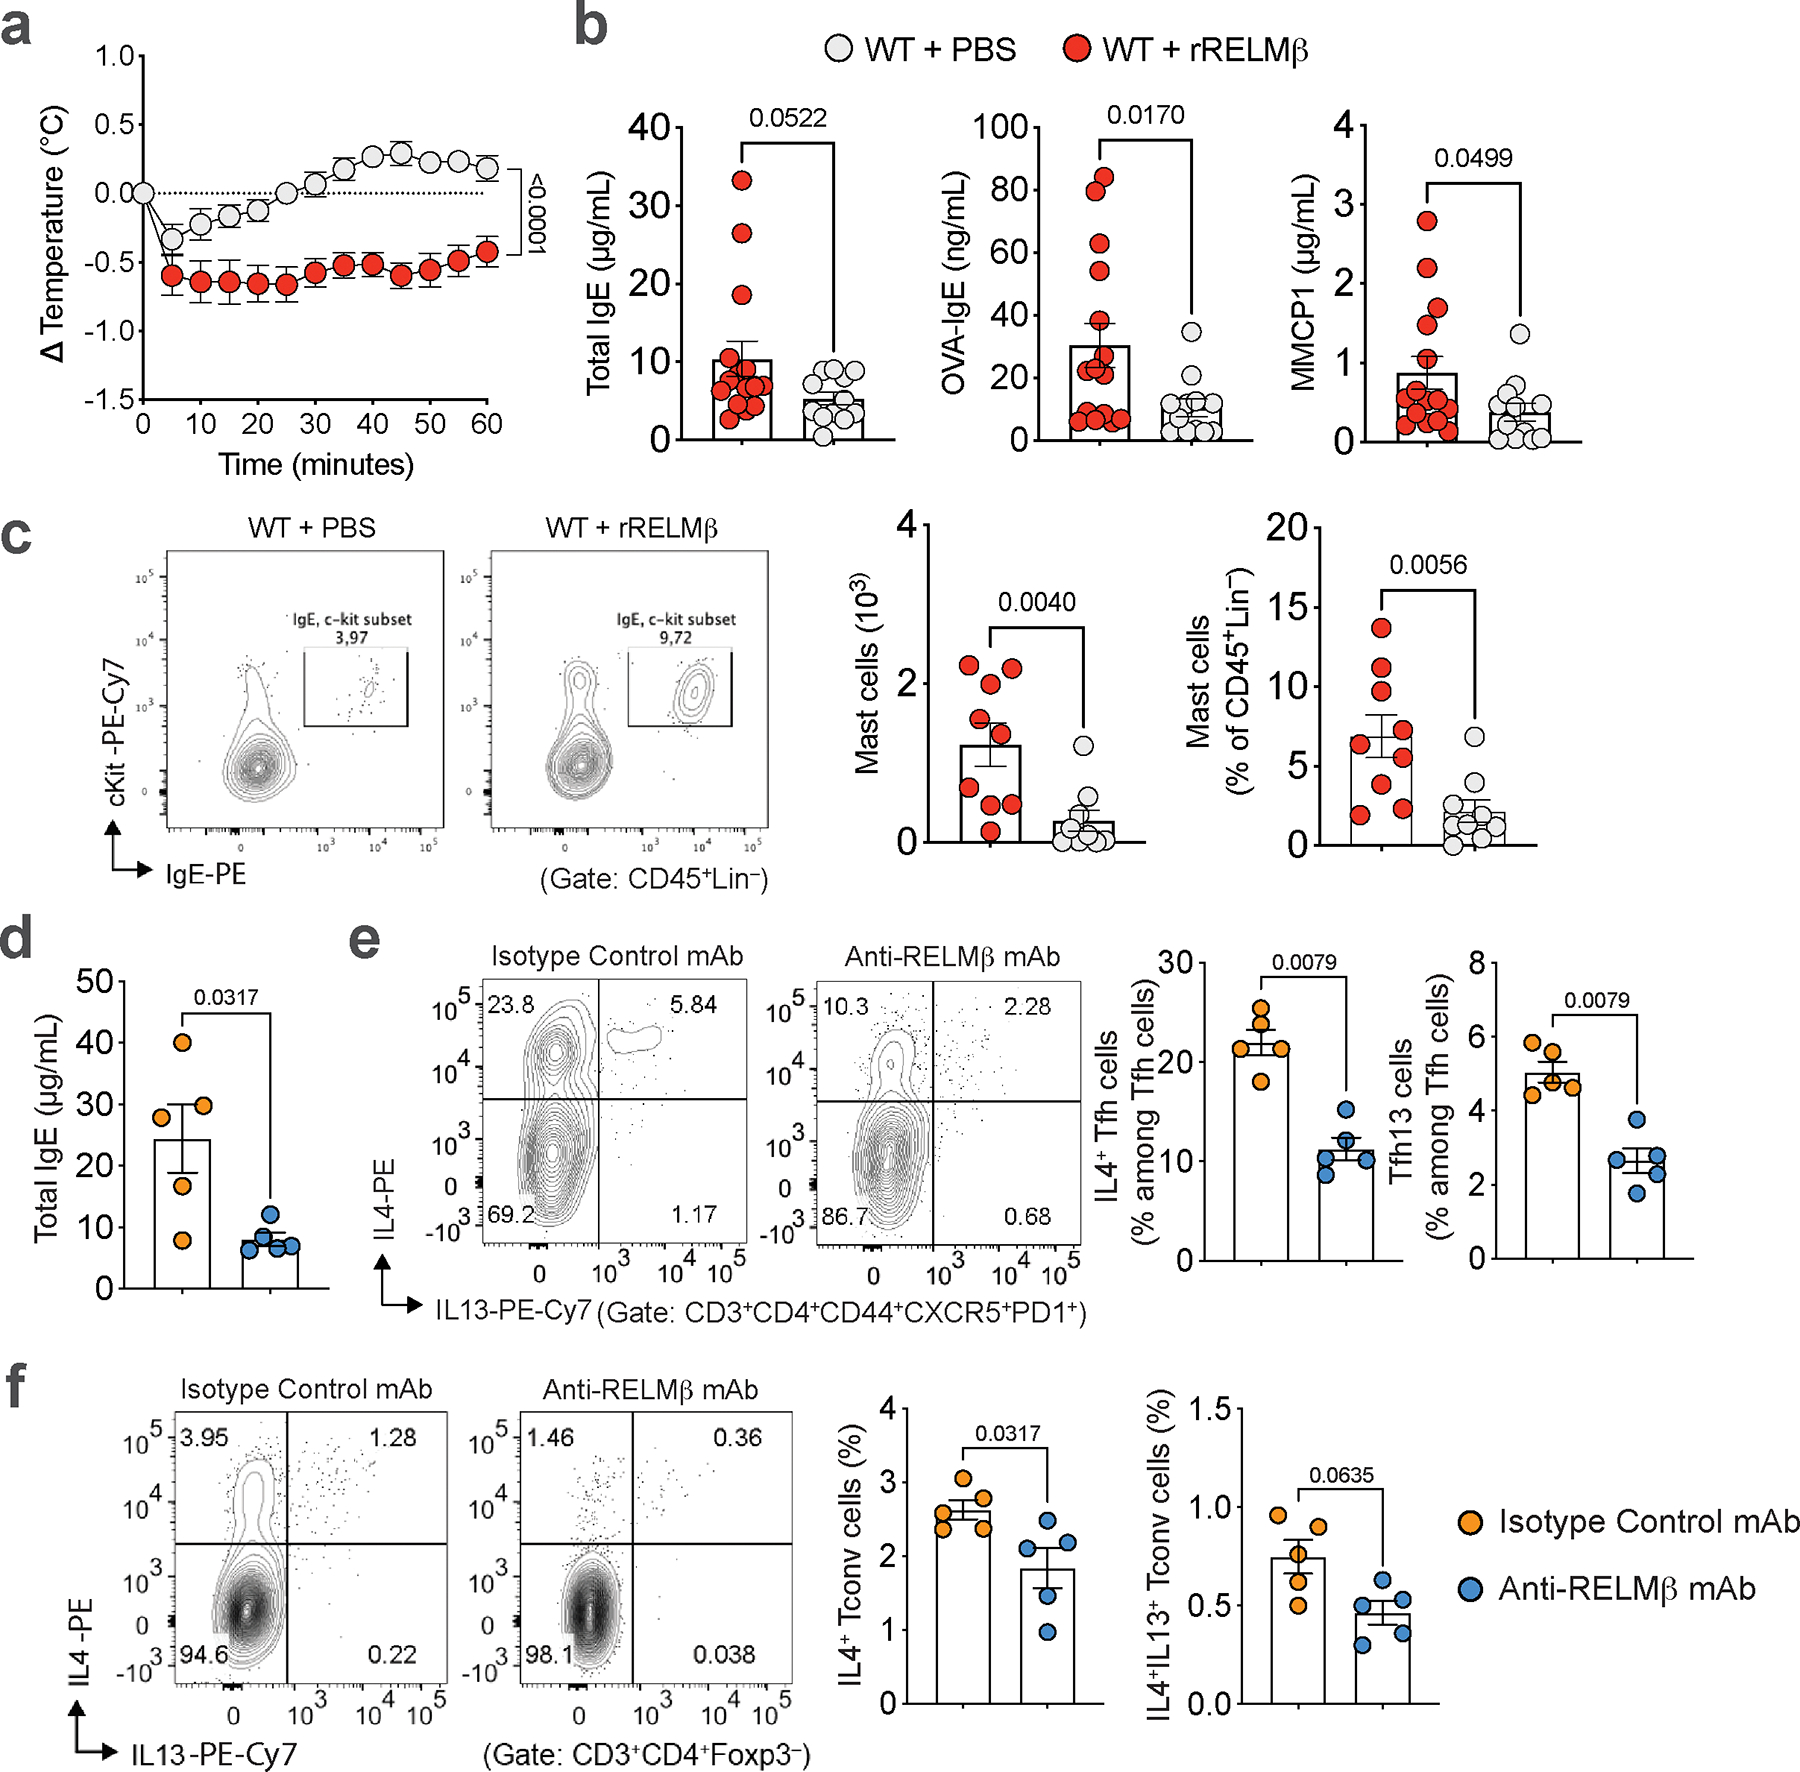
a, Core body temperature changes in OVA-SEB sensitized and OVA-challenged WT mice treated with vehicle (n=12) or rRELMβ (n=15). b, Serum total IgE, OVA-specific IgE concentrations and MMCP1 concentrations in both groups (n=12 and 15) c, Flow cytometric analysis (c) mast cell count numbers and flow cytometric analysis of cell frequencies of C-kit+IgE+ small intestinal mast cells (c) in mice shown in (a) (n=9/group). d, Serum total IgE and e, f, Flow cytometric analysis cell frequencies of small intestinal IL-4+ and IL-4+IL-13+ Tfh cells (e) and cell frequencies of small intestinal IL-4+ and IL-4+IL-13+ Tconv cells in mice (f) from (Main Fig. 5j) (n=5/group). For a–f, data are mean ± s.e.m. Statistical analysis was performed using unpaired two-tailed t-tests (b–f) or repeat measure two-way ANOVA (a) with Šídák’s (a) post hoc test.
Supplementary Material
Acknowledgements
We thank the members of the T.A.C. and S.R.-N. laboratories for comments on the manuscript; C. Vidoudez at the Harvard Center for Mass Spectrometry for LC-MS method development and indole metabolite detection and the Harvard Digestive Disease Center and NIH grant P30DK034854 for the provision of reagents. This work was supported by NIH NIAID grants 5R01AI126915 and 5R01AI158814 (T.A.C. and S.R.-N.), The End Allergies Together Foundation and the Bunning Family Foundation (T.A.C.), an NDSEG Fellowship (G.A.K.), K23 AI155940 (E.C.), U01 AI160087 and U01 AI143514 (W.P. and T.A.C.), a Career Award for Medical Scientists from the Burroughs Wellcome Fund (S.R.-N.), a Pew Biomedical Scholarship (S.R.-N.), an NIH Director New Innovator Award DP2GM136652 (S.R.-N.) and the Paul Schimmel and Michelle Franciose Fund (R.R).
Footnotes
Competing interests
T.A.C., E.C., E.S.-V. and A.A.-G. have a pending patent application related to methods or compositions for treating or preventing allergy or anaphylaxis (US17/801,238). T.A.C. has a provisional patent application related to RELMβ regulation of oral tolerance (US 63/722,176). G.A.K. has financial interests in Hasana Biosciences and Matoi Therapeutics. The other authors declare no competing interests.
Data availability
Source data for all figures are included in the respective source data files. Plasmids and primers used are listed in the respective supplementary files. All 16S bacterial rRNA datasets have been deposited at the National Center for Biotechnology Information Sequence Read Archive under BioProject accession: PRJNA1181263. The public rDNA databases SILVA (https://www.arb-silva.de/documentation/release-1382/) was used to annotate the operational taxonomic unit (OTU) table. RNA-seq data generated during this study are available in the Gene Expression Omnibus (GEO), accession number GSE221462.
References
- 1.Stephen-Victor E, Crestani E & Chatila TA Dietary and Microbial Determinants in Food Allergy. Immunity 53, 277–289, doi: 10.1016/j.immuni.2020.07.025 (2020). [DOI] [PMC free article] [PubMed] [Google Scholar]
- 2.Florsheim EB, Sullivan ZA, Khoury-Hanold W & Medzhitov R Food allergy as a biological food quality control system. Cell 184, 1440–1454, doi: 10.1016/j.cell.2020.12.007 (2021). [DOI] [PubMed] [Google Scholar]
- 3.Artis D et al. RELMbeta/FIZZ2 is a goblet cell-specific immune-effector molecule in the gastrointestinal tract. Proc Natl Acad Sci U S A 101, 13596–13600, doi: 10.1073/pnas.0404034101 (2004). [DOI] [PMC free article] [PubMed] [Google Scholar]
- 4.Herbert DR et al. Intestinal epithelial cell secretion of RELM-beta protects against gastrointestinal worm infection. J Exp Med 206, 2947–2957, doi: 10.1084/jem.20091268 (2009). [DOI] [PMC free article] [PubMed] [Google Scholar]
- 5.Abdel-Gadir A et al. Microbiota therapy acts via a regulatory T cell MyD88/RORgammat pathway to suppress food allergy. Nat Med 25, 1164–1174, doi: 10.1038/s41591-019-0461-z (2019). [DOI] [PMC free article] [PubMed] [Google Scholar]
- 6.Palm NW, Rosenstein RK & Medzhitov R Allergic host defences. Nature 484, 465–472, doi: 10.1038/nature11047 (2012). [DOI] [PMC free article] [PubMed] [Google Scholar]
- 7.Gause WC, Wynn TA & Allen JE Type 2 immunity and wound healing: evolutionary refinement of adaptive immunity by helminths. Nat Rev Immunol 13, 607–614, doi: 10.1038/nri3476 (2013). [DOI] [PMC free article] [PubMed] [Google Scholar]
- 8.Tordesillas L, Berin MC & Sampson HA Immunology of Food Allergy. Immunity 47, 32–50, doi: 10.1016/j.immuni.2017.07.004 (2017). [DOI] [PubMed] [Google Scholar]
- 9.Cheng LE & Locksley RM Allergic inflammation--innately homeostatic. Cold Spring Harbor perspectives in biology 7, a016352, doi: 10.1101/cshperspect.a016352 (2014). [DOI] [PMC free article] [PubMed] [Google Scholar]
- 10.Propheter DC, Chara AL, Harris TA, Ruhn KA & Hooper LV Resistin-like molecule beta is a bactericidal protein that promotes spatial segregation of the microbiota and the colonic epithelium. Proc Natl Acad Sci U S A 114, 11027–11033, doi: 10.1073/pnas.1711395114 (2017). [DOI] [PMC free article] [PubMed] [Google Scholar]
- 11.Hu Z et al. Small proline-rich protein 2A is a gut bactericidal protein deployed during helminth infection. Science 374, eabe6723, doi: 10.1126/science.abe6723 (2021). [DOI] [PMC free article] [PubMed] [Google Scholar]
- 12.Mathias CB et al. IgE-mediated systemic anaphylaxis and impaired tolerance to food antigens in mice with enhanced IL-4 receptor signaling. J Allergy Clin Immunol 127, 795–805 e791–796, doi: 10.1016/j.jaci.2010.11.009 (2011). [DOI] [PMC free article] [PubMed] [Google Scholar]
- 13.Noval Rivas M et al. Regulatory T cell reprogramming toward a Th2-cell-like lineage impairs oral tolerance and promotes food allergy. Immunity 42, 512–523, doi: 10.1016/j.immuni.2015.02.004 (2015). [DOI] [PMC free article] [PubMed] [Google Scholar]
- 14.Munitz A et al. Resistin-like molecule alpha decreases glucose tolerance during intestinal inflammation. J Immunol 182, 2357–2363, doi: 10.4049/jimmunol.0803130 (2009). [DOI] [PMC free article] [PubMed] [Google Scholar]
- 15.von Moltke J, Ji M, Liang HE & Locksley RM Tuft-cell-derived IL-25 regulates an intestinal ILC2-epithelial response circuit. Nature 529, 221–225, doi: 10.1038/nature16161 (2016). [DOI] [PMC free article] [PubMed] [Google Scholar]
- 16.Schneider C et al. A Metabolite-Triggered Tuft Cell-ILC2 Circuit Drives Small Intestinal Remodeling. Cell 174, 271–284 e214, doi: 10.1016/j.cell.2018.05.014 (2018). [DOI] [PMC free article] [PubMed] [Google Scholar]
- 17.Gerbe F et al. Intestinal epithelial tuft cells initiate type 2 mucosal immunity to helminth parasites. Nature 529, 226–230, doi: 10.1038/nature16527 (2016). [DOI] [PMC free article] [PubMed] [Google Scholar]
- 18.Howitt MR et al. Tuft cells, taste-chemosensory cells, orchestrate parasite type 2 immunity in the gut. Science 351, 1329–1333, doi: 10.1126/science.aaf1648 (2016). [DOI] [PMC free article] [PubMed] [Google Scholar]
- 19.Nadjsombati MS et al. Detection of Succinate by Intestinal Tuft Cells Triggers a Type 2 Innate Immune Circuit. Immunity 49, 33–41 e37, doi: 10.1016/j.immuni.2018.06.016 (2018). [DOI] [PMC free article] [PubMed] [Google Scholar]
- 20.Gowthaman U et al. Identification of a T follicular helper cell subset that drives anaphylactic IgE. Science 365, eaaw6433, doi: 10.1126/science.aaw6433 (2019). [DOI] [PMC free article] [PubMed] [Google Scholar]
- 21.Bartnikas LM et al. Epicutaneous sensitization results in IgE-dependent intestinal mast cell expansion and food-induced anaphylaxis. J Allergy Clin Immunol 131, 451–460 e451–456, doi: 10.1016/j.jaci.2012.11.032 (2013). [DOI] [PMC free article] [PubMed] [Google Scholar]
- 22.Sefik E et al. MUCOSAL IMMUNOLOGY. Individual intestinal symbionts induce a distinct population of RORgamma(+) regulatory T cells. Science 349, 993–997, doi: 10.1126/science.aaa9420 (2015). [DOI] [PMC free article] [PubMed] [Google Scholar]
- 23.Turner JA et al. Regulatory T Cell-Derived TGF-beta1 Controls Multiple Checkpoints Governing Allergy and Autoimmunity. Immunity 53, 1202–1214 e1206, doi: 10.1016/j.immuni.2020.10.002 (2020). [DOI] [PMC free article] [PubMed] [Google Scholar]
- 24.Ohnmacht C et al. MUCOSAL IMMUNOLOGY. The microbiota regulates type 2 immunity through RORgammat(+) T cells. Science 349, 989–993, doi: 10.1126/science.aac4263 (2015). [DOI] [PubMed] [Google Scholar]
- 25.Xu M et al. c-MAF-dependent regulatory T cells mediate immunological tolerance to a gut pathobiont. Nature 554, 373–377, doi: 10.1038/nature25500 (2018). [DOI] [PMC free article] [PubMed] [Google Scholar]
- 26.van der Veeken J et al. Genetic tracing reveals transcription factor Foxp3-dependent and Foxp3-independent functionality of peripherally induced Treg cells. Immunity 55, 1173–1184 e1177, doi: 10.1016/j.immuni.2022.05.010 (2022). [DOI] [PMC free article] [PubMed] [Google Scholar]
- 27.Morampudi V et al. The goblet cell-derived mediator RELM-beta drives spontaneous colitis in Muc2-deficient mice by promoting commensal microbial dysbiosis. Mucosal Immunol 9, 1218–1233, doi: 10.1038/mi.2015.140 (2016). [DOI] [PubMed] [Google Scholar]
- 28.Zelante T et al. Tryptophan catabolites from microbiota engage aryl hydrocarbon receptor and balance mucosal reactivity via interleukin-22. Immunity 39, 372–385, doi: 10.1016/j.immuni.2013.08.003 (2013). [DOI] [PubMed] [Google Scholar]
- 29.Kuziel GA & Rakoff-Nahoum S The gut microbiome. Curr Biol 32, R257–R264, doi: 10.1016/j.cub.2022.02.023 (2022). [DOI] [PubMed] [Google Scholar]
- 30.Eckburg PB et al. Diversity of the human intestinal microbial flora. Science 308, 1635–1638, doi: 10.1126/science.1110591 (2005). [DOI] [PMC free article] [PubMed] [Google Scholar]
- 31.Parker BJ, Wearsch PA, Veloo ACM & Rodriguez-Palacios A The Genus Alistipes: Gut Bacteria With Emerging Implications to Inflammation, Cancer, and Mental Health. Frontiers in immunology 11, 906, doi: 10.3389/fimmu.2020.00906 (2020). [DOI] [PMC free article] [PubMed] [Google Scholar]
- 32.Devlin AS et al. Modulation of a Circulating Uremic Solute via Rational Genetic Manipulation of the Gut Microbiota. Cell Host Microbe 20, 709–715, doi: 10.1016/j.chom.2016.10.021 (2016). [DOI] [PMC free article] [PubMed] [Google Scholar]
- 33.Quintana FJ et al. Control of T(reg) and T(H)17 cell differentiation by the aryl hydrocarbon receptor. Nature 453, 65–71, doi: 10.1038/nature06880 (2008). [DOI] [PubMed] [Google Scholar]
- 34.Gutierrez-Vazquez C & Quintana FJ Regulation of the Immune Response by the Aryl Hydrocarbon Receptor. Immunity 48, 19–33, doi: 10.1016/j.immuni.2017.12.012 (2018). [DOI] [PMC free article] [PubMed] [Google Scholar]
- 35.Ye J et al. The Aryl Hydrocarbon Receptor Preferentially Marks and Promotes Gut Regulatory T Cells. Cell reports 21, 2277–2290, doi: 10.1016/j.celrep.2017.10.114 (2017). [DOI] [PMC free article] [PubMed] [Google Scholar]
- 36.Sicherer SH & Sampson HA Food allergy: A review and update on epidemiology, pathogenesis, diagnosis, prevention, and management. J Allergy Clin Immunol 141, 41–58, doi: 10.1016/j.jaci.2017.11.003 (2018). [DOI] [PubMed] [Google Scholar]
- 37.Kanchan K, Clay S, Irizar H, Bunyavanich S & Mathias RA Current insights into the genetics of food allergy. J Allergy Clin Immunol 147, 15–28, doi: 10.1016/j.jaci.2020.10.039 (2021). [DOI] [PMC free article] [PubMed] [Google Scholar]
- 38.Rachid R, Stephen-Victor E & Chatila TA The microbial origins of food allergy. J Allergy Clin Immunol 147, 808–813, doi: 10.1016/j.jaci.2020.12.624 (2021). [DOI] [PMC free article] [PubMed] [Google Scholar]
- 39.Renz H & Skevaki C Early life microbial exposures and allergy risks: opportunities for prevention. Nat Rev Immunol 21, 177–191, doi: 10.1038/s41577-020-00420-y (2021). [DOI] [PubMed] [Google Scholar]
- 40.Al Nabhani Z et al. A Weaning Reaction to Microbiota Is Required for Resistance to Immunopathologies in the Adult. Immunity 50, 1276–1288 e1275, doi: 10.1016/j.immuni.2019.02.014 (2019). [DOI] [PubMed] [Google Scholar]
- 41.Knoop KA et al. Microbial antigen encounter during a preweaning interval is critical for tolerance to gut bacteria. Sci Immunol 2, doi: 10.1126/sciimmunol.aao1314 (2017). [DOI] [PMC free article] [PubMed] [Google Scholar]
- 42.Al Nabhani Z & Eberl G Imprinting of the immune system by the microbiota early in life. Mucosal Immunol 13, 183–189, doi: 10.1038/s41385-020-0257-y (2020). [DOI] [PubMed] [Google Scholar]
- 43.Noval Rivas M et al. A microbiota signature associated with experimental food allergy promotes allergic sensitization and anaphylaxis. J Allergy Clin Immunol 131, 201–212, doi: 10.1016/j.jaci.2012.10.026 (2013). [DOI] [PMC free article] [PubMed] [Google Scholar]
- 44.Burton OT et al. Immunoglobulin E signal inhibition during allergen ingestion leads to reversal of established food allergy and induction of regulatory T cells. Immunity 41, 141–151, doi: 10.1016/j.immuni.2014.05.017 (2014). [DOI] [PMC free article] [PubMed] [Google Scholar]
- 45.Matei V et al. Smaller inner ear sensory epithelia in Neurog 1 null mice are related to earlier hair cell cycle exit. Dev Dyn 234, 633–650, doi: 10.1002/dvdy.20551 (2005). [DOI] [PMC free article] [PubMed] [Google Scholar]
- 46.Harb H et al. Notch4 signaling limits regulatory T-cell-mediated tissue repair and promotes severe lung inflammation in viral infections. Immunity 54, 1186–1199 e1187, doi: 10.1016/j.immuni.2021.04.002 (2021). [DOI] [PMC free article] [PubMed] [Google Scholar]
- 47.Zeve D et al. Robust differentiation of human enteroendocrine cells from intestinal stem cells. Nature communications 13, 261, doi: 10.1038/s41467-021-27901-5 (2022). [DOI] [PMC free article] [PubMed] [Google Scholar]
- 48.Rao C et al. Multi-kingdom ecological drivers of microbiota assembly in preterm infants. Nature 591, 633–638, doi: 10.1038/s41586-021-03241-8 (2021). [DOI] [PMC free article] [PubMed] [Google Scholar]
- 49.Altschul SF, Gish W, Miller W, Myers EW & Lipman DJ Basic local alignment search tool. J Mol Biol 215, 403–410, doi: 10.1016/S0022-2836(05)80360-2 (1990). [DOI] [PubMed] [Google Scholar]
- 50.Birnboim HC & Doly J A rapid alkaline extraction procedure for screening recombinant plasmid DNA. Nucleic Acids Res 7, 1513–1523, doi: 10.1093/nar/7.6.1513 (1979). [DOI] [PMC free article] [PubMed] [Google Scholar]
- 51.Zhang S, Oh JH, Alexander LM, Ozcam M & van Pijkeren JP d-Alanyl-d-Alanine Ligase as a Broad-Host-Range Counterselection Marker in Vancomycin-Resistant Lactic Acid Bacteria. J Bacteriol 200, doi: 10.1128/JB.00607-17 (2018). [DOI] [PMC free article] [PubMed] [Google Scholar]
- 52.Gibson DG et al. Enzymatic assembly of DNA molecules up to several hundred kilobases. Nature methods 6, 343–345, doi: 10.1038/nmeth.1318 (2009). [DOI] [PubMed] [Google Scholar]
- 53.Park SY et al. Strain-level fitness in the gut microbiome is an emergent property of glycans and a single metabolite. Cell 185, 513–529 e521, doi: 10.1016/j.cell.2022.01.002 (2022). [DOI] [PMC free article] [PubMed] [Google Scholar]
Associated Data
This section collects any data citations, data availability statements, or supplementary materials included in this article.
Supplementary Materials
Data Availability Statement
Source data for all figures are included in the respective source data files. Plasmids and primers used are listed in the respective supplementary files. All 16S bacterial rRNA datasets have been deposited at the National Center for Biotechnology Information Sequence Read Archive under BioProject accession: PRJNA1181263. The public rDNA databases SILVA (https://www.arb-silva.de/documentation/release-1382/) was used to annotate the operational taxonomic unit (OTU) table. RNA-seq data generated during this study are available in the Gene Expression Omnibus (GEO), accession number GSE221462.