



ABSTRACT
Background
The scales used to assess disordered eating are often not validated in adults living with gastrointestinal conditions (i.e., gastrointestinal populations). This systematic review and meta‐analysis aimed to examine the psychometric evaluations (i.e., assessments of reliability and validity) of disordered eating scales in adult gastrointestinal populations and quantify the prevalence of disordered eating in both gastrointestinal and non‐gastrointestinal populations.
Methods
We conducted a search of observational studies up to May 2024 that measured disordered eating using a scale in adults with a gastrointestinal condition. Psychometric evaluations of the scales were narratively reviewed. Prevalence rates of disordered eating were pooled using a random‐effects meta‐analysis, and risk of bias was assessed using an adapted Newcastle Ottawa Scale.
Key Results
Among 29 studies (overall medium risk of bias), 23 reported prevalences of disordered eating in gastrointestinal populations, and eight of these studies also reported prevalences in non‐gastrointestinal populations. Only one out of 10 scales was developed and psychometrically evaluated in gastrointestinal populations, and 11 studies reported internal consistency (range α = 0.63 to α = 0.95). The prevalence of disordered eating was 33.2% (p < 0.001; 95% confidence interval: 0.25–0.41; I 2 = 97.34%) in gastrointestinal populations and 21.0% (p < 0.001; 95% confidence interval: 0.09–0.32; I 2 = 97.41%) in non‐gastrointestinal populations. Subgroup analyses showed consistently high heterogeneity.
Conclusions and Inferences
The utilisation of current disordered eating scales for adults living with gastrointestinal conditions should be undertaken with caution, and there is a need for disordered eating scales to be developed and validated in this population.
Keywords: disordered eating, disordered eating scales, eating disorder, gastrointestinal, meta‐analysis, observational studies, psychometric evaluation
Summary.
Although gastrointestinal (GI) conditions can be related to disordered eating patterns, scales that measure disordered eating are generally not developed and validated for GI populations. We explored the psychometric evaluations of disordered eating scales in GI populations across 29 studies and compared the prevalence of disordered eating in GI and non‐GI populations.
Only one disordered eating scale was validated in gastrointestinal cohorts, and the prevalence of disordered eating was approximately 33.2% in GI populations, and 21.0% in non‐GI populations.
Current findings are limited by high heterogeneity.
Future research is needed to develop disordered eating scales that accurately measure disordered eating in gastrointestinal populations.
1. Introduction
Given the inherent connection between eating and gastrointestinal functioning, disordered eating (e.g., food restriction, bingeing) and eating disorders (e.g., Anorexia Nervosa) [1] have been associated with gastrointestinal conditions [2, 3, 4]. Although there is a suspected overlap between gastrointestinal conditions and disordered eating behaviors and cognitions [5], and the essential need to establish the validity and reliability of a measure [6], the disordered eating scales that are currently used to screen for and diagnose eating disorders are often not validated in adults living with gastrointestinal conditions [7, 8] (herein referred to as “gastrointestinal populations”).
Researchers in disordered eating (i.e., disordered eating cognitions and behaviors) have recognised that a lack of validated disordered eating scales in gastrointestinal populations can potentially lead to misdiagnoses of eating disorders [9]. This may be a result of items on disordered eating scales failing to reflect common experiences of a gastrointestinal condition [10]. For example, questions such as “Would you say food dominates your life?” on the Sick, Control, One stone, Fat, Food (SCOFF) questionnaire [11] can potentially reflect the restriction of food to alleviate gastrointestinal symptoms [5], rather than disordered eating behaviors. There are similar concerns with the Nine Item Avoidant/Restrictive Food Intake Disorder Screen (NIAS) [7] and the 26‐item Eating Attitudes Test (EAT‐26) [12], such that these scales may be overly sensitive in patients who adjust their eating to manage gastrointestinal symptoms [13]. This can contribute to false positives of disordered eating in gastrointestinal patients [5, 14].
To date, only one systematic review (k = 17) has evaluated comorbidity of disordered eating in adults with gastrointestinal conditions, and reported the prevalence to be 13%–55% [15]. However, while the review acknowledged that the methods for establishing disordered eating were variable, the reviewers did not explicitly account for or measure psychometric properties (i.e., assessments of validity and reliability) of the various scales used to identify disordered eating, nor did they perform a meta‐analysis to more precisely estimate prevalence, or compare gastrointestinal patients to non‐gastrointestinal patients. Examining the evaluations of the psychometric properties conducted by various studies will establish whether disordered eating scales are appropriate for use in adult gastrointestinal cohorts.
This review aimed to systematically assess the psychometric evaluations of disordered eating scales used in adult gastrointestinal populations. This review also aimed to estimate and quantify the prevalence of disordered eating in gastrointestinal vs. non‐gastrointestinal populations. Specifically, we asked:
Research Question 1: What psychometric evaluations (i.e., assessments of validity and reliability) have been undertaken on disordered eating scales in gastrointestinal populations?
Research Question 2: What is the prevalence of disordered eating in adult gastrointestinal populations compared to non‐gastrointestinal populations?
2. Materials and Methods
This paper was reported according to the Preferred Reporting Items for Systematic Reviews and Meta‐Analyses (PRISMA; see Appendix S1 for PRISMA checklist) [16]. The protocol was registered with the International Prospective Register of Systematic Reviews PROSPERO (CRD42024546470).
2.1. Eligibility Criteria
Table 1 outlines the eligibility criteria for this study. Peer‐reviewed, observational studies that included a psychometrically validated scale to assess disordered eating in gastrointestinal populations were considered for this review.
TABLE 1.
Participants, Exposure, Comparators, and Outcomes (PECO) framework for inclusion and exclusion criteria for this review.
| Included | Excluded | |
|---|---|---|
| Participants |
|
|
| Exposure |
|
|
| Comparators |
|
|
| Outcomes |
|
|
| Study designs |
|
|
2.2. Data Sources and Searches
A systematic search was conducted on the following databases on 15th of May 2024: Ovid MEDLINE(ALL), CINAHL Complete (via Embase), and APA PsycInfo (via Embase). There were no search restrictions.
2.3. Search Strategy
The search strategy was developed in Medline using the help of librarian (RN) at Deakin University. It was then adapted to other databases. The full search strategies can be found in the Appendix S1.
2.4. Selection Process and Data Extraction
References were exported into Endnote and then uploaded to Covidence [17] to assess eligibility. The selection was performed independently by two reviewers (OMS and MW) to reduce potential risk of bias. Any disagreements were resolved by discussion with a third independent reviewer (AMW or SRK). Extracted data included: author, year, country, study design, sample characteristics (including total sample size, mean age and standard deviation, age range, percentage of females), gastrointestinal condition and method of diagnosis, number of gastrointestinal participants, assessment(s) of disordered eating, and any psychometric evaluations (i.e., reliability and validity) of the scales used to assess for disordered eating in gastrointestinal populations. This included Cronbach's alpha—a measure of internal consistency from 0 to 1, where 1 denotes excellent internal consistency. Disordered eating scales that were psychometrically validated in any population [18, 19, 20, 21, 22] were used in the meta‐analysis.
When two disordered eating scales were reported in a single study, results were pooled into a single total percentage for the meta‐analysis [23, 24]. Disordered eating prevalence was based on cutoffs as recommended by the authors. Where recommended scale cutoffs were inconsistent between studies, study authors were contacted to attempt obtaining prevalence data based on recommended scale cutoffs [4]; however, this was unsuccessful. For scales with two cutoffs, the lowest cutoff was chosen for analysis to broaden inclusion of disordered eating patients [23]. Baseline data from cohort studies were used to mitigate selection bias compared to cross‐sectional studies [25, 26]. Where there was both a control group and an eating disorder group compared with gastrointestinal populations, the control group was selected over the eating disorder group to reduce errors in prevalence of disordered eating in non‐gastrointestinal populations who had not reported disordered eating at baseline [5].
2.5. Risk of Bias Quality Assessment
Risk of bias was independently assessed by two authors (OMS and MW) using an adapted version of the Newcastle Ottawa Scale (NOS) [27], which accounted for the specific outcomes of this study (i.e., disordered eating in gastrointestinal populations). The adapted scales for cohort, case–control, and cross‐sectional studies are presented in the Appendix S1. A score of seven, eight, or nine points was considered a low‐risk of bias; six points a medium risk of bias, and five points or less a high risk of bias.
2.6. Narrative Review for Research Question 1
All eligible studies were considered for the first research question. Validity (face, content, construct, criterion related) and reliability (internal consistency, split‐half, test–retest reliability, and inter‐rater reliability) measures undertaken on disordered eating scales were extracted as assessments of psychometric evaluation [6, 28]. Due to the limited data available on psychometric evaluations of the disordered eating scales in the studies, a narrative review was conducted to answer our first research question.
2.7. Statistical Methods for Research Question 2
A random‐effects meta‐analysis was performed to account for the high variability in study characteristics (e.g., varying gastrointestinal conditions and disordered eating scales) to reduce the risk of variance in the true effect sizes [29]. Statistical analyses were conducted using Jamovi [30] Version 2.3.28.0. The I 2 statistic was used to quantify heterogeneity between studies, with this review deeming “low” heterogeneity as under 40%, “moderate” heterogeneity as 41%–70%, and “high” heterogeneity as 71%–100%, based on general guidelines [31].
To account for high heterogeneity in the total number of studies, a meta‐regression by age and female sex proportion was conducted. Subgroup analyses were also performed where sufficient data was available for input into Jamovi (i.e., three or more studies), which included disordered eating scales (EAT‐26, NIAS, and SCOFF) and gastrointestinal conditions (coeliac disease (CD), inflammatory bowel disease (IBD), and irritable bowel syndrome (IBS)). For subgroup analyses on IBD, this included studies that reported Crohn's disease [32] or ulcerative colitis (UC) [23] independently. Subgroup analyses were also performed on studies that reported separate disordered eating prevalences for males and females.
3. Results
3.1. Search Results
Figure 1 shows the PRISMA diagram for selection of studies. A total of 2255 studies were found through database searches, and three studies were found via citation searching. A total of 29 studies were eligible for this review. All 29 studies were eligible for our first research question and are presented in Table 2. Twenty‐three studies included a prevalence of disordered eating in gastrointestinal populations and were thus eligible for our second research question, with eight of these studies also reporting prevalences in non‐gastrointestinal populations. Individual studies analysed in our second research question, including in additional subgroup analyses, are presented in the Appendix S1.
FIGURE 1.

PRISMA flow diagram of included studies.
TABLE 2.
Characteristics of included studies (n = 29).
| Author, year, country, quality score a | Study information | Sample characteristics | GI condition and method of diagnosis | Scales measuring disordered eating | Cronbach's Alpha |
|---|---|---|---|---|---|
|
Author: Arigo et al. Year: 2012 Country: USA Quality Score: 7/9 |
Design: Cross‐sectional Control group: No Setting: Online Recruitment: Three methods: (1) through contact persons for local and national Celiac Disease organizations, (2) through support networks found on social networking websites, and (3) through online newsletters distributed by the supporting institution (unspecified) |
Total sample size: 177 Mean age (SD): 39.24 (NR) Age range: 18+ Female, (%): 100% GI population who undertook DE scale: 177 (100%) |
GI condition: Coeliac disease Method of diagnosis: Self‐reported diagnosed by a physician |
29‐item EDE‐Q | 𝜶 = 0.93 |
|
Author: Bloch et al. Year: 1999 Country: South Africa Quality Score: 5/9 |
Design: Cross‐sectional Control group: Yes—matched female volunteers from the northeastern suburbs of Johannesburg Setting: Centre for Gastroenterology at the Rand Afrikaans University Recruitment: Referred from gastroenterologists and general practitioners to the Centre for Gastroenterology at the Rand Afrikaans University |
Total sample size: 58 Mean age (SD): NR Age range: 25–55 Female, (%): 100% GI population who undertook DE scale: 30 (51.72%) b |
GI condition: IBS Method of diagnosis: Gastroenterologists and GPs |
Eating Disorder Inventory‐2 (EDI‐2) 4 Subscales of: Drive for Thinness, Body Dissatisfaction, Bulimia, and Interoceptive Awareness |
𝜶 = 0.63 |
|
Author: Burton‐Murray et al. Year: 2022 Country: USA Quality Score: 6/9 |
Design: Cross‐sectional Control group: No Setting: Online Recruitment: Two methods: (1) principal investigator of study identified potential participants by medical chart review, or (2) patients' gastroenterologists or primary care providers invited patients to optionally participate in the study |
Total sample size: 93 Mean age (SD): 45.17 (3.4) Age range: 18–82 Female, (%): 74.10% GI population who undertook DE scale: 93 (100%) |
GI condition: IBS, functional dyspepsia, cyclic vomiting syndrome, abdominal migraines, or have unexplained or “functional” nausea, vomiting, abdominal pain, bloating, constipation, diarrhea, or problems with emptying bowels Method of diagnosis: Self‐reported diagnosed by a physician |
EDE‐Q | EDE‐Q: 𝜶 = 0.95 |
|
Author: Burton‐Murray et al. Year: 2024 Country: USA Quality Score: 6/9 |
Design: Cross‐sectional Control group: No Setting: NR Recruitment: Recruited from the Massachusetts General Hospital Gastroenterology Division who were participating in the cohort study |
Total sample size: 101 Mean age (SD): 49.9 (16.5) Age range: 22–80 Female, (%): 55% GI population who undertook DE scale: 101 (100%) |
GI condition: Ulcerative Colitis Method of diagnosis: Established UC diagnosis confirmed by colonoscopy or flexible sigmoidoscopy and quiescent disease (Simple Clinical Colitis Index of Activity [SCCAI] ≤ 2 or fecal calprotectin < 150 μg/g with corticosteroid‐free clinical remission for ≥ 3 months) |
EDE‐Q; NIAS | NR |
|
Author: Chan et al. Year: 2022 Country: UK Quality Score: 2/9 |
Design: Cohort Study Control group: No Setting: Dietetic department of University College London Hospital, UK Recruitment: Patients were diagnosed with IBS by their gastroenterologist according to The National Institute for Health and Care Excellence (NICE) criteria and referred to the dietetic department for a low FODMAP diet; automatically enrolled in group education sessions |
Total sample size: 55 Mean age (SD): 44 (NR) Age range: 20–77 Female, (%): 75% GI population who undertook DE scale: 31 (56.36%) c |
GI condition: 51 IBS; 4 with other DGBIs Method of diagnosis: Gastroenterologist diagnosis |
SCOFF | NR |
|
Author: Day et al. Year: 2022 Country: Australia Quality Score: 6/9 |
Design: Cross‐sectional Control group: No Setting: Three tertiary IBD centers in Adelaide Recruitment: Recruited via advertising in outpatient clinics, infusion centers, and established IBD service emailing lists |
Total sample size: 108 Mean age (SD): 43.6 (15.2) Age range: NR Female, (%): 56% GI population who undertook DE scale: 108 (100%) |
GI condition: IBD Method of diagnosis: Self‐reported diagnosed by a physician |
NIAS | NR |
|
Author: Di Giorgio et al. Year: 2024 Country: Italy Quality Score: 7/9 |
Design: Cross‐sectional Control group: Yes—45 convenience sampled subjects (university hospital trainees and employees, as well as relatives of trainees who consented to participate) Setting: Gastroenterology and Hepatology Unit of the University Hospital of Palermo Recruitment: IBD patients presenting to the clinic were invited to participate |
Total sample size: 158 Mean age (SD): 41 (14) Age range: 18–84 Female, (%): 53% GI population who undertook DE scale: 113 (71.52%) b |
GI condition: IBD Method of diagnosis: Physician confirmed in hospital setting |
ORTO‐15 (dietician administered) | NR |
|
Author: Evans et al. Year: 2023 Country: USA Quality Score: 7/9 |
Design: Cross‐sectional Control group: No Setting: Online Recruitment: Survey link posted to online and social media forums where participants were invited to participate |
Total sample size: 222 Mean age (SD): 38.3 (15.6) Age range: 18+ Female, (%): 84.4% GI population who undertook DE scale: 189 (85.14%) d |
GI condition: IBS Method of diagnosis: Self‐reported diagnosed by a physician |
EAT‐26 | NR |
|
Author: Fink et al. Year: 2022 Country: USA Quality Score: 7/9 |
Design: Cross‐sectional Control group: No Setting: Online Recruitment: Three methods: (1) via an outpatient gastroenterology clinic, (2) a research database, or (3) social media |
Total sample size: 289 Mean age (SD): 43.88 (14.03) Age range: 18–82 Female, (%): 80.7% GI population who undertook DE scale: 289 (100%) |
GI condition: Achalasia; Coeliac; IBD; Eosinophilic esophagitis Method of diagnosis: Self‐reported diagnosed by a physician |
NIAS | 𝜶 = 0.87 |
|
Author: Franco et al. Year: 2023 Country: Brazil Quality Score: 6/9 |
Design: Cross‐sectional Control group: No Setting: Online Recruitment: Via social media platforms |
Total sample size: 385 Mean age (SD): NR (NR) Age range: 18+ Female, (%): 96.36% GI population who undertook DE scale: 385 (100%) |
GI condition: Coeliac disease Method of diagnosis: Self‐reported a CD diagnosis for at least 2 years |
EAT‐26 | 𝜶 = 0.81 |
|
Author: Fraser et al. Year: 2022 Country: Australia Quality Score: 7/9 |
Design: Cross‐sectional Control group: No Setting: Online Recruitment: Recruited via newsletter communications from large Australian coeliac organization |
Total sample size: 187 Mean age (SD): 48.92 (16.24) Age range: 18+ Female, (%): 90.4% GI population who undertook DE scale: 187 (100%) |
GI condition: Coeliac disease Method of diagnosis: Self‐reported a medical diagnosis |
CD‐FAB; BES |
BES: 𝜶 = 0.94 CD‐FAB: 𝜶 = 0.91 |
|
Author: Gholmie et al. Year: 2023 Country: USA Quality Score: 5/9 |
Design: Cross‐sectional Control group: No Setting: Celiac Disease Centre at CUIMC (Celiac Disease Centre) in New York City Recruitment: Eligible participants from the clinic were approached to participate |
Total sample size: 50 Mean age (SD): 29.6 (7.4) Age range: 18–45 Female, (%): 70% GI population who undertook DE scale: 50 (100%) |
GI condition: Coeliac disease Method of diagnosis: Biopsy‐diagnosed coeliac, and following a gluten‐free diet (GFD) for at least a year; confirmed from patients' medical records |
CD‐FAB | NR |
|
Author: Hollis et al. Year: 2024 Country: USA Quality Score: 6/9 |
Design: Cross‐sectional Control group: No Setting: (unspecified) Tertiary academic medical center Recruitment: Patients who had undergone gastric emptying scintigraphy (GES) with symptoms of gastroparesis were referred to the tertiary academic center |
Total sample size: 107 Mean age (SD): 45.4 (17.2) Age range: 18+ Female, (%): 84.10% GI population who undertook DE scale: 107 (100%) |
GI condition: Gastroparesis Method of diagnosis: Clinician diagnosis |
NIAS | NR |
|
Author: Kayar et al. Year: 2020 Country: Turkey Quality Score: 7/9 |
Design: Cross‐sectional Control group: Yes—healthy controls Setting: Bezmialem Vakıf University Hospital Recruitment: Patients were under follow‐up at the gastroenterology outpatient clinic |
Total sample size: 200 Mean age (SD): 35.2 (9.2) Age range: 18–65 Female, (%): 59% GI population who undertook DE scale: 100 (100%) |
GI condition: IBS Method of diagnosis: Clinician diagnosis |
EAT‐26 | NR |
|
Author: Kujawowicz et al. Year: 2022 Country: Poland Quality Score: 6/9 |
Design: Cross‐sectional Control group: No Setting: Online Recruitment: Two methods: (1) official website of the coeliac disease association, and (2) through social media for people with coeliac |
Total sample size: 123 Mean age (SD): 34 (8.7) Age range: 18–64 Female, (%): 100% GI population who undertook DE scale: 123 (100%) |
GI condition: Coeliac disease Method of diagnosis: Self‐reported diagnosis |
ORTO‐15 (Polish Edition) |
Total: 𝜶 = 0.66 Excluding Q8: 𝜶 = 0.68 |
|
Author: Mari et al. Year: 2019 Country: UK Quality Score: 5/9 |
Design: Cohort study Control group: No Setting: University College London Hospital IBS clinic Recruitment: Patients were referred from the IBS clinic to the study |
Total sample size: 233 Mean age (SD): 38.2 (9.2) Age range: 20–70 Female, (%): 79.8% GI population who undertook DE scale: 233 (100%) |
GI condition: IBS Method of diagnosis: Clinician diagnosis |
SCOFF | NR |
|
Author: Melchior et al. Year: 2019 Country: France Quality Score: 8/9 |
Design: Case control Control group: Yes—matched by sex and age Setting: Rouen University tertiary care center Recruitment: Patients recruited in the physiology department of the tertiary care center, and controls were recruited later from the healthy volunteer registry of the Clinical Investigation Centre of Rouen University Hospital |
Total sample size: 456 Mean age (SD): 42.5 (13.9) Age range: 18–75 Female, (%): 76.75% GI population who undertook DE scale: 228 (50%) b |
GI condition: IBS Method of diagnosis: Clinician diagnosis |
SCOFF‐F (French version) | NR |
|
Author: Nisihara et al. Year: 2024 Country: Brazil Quality Score: 6/9 |
Design: Cross‐sectional Control group: Yes—matched by sex and age Setting: Online Recruitment: Recruited via coeliac pages on social media, and other relevant CD websites. Controls sent the questionnaire via WhatsApp, email, or Instagram |
Total sample size: 741 Mean age (SD): 36 (4.5) Age range: 18+ Female, (%): 88.7% GI population who undertook DE scale: 484 (65.32%) b |
GI condition: Coeliac disease Method of diagnosis: Self‐reported diagnosis |
EAT‐26 (Portuguese version) | NR |
|
Author: Quiroga‐Castaneda et al. Year: 2024 Country: Peru Quality Score: 6/9 |
Design: Cross‐sectional Control group: No Setting: Online Recruitment: Random probabilistic sampling in the medicine cohort of the Universidad San Martin de Porres (USMP) during a certain academic period from year 1 to 7 |
Total sample size: 403 Mean age (SD): 21 (NR) Age range: 18–24 Female, (%): 66.5% GI population who undertook DE scale: 69 (16.9%) e |
GI condition: IBS Method of diagnosis: Self‐reported diagnosis |
SCOFF | NR |
|
Author: Robelin et al. Year: 2021 Country: USA Quality Score: 6/9 |
Design: Cross‐sectional Control group: No Setting: Mayo Clinic Florida; Inflammatory Bowel Disease Centre Recruitment: Patients with IBD seen during an office visit to the IBD Centre of the clinic during a specified period of time |
Total sample size: 98 Mean age (SD): 44.5 (16.4) Age range: 18+ Female, (%): 56.10% GI population who undertook DE scale: 98 (100%) |
GI condition: IBD Method of diagnosis: Clinician diagnosis |
NIAS | NR |
|
Author: Satherley et al. Year: 2016 Country: UK Quality Score: 6/9 |
Design: Cross‐sectional Control group: Yes—type 2 diabetes, and healthy controls Setting: Online Recruitment: Recruited through adverts on online support forums through Coeliac UK, the main charity supporting those with coeliac |
Total sample size: 503 Mean age (SD): 38.5 (12.98) Age range: 18–69 Female, (%): 100% GI population who undertook DE scale: 273 (54.27%) b |
GI condition: Coeliac disease and IBD Method of diagnosis: Self‐reported biopsy‐confirmed diagnosis |
EAT‐26; BES | NR |
|
Author: Simons et al. Year: 2024 Country: USA Quality Score: 6/9 |
Design: Cross‐sectional Control group: No Setting: Online Recruitment: Recruited from an outpatient gastroenterology clinic, a research recruitment website, and social media |
Total sample size: 277 Mean age (SD): 49.2 (16.3) Age range: 18+ Female, (%): 69.1% GI population who undertook DE scale: 277 (100%) |
GI condition: GERD, EoE, achalasia Method of diagnosis: Self‐reported provider confirmed diagnosis |
EDE‐Q |
𝜶 = 0.87 |
|
Author: Stoleru et al. Year: 2022 Country: USA Quality Score: 7/9 |
Design: Cross‐sectional Control group: No Setting: Online Recruitment: Team curated a list of patients with IBD from electronic medical records who visited the Digestive Health Centre of the University of the University of Maryland |
Total sample size: 308 Mean age (SD): NR (NR) Age range: 18+ Female, (%): 64% GI population who undertook DE scale: 17 (100%) |
GI condition: IBD Method of diagnosis: Confirmed clinician diagnosis; electronic medical record (EMR) coded diagnoses of IBD including CD and UC, who had visited the Digestive Health Centre in the last 3 years |
EAT‐26 | NR |
|
Author: Sultan et al. Year: 2024 Country: Australia Quality Score: 6/9 |
Design: Cross‐sectional Control group: Yes—both control and ED subjects Setting: Online Recruitment: Two methods: (1) online advertisements on social media including Twitter, Instagram, and Facebook, as well as authors' networks, including international and Australian‐based dietitians, clinical practices, food industry, ED communities, local community pages, and university student Facebook groups, and (2) physical flyers were displayed in medical practices and libraries around Melbourne, Australia |
Total sample size: 296 Mean age (SD): NR (NR) Age range: 18+ Female, (%): 92.67% GI population who undertook DE scale: 202 (68.24%) b |
GI condition: IBS Method of diagnosis: Self‐reported meeting the Rome IV criteria |
SCOFF; Eating Habits Questionnaire (EHQ‐35) | NR |
|
Author: Wabich et al. Year: 2020 Country: USA Quality Score: 6/9 |
Design: Cross‐sectional Control group: No Setting: Unspecified outpatient Gastroenterology Clinic at a single academic IBD centre Recruitment: Participants completed the surveys before being seen at the outpatient clinic for their IBD |
Total sample size: 109 Mean age (SD): 32.6 (2.1) Age range: 18–81 Female, (%): 63% GI population who undertook DE scale: 109 (100%) |
GI condition: IBD Method of diagnosis: Not reported (implied clinician diagnosis and referral) |
EAT‐26 | NR |
|
Author: Wardle et al. Year: 2018 Country: UK Quality Score: 5/9 |
Design: Cross‐sectional Control group: Yes—age, BMI, and gender matched healthy volunteers Setting: IBD clinic Recruitment: Two methods: (1) via study flier, and (2) social media |
Total sample size: 61 Mean age (SD): 44 (NR) Age range: 18+ f Female, (%): 100% GI population who undertook DE scale: 30 (49.2%) b |
GI condition: Crohn's disease Method of diagnosis: Not reported (implied clinician diagnosis and referral) |
Binge Eating Scale [BES]; Power of Food Scale [PFS] g |
NR |
|
Author: Yelencich et al. Year: 2022 Country: USA Quality Score: 6/9 |
Design: Cross‐sectional Control group: No Setting: UCLA Centre for Inflammatory Bowel Diseases Recruitment: Recruited from the ambulatory clinic, completing surveys on scheduled visits |
Total sample size: 161 Mean age (SD): 41 (15.5) Age range: NR Female, (%): 54.7% GI population who undertook DE scale: 161 (100%) |
GI condition: IBD Method of diagnosis: Confirmed diagnosis; patients receiving ambulatory care at the clinic |
NIAS | 𝜶 = 0.90 |
|
Author: Yin et al. Year: 2023 Country: China Quality Score: 6/9 |
Design: Cross‐sectional Control group: No Setting: Four tertiary hospitals in China Recruitment: Eligible patients presenting to the hospital were invited to participate |
Total sample size: 372 Mean age (SD): 38.82 (NR) Age range: 18+ Female, (%): 34.1% GI population who undertook DE scale: 372 (100%) |
GI condition: IBD Method of diagnosis: Confirmed by a combination of endoscopic, radiological, biochemical, and histological investigations |
NIAS |
Picky eating subscale: 𝜶 = 0.77 Poor appetite subscale: 𝜶 = 0.79 Fear of negative consequences subscale: 𝜶 = 0.81 |
|
Author: Zickgraf et al. Year: 2022 Country: USA Quality Score: 7/9 |
Design: Cross‐sectional Control group: Yes—undergraduate students from selective East Coast university completed the battery for course credit; however, some also had gastrointestinal conditions Setting: Online Recruitment: Two methods: (1) Reddit and, (2) in an IBS/IBD clinical trial from tertiary care gastroenterology practices |
Total sample size: 1138 Mean age (SD): 29 (7.4) Age range: 18+ Female, (%): 58.75% GI population who undertook DE scale: 276 (24.3%) |
GI condition: IBS/IBD Method of diagnosis: Self‐reported diagnosis for Reddit participants, and physician diagnosis for tertiary care participants |
NIAS‐Fear |
𝜶 = 0.83 |
Note: Shaded studies were included only in our first research question, as they did not report prevalence rates of disordered eating in gastrointestinal populations.
Abbreviations: BES, Binge Eating Scale; DE, Disordered eating; EAT‐26, Eating Attitudes Test‐26; ED, Eating disorder; EoE, eosinophilic esophagitis; GERD, gastroesophageal reflux disorder; GI, Gastrointestinal; GP, General Practitioner; IBD, Irritable Bowel Disease; IBS, Irritable Bowel Syndrome; NIAS, Nine Item Avoidant/Restrictive Food Intake Disorder Screen; NR, not reported; SCOFF, (Sick, Control, One stone, Fat, Food) questionnaire; SD, standard deviation; UK, United Kingdom; USA, United States of America.
Score out of 9, based on adapted Newcastle Ottawa Scale quality appraisal.
Control group.
Missing data due to patients either not answering or forgetting to answer all the questionnaires, as confirmed by paper's author.
The survey questions were not compulsory, meaning some participants did not respond to the EAT‐26.
The study reported this figure of 69, and it was used in the analysis for this review. However, the author acknowledges that 16.9% of 403 is closer to 68 participants.
Study author confirmed participant ages were ≥ 18.
Prevalence rates were reported only for the BES in this study, and was therefore used in the final analysis of this review.
3.2. Study Characteristics
Table 2 presents sample characteristics of included studies.
Sample sizes ranged from 50 [33] to 1138 [34], with a total sample of 7469 participants (mean age 41.27 (12.4); 67.37% female). The number of gastrointestinal patients who completed disordered eating scales was 4552. Reported prevalence of disordered eating in the studies ranged from 4.8% [35] to 76.6% [8].
Most studies were conducted between 2012 and 2024, with one study conducted in 1999 [25]. There was one case control study [10], two cohort studies [26, 36], and 26 cross‐sectional studies. Thirteen studies were conducted in the USA [8, 9, 14, 23, 33, 34, 35, 37, 38, 39, 40, 41, 42], four in the UK [24, 26, 32, 36], three in Australia [5, 7, 43], two in Brazil [44, 45], and one in each of the following countries: China [46], France [10], Italy [47], Peru [48], Poland [49], South Africa [25], and Turkey [50].
3.2.1. Quality Scores
Using the revised NOS, the average quality score across the 29 studies was 5.90/9, suggesting a medium risk of bias (range 5 – 8). Studies included in each research question also indicated an overall medium risk of bias: Research Question 1 (k = 29) = 5.90; Research Question 2 (k = 23) = 6.52. Individual NOS scores for each study are presented in Table 2.
3.3. Psychometric Evaluations Undertaken on Disordered Eating Scales in Gastrointestinal Populations
Ten disordered eating scales were used across the 29 studies (Binge Eating Scale (BES); Coeliac Disease‐specific Food Attitudes and Behaviors (CD‐FAB); Eating Attitudes Test (EAT‐26); Eating Disorder Examination (EDE‐Q); EDE‐Q‐8; Eating Disorder Inventory (EDI‐2); Eating Habits Questionnaire (EHQ‐35); Nine Item Avoidant/Restrictive Food Intake Disorder Screen (NIAS); Orthorexia Nervosa Questionnaire (ORTO‐15 in English and Polish); Sick, Control, One stone, Fat, Food (SCOFF) Questionnaire (in English, French, and Portuguese)). Intended use for each scale is included in the Appendix S1.
Concerning evaluations of validity, the CD‐FAB was the only scale developed and psychometrically evaluated in a gastrointestinal population (see Satherley, Howard and Higgs) [19]; however, clinical cutoff points for this measure have not been established to date [19, 33]. Notably, 16 of the 29 studies outlined that the scales they used were not suitable for gastrointestinal populations due to the lack of validation in gastrointestinal cohorts [5, 7, 8, 9, 10, 14, 26, 33, 35, 38, 39, 40, 44, 46, 47, 49], with some studies modifying scales for use [5, 40, 42]. Only one study employed confirmatory factor analysis (CFA) to evaluate the structure of the EAT‐26 measure [24]. The authors determined that the current three‐factor model of the scale (i.e., questions relating to the three factors of dieting, bulimia and food preoccupation, and oral control [51]) did not adequately fit their data (Relative Comparative Fit Index (RCFI) = 0.889, Root Mean Square Error of Approximation (RMSEA) = 0.075), whereas a single‐factor model provided better fit (RCFI = 0.922, RMSEA = 0.066) [24]. Although their findings indicated a one‐factor model would be a more appropriate fit to their data, they nonetheless opted to use the original three‐factor EAT‐26 model, using their CFA results only as rationale for not analysing the three factors individually.
Concerning evaluations of reliability, 11 of the 29 studies recorded a Cronbach's alpha measure (Table 2), and this ranged from 𝜶 = 0.63 [25] to 𝜶 = 0.95 [9]. The remaining studies did not report psychometric evaluation of disordered eating scales in gastrointestinal populations.
3.4. Prevalence of Disordered Eating in Adult Gastrointestinal Populations Compared to Non‐gastrointestinal Populations
The forest plots for our second research question are presented in Figures 2 and 3. A random effects meta‐analysis revealed the prevalence of disordered eating in adult patients with gastrointestinal conditions to be 33.2%, p < 0.001 (95% CI: 0.25–0.41; I 2 = 97.34%). The high I 2 statistic revealed a high heterogeneity, suggesting one or more significant differences between the studies. Meta‐regression revealed that neither age nor sex predicted prevalence (forest plots are presented in the Appendix S1). The prevalence of disordered eating in non‐gastrointestinal populations was 21.0%, p < 0.001 (95% CI: 0.09–0.32; I 2 = 96.41%). To explore potential reasons for the high heterogeneity between the studies, a number of subgroup analyses were conducted.
FIGURE 2.
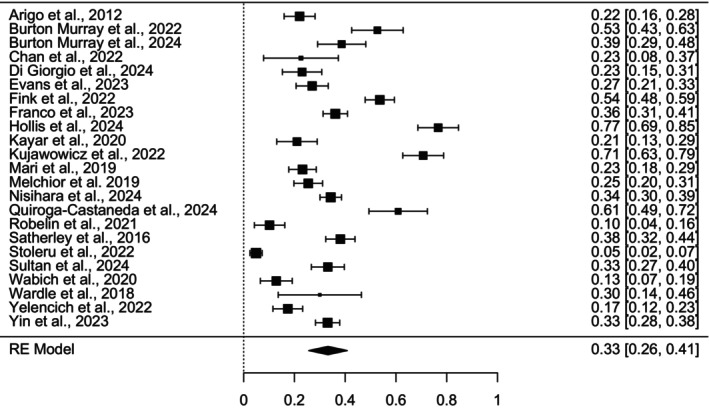
Forest plot of overall prevalence of disordered eating in gastrointestinal populations.
FIGURE 3.

Forest plot of prevalence of disordered eating in non‐gastrointestinal populations.
3.4.1. Subgroup Analyses by Gastrointestinal Condition
Subgroup analyses of prevalence of disordered eating by gastrointestinal condition were: CD 39.2%, p < 0.001 (95% CI: 0.25–0.53; I 2 = 95.7%); IBD 18.4%, p < 0.001 (95% CI: 0.12–0.25; I 2 = 92.05%); and IBS 30.2%, p < 0.001 (95% CI: 0.21–0.40; I 2 = 91.84%). The respective forest plots are presented in the Appendix S1.
3.4.2. Subgroup Analyses by Sex
Subgroup analyses revealed a significantly higher prevalence of disordered eating in female gastrointestinal populations (81.7%, p < 0.001; 95% CI: 0.70–0.93; I 2 = 98.9%) than for male gastrointestinal populations (18.3%, p < 0.001; 95% CI: 0.07–0.30; I 2 = 98.9%). Given that 67.37% of the total sample were female, with an estimated disordered eating prevalence of 81.7%, and the remaining 32.63% were male, with a disordered eating prevalence of approximately 18.3%, the difference in expected prevalence rates—14.33% for females and males—accounts for the non‐significant meta‐regression findings for sex, despite significant differences in the subgroup analysis. The respective forest plots are presented in the Appendix S1.
3.4.3. Subgroup Analyses by Disordered Eating Scale
Subgroup analyses of prevalence by disordered eating scale were: EAT‐26 21.9%, p < 0.001 (95% CI: 0.13–0.31; I 2 = 95.9%); NIAS 33.6%, p = 0.002 (95% CI: 0.12–0.55; I 2 = 98.71); and SCOFF 32.8%, p < 0.001 (95% CI: 0.19–0.46; I 2 = 93.91%). The respective forest plots are presented in the Appendix S1.
4. Discussion
To our knowledge, this is the first systematic review and meta‐analysis that has examined the psychometric evaluations of disordered eating scales in gastrointestinal populations, as well as establish a prevalence of disordered eating in adult gastrointestinal and non‐gastrointestinal populations.
Our first research question found that only one disordered eating scale (the CD‐FAB) was psychometrically evaluated in adult gastrointestinal populations [19]. However, this single scale has no established cut‐offs to date, meaning it is limited in its use as a screening tool. Cronbach's alpha (i.e., internal consistency measure) was reported in 11 studies, with considerable variation. The fact that 16 of the 29 studies explicitly reported the unsuitability of the scales they used highlights a significant gap in the research concerning the validation and development of appropriate measures for assessing disordered eating in gastrointestinal populations. Moreover, the disordered eating scales used are intended to capture different types of eating behaviors, highlighting the inconsistency of current disordered eating measures in gastrointestinal populations.
Interestingly, several studies adapted the method of administering their chosen disordered eating scale, acknowledging that the use of the scale in their studies was primarily out of need, rather than suitability. This included Sultan et al. [5], where researchers independently evaluated the SCOFF question, “Would you say food dominates your life?” due to the assertion that food can act as a symptom trigger in IBS. Their findings revealed that 57% of individuals with IBS responded “yes” to this question, which was a higher prevalence than that of IBS patients who were designated as at risk for disordered eating on the SCOFF (33%). Moreover, Simons, Zavala and Taft (2024) [42] modified the original EDE‐Q, replacing the words “shape/weight” with “esophageal symptoms” in an attempt to align the original scale with their intended outcomes. Another study [40] changed the general population cutoff of > 24 on the NIAS to > 28, to account for baseline symptomatology of patients with IBD in an attempt to improve the validity of the measure in their study. Likewise, Satherley, Howard and Higgs' [24] finding that a single‐factor model of the EAT‐26 was sufficient (as opposed to the proposed three‐factor model [51]) indicates that the distinct subdomains of the scale are not suitable for measuring disordered eating in gastrointestinal populations (i.e., coeliac disease patients). Despite this, the study still used the three‐factor model of the EAT‐26, highlighting how the absence of validated disordered eating scales in gastrointestinal populations forces researchers to rely on measures they acknowledge as unsuitable.
Whether studies adjusted their method of administering disordered eating scales or not, the consistent finding is the pressing need for a more appropriate measure in gastrointestinal populations. One study did not modify the SCOFF administration in IBS populations [36] and reported that 36% of their participants responded positively to the food‐related question, “Would you say food dominates your life?”, and only 4% of the same cohort responded positively to the body image‐related question, “Do you believe yourself to be fat when others say you are too thin?”. Despite this 22% discrepancy between the two types of questions, the study did not address the potential unreliability of the scale. This aligns with the recommendation made by Gholmie et al. [33] who suggest distinguishing disordered eating due to dietary restrictions in gastrointestinal conditions from shape/weight‐motivated disordered eating. This speaks to the considerable entanglement between modified eating patterns to alleviate gastrointestinal distress, and eating to change weight/shape, the latter of these being a potential signal for the presence of an eating disorder [1]. Indeed, the growing clinical concern of over‐diagnosis of eating disorders (e.g., ARFID in individuals living with a disorder of gut‐brain interaction [DGBI]; formally referred to as functional gastrointestinal disorder [FGID]) is exemplified by these findings, stressing the need for valid measures that account for gastrointestinal symptoms, and often medically recommended dietary changes.
Our second research question found that approximately one‐third of adults with gastrointestinal conditions experience disordered eating, an estimate that falls within the mid‐range of the previously reported prevalence of 13%–55% [15]. In conducting a meta‐analysis, we present a more reliable estimate, as it synthesises an entire body of evidence rather than relying on individual studies. However, our results had a high level of heterogeneity. Considering the findings of our first research question—the gross lack of psychometric validity and reliability across disordered eating scales in gastrointestinal populations—it is likely that the scales used are inappropriate for accurately measuring disordered eating in gastrointestinal cohorts, possibly contributing to the high levels of heterogeneity. However, as observed in the subgroup analyses on disordered eating scales, the prevalence estimates across individual scales are relatively consistent, suggesting that while they may not be entirely valid, their influence on overall prevalence estimates is minimal. In essence, we have demonstrated that the scales are consistently reporting likely invalid disordered eating estimates in gastrointestinal populations, reinforcing the need for the development of more appropriate and valid measures. Moreover, the overall medium risk of bias suggests that other factors, such as varied sampling techniques, may have affected the validity of the findings. The results of the meta‐analysis are therefore recommended to be taken with caution. Moreover, this further supports the need for a disordered eating scale that is developed in gastrointestinal populations in line with established guidelines for developing measurements [6], thus controlling for a factor across the studies that could be influencing the validity of the results.
Although we found a higher prevalence of disordered eating in gastrointestinal populations when compared to non‐gastrointestinal populations, albeit by a small difference, conclusions cannot be made due to high heterogeneity. However, it remains plausible to think that there is a higher risk of disordered eating in gastrointestinal populations due to the restrictive diets recommended for these cohorts, as explicitly mentioned by a number of the studies included in this review [9, 24, 34, 36, 37, 38, 39, 40, 43, 45, 46, 49]. The difference in disordered eating between these populations is an area which future studies can address, and some validated disordered eating scale can measure.
4.1. Strengths and Limitations
A notable strength of this review was the inclusion of a meta‐analysis to quantify the prevalence of disordered eating in gastrointestinal populations. Included studies spanned 11 countries, increasing generalisability of the results. Moreover, the rigorous methods by which the study was conducted, wherein two independent researchers performed the study selection, data extraction, and quality assessment, speaks to the internal validity of our study, as well as minimising the risk of bias in the review.
Several limitations were present in this review. Primarily, the small number of studies meant that not all gastrointestinal conditions and disordered eating scales could be analysed, which restricted the exploration of possible reasons for the high heterogeneity. The inclusion of varying gastrointestinal conditions, each with distinct pathophysiological mechanisms and potential impacts on disordered eating, may reduce the specificity of the findings. The limited studies also precluded the ability to compare the interaction between combinations of scales and gastrointestinal diagnoses, an area that can be explored through further research. Including only observational studies means the quality of reporting, response rates of participants, and the sampling were inconsistent. This was quantified in the overall medium risk of bias, and thus reduces the overall robustness of conclusions drawn from this meta‐analysis.
4.2. Recommendations for Future Research
The findings of this review highlighted the importance of developing and validating a disordered eating scale for use in gastrointestinal populations. It is recommended that future studies that aim to develop validated disordered eating scales in gastrointestinal populations follow established guidelines for patient‐reported outcome measurement, such as those outlined by the U.S. Food and Drug Administration [6]. This could include the development of a new scale, or adapting a current scale to reflect the complex interaction of disordered eating and gastrointestinal symptoms, and in many cases, medically recommended dietary modifications. Exploring the effect of living with a gastrointestinal condition and how this impacts the responses to items on disordered eating scales is needed, particularly where items on these scales might refer to gastrointestinal symptoms and experiences. When assessing the prevalence of disordered eating in these populations, it is crucial that future studies use a broader range of study designs, as this will likely reflect the diversity of individuals living with gastrointestinal conditions. This will also remove biases that may be present due to opportunistic sampling and allow for the exploration of other factors that may be impacting disordered eating, including psychological comorbidities. When sufficient studies have been undertaken, future research should also explore the potential differences across disordered eating scales within specific GI conditions. Moreover, a similar study focusing on paediatric samples is recommended to explore disordered eating behaviours and beliefs in this population. Finally, prospective longitudinal studies are recommended to explore the suspected overlap between disordered eating behaviours and gastrointestinal conditions.
In conclusion, a disordered eating scale validated in gastrointestinal populations—a population at risk of developing disordered eating—is a significant gap in the current literature. The absence of validated measures in this population necessitates caution when applying these tools in such contexts. It is likely that the current scales available overestimate disordered eating, reflecting the growing concern of over‐diagnosis, such as ARFID in individuals living with DGBIs. Finally, while psychometric evaluation and potential revisions to disordered eating scales would be an important step forward, ultimately the development and validation of new scales which account for the complexity across gastrointestinal symptoms and often necessary dietary interventions are needed. However, while acknowledging the current limitations, the scales at this time may still be helpful for clinicians to aid in initial screening with the purpose to identify individuals who may be at risk and require a formal assessment relating to eating disorders.
Author Contributions
Olivia Marie Soliman: conception of study; methodology; formal analysis; data curation; writing – original draft; writing – review and editing; project administration. Antonina Mikocka‐Walus: conception of study; methodology; writing – review and editing; supervision. Molly M. Warner: data curation; writing – review and editing. David Skvarc: formal analysis; writing – review and editing. Lisa Olive: conception of study; methodology; writing – review and editing. Simon R. Knowles: conception of study; methodology; writing – review and editing; supervision. All authors approved the final draft of the manuscript.
Conflicts of Interest
The authors declare no conflicts of interest.
Supporting information
Appendix S1.
Acknowledgments
Authors would like to thank liaison librarian Miss Ramona Naicker for her support with the search strategy, and Miss Ruth Roffaell for her invaluable contributions to the editing of this manuscript. Open access publishing facilitated by Deakin University, as part of the Wiley ‐ Deakin University agreement via the Council of Australian University Librarians.
References
- 1. American Psychiatric Association , Diagnostic and Statistical Manual of Mental Disorders (5th ed., text rev. Washington, DC, 2022), 10.1176/appi.books.9780890425787. [DOI] [Google Scholar]
- 2. Santonicola A., Gagliardi M., Guarino M. P. L., Siniscalchi M., Ciacci C., and Iovino P., “Eating Disorders and Gastrointestinal Diseases,” Nutrients 11, no. 12 (2019): 3038, 10.3390/nu11123038. [DOI] [PMC free article] [PubMed] [Google Scholar]
- 3. Sato Y. and Fukudo S., “Gastrointestinal Symptoms and Disorders in Patients With Eating Disorders,” Clinical Journal of Gastroenterology 8, no. 5 (2015): 255–263, 10.1007/s12328-015-0611-x. [DOI] [PubMed] [Google Scholar]
- 4. Werlang M. E., Sim L. A., Lebow J. R., and Lacy B. E., “Assessing for Eating Disorders: A Primer for Gastroenterologists,” American Journal of Gastroenterology 116, no. 1 (2021): 68–76, 10.14309/ajg.0000000000001029. [DOI] [PubMed] [Google Scholar]
- 5. Sultan N., Foyster M., Tonkovic M., et al., “Presence and Characteristics of Disordered Eating and Orthorexia in Irritable Bowel Syndrome,” Neurogastroenterology and Motility 36, no. 7 (2024): e14797, 10.1111/nmo.14797. [DOI] [PMC free article] [PubMed] [Google Scholar]
- 6. U.S. Food and Drug Administration , “Guidance for Industry: Patient‐Reported Outcome Measures: Use in Medical Product Development to Support Labeling Claims,” (2009), Retrieved from, https://www.fda.gov/media/77832/download. [DOI] [PMC free article] [PubMed]
- 7. Day A. S., Yao C. K., Costello S. P., Andrews J. M., and Bryant R. V., “Food‐Related Quality of Life in Adults With Inflammatory Bowel Disease Is Associated With Restrictive Eating Behaviour, Disease Activity, and Surgery: A Prospective Multicentre Observational Study,” Journal of Human Nutrition and Dietetics 35, no. 1 (2022): 234–244, 10.1111/jhn.12920. [DOI] [PubMed] [Google Scholar]
- 8. Hollis E., Murray H. B., and Parkman H. P., “Relationships Among Symptoms of Gastroparesis to Those of Avoidant/Restrictive Food Intake Disorder in Patients With Gastroparesis,” Neurogastroenterology and Motility 36, no. 2 (2024): e14725, 10.1111/nmo.14725. [DOI] [PMC free article] [PubMed] [Google Scholar]
- 9. Burton Murray H., Riddle M., Rao F., et al., “Eating Disorder Symptoms, Including Avoidant/Restrictive Food Intake Disorder, in Patients With Disorders of Gut‐Brain Interaction,” Neurogastroenterology and Motility 34, no. 8 (2022): e14258, 10.1111/nmo.14258. [DOI] [PubMed] [Google Scholar]
- 10. Melchior C., Desprez C., Riachi G., et al., “Anxiety and Depression Profile Is Associated With Eating Disorders in Patients With Irritable Bowel Syndrome,” Frontiers in Psychiatry 10 (2019): 928, 10.3389/fpsyt.2019.00928. [DOI] [PMC free article] [PubMed] [Google Scholar]
- 11. Morgan J. F., Reid F., and Lacey J. H., “The SCOFF Questionnaire: Assessment of a New Screening Tool for Eating Disorders,” British Medical Journal 319, no. 7223 (1999): 1467–1468, 10.1136/bmj.319.7223.146. [DOI] [PMC free article] [PubMed] [Google Scholar]
- 12. Satherley R. M., Higgs S., and Howard R., “Disordered Eating Patterns in Coeliac Disease: A Framework Analysis,” Journal of Human Nutrition and Dietetics 30, no. 6 (2017): 724–736, 10.1111/jhn.12475. [DOI] [PubMed] [Google Scholar]
- 13. Böhn L., Störsrud S., and Simrén M., “Nutrient Intake in Patients With Irritable Bowel Syndrome Compared With the General Population,” Neurogastroenterology and Motility 25, no. 1 (2013): 23–30, 10.1111/nmo.12001. [DOI] [PubMed] [Google Scholar]
- 14. Wabich J., Bellaguarda E., Joyce C., Keefer L., and Kinsinger S., “Disordered Eating, Body Dissatisfaction, and Psychological Distress in Patients With Inflammatory Bowel Disease (IBD),” Journal of Clinical Psychology in Medical Settings 27, no. 2 (2020): 310–317, 10.1007/s10880-020-09710-y. [DOI] [PubMed] [Google Scholar]
- 15. Peters J. E., Basnayake C., Hebbard G. S., Salzberg M. R., and Kamm M. A., “Prevalence of Disordered Eating in Adults With Gastrointestinal Disorders: A Systematic Review,” Neurogastroenterology and Motility 34, no. 8 (2022): 1–11. [DOI] [PubMed] [Google Scholar]
- 16. Page M. J., McKenzie J. E., Bossuyt P. M., et al., “The PRISMA 2020 Statement: An Updated Guideline for Reporting Systematic Reviews,” British Medical Journal 372 (2021): n71, 10.1136/bmj.n71. [DOI] [PMC free article] [PubMed] [Google Scholar]
- 17. Veritas Health Innovation , “Covidence Systematic Review Software,” (2024), Retrieved from, https://www.covidence.org.
- 18. Schaefer L. M., Crosby R. D., and Machado P. P. P., “A Systematic Review of Instruments for the Assessment of Eating Disorders Among Adults,” Current Opinion in Psychiatry 34, no. 6 (2021): 543–562, 10.1097/yco.0000000000000746. [DOI] [PMC free article] [PubMed] [Google Scholar]
- 19. Satherley R.‐M., Howard R., and Higgs S., “Development and Validation of the Coeliac Disease Food Attitudes and Behaviours Scale,” Gastroenterology Research and Practice 2018, no. 1 (2018): 6930269, 10.1155/2018/6930269. [DOI] [PMC free article] [PubMed] [Google Scholar]
- 20. Duarte C., Pinto‐Gouveia J., and Ferreira C., “Expanding Binge Eating Assessment: Validity and Screening Value of the Binge Eating Scale in Women From the General Population,” Eating Behaviors 18 (2015): 41–47, 10.1016/j.eatbeh.2015.03.007. [DOI] [PubMed] [Google Scholar]
- 21. Stochel M., Janas‐Kozik M., Zejda J., Hyrnik J., Jelonek I., and Siwiec A., “Validation of ORTO‐15 Questionnaire in the Group of Urban Youth Aged 15–21,” Psychiatria Polska 49, no. 1 (2015): 119–134, 10.12740/PP/25962. [DOI] [PubMed] [Google Scholar]
- 22. Burton Murray H., Dreier M. J., Zickgraf H. F., et al., “Validation of the Nine Item ARFID Screen (NIAS) Subscales for Distinguishing ARFID Presentations and Screening for ARFID,” International Journal of Eating Disorders 54, no. 10 (2021): 1782–1792, 10.1002/eat.23520. [DOI] [PMC free article] [PubMed] [Google Scholar]
- 23. Burton‐Murray H., Kiser K., Gurung J., Williams K., Thomas J. J., and Khalili H., “Avoidant/Restrictive Food Intake Disorder Symptoms Are Not as Frequent as Other Eating Disorder Symptoms When Ulcerative Colitis Is in Remission,” Journal of Crohn's & Colitis 18 (2024): 1510–1513, 10.1093/ecco-jcc/jjae052. [DOI] [PMC free article] [PubMed] [Google Scholar]
- 24. Satherley R. M., Howard R., and Higgs S., “The Prevalence and Predictors of Disordered Eating in Women With Coeliac Disease,” Appetite 107 (2016): 260–267, 10.1016/j.appet.2016.07.038. [DOI] [PubMed] [Google Scholar]
- 25. Bloch D., Stuart A. D., and Pretorius H. G., “The Serotonin Connection in Ingestive Disorders in Women With and Without Irritable Bowel Syndrome (IBS),” Health SA Gesondheid 4, no. 1 (1999): 35–43, 10.4102/hsag.v4i1.10. [DOI] [Google Scholar]
- 26. Chan M. M. H., Zarate‐Lopez N., and Martin L., “Group Education on the Low FODMAP Diet Improves Gastrointestinal Symptoms but Neither Anxiety nor Depression in Irritable Bowel Syndrome,” Journal of Human Nutrition and Dietetics 35, no. 3 (2022): 425–434, 10.1111/jhn.12951. [DOI] [PubMed] [Google Scholar]
- 27. Herzog R., Álvarez‐Pasquin M. J., Díaz C., Del Barrio J. L., Estrada J. M., and Gil Á., “Are Healthcare workers' Intentions to Vaccinate Related to Their Knowledge, Beliefs and Attitudes? A Systematic Review,” BMC Public Health 13, no. 1 (2013): 154, 10.1186/1471-2458-13-154. [DOI] [PMC free article] [PubMed] [Google Scholar]
- 28. de Vet H. C. W., Terwee C. B., Mokkink L. B., and Knol D. L., Measurement in Medicine: A Practical guide (Cambridge: Cambridge University Press, 2011), 10.1017/CBO9780511996214. [DOI] [Google Scholar]
- 29. Borenstein M., Hedges L. V., Higgins J. P., and Rothstein H. R., Introduction to Meta‐Analysis (West Sussex, UK: John Wiley & Sons, 2021). [Google Scholar]
- 30. The jamovi project , “ jamovi (Version 2.5) [Computer Software],” (2024), Retrieved from, https://www.jamovi.org.
- 31. Wallis W. A. and Roberts H. V., The Nature of Statistics (New York, NY: Dover Publications, 2014). [Google Scholar]
- 32. Wardle R. A., Thapaliya G., Nowak A., et al., “An Examination of Appetite and Disordered Eating in Active Crohn's Disease,” Journal of Crohn's & Colitis 12, no. 7 (2018): 819–825, 10.1093/ecco-jcc/jjy041. [DOI] [PubMed] [Google Scholar]
- 33. Gholmie Y., Lee A. R., Satherley R. M., et al., “Maladaptive Food Attitudes and Behaviors in Individuals With Celiac Disease and Their Association With Quality of Life,” Digestive Diseases and Sciences 68, no. 7 (2023): 2899–2907, 10.1007/s10620-023-07912-6. [DOI] [PMC free article] [PubMed] [Google Scholar]
- 34. Zickgraf H. F., Loftus P., Gibbons B., Cohen L. C., and Hunt M. G., “If I Could Survive Without Eating, It Would Be a Huge Relief: Development and Initial Validation of the Fear of Food Questionnaire,” Appetite 169 (2022): 105808, 10.1016/j.appet.2021.105808. [DOI] [PubMed] [Google Scholar]
- 35. Stoleru G., Leopold A., Auerbach A., Nehman S., and Wong U., “Female Gender, Dissatisfaction With Weight, and Number of IBD‐Related Surgeries as Independent Risk Factors for Eating Disorders Among Patients With Inflammatory Bowel Diseases,” BMC Gastroenterology 22, no. 1 (2022): 438, 10.1186/s12876-022-02526-0. [DOI] [PMC free article] [PubMed] [Google Scholar]
- 36. Mari A., Hosadurg D., Martin L., Zarate‐Lopez N., Passananti V., and Emmanuel A., “Adherence With a Low‐FODMAP Diet in Irritable Bowel Syndrome: Are Eating Disorders the Missing Link?,” European Journal of Gastroenterology & Hepatology 31, no. 2 (2019): 178–182, 10.1097/MEG.0000000000001317. [DOI] [PubMed] [Google Scholar]
- 37. Arigo D., Anskis A. M., and Smyth J. M., “Psychiatric Comorbidities in Women With Celiac Disease,” Chronic Illness 8, no. 1 (2012): 45–55, 10.1177/1742395311417639. [DOI] [PubMed] [Google Scholar]
- 38. Evans K. M., Averill M. M., and Harris C. L., “Disordered Eating and Eating Competence in Members of Online Irritable Bowel Syndrome Support Groups,” Neurogastroenterology and Motility 35, no. 8 (2023): e14584, 10.1111/nmo.14584. [DOI] [PMC free article] [PubMed] [Google Scholar]
- 39. Fink M., Simons M., Tomasino K., Pandit A., and Taft T., “When Is Patient Behavior Indicative of Avoidant Restrictive Food Intake Disorder (ARFID) vs. Reasonable Response to Digestive Disease?,” Clinical Gastroenterology and Hepatology 20, no. 6 (2022): 1241–1250, 10.1016/j.cgh.2021.07.045. [DOI] [PMC free article] [PubMed] [Google Scholar]
- 40. Robelin K., Senada P., Ghoz H., et al., “Prevalence and Clinician Recognition of Avoidant/Restrictive Food Intake Disorder in Patients With Inflammatory Bowel Disease,” Gastroenterology & Hepatology 17, no. 11 (2021): 510–514, PMCID: PMC9021160. [PMC free article] [PubMed] [Google Scholar]
- 41. Yelencich E., Truong E., Widaman A. M., et al., “Avoidant Restrictive Food Intake Disorder Prevalent Among Patients With Inflammatory Bowel Disease,” Clinical Gastroenterology and Hepatology 20, no. 6 (2022): 1282–1289, 10.1016/j.cgh.2021.08.009. [DOI] [PubMed] [Google Scholar]
- 42. Simons M., Zavala S., and Taft T., “When Dietary Modification Turns Problematic in Patients With Esophageal Conditions,” Neurogastroenterology and Motility 36 (2024): e14772, 10.1111/nmo.14772. [DOI] [PubMed] [Google Scholar]
- 43. Fraser C. N., Moller S. P., and Knowles S. R., “Understanding Disease‐Specific and Non‐specific Factors Predicting Disordered Eating in Adults With Coeliac Disease,” Appetite 168 (2022): 105744, 10.1016/j.appet.2021.105744. [DOI] [PubMed] [Google Scholar]
- 44. Franco L., Nakano E. Y., Raposo A., et al., “Eating Attitudes of Patients With Celiac Disease in Brazil: A Nationwide Assessment With the EAT‐26 Instrument,” Nutrients 15, no. 22 (2023): 16, 10.3390/nu15224796. [DOI] [PMC free article] [PubMed] [Google Scholar]
- 45. Nisihara R., Techy A. C. M., Staichok C., et al., “Prevalence of Eating Disorders in Patients With Celiac Disease: A Comparative Study With Healthy Individuals,” Revista Da Associacao Medica Brasileira 70, no. 1 (2024): e20231090, 10.1590/1806-9282.20231090. [DOI] [PMC free article] [PubMed] [Google Scholar]
- 46. Yin T., Tu W., Li Y., et al., “Risk of Avoidant/Restrictive Food Intake Disorder in Patients With Inflammatory Bowel Disease: Predictive Value of Disease Phenotype, Disease Activity and Food Literacy,” Journal of Eating Disorders 11, no. 1 (2023): 211, 10.1186/s40337-023-00936-3. [DOI] [PMC free article] [PubMed] [Google Scholar]
- 47. Di Giorgio F. M., Modica S. P., Saladino M., et al., “Food Beliefs and the Risk of Orthorexia in Patients With Inflammatory Bowel Disease,” Nutrients 16, no. 8 (2024): 17, 10.3390/nu16081193. [DOI] [PMC free article] [PubMed] [Google Scholar]
- 48. Quiroga‐Castaneda P. P., Berrios‐Villegas I., Valladares‐Garrido D., et al., “Irritable Bowel Syndrome in Medical Students at a Peruvian University: A Cross‐Sectional Study,” Frontiers in Medicine 11 (2024): 1341809, 10.3389/fmed.2024.1341809. [DOI] [PMC free article] [PubMed] [Google Scholar]
- 49. Kujawowicz K., Mironczuk‐Chodakowska I., and Witkowska A. M., “Dietary Behavior and Risk of Orthorexia in Women With Celiac Disease,” Nutrients 14, no. 4 (2022): 21, 10.3390/nu14040904. [DOI] [PMC free article] [PubMed] [Google Scholar]
- 50. Kayar Y., Agin M., Dertli R., et al., “Eating Disorders in Patients With Irritable Bowel Syndrome,” Gastroenterology and Hepatology 43, no. 10 (2020): 607–613, 10.1016/j.gastrohep.2020.03.001. [DOI] [PubMed] [Google Scholar]
- 51. Garner D. M., Olmsted M. P., Bohr Y., and Garfinkel P. E., “The Eating Attitudes Test: Psychometric Features and Clinical Correlates,” Psychological Medicine 12, no. 4 (1982): 871–878, 10.1017/s0033291700049163. [DOI] [PubMed] [Google Scholar]
Associated Data
This section collects any data citations, data availability statements, or supplementary materials included in this article.
Supplementary Materials
Appendix S1.