

Abstract
Background:
Future US Congressional funding for the President’s Emergency Plan for AIDS Relief (PEPFAR) program is uncertain.
Objective:
To evaluate the clinical and economic impacts of abruptly scaling back PEPFAR funding ($460 million) from South Africa’s total HIV budget ($2.56 billion) in 2024.
Design:
Model-based analysis of 100%, 50%, and 0% PEPFAR funding with proportional decreases in HIV diagnosis rates (26.0, 24.3, 22.6/100 person-years [PY]), one-year treatment engagement (people with HIV [PWH] on/initiating antiretroviral therapy: 92.2%/80.4%, 87.1%/76.0%, 82.0%/71.5%), and primary prevention (4.0%, 2.2%, 0.5% reduction in incidence with no programming [1.24/100PY]).
Data sources:
Published HIV care continuum, PEPFAR funding estimates.
Target population:
South African adults (HIV prevalence: 16.2%; incidence: 0.32/100PY).
Time horizon:
Lifetime.
Perspective:
Healthcare sector.
Interventions:
PEPFAR funded 100% (PEPFAR_100%), 50% (PEPFAR_50%), 0% (PEPFAR_0%).
Outcome measures:
HIV infections, life expectancy, lifetime costs (2023 USD).
Results of base case analysis:
With current HIV programming (PEPFAR_100%), 1,190,000 new infections are projected over 10 years; life expectancy would be 61.42 years for PWH with lifetime costs of $11,180/PWH. Reduced PEPFAR funding (PEPFAR_50% and PEPFAR_0%) would add 286,000 and 565,000 new infections, respectively. PWH would lose 2.02 and 3.71 life-years with nominal lifetime cost reductions of $620/PWH and $1,140/PWH that would be offset at the population level by more PWH requiring treatment for infection.
Results of sensitivity analysis:
Countries with similar HIV prevalence and greater reliance on PEPFAR funding could experience disproportionately higher incremental infections and survival losses.
Limitation:
Budget fungibility and exact programmatic implications of reducing PEPFAR funding are unknown.
Conclusion:
Abrupt PEPFAR cutbacks would have immediate and long-term detrimental impacts on epidemiologic and clinical HIV outcomes in South Africa.
Primary funding source:
National Institutes of Health.
INTRODUCTION
South Africa has the world’s largest HIV epidemic, with 7.4 million adults with HIV and 152,000 new infections in 2023 (1). Recent strides have brought the nation close to meeting UNAIDS’ 95-95-95 targets: 94% of people with HIV (PWH) aware of their status, 80% of those aware on antiretroviral therapy (ART), and 89% of PWH on ART virally suppressed (1).
While this progress is largely attributable to domestic investments, international partners have played an important role, including the United States (US) President’s Emergency Plan for AIDS Relief (PEPFAR) program (2). With over $8 billion invested in South Africa and $110 billion worldwide since its inception in 2003 (3), PEPFAR supports over 20 million PWH in 55 countries (4). In 2022, $460 million from PEPFAR represented 18% of South Africa’s $2.56 billion HIV budget (5).
PEPFAR is a highly successful global health initiative and is recognized for its role in strengthening sustainable country-led systems, an important component of US foreign policy (6-8). PEPFAR’s future, however, is uncertain, as false claims about the misuse of PEPFAR funds and political shifts have led to waning bipartisan Congressional support (9-11). While the program secured short-term funding through March 2025 (12), long-term support remains unclear. Our objective is to assess the potential clinical and economic ramifications of curtailed PEPFAR support in South Africa to inform policy decisions by Congress and global health leaders and provide an evidence base to clinicians and the American public.
METHODS
Analytic overview
We use the CEPAC-International mathematical model to simulate 2024 HIV programming in South Africa with no cutbacks (PEPFAR_100%), partial cutbacks (PEPFAR_50%), and complete cutbacks (PEPFAR_0%) in PEPFAR funding. We model all South African adults (N=45,680,760) in 2024 over a lifetime: people with prevalent HIV (N=7,400,000) and people without HIV (N=38,280,760) including those who acquire HIV after 2024 (1,13). We assume that funding cutbacks are permanent in the base case, and limit cutbacks to five years in a secondary analysis. We estimate proportional decreases in HIV testing capacity, treatment engagement, and primary prevention with pre-exposure prophylaxis (PrEP) and voluntary medical male circumcision (VMMC), assuming fixed returns on PEPFAR investments (Appendix Methods, Table S1) (1,5). We assume non-PEPFAR funding would remain constant (4,14), and the availability of acute care for PWH would remain unchanged.
We report the HIV care continuum at 5 years and new HIV infections and HIV-related deaths at 10 years to demonstrate short-term epidemiologic impacts of PEPFAR cutbacks. We report lifetime outcomes for people with prevalent HIV (N=7,400,000) and the South African population (N=45,680,760) (1,13), including life expectancy and HIV-related costs in 2023 USD from a healthcare sector perspective (i.e., excluding nonmedical resource consumption, time, productivity; Appendix Methods) (15). We calculate decremental cost-effectiveness ratios (DCERs: ratios of the differences in 3%/year discounted lifetime costs and life-years) to quantify savings per year-of-life lost among people with prevalent HIV (16). While there are no generally agreed-upon thresholds by which to evaluate a DCER, empirical studies consistently find that decision makers’ minimum acceptable savings per year of life lost exceeds the maximum they are willing to pay per year of life gained (16,17).
Model structure
CEPAC-International model
The CEPAC-International model is a validated mathematical model of HIV diagnosis, treatment, and transmission (https://mpec.massgeneral.org/cepac-model/) (18,19). Simulated PWH receive user-specified characteristics (e.g., initial age, sex, CD4 count, HIV RNA) and experience CD4-dependent risks of opportunistic infections and HIV-related mortality. PWH have an initial probability of viral suppression on ART. Without suppressive ART, CD4 count declines monthly. With suppressive ART, PWH experience monthly increases in CD4 count and risks of virologic failure, care disengagement, and re-engagement. PWH face monthly risks of age- and sex-stratified non-HIV-related mortality and HIV RNA-dependent HIV transmission. The model generates HIV transmission rates representative of total community HIV RNA, which are used to project outcomes for one generation of incident HIV infection (Appendix Methods).
Model inputs
Modeled population
We model 7,400,000 adults with prevalent HIV using 2024 HIV care continuum data: 410,398 (5.6%) undiagnosed, 1,414,662 (19.1%) diagnosed but not on ART, and 5,574,940 (75.3%) diagnosed and on ART (Table 1) (1). We also model all 38,280,760 South African adults without HIV (1,13). Mean initial age is 30.3 years for undiagnosed PWH and people without HIV, and 39.2 years for diagnosed PWH (Table 1, Appendix Methods) (20). PWH on ART have a higher mean initial CD4 count (553/μL) reflecting prior HIV treatment compared with those who are undiagnosed (484/μL) or diagnosed but off ART (481/μL) (Appendix Methods) (20). Among PWH on ART at model start, 88.5% are virally suppressed (20).
Table 1:
Model inputs for an analysis of cutbacks in 2024 PEPFAR funding in South Africa
| Variable | Base case value | Range | Source | |
|---|---|---|---|---|
| 2024 HIV care continuum, n (%) | ||||
| Undiagnosed | 410,398 (5.6%) | –* | (1) | |
| Diagnosed, off ART | 1,414,662 (19.1%) | –* | (1) | |
| Diagnosed, on ART | 5,574,940 (75.3%) | –* | (1) | |
| Cohort characteristics: PWH | Undiagnosed | Diagnosed | ||
| Age, mean (SD), years | 30.3 (10.0)† | 39.2 (11.0) | 20–45 | (20) |
| Female sex, % | 63.3 | 68.6 | –* | (20) |
| CD4 count, mean (SD), cells/μL | 484 (134)† | 481 (319), off ART 553 (312), on ART |
± 1 SD | (20,56) |
| Virologic suppression, % | 0.0 | 0.0, off ART 88.5, on ART |
– | (20,57,58) |
| Cohort characteristics: people without HIV at model start | ||||
| Age, mean (SD), years | 30.3 (10.0) | 25–45 | (20) | |
| Female sex, % | 63.3 | –* | (20) | |
| HIV natural history | ||||
| HIV mortality monthly probability, range by OI, CD4, ART status | 0.0001–0.0953 | 0.5–2.0x | (59,60) | |
| HIV treatment | ||||
| ART adherence, mean (SD), % | ||||
| On ART | 85.1 (19.5) | – | (61) | |
| (Re)-initiating ART | 66.8 (28.8) | – | (62) | |
| HIV treatment, continued | ||||
| 48-week viral suppression, %, range by ART adherence‡ | ||||
| First-line: TDF/3TC/DTG | 0.0–93.8 | 90–100 | (63-66) | |
| Second-line: ABC/FTC/ATV/r | 0.0–84.2 | 75–90 | (63-66) | |
| HIV transmission and prevention | ||||
| HIV transmission rate per 100PY, range by HIV RNA | 0.0–9.0 | 0.5–2.0x | (28) | |
| Status quo HIV incidence/100PY | 0.32 | 0.2–0.5 | (1) | |
| Costs (2023 USD) | ||||
| HIV diagnosis, per result | ||||
| Negative | 3.80 | 0.5–2.0x | (67) | |
| Positive | 5.90 | 0.5–2.0x | (67) | |
| ART, monthly | ||||
| TDF/3TC/DTG | 3.60 | 0.5–2.0x | (68) | |
| ABC/FTC/ATV/r | 13.70 | 0.5–2.0x | (68) | |
| OI prophylaxis, monthly | 5.10 | 0.5–2.0x | (26) | |
| CD4 count test | 8.20 | 0.5–2.0x | (26) | |
| HIV RNA test | 31.10 | 0.5–2.0x | (26) | |
| OI treatment, range by OI | 208.00–725.00 | 0.5–2.0x | (30-32) | |
| HIV care, monthly, range by CD4 | 14.00–137.00 | 0.5–2.0x | (30-32) | |
Abbreviations: PEPFAR, President’s Emergency Plan for AIDS Relief; ART, antiretroviral therapy; SD, standard deviation; OI, opportunistic infection; PY, person-years; TDF, tenofovir disoproxil fumarate; 3TC, lamivudine; DTG, dolutegravir; ABC, abacavir; FTC, emtricitabine; ATV/r, ritonavir-boosted atazanavir; USD, United States dollar.
Subgroup stratified outcomes are reported in sensitivity analyses in the Appendix.
Calibrated to published data at ART initiation: mean age of 32.9 years and CD4 count of 481 cells/μL. See Appendix Methods: HIV testing.
48-week viral suppression rates are linearly interpolated between 10% and 85% adherence.
HIV natural history
HIV-related mortality is dependent on CD4 count, ART status, and present or prior opportunistic infection (Table 1). PWH on ART experience lower risks of opportunistic infection and mortality than PWH off ART. Non-HIV-related mortality is derived from age- and sex-stratified HIV-deleted lifetables (Appendix Table S2).
HIV testing
With PEPFAR_100%, we calculate an HIV diagnosis rate of 26.0/100 person-years (PY) based on 417,000 diagnoses estimated in 2023 (Table 2, Appendix Methods) (21,22). We calculate a cost of $102/diagnosis based on $42.4 million allocated for HIV testing, of which PEPFAR funds $4.8 million (Appendix Table S1) (5). Assuming a fixed $102/diagnosis, we estimate 394,000 diagnoses (24.3/100PY) with PEPFAR_50% (−$2.4 million) and 370,000 diagnoses (22.6/100PY) with PEPFAR_0% (−$4.8 million) (5).
Table 2:
Modeled assumptions of the relationship between cutbacks in 2024 PEPFAR funding and HIV programming in South Africa
| Program | Model input | Base case value,* PEPFAR: | Sensitivity analyses,† PEPFAR: | Source | ||||
|---|---|---|---|---|---|---|---|---|
| 100% | 50% | 0% | 50% | 0% | ||||
| HIV testing | HIV diagnosis rate, per 100 person-years | 26.0 | 24.3 | 22.6 | Resilient | 25.3 | 23.5 | (5,21,22) |
| Susceptible | 21.5 | 18.5 | ||||||
| Care & treatment | Care engagement at one year, %: PWH already on ART / (re)-initiating ART | 92.2 / 80.4 | 87.1 / 76.0 | 82.0 / 71.5 | Resilient | 90.1 / 78.6 | 84.8 / 74.0 | (5,22,24) |
| Susceptible | 78.6 / 68.5 | 68.7 / 59.9 | ||||||
| Prevention | HIV incidence reduction with primary prevention services, %‡ | 4.0 | 2.2 | 0.5 | Resilient | 3.3 | 1.6 | (5,29) |
| Susceptible | 1.8 | 0.2 | ||||||
Abbreviations: PEPFAR, President’s Emergency Plan for AIDS Relief; PWH, people with HIV; ART, antiretroviral therapy.
Base case inputs are estimated using a proportional (linear) relationship in cutbacks in PEPFAR funding and HIV programming.
Resilient scenario reflects ability of existing HIV programming to withstand cutbacks in up to 30% PEPFAR funding. Susceptible scenario reflects sensitivity of existing HIV programming to cutbacks with diminishing returns on investments (Appendix Methods).
Relative to a projected HIV incidence of 1.24/100PY in the absence of any HIV programming (Appendix Methods).
HIV treatment
We model current South African HIV treatment guidelines: two ART regimens, CD4 and HIV RNA monitoring, and opportunistic infection prophylaxis (Appendix Methods) (23). We assume all PWH receiving or initiating ART are prescribed a dolutegravir-based regimen (20). Viral suppression probabilities are pooled from ART efficacy trials (Table 1).
Care engagement
We vary care engagement to represent decreased treatment capacity resulting from an abrupt $217 million PEPFAR cutback for HIV treatment (Appendix Table S1) (5). Of the $1.962 billion HIV treatment budget in South Africa (5), we calculate $307 million to be allocated for PWH who (re)-initiate ART based on 1,031,000 ART (re)-initiations in 2023, 80.4% care engagement at one year (829,000 PWH), and $371/person for the first year of treatment (Table 2, Appendix Methods) (22,24-26). We calculate the remaining $1.655 billion to be allocated for the 5,574,940 PWH already on ART based on 92.2% care engagement at one year (5,140,000 PWH) and $322/person per subsequent year of treatment (5,24,26,27). We assume that PEPFAR funding cutbacks for HIV treatment would be proportional to existing allocations for PWH (re)-initiating ART and PWH already on ART, and that costs for the first and subsequent years of treatment would not change. With PEPFAR_50% (−$109 million) and PEPFAR_0% (−$217 million), we estimate care engagement at one year to decrease from 829,000 (80.4%) to 783,000 (76.0%) and 737,000 (71.5%) PWH (re)-initiating ART, and from 5,140,000 (92.2%) to 4,856,000 (87.1%) and 4,572,000 (82.0%) PWH already on ART. We use IeDEA cohort data to derive adherence-stratified probabilities of care disengagement (Appendix Table S2) (24).
HIV transmissions and prevention
We project transmissions over five years from 7,400,000 people with prevalent HIV using HIV RNA-dependent transmission rates (0.0–9.0/100PY; Table 1) (28). From these transmissions, we estimate an HIV incidence of 0.37/100PY reflecting community levels of HIV RNA and the preventive impacts of HIV testing and ART (Appendix Methods). We next estimate the impact of primary prevention programming on HIV incidence; we conservatively assume that funding cutbacks would only affect PrEP and VMMC because these services rely on PEPFAR-supplied commodities (5). We assume behavior norms would not be affected by decreased HIV funding or programming (e.g., condom use, sexual practices). Based on current PrEP and VMMC uptake (400,000 and 173,000, respectively), we estimate these services would contribute a further 0.05/100PY reduction in HIV incidence (calculated as a 4.0% reduction in a theoretical incidence of 1.24/100PY projected in the absence of any HIV programming; Table 2, Appendix Methods) (1,22). We apply the 0.37/100PY incidence rate and 0.05/100PY incidence reduction to a cohort without HIV to reflect the risk of HIV acquisition with current programming (PEPFAR_100%). The resulting rate of 0.32/100PY matches published incidence estimates in South Africa (1). We calculate incidence reductions of 0.02/100PY (2.2% relative to a theoretical incidence of 1.24/100PY with no HIV programming) with PEPFAR_50% (−$57 million) and 0.01/100PY (0.5%) with PEPFAR_0% (−$113 million) (Appendix Methods) (5,29). We assume a fixed incidence over the model horizon to project outcomes to epidemiologic scale with primary transmissions only (i.e., one generation of transmissions from the cohort with prevalent HIV).
Costs
We model costs of ART ($3.60–13.70/month), CD4 monitoring ($8.20/test), HIV RNA monitoring ($31.10/test), opportunistic infection treatment ($208.00–725.00), and routine HIV care ($14.00–137.00/month) (Table 1, Appendix Methods) (26,30-32).
Sensitivity analyses
In one-way sensitivity analyses, we examine the impact of single input variation across plausible ranges (Table 1). In multiway sensitivity analyses, we examine the combined impact of varying cutbacks in HIV testing, treatment, and prevention.
Scenario analyses
Scenario analysis is a powerful means of examining the effects of simultaneous variation in several key parameters to simulate plausible alternatives from the base case. We model a “resilient” scenario where programming would remain unchanged with up to 30% cutbacks in PEPFAR funding, and a “susceptible” scenario where programming cutbacks would occur at a greater rate than funding cutbacks (Table 2, Appendix Methods). We model a “return to current status quo in 2029” scenario reflecting a hypothetical five-year lag to reallocate and/or identify other funds to fill the budget void created by PEPFAR cutbacks. We also model a “larger PEPFAR funding profile” scenario where PEPFAR funding in South Africa mirrors its support in Zimbabwe (HIV prevalence: 12.6%): 55% of testing, 45% of treatment, and 77% of prevention programming (Appendix Table S2) (33).
Role of the funding source:
The funding sources had no role in the design, analysis, or interpretation of the study. The content of this manuscript does not necessarily represent the views of the National Institutes of Health.
RESULTS
Base case results
Clinical outcomes: HIV infections and incidence
With status quo HIV programming in South Africa (PEPFAR_100%), 1,190,000 individuals are projected to acquire HIV by 10 years (incidence: 0.32/100PY), which would increase to 1,476,000 (0.40/100PY) with PEPFAR_50% and 1,755,000 (0.48/100PY) with PEPFAR_0% (Table 3).
Table 3:
Projected clinical and economic outcomes of no (PEPFAR_100%), partial (PEPFAR_50%), and complete (PEPFAR_0%) cutbacks in 2024 PEPFAR funding and base case, resilient, and susceptible HIV programming in South Africa
| Strategy | HIV incidence |
Population outcomes at 10 years, n (+X%)* |
Per person outcomes | ||||
|---|---|---|---|---|---|---|---|
| HIV (n = 7.4 million) | Population (n = 45.7 million) | ||||||
| Per 100PY | New HIV infections† |
HIV-related deaths‡ |
Life- years§ |
Lifetime costs, 2023 USD§ |
Life- years§ |
Lifetime costs, 2023 USD§ |
|
| Base case | |||||||
| PEPFAR_100% | 0.32∥ | 1,190,000 | 1,585,000 | 22.71 | 11,180 | 37.26 | 2,550 |
| PEPFAR_50% | 0.40 | 1,476,000 (+24%) |
1,900,000 (+20%) |
20.69 | 10,560 | 36.63 | 2,580 |
| PEPFAR_0% | 0.48 | 1,755,000 (+47%) |
2,186,000 (+38%) |
19.00 | 10,040 | 36.05 | 2,620 |
| Resilient scenario | |||||||
| PEPFAR_50% | 0.36 | 1,310,000 (+10%) |
1,726,000 (+9%) |
21.79 | 10,900 | 36.97 | 2,560 |
| PEPFAR_0% | 0.44 | 1,602,000 (+35%) |
2,040,000 (+29%) |
19.84 | 10,300 | 36.35 | 2,600 |
| Susceptible scenario | |||||||
| PEPFAR_50% | 0.49 | 1,809,000 (+52%) |
2,365,000 (+49%) |
17.91 | 9,700 | 35.77 | 2,570 |
| PEPFAR_0% | 0.62 | 2,264,000 (+90%) |
2,911,000 (+84%) |
15.25 | 8,830 | 34.78 | 2,600 |
Abbreviations: PEPFAR, President’s Emergency Plan for AIDS Relief; PY, person-years; USD, United States dollar.
Projections are undiscounted and rounded to the nearest 1,000, followed by an “+X%” increase relative to PEPFAR_100%.
Projected increases in new HIV infections relative to PEPFAR_100% reflect greater primary transmissions from 7,400,000 people with prevalent HIV to 38,280,760 people without HIV over 10 years.
HIV-related deaths are among people with prevalent and incident HIV over 10 years.
Life-years and HIV-related costs are undiscounted, projected from model start, and rounded to the nearest 0.01 year and $10.
Estimated based on current HIV programming (Appendix Methods). Matches published estimates in South Africa.(1)
Clinical outcomes: HIV-related deaths and per-person life-years
South Africa would face 1,585,000 HIV-related deaths over 10 years with PEPFAR_100%; deaths would increase by 315,000 (+20%) with PEPFAR_50% and 601,000 (+38%) with PEPFAR_0% (Table 3). People with prevalent HIV would live 22.71 life-years from model start with PEPFAR_100%, 20.69 with PEPFAR_50%, and 19.00 with PEPFAR_0%. PWH already on ART would experience the greatest life expectancy losses (Appendix Table S3). Among all 45,680,760 adults in South Africa, life-years lived from model start would decrease from 37.26 to 36.63 and 36.05, respectively.
Clinical outcomes: HIV care continuum
The estimated 2024 HIV care continuum in South Africa is 94-80-89 (1). The projected HIV care continuum in 2029 would improve to 95-85-90 with PEPFAR_100% but worsen to 94-79-89 with PEPFAR_50% and 92-73-88 with PEPFAR_0% (Figure 1).
Figure 1: Projected HIV care continuum in 2029 with no cutbacks (PEPFAR_100%), partial cutbacks (PEPFAR_50%), and complete cutbacks (PEPFAR_0%) in 2024 PEPFAR funding.

The estimated 2024 HIV care cascade (black bars) is based on published data (1). The projected HIV care cascade in 2029 is shown for PEPFAR_100% (dark blue bars), PEPFAR_50% (blue bars), and PEPFAR_0% (light blue bars). Each set of bars represents PWH who are aware of their HIV status, receiving ART, and virally suppressed (HIV RNA <20 copies/mL), respectively. The percents shown are in respect to the conditional UNAIDS’ 95-95-95 epidemic targets (i.e., proportion of all PWH who are aware of their status, proportion of PWH aware of their status who are receiving ART, and proportion of PWH receiving ART who are virally suppressed). The estimated number of PWH alive in South Africa in 2024 is 7,400,000; the projected number of PWH alive in 2029 would be 6,913,000 with PEPFAR_100%, 6,950,000 with PEPFAR_50%, and 6,997,000 with PEPFAR_0%. The number of PWH associated with each bar is labeled below and rounded to the nearest 10,000. Abbreviations: PWH, people with HIV; ART, antiretroviral therapy; PEPFAR, President’s Emergency Plan for AIDS Relief.
Economic outcomes: people with prevalent HIV
Projected lifetime costs for people with prevalent HIV would decrease from $11,180/person with PEPFAR_100% to $10,560/person with PEPFAR_50% and $10,040/person with PEPFAR_0% due to lower life expectancy among PWH and reduced healthcare access (Table 3). However, HIV-related costs would increase for people with prevalent HIV in the shorter term due to increased expenditure for PWH off ART (Tables S4A-S4B).
Economic outcomes: South African population
Lifetime costs would increase for all 45,680,760 South African adults from $2,550/person with PEPFAR_100% to $2,580/person with PEPFAR_50% and $2,620/person with PEPFAR_0%, reflecting greater healthcare expenditures for a population with greater HIV-related morbidity (Table 3). Over 10 years, expenditures would increase by $880 million with PEPFAR_50% and $1.70 billion with PEPFAR_0% relative to current spending (Appendix Tables S4A-S4B). These increases reflect greater costs of acute care for an overall sicker population off ART despite fewer routine care costs for those on ART.
Sensitivity analyses
One-way sensitivity analysis
In one-way sensitivity analysis, additional infections at 10 years ranged 211,000–385,000 and 419,000–795,000 with PEPFAR_50% and PEPFAR_0% compared with PEPFAR_100% (Figure 2A). Per-person life-years lost ranged 1.28–2.72 and 2.17–4.93 for people with prevalent HIV (Appendix Figure S1) and 0.47–0.90 and 0.86–1.72 for the entire population (Figure 2B). Projected new infections were most sensitive to parameters that influenced community HIV RNA (e.g., care engagement, primary prevention, CD4 count) whereas life expectancy was most sensitive to parameters that influenced disease severity (e.g., age, CD4 count, HIV-related mortality) (Appendix Figures S2-S4). Due to life-years lost, lifetime costs decreased for PWH across all ranges examined (Appendix Figure S5); these costs were offset at the population level by treatment costs of new infections unless survival among PWH was very low (Appendix Figure S6). Costs of HIV care and opportunistic infection treatment had the greatest impacts on projected lifetime costs (Appendix Figures S7-S8).
Figure 2: One-way sensitivity analysis on additional HIV infections at 10 years (Panel A) and on life-years lost among the population (Panel B) with partial (PEPFAR_50%) and complete (PEPFAR_0%) cutbacks in 2024 PEPFAR funding compared with no cutbacks (PEPFAR_100%).
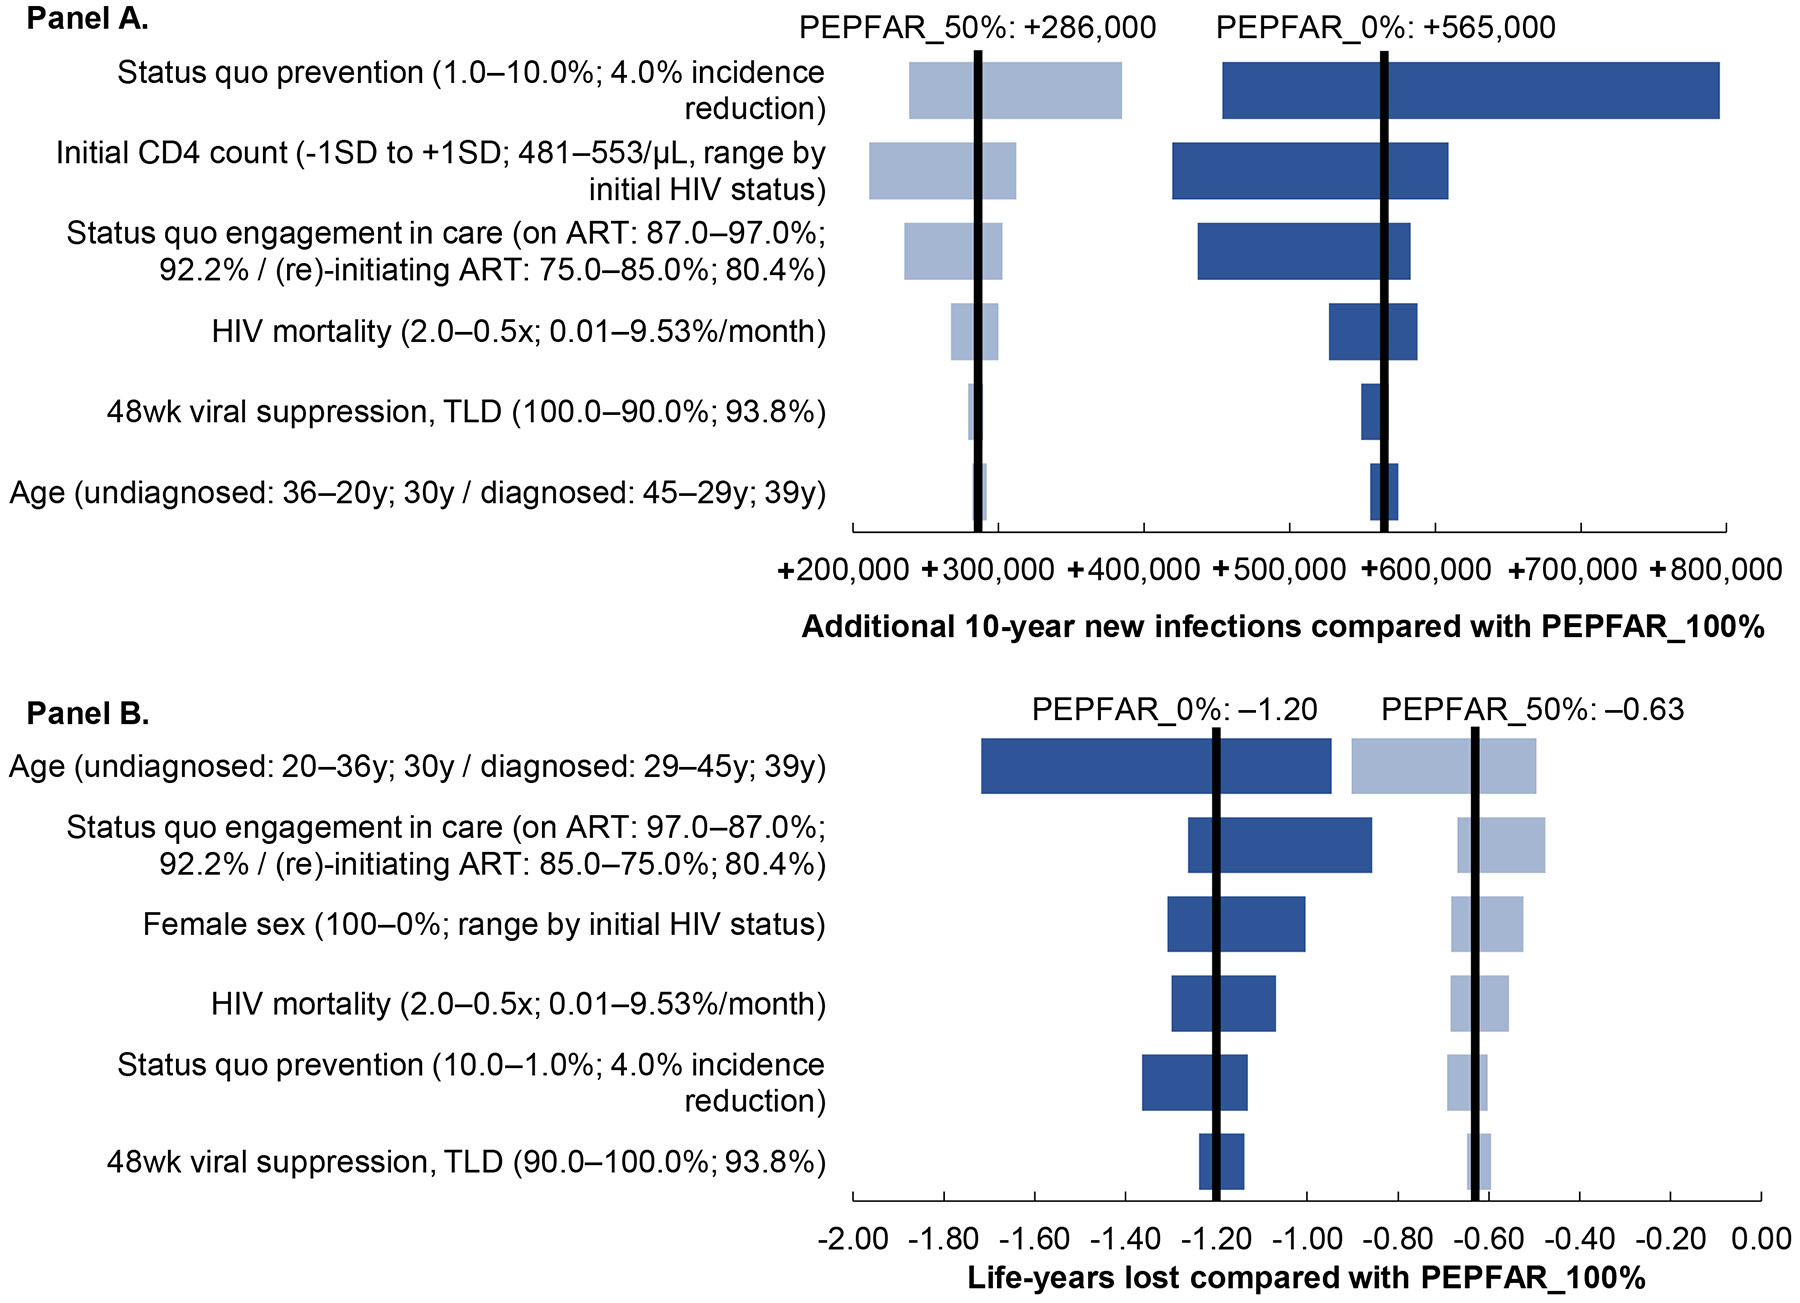
A tornado diagram displays the sensitivity of a key outcome measure (additional HIV infections in Panel A; and life years lost in Panel B) to variation in different model input parameter values. The y-axis shows input parameters for which one-way sensitivity analyses were performed, with the range examined in parentheses followed by the base case value. The x-axis shows additional HIV infections (Panel A) and life years lost (Panel B). The left and right black vertical lines represent the base case value with PEPFAR_50% and PEPFAR_0% compared with PEPFAR_100%. The horizontal bars (light blue: PEPFAR_50%, dark blue: PEPFAR_0%) represent the sensitivity of projected additional infections (Panel A) and projected life-years lost (Panel B) to the six most impactful parameters. Other parameters exerted little or no influence on the outcome including proportion of female sex, status quo rates of HIV diagnosis, and 48-week viral suppression on protease inhibitor-based ART. Abbreviations: PEPFAR, President’s Emergency Plan for AIDS Relief; SD, standard deviation; ART, antiretroviral therapy.
Multiway sensitivity analysis
Scaling back primary prevention programming alone would produce modest increases in new infections; these increases would compound when coupled with cutbacks in HIV treatment (Appendix Table S5). Cutbacks in treatment alone led to greater life expectancy losses than testing and primary prevention.
Scenario analyses
Resilient and susceptible programming scenarios
With greater resilience to PEPFAR cutbacks, fewer additional infections would be projected by 10 years than in the base case: 120,000 with PEPFAR_50% and 412,000 with PEPFAR_0% compared with PEPFAR_100% (Table 3). Projected life-years lost for PWH would also be lower: 0.92 and 2.88. With greater susceptibility to PEPFAR cutbacks, the projected impacts would be higher: 619,000 and 1,074,000 additional infections and 4.80 and 7.46 life-years lost for PWH. Population lifetime costs would increase in both scenarios.
Return to current status quo in 2029 scenario
In a scenario where the PEPFAR budget deficit is filled and HIV programming returns to its current status quo in 2029, the projected impacts of PEPFAR cutbacks would still be substantial. By 10 years, new infections would increase by 162,000 with PEPFAR_50% and 305,000 with PEPFAR_0% compared with PEPFAR_100% (Appendix Table S6). The costs of treating new infections would offset cost reductions associated with life-years lost, resulting in similar population-level lifetime costs ($2,540–2,550/person).
Larger PEPFAR funding profile scenario
In a scenario where PEPFAR funding in South Africa mirrors support in Zimbabwe (55% testing, 45% treatment, 77% prevention), new infections over 10 years would increase by 72% and 142% with PEPFAR_50% and PEPFAR_0% compared with PEPFAR_100%; PWH would lose 6.79 and 11.01 life-years (Appendix Table S7). While these life-year losses would lead to lower HIV treatment costs, lifetime costs for the population would decrease only modestly ($10–50/person) due to the cost of many more new infections.
Decremental cost-effectiveness ratios
Among people with prevalent HIV the projected DCER would be $220 saved per year-of-life lost for both PEPFAR_50% and PEPFAR_0% compared with PEPFAR_100% (Table S8). DCERs would be similar across scenario analyses ($220–240 saved per year-of-life lost) demonstrating that on a lifetime horizon, any potential cost savings would be a direct result of a loss in life-years.
DISCUSSION
With uncertain US Congressional support of PEPFAR, we developed a model-based analysis to determine the clinical and economic consequences of abrupt cutbacks in $460 million of PEPFAR HIV funding allocated to South Africa. We had three key findings.
First, abruptly scaling back PEPFAR would reverse progress towards the 95-95-95 goals and lead to substantial life expectancy losses. Life expectancy among PWH would decrease by 3.71 life-years–a major reduction compared to other health interventions, including universal ART eligibility (34-36). South Africa has faced prior programmatic disruptions, including in the early 2000s when political leadership delayed ART rollout due to misinformation about the cause of AIDS leading to an estimated 330,000 additional lives lost (37), and during the COVID-19 pandemic (38), which led to decreased HIV testing and ART initiations (25,39,40). Our analysis quantifies the impact of disruptions from scaling back PEPFAR, and adds to existing evidence demonstrating PEPFAR’s role in improving survival for PWH (35,41).
Second, withdrawing PEPFAR support would impact the health of the entire South African population, with a projected 565,000 additional HIV infections by 2034 and 1.20 life-years lost per person. Cutbacks in HIV care and treatment–which receive $217 million annually from PEPFAR–had the greatest impact on projected new infections. When combined with primary prevention cutbacks, new infections would compound due to a simultaneous greater force of infection and susceptibility to infection, as seen in other analyses,(5,29,39,42). These multiway sensitivity analyses demonstrate alternative budget re-balancing possibilities, reflecting the fungibility of current non-PEPFAR HIV funding. Future research is needed to inform optimal approaches to funding re-allocation. Curbing HIV incidence is critical for epidemic control, and PEPFAR continues to play a vital role in these efforts (6,43).
Third, cost reductions from defunded programs in 2024 would be offset by increased costs of treating a larger and sicker population with HIV. We projected that HIV-related costs would increase within one year relative to current spending with an excess of $1.70 billion by 2034. These additional costs would primarily be used to treat new opportunistic infections that would otherwise be averted by PEPFAR-funded programming, rather than treating new HIV infections. Furthermore, these extra costs would likely require diverting funds from other effective interventions without making progress toward HIV epidemic control. Our projections are consistent with a study that found that any reduction in HIV testing would increase care costs over time due to increased HIV infections (42). Population costs only decreased in conditions with substantial life expectancy losses. We projected $220 saved per year-of-life lost among PWH, which is substantially less than South Africa’s willingness to pay for health ($3,010–4,100/year-of-life) (13,34,44), and still below more affordable benchmarks for established HIV programs ($550/year-of-life) (45). These cost reductions would be marginal and directly related to shorter survival of PWH.
This study likely represents a best-case scenario for PEPFAR cutbacks compared to other settings. South Africa’s economic profile has changed since PEPFAR’s inception: from 2008–2022, the South African government increased total dollar HIV investments by approximately 15% year-after-year while maintaining funding for nearly three-quarters of all HIV expenditures (14). Investments from financial partners like PEPFAR have enabled overall healthcare system strengthening and decreased reliance on external funding (13,46). However, in-country and external HIV funding have recently flattened due to slowed GDP growth and the economic toll of the COVID-19 pandemic (47-49). A sudden $460 million deficit would therefore unlikely be readily replaced and would jeopardize access to highly successful HIV interventions, leading to substantial morbidity and mortality. PEPFAR contributes a greater share of HIV spending in other countries such as Zimbabwe (2023 per-capita GDP: $2,160 versus $6,020 in South Africa) (4,13), which would be even more vulnerable to abrupt PEPFAR cutbacks, with nearly 3-fold more HIV infections and life-years lost in a scenario analysis. Countries that rely more on PEPFAR support may be less equipped to withstand sudden HIV funding withdrawal. Geographic areas within South Africa and Uganda that transitioned away from PEPFAR funding have experienced decreased care engagement, more frequent commodity stockouts, and delays in implementing national treatment guidelines (50-52).
This analysis has several limitations. First, we do not model the impact of cutbacks on pregnant people and children, which would render our projections more pessimistic (53). Although we model population heterogeneity within South Africa, we do not explicitly model at-risk groups who may be disproportionately affected by PEPFAR cutbacks. Second, we assumed that PEPFAR funding cutbacks would be proportional to decreases in HIV programming, implying fixed care costs which may not reflect programmatic realities (e.g., additional costs for advanced HIV disease or to re-engage PWH). We examined alternative scenarios with non-linear returns on PEPFAR investments, which demonstrated substantial clinical and epidemiologic impacts even if current programming was resilient to cutbacks. While these scenarios are intended to illustrate the range of possible outcomes resulting from funding cutbacks, they do not quantify precision or the likelihood of occurring. Third, we assume that the programmatic effects of withdrawing PEPFAR funding would be permanent in the base case, which may overestimate our projections. However, refunding HIV infrastructure would take time and an immediate loss of services would have a lasting impact on PWH. Furthermore, we did not consider the impact of reduced US contributions to the Global Fund, which has consistently funded 2–5% of South Africa’s HIV budget (5). Even if cutbacks were limited to five years, new HIV infections could increase by 26%. Fourth, we assume a fixed HIV incidence, which may overestimate new infections that would be averted by future interventions. Although we do not account for the gradually decreasing incidence of new infections in South Africa, these trends would likely be negated by PEPFAR cutbacks. Furthermore, we only model the impact of PEPFAR cutbacks on primary transmissions, which may underestimate dynamic growth of new infections (i.e., second-order transmission, vertical transmission). Finally, we do not capture PEPFAR’s indirect impacts such as facilitating decreased healthcare costs, increasing employment, and supporting GDP growth (54,55).
In conclusion, this simulation modeling analysis demonstrates that abruptly scaling back PEPFAR funding would have a striking and deleterious impact on the progress South Africa has made towards HIV epidemic control. Any total cost reductions would be short-lived and at the expense of as many as an additional 565,000 new HIV infections and 601,000 HIV-related deaths in South Africa by 2034. These implications highlight the importance of PEPFAR as both a life-saving foreign aid program and a bridge to self-sustaining national HIV programs.
Supplementary Material
ACKNOWLEDGEMENTS
The authors would like to thank Madhava Narasimhadevara for his assistance in preparing the manuscript for publication and Stephen Resch, PhD for his feedback on aspects of the costing approach.
Source of funding:
This work was supported by the National Institute of Allergy and Infectious Diseases [R37 AI058736 to KAF], Eunice Kennedy Shriver National Institute of Child Health and Human Development [R01 HD111355 to AMN], MGH Department of Medicine Transformative Scholars Award [to AMN], MGH Executive Committee on Research Claflin Distinguished Scholars Award [to AMN], James and Audrey Foster MGH Research Scholar Award [to ALC], and the MGH Jerome and Celia Reich Endowed Scholar in HIV/AIDS Award [to EPH]. The contents are solely the responsibility of the authors and do not necessarily represent the official views of the funders.
Footnotes
Ethics: This study was approved by the Mass General Brigham Human Research Committee. No patient-level data were used in this analysis.
Conflicts of Interest: The authors declare no conflicts of interest.
REFERENCES
- 1.Joint United Nations Programme on HIV/AIDS. UNAIDS data 2023 [Internet]. 2023. [cited 2024 Jun 5]. Available from: https://www.unaids.org/en/resources/documents/2023/2023_unaids_data
- 2.Phaswana-Mafuya RN, Phalane E, Sisel H, Motsieloa L, Journeay K, Dubula V, et al. Country ownership and sustainable programming of the HIV response in South Africa: A scoping review. South Afr J HIV Med. 2023;24(1):1511. [DOI] [PMC free article] [PubMed] [Google Scholar]
- 3.US Embassy & Consulates in South Africa. United States President’s Emergency Plan for AIDS Relief (PEPFAR) [Internet]. 2022. [cited 2024 Jun 5]. Available from: https://za.usembassy.gov/united-states-presidents-emergency-plan-for-aids-relief-pepfar/#:~:text=To%20date%2C%20the%20United%20States,AIDS%2C%20Tuberculosis%2C%20and%20Malaria.
- 4.US Department of State. Country and regional operational plans: the United States President’s Emergency Plan for AIDS Relief [Internet]. 2024. [cited 2024 Jun 5]. Available from: https://www.state.gov/country-operational-plans/
- 5.US Department of State. Country Operational Plan: PEPFAR South Africa 2022 Strategic Direction Summary [Internet]. 2023. [cited 2024 Jun 5]. Available from: https://www.state.gov/wp-content/uploads/2022/09/South-Africa-COP22_SDS.pdf
- 6.Chun HM, Dirlikov E, Cox MH, Sherlock MW, Obeng-Aduasare Y, Sato K, et al. Vital signs: progress toward eliminating HIV as a global public health threat through scale-up of antiretroviral therapy and health system strengthening supported by the U.S. President’s Emergency Plan for AIDS Relief - worldwide, 2004-2022. MMWR Morb Mortal Wkly Rep. 2023. Mar 24;72(12):317–24. [DOI] [PMC free article] [PubMed] [Google Scholar]
- 7.Patel-Larson A, Ledikwe JH, West T, Cheever L, Hauck H, Andrews G, et al. Looking back to see forward: multidirectional learning between the US Ryan White HIV/AIDS Program and the US President’s Emergency Plan for AIDS Relief. BMJ Glob Health. 2024. Feb 23;8(Suppl 7):e013953. [DOI] [PMC free article] [PubMed] [Google Scholar]
- 8.Nkengasong J, Zaidi I, Katz IT. PEPFAR at 20—looking back and looking ahead. JAMA. 2023. Jul 18;330(3):219. [DOI] [PubMed] [Google Scholar]
- 9.Rep. Diaz-Balart M [R F 26. H.R.4665 - 118th Congress (2023-2024): Department of State, Foreign Operations, and Related Programs Appropriations Act, 2024 [Internet]. 2023. [cited 2024 Dec 20]. Available from: https://www.congress.gov/bill/118th-congress/house-bill/4665/all-actions
- 10.Lewis S, Zengerle P, Zengerle P. US State Dept slams Congress for failure to renew anti-AIDS program. Reuters [Internet]. 2023. Oct 3 [cited 2024 Dec 20]; Available from: https://www.reuters.com/business/healthcare-pharmaceuticals/us-state-dept-slams-congress-failure-renew-pepfar-anti-aids-program-2023-10-02/ [Google Scholar]
- 11.Bakst D, Berry J, Burke LM, et al. Mandate for leadership: the conservative promise [Internet]. The Heritage Foundation; [cited 2024 Nov 27]. Available from: https://static.project2025.org/2025_MandateForLeadership_FULL.pdf [Google Scholar]
- 12.Moss K, Kates J. KFF. 2024. [cited 2024 Jun 5]. PEPFAR’s short-term reauthorization sets an uncertain course for its long-term future. Available from: https://www.kff.org/policy-watch/pepfars-short-term-reauthorization-sets-an-uncertain-course-for-its-long-term-future/
- 13.The World Bank. World Bank Open Data [Internet]. 2024. [cited 2024 Dec 20]. Available from: https://data.worldbank.org/indicator/NY.GDP.PCAP.CD?locations=ZA
- 14.South Africa National AIDS Council, Joint United Nations Programme on HIV/AIDS. National AIDS spending assessment plus (NASA+) HIV and TB spending in South Africa [Internet]. 2022. [cited 2024 Jun 5]. Available from: https://sanac.org.za/wp-content/uploads/2022/10/SA-NASA-REPORT_2017-18-to-2019-20.pdf
- 15.Sanders GD, Neumann PJ, Basu A, Brock DW, Feeny D, Krahn M, et al. Recommendations for conduct, methodological practices, and reporting of cost-effectiveness analyses: second panel on cost-effectiveness in health and medicine. JAMA. 2016. Sep 13;316(10):1093–103. [DOI] [PubMed] [Google Scholar]
- 16.Kent DM, Fendrick AM, Langa KM. New and dis-improved: on the evaluation and use of less effective, less expensive medical interventions. Med Decis Mak Int J Soc Med Decis Mak. 2004;24(3):281–6. [DOI] [PubMed] [Google Scholar]
- 17.Rotteveel AH, Lambooij MS, Zuithoff NPA, van Exel J, Moons KGM, de Wit GA. Valuing healthcare goods and services: a systematic review and meta-analysis on the WTA-WTP disparity. PharmacoEconomics. 2020. May;38(5):443–58. [DOI] [PubMed] [Google Scholar]
- 18.Walensky RP, Jacobsen MM, Bekker LG, Parker RA, Wood R, Resch SC, et al. Potential clinical and economic value of long-acting preexposure prophylaxis for South African women at high-risk for HIV infection. J Infect Dis. 2016. May 15;213(10):1523–31. [DOI] [PMC free article] [PubMed] [Google Scholar]
- 19.April MD, Wood R, Berkowitz BK, Paltiel AD, Anglaret X, Losina E, et al. The survival benefits of antiretroviral therapy in South Africa. J Infect Dis. 2014. Feb 15;209(4):491–9. [DOI] [PMC free article] [PubMed] [Google Scholar]
- 20.Dorward J, Sookrajh Y, Khubone T, Van Der Molen J, Govender R, Phakathi S, et al. Implementation and outcomes of dolutegravir-based first-line antiretroviral therapy for people with HIV in South Africa: a retrospective cohort study. Lancet HIV. 2023. May;10(5):e284–94. [DOI] [PMC free article] [PubMed] [Google Scholar]
- 21.Bosman A, Beke A. Outcomes of community-based HIV testing modalities in a Mpumalanga district, South Africa. South Afr Med J Suid-Afr Tydskr Vir Geneeskd. 2020. Sep 30;110(10):1041–4. [DOI] [PubMed] [Google Scholar]
- 22.US PEPFAR. President’s Emergency Plan for AIDS Relief (PEPFAR) data [Internet]. 2024. [cited 2024 Jun 5]. Available from: https://data.pepfar.gov/library
- 23.Republic of South Africa National Department of Health. 2023 ART clinical guidelines for the management of HIV in adults, pregnancy and breastfeeding, adolescents, children, infants and neonates [Internet]. 2023. [cited 2024 Jun 5]. Available from: https://knowledgehub.health.gov.za/elibrary/2023-art-clinical-guidelines-management-hiv-adults-pregnancy-and-breastfeeding-adolescents
- 24.Haas AD, Zaniewski E, Anderegg N, Ford N, Fox MP, Vinikoor M, et al. Retention and mortality on antiretroviral therapy in sub-Saharan Africa: collaborative analyses of HIV treatment programmes. J Int AIDS Soc. 2018. Feb;21(2). [DOI] [PMC free article] [PubMed] [Google Scholar]
- 25.Benade M, Long L, Rosen S, Meyer-Rath G, Tucker JM, Miot J. Reduction in initiations of HIV treatment in South Africa during the COVID pandemic. BMC Health Serv Res. 2022. Dec;22(1):428. [DOI] [PMC free article] [PubMed] [Google Scholar]
- 26.Barnabas RV, Szpiro AA, van Rooyen H, Asiimwe S, Pillay D, Ware NC, et al. Community-based antiretroviral therapy versus standard clinic-based services for HIV in South Africa and Uganda (DO ART): a randomised trial. Lancet Glob Health. 2020. Oct;8(10):e1305–15. [DOI] [PMC free article] [PubMed] [Google Scholar]
- 27.Long LC, Girdwood S, Govender K, Meyer-Rath G, Miot J. Cost and outcomes of routine HIV care and treatment: public and private service delivery models covering low-income earners in South Africa. BMC Health Serv Res. 2023. Mar 11;23(1):240. [DOI] [PMC free article] [PubMed] [Google Scholar]
- 28.Attia S, Egger M, Müller M, Zwahlen M, Low N. Sexual transmission of HIV according to viral load and antiretroviral therapy: systematic review and meta-analysis. AIDS Lond Engl. 2009. Jul 17;23(11):1397–404. [DOI] [PubMed] [Google Scholar]
- 29.Johnson LF, Meyer-Rath G, Dorrington RE, Puren A, Seathlodi T, Zuma K, et al. The effect of HIV programs in South Africa on national HIV incidence trends, 2000-2019. J Acquir Immune Defic Syndr 1999. 2022. Jun 1;90(2):115–23. [DOI] [PubMed] [Google Scholar]
- 30.Cleary S, Okorafor O, Chitha W, Boulle A, Siyabonga J. South African Health Review [Internet]. Durban, South Africa; 2005. Aug [cited 2024 Jun 5]. Available from: https://www.hst.org.za/publications/South%20African%20Health%20Reviews/sahr05.pdf [Google Scholar]
- 31.Thomas LS. Costing of HIV/AIDS services at a tertiary level hospital in Gauteng Province [Internet]. University of Witwatersrand; 2007. [cited 2024 Jun 5]. Available from: http://wiredspace.wits.ac.za/handle/10539/2008 [Google Scholar]
- 32.Anglaret X, Chêne G, Attia A, Toure S, Lafont S, Combe P, et al. Early chemoprophylaxis with trimethoprim-sulphamethoxazole for HIV-1-infected adults in Abidjan, Côte d’Ivoire: a randomised trial. Lancet Lond Engl. 1999. May 1;353(9163):1463–8. [DOI] [PubMed] [Google Scholar]
- 33.US Department of State. Country Operational Plan: PEPFAR Zimbabwe 2022 Strategic Direction Summary [Internet]. 2022. [cited 2024 Jun 5]. Available from: https://www.state.gov/wp-content/uploads/2022/09/Zimbabwe-COP22-SDS.pdf
- 34.Edoka IP, Stacey NK. Estimating a cost-effectiveness threshold for health care decision-making in South Africa. Health Policy Plan. 2020. Jun 1;35(5):546–55. [DOI] [PMC free article] [PubMed] [Google Scholar]
- 35.Walensky RP, Borre ED, Bekker LG, Hyle EP, Gonsalves GS, Wood R, et al. Do less harm: evaluating HIV programmatic alternatives in response to cutbacks in foreign aid. Ann Intern Med. 2017. Nov 7;167(9):618–29. [DOI] [PMC free article] [PubMed] [Google Scholar]
- 36.Ouattara EN, MacLean RL, Danel C, Borre ED, Gabillard D, Huang M, et al. Cost-effectiveness and budget impact of immediate antiretroviral therapy initiation for treatment of HIV infection in Côte d’Ivoire: A model-based analysis. PloS One. 2019;14(6):e0219068. [DOI] [PMC free article] [PubMed] [Google Scholar]
- 37.Chigwedere P, Seage GR, Gruskin S, Lee TH, Essex M. Estimating the lost benefits of antiretroviral drug use in South Africa. JAIDS J Acquir Immune Defic Syndr. 2008. Dec 1;49(4):410–5. [DOI] [PubMed] [Google Scholar]
- 38.Tinogona Investments, South Africa National AIDS Council. COVID-19 report: the voices of community-led organisations and their networks [Internet]. 2021. [cited 2024 Jun 5]. Available from: https://sanac.org.za/wp-content/uploads/2021/06/COVID-19-Report-Final-April2021.pdf
- 39.Jewell BL, Mudimu E, Stover J, Ten Brink D, Phillips AN, Smith JA, et al. Potential effects of disruption to HIV programmes in sub-Saharan Africa caused by COVID-19: results from multiple mathematical models. Lancet HIV. 2020. Sep;7(9):e629–40. [DOI] [PMC free article] [PubMed] [Google Scholar]
- 40.Dorward J, Khubone T, Gate K, Ngobese H, Sookrajh Y, Mkhize S, et al. The impact of the COVID-19 lockdown on HIV care in 65 South African primary care clinics: an interrupted time series analysis. Lancet HIV. 2021. Mar;8(3):e158–65. [DOI] [PMC free article] [PubMed] [Google Scholar]
- 41.Gaumer G, Luan Y, Hariharan D, Crown W, Kates J, Jordan M, et al. Assessing the impact of the President’s Emergency Plan for AIDS Relief on all-cause mortality. PLOS Glob Public Health. 2024;4(1):e0002467. [DOI] [PMC free article] [PubMed] [Google Scholar]
- 42.Rautenbach SP, Whittles LK, Meyer-Rath G, Jamieson L, Chidarikire T, Johnson LF, et al. Future HIV epidemic trajectories in South Africa and projected long-term consequences of reductions in general population HIV testing: a mathematical modelling study. Lancet Public Health. 2024. Apr;9(4):e218–30. [DOI] [PMC free article] [PubMed] [Google Scholar]
- 43.Dirlikov E, Kamoga J, Talisuna SA, Namusobya J, Kasozi DE, Akao J, et al. Scale-up of HIV antiretroviral therapy and estimation of averted infections and HIV-related deaths - Uganda, 2004-2022. MMWR Morb Mortal Wkly Rep. 2023. Jan 27;72(4):90–4. [DOI] [PMC free article] [PubMed] [Google Scholar]
- 44.Pichon-Riviere A, Drummond M, Palacios A, Garcia-Marti S, Augustovski F. Determining the efficiency path to universal health coverage: cost-effectiveness thresholds for 174 countries based on growth in life expectancy and health expenditures. Lancet Glob Health. 2023. Jun;11(6):e833–42. [DOI] [PubMed] [Google Scholar]
- 45.Meyer-Rath G, van Rensburg C, Larson B, Jamieson L, Rosen S. Revealed willingness-to-pay versus standard cost-effectiveness thresholds: evidence from the South African HIV Investment Case. PloS One. 2017;12(10):e0186496. [DOI] [PMC free article] [PubMed] [Google Scholar]
- 46.Cohen RL, Li Y, Giese R, Mancuso JD. An evaluation of the President’s Emergency Plan for AIDS Relief effect on health systems strengthening in sub-Saharan Africa. J Acquir Immune Defic Syndr 1999. 2013. Apr 1;62(4):471–9. [DOI] [PubMed] [Google Scholar]
- 47.Jamieson L, Meyer-Rath G, Kubjane M, Johnson L. South African HIV investment case [Internet]. HE2RO; 2023. Dec [cited 2025 Jan 16]. Available from: https://www.heroza.org/wp-content/uploads/2024/01/HIV-Investment-Case-2023-Full-Report-v1.2.pdf [Google Scholar]
- 48.World Bank. South Africa [Internet]. [cited 2025 Jan 16]. Available from: https://documents1.worldbank.org/curated/en/099613104052410927/pdf/IDU1ffc84f731c8e91470018c4311f71d03092e1.pdf
- 49.Vote 18 health [Internet]. National Treasury, Republic of South Africa; 2024. [cited 2025 Jan 16]. Available from: https://www.treasury.gov.za/documents/National%20Budget/2024/ene/Vote%2018%20Health.pdf [Google Scholar]
- 50.Zakumumpa H, Paina L, Ssegujja E, Shroff ZC, Namakula J, Ssengooba F. The impact of shifts in PEPFAR funding policy on HIV services in Eastern Uganda (2015-21). Health Policy Plan. 2024. Jan 23;39(Supplement_1):i21–32. [DOI] [PMC free article] [PubMed] [Google Scholar]
- 51.Wilhelm JA, Qiu M, Paina L, Colantuoni E, Mukuru M, Ssengooba F, et al. The impact of PEPFAR transition on HIV service delivery at health facilities in Uganda. PloS One. 2019;14(10):e0223426. [DOI] [PMC free article] [PubMed] [Google Scholar]
- 52.Chiliza J, Laing R, Feeley FG, Brennan AT. Evaluation of the impact of PEPFAR transition on retention in care in South Africa’s Western Cape Province. South Afr Med J Suid-Afr Tydskr Vir Geneeskd. 2023. Dec 31;114(1):44–50. [DOI] [PMC free article] [PubMed] [Google Scholar]
- 53.Gaumer G, Crown WH, Kates J, Luan Y, Hariharan D, Jordan M, et al. Analysis of maternal and child health spillover effects in PEPFAR countries. BMJ Open. 2023. Dec 21;13(12):e070221. [DOI] [PMC free article] [PubMed] [Google Scholar]
- 54.Crown W, Hariharan D, Kates J, Gaumer G, Jordan M, Hurley C, et al. Analysis of economic and educational spillover effects in PEPFAR countries. PloS One. 2023;18(12):e0289909. [DOI] [PMC free article] [PubMed] [Google Scholar]
- 55.Menzies NA, Berruti AA, Berzon R, Filler S, Ferris R, Ellerbrock TV, et al. The cost of providing comprehensive HIV treatment in PEPFAR-supported programs. AIDS Lond Engl. 2011. Sep 10;25(14):1753–60. [DOI] [PMC free article] [PubMed] [Google Scholar]
- 56.Inghels M, Niangoran S, Minga A, Yoboue JM, Dohoun L, Yao A, et al. Missed opportunities for HIV testing among newly diagnosed HIV-infected adults in Abidjan, Côte d’Ivoire. PloS One. 2017;12(10):e0185117. [DOI] [PMC free article] [PubMed] [Google Scholar]
- 57.Iwuji CC, Orne-Gliemann J, Larmarange J, Balestre E, Thiebaut R, Tanser F, et al. Universal test and treat and the HIV epidemic in rural South Africa: a phase 4, open-label, community cluster randomised trial. Lancet HIV. 2018. Mar;5(3):e116–25. [DOI] [PubMed] [Google Scholar]
- 58.Gumede SB, Venter F, de Wit J, Wensing A, Lalla-Edward ST. Antiretroviral therapy uptake and predictors of virological failure in patients with HIV receiving first-line and second-line regimens in Johannesburg, South Africa: a retrospective cohort data analysis. BMJ Open. 2022. Apr 15;12(4):e054019. [DOI] [PMC free article] [PubMed] [Google Scholar]
- 59.Losina E, Yazdanpanah Y, Deuffic-Burban S, Wang B, Wolf LL, Messou E, et al. The independent effect of highly active antiretroviral therapy on severe opportunistic disease incidence and mortality in HIV-infected adults in Côte d’Ivoire. Antivir Ther. 2007;12(4):543–51. [PMC free article] [PubMed] [Google Scholar]
- 60.Holmes CB, Wood R, Badri M, Zilber S, Wang B, Maartens G, et al. CD4 decline and incidence of opportunistic infections in Cape Town, South Africa: implications for prophylaxis and treatment. J Acquir Immune Defic Syndr. 2006. Aug 1;42(4):464–9. [DOI] [PubMed] [Google Scholar]
- 61.Haas AD, Lienhard R, Didden C, Cornell M, Folb N, Boshomane TMG, et al. Mental health, ART adherence, and viral suppression among adolescents and adults living with HIV in South Africa: a cohort study. AIDS Behav. 2023. Jun;27(6):1849–61. [DOI] [PMC free article] [PubMed] [Google Scholar]
- 62.Haberer JE, Bwana BM, Orrell C, Asiimwe S, Amanyire G, Musinguzi N, et al. ART adherence and viral suppression are high among most non-pregnant individuals with early-stage, asymptomatic HIV infection: an observational study from Uganda and South Africa. J Int AIDS Soc. 2019. Feb;22(2):e25232. [DOI] [PMC free article] [PubMed] [Google Scholar]
- 63.Aboud M, Orkin C, Podzamczer D, Bogner JR, Baker D, Khuong-Josses MA, et al. Efficacy and safety of dolutegravir-rilpivirine for maintenance of virological suppression in adults with HIV-1: 100-week data from the randomised, open-label, phase 3 SWORD-1 and SWORD-2 studies. Lancet HIV. 2019. Sep;6(9):e576–87. [DOI] [PubMed] [Google Scholar]
- 64.SECOND-LINE Study Group, Boyd MA, Kumarasamy N, Moore CL, Nwizu C, Losso MH, et al. Ritonavir-boosted lopinavir plus nucleoside or nucleotide reverse transcriptase inhibitors versus ritonavir-boosted lopinavir plus raltegravir for treatment of HIV-1 infection in adults with virological failure of a standard first-line ART regimen (SECOND-LINE): a randomised, open-label, non-inferiority study. Lancet Lond Engl. 2013. Jun 15;381(9883):2091–9. [DOI] [PubMed] [Google Scholar]
- 65.La Rosa AM, Harrison LJ, Taiwo B, Wallis CL, Zheng L, Kim P, et al. Raltegravir in second-line antiretroviral therapy in resource-limited settings (SELECT): a randomised, phase 3, non-inferiority study. Lancet HIV. 2016. Jun;3(6):e247–258. [DOI] [PMC free article] [PubMed] [Google Scholar]
- 66.Paton NI, Kityo C, Hoppe A, Reid A, Kambugu A, Lugemwa A, et al. Assessment of second-line antiretroviral regimens for HIV therapy in Africa. N Engl J Med. 2014. Jul 17;371(3):234–47. [DOI] [PubMed] [Google Scholar]
- 67.Meyer-Rath G, van Rensburg C, Chiu C, Leuner R, Jamieson L, Cohen S. The per-patient costs of HIV services in South Africa: systematic review and application in the South African HIV investment case. PloS One. 2019;14(2):e0210497. [DOI] [PMC free article] [PubMed] [Google Scholar]
- 68.Clinton Health Access Initiative. HIV market report, Issue 14 [Internet]. 2023. [cited 2024 Jun 5]. Available from: https://chai19.wpenginepowered.com/wp-content/uploads/2023/11/2023-HIV-Market-Report_11.17.23.pdf [Google Scholar]
Associated Data
This section collects any data citations, data availability statements, or supplementary materials included in this article.