

Abstract
Quantitative systems pharmacology (QSP) models of cancer immunity provide mechanistic insights into cellular dynamics and drug effects that are difficult to study clinically. However, their inability to predict patient survival mechanistically limits their utility in anti-cancer drug development. To overcome this, we link virtual patients from a QSP model to real clinical trial patients. Using data from atezolizumab trials in non-small cell lung cancer, we show that tumor-based linkage effectively captures survival outcomes. By treating linked survival and censoring as weak supervision labels, we trained survival models using only QSP model covariates, without clinical covariates. Our approach also predicts survival for treatments not included in training data. Specifically, we accurately estimated survival hazard ratios (HR) for chemotherapy monotherapy and atezolizumab plus chemotherapy combination. The predicted HR of 0.70 (95% prediction interval [PI] 0.55–0.86) closely matches the observed HR of 0.79 (95% PI 0.64–0.98) from the IMpower130 trial.
Subject terms: Cancer models, Non-small-cell lung cancer, Systems biology, Randomized controlled trials
Introduction
Quantitative Systems Pharmacology (QSP) is a modeling paradigm where biological interactions are captured mechanistically by systems of differential equations1,2. It has emerged as a dominant paradigm in recent years in investigating disease mechanisms and drug effects in silico, allowing observation of dynamical properties that may be difficult to investigate clinically. Calibrated using clinical data, QSP models can then be used to generate biologically plausible ‘virtual populations’. Because of their mechanistic structure, QSP models allow the integration of a variety of data sources and have shown promise in investigating drug combination effects3–5. Observation of tumor outcomes or progression using a QSP model is limited to biological outputs represented in the model. For that reason, purely mechanistic models may not readily generate an output of survival, as survival is unlikely to be captured in mechanistic terms. This is of importance in cancer immunotherapy where endpoints like objective response rates and progression-free survival, as assessed by RECIST 1.16, may sometimes be discordant with overall survival (OS)7,8.
To address this limitation, we aimed to generate a prediction of survival from a QSP model of cancer immunotherapy (CIT) by establishing a link between real patients’ survival outcomes and variables from the QSP model. The goal was to train and validate a survival model using a limited set of clinical trial data. Our approach involves imputing values of OS and censoring in the virtual population following the linkage of a cohort of virtual patients to real patients from clinical trials. These labels can then be used to train survival models using only the QSP variables, with the aim of establishing a predictive relationship between these QSP variables and the survival outcome. This is an instance of weakly supervised learning, a branch of machine learning whereby a heuristic process is used to obtain noisy labels for unlabeled data, and these labels are used to train a supervised model9–11. While this noise may render individual labels inaccurate, it has been shown that models are often able to generalize well, even from very noisy data12.
Several studies have described the creation of virtual patients that either mimic the clinical characteristics of real patients or that are based on actual clinical data. For example, Zhang, et al.13 leveraged RNA-seq data to develop virtual patient parametrizations, and Wang, et al.14 utilized a public portal of immunogenomic data to guide virtual population generation. To the best of our knowledge, only one study has endeavored matching real patients with pre-generated virtual patients to predict clinical outcomes15. Similar to our approach, Venkatapurapu et al.15 match virtual patients using predefined metrics. However, while we use imputed OS values to train a survival model, they use matched virtual patients as digital twins to simulate treatment responses. Our approach is unique in that it specifically involves imputing overall survival endpoints in the matched virtual population, thereby providing a training set to effectively simulate a virtual clinical trial under new conditions all the way to predicting OS in individual (virtual) patients, along with generating a hazard ratio for the treatment effect.
We demonstrate that our survival model can be extended to untested treatments, as evidenced by a validated example of a treatment not included in the training data. In addition, we anticipate that the survival model will be applicable to new doses, dosing regimen, or any other conditions that are incorporated and validated in the QSP model.
Methods
Clinical and synthetic data
Data from 5 clinical trials for atezolizumab in non-small cell lung cancer (NSCLC) were used in linking survival labels to virtual patients: BIRCH16, FIR17, OAK18, POPLAR19, and IMpower11020, with total N = 1641. Details for these trials are shown in Table 1. In each of these trials, tumor size was measured by the sum of longest diameters of target lesions (SLD), as per RECIST 1.16. In order for their tumor dynamics to be characterized longitudinally, only those patients with at least one baseline and one post-baseline tumor measurement were retained. Following this selection, the median number of tumor measurements per patient was 5, ranging from 2 to 19.
Table 1.
Details of the atezolizumab clinical trials used for OS imputation
| Trial Name | N | ClinicalTrials.gov Identifier | Other Identifier | Indication | Recruitment Status | Phase | Line |
|---|---|---|---|---|---|---|---|
| BIRCH | 580 | NCT02031458 | GO28754 | NSCLC | Completed | II | 1 L+ |
| FIR | 119 | NCT01846416 | GO28625 | NSCLC | Completed | II | 1 L+ |
| OAK | 555 | NCT02008227 | GO28915 | NSCLC | Completed | III | 2 L+ |
| POPLAR | 129 | NCT01903993 | GO28753 | NSCLC | Completed | II | 2 L+ |
| IMpower110 | 258 | NCT02409342 | GO29431 | NSCLC | Active, not recruiting | III | 1 L |
| Total | 1641 |
Virtual patients were simulated using a QSP model of cancer immunotherapy in NSCLC, which captures the effects of anti-PD-L1 (atezolizumab), as well as chemotherapy (carboplatin plus nab-paclitaxel)21.
Following calibration to clinical data, a cohort of N = 8347 virtual patients (VPs) was selected. Each of these VPs is characterized by a set of treatment-independent attributes (model parameters), along with a set of time-dependent dynamical signals that correspond to treatment responses. Detailed information on the QSP model structure, the calibration process to clinical data, and the characterization of the virtual population is provided in the Sections 1.3 and 2 of the Related Information document. For this study, 3 treatment groups were simulated in VPs: atezolizumab, chemotherapy, and the atezolizumab + chemotherapy combination. The atezolizumab group was used for training and testing of the survival model, and the chemotherapy and combination therapy groups were used for prediction and validation.
Within this simulated training data, all dynamical signals, including tumor size, were considered over three distinct periods: a pre-treatment period of 40 weeks, a 27-week treatment period, followed by a post-treatment period of variable length. For feature extraction from QSP dynamical signals (see Section “Feature extraction”), both the treatment period and the full signal were used. The list of QSP model variables that were used for dynamical feature extraction, along with a description of their biological significance, can be found in Table 2. A complete list of model variables and detailed descriptions of their roles within the QSP model are provided in the Related Information document (Section 1.3.2).
Table 2.
Brief description of the dynamical variables in the QSP model
| Variable | Description |
|---|---|
| T | Tumor volume |
| Ag | Tumor antigens in the tumor space |
| R | Tregs in the peripheral blood |
| H | T helper 1 cells in the peripheral blood |
| C | Cytotoxic T cells in the peripheral blood |
| RT | Tregs in the tumor space |
| HT | T helper 1 cells in the tumor space |
| CT | Cytotoxic T cells in the tumor space |
| Cyde | Total cytotoxic death |
A comprehensive list and detailed descriptions of the QSP model variables are provided in the Related Information document (Section 1.3.2).
When linking tumor curves between real patients (RPs) and VPs (see Section “Linkage methods”), only the 27-week treatment period is considered, so as to limit matching to periods where both RP’s and VPs are under treatment. In order to compare tumor curves between RPs and VPs, VP SLD curves were scaled relative to the SLD value at the start of the treatment period. Details of the calculation of SLD curves from the QSP model outputs are described in the Related Information document (Section 1.3.3). Similarly, longitudinal SLD data in RPs were upsampled by linear interpolation to the same frequency as the virtual data, and then scaled relative to their interpolated baseline value at t = 0.
IMpower130 was a phase III clinical trial for first-line patients with NSCLC (NCT02367781, 2019), with N = 724 patients initially randomized 2:1 to the atezolizumab + chemotherapy combination and chemotherapy monotherapy arms, respectively. The stratified hazard ratio for the overall survival endpoint reported in this trial was used for model validation purposes. Additionally, an unstratified version was calculated but did not differ from the reported stratified HR.
For the validation data, the chemotherapy (carboplatin + nab-paclitaxel) and atezolizumab + chemotherapy arms were used to compare survival and predict a hazard ratio. After the survival model was trained (details in Section “Statistical model”) using survival endpoints from the atezolizumab monotherapy arms of the clinical trials presented above in Section “Clinical and synthetic data”, data from the IMpower130 trial was used to validate the estimated overall survival hazard ratio, as well as the distribution of OS between both arms predicted by our modeling. The predicted HR was then compared against the observed overall survival hazard ratio for the atezolizumab + chemotherapy combination therapy vs chemotherapy monotherapy22. Atezolizumab therapy was applied for 144 weeks, and chemotherapy was applied for either 4 or 6 cycles of three weeks each, in a 50/50 proportion. This simulated treatment regimen allowed the model validation analysis to 1. mirror the clinical trial conditions in IMpower130 and 2. demonstrate model robustness to out-of-sample data generation and variations in off-treatment durations.
Linkage methods
Fig. 1 provides a schematic diagram detailing the whole methodology end-to-end, from patient matching, to model training, to validation.
Fig. 1. Schematic diagram showing full end-to-end patient matching, training, and prediction pipeline.

A Virtual patients are generated using a QSP model of cancer immunity in NSCLC (details of the QSP model and virtual patient (VP) generation process are provided in the Sections 1.3 and 2 of the Related Information document). B Real patients are matched to virtual patients on the basis of MSE minimization, and example matches shown below. C Supplementary Algorithm 1 is applied and OS for each resampled VP is derived, providing training set for survival model, (D) out-of-sample prediction on new treatment groups is done in order to predict hazard ratios for combination therapies. QSP quantitative systems pharmacology, NSCLC non-small cell lung cancer, MSE mean squared error, OS overall survival.
To impute weak supervision labels of OS and censoring in the virtual population, it was necessary to identify shared variables for linking real patients (RPs) and virtual patients (VPs) based on similarity between the two patient types. An initial challenge was to decide which variables could be used for linkage, given that there were only a few common variables between real and virtual patients. Tumor size curves were investigated as a means of linkage. Previous work has demonstrated the predictive relationship that exists between tumor growth inhibition (TGI) metrics and overall survival (OS) in the context of clinical trial data23–29. Other work has used correlation-based metrics to characterize similarity between tumor size curves, with an aim to characterize heterogeneity in tumor dynamics between individual target lesions, as well as linking this heterogeneity downstream to overall survival30,31. We chose tumor size curves as the shared variable to use for linkage, due to compatibility between real and virtual data, and that tumor size metrics have been shown to be predictive of survival across multiple tumor and treatment types25.
The desired outcome of such a method was that the distribution of imputed OS in the virtual cohort would closely match that of the clinical cohort. The full algorithm for matching RPs with VPs is described in Supplementary Algorithm 1. For each RP, similarity with every VP was characterized by evaluation of mean-squared error (MSE) between tumor curves within the 27-week treatment period, and matches were ranked by smallest MSE values. If an RPs tumor curve was shorter than 27 weeks, the computation of MSE was limited to the duration of the shorter tumor curve.
Having obtained a ranked list of matches for each RP, a cutoff n was selected such that all VPs were represented at least once (illustrated in Fig. 2). Each VP then inherited OS and censoring labels directly from the matched RP. Popular VPs ended up being matched more than once and were over-represented in the resultant sampling distribution, though in each instance with a different label set. This allowed for an over-representation of VPs that were more similar to real patients, while allowing for a high diversity among the VPs represented. This matching process effectively serves as a digital twin generator32, where each virtual patient matched to a real patient acts as a digital twin of that specific real counterpart. By creating these digital twins, we ensure that the virtual population accurately reflects the diversity and characteristics of the actual patient population. The final dataset used to train the model was then sampled from this “sampling” population. In our case, we found n to be 176, leading to a sampling population of VPs of 288,816 = 176 × 1641. Supplementary Fig. 1 shows the distribution of copy numbers of each VP in the sampling population, with most VPs being represented 20–30 times on average, very few VPs represented only once (as explained above), and maximal representation being about 250 copies.
Fig. 2. Schematic diagram illustrating the matching algorithm between real patients (RPs) and virtual patients (VPs).

Schematic diagram illustrating the matching algorithm between real patients (RPs) and virtual patients (VPs). For each RP, all VPs are ranked based on mean squared error (MSE) minimization of their tumor size curves. For example, in this illustration, VP #6872 is the VP with closest tumor curve to RP #1, VP #4105 is the VP with 2nd closest tumor curve to RP #1, etc. A cutoff value n is selected (here, n = 176) to define the sampling distribution, ensuring that every VP is included in the sampling distribution at least once (indicated by the blue shaded area). This process results in a sampling population where VPs that more closely resemble RPs are over-represented, enhancing the relevance and diversity of the virtual cohort used for model training.
Feature extraction
In order to characterize differences between treatment groups, it was necessary to extract features from the dynamical time series in the QSP model. While each VP is also described by a set of baseline attributes (the model parameter values), these do not vary between treatment groups and so could not account for treatment effects. For each of the 9 signals described in Table 2, 20 features were extracted, leading to a total of 180 features. These included simple summary statistics (mean, median, standard deviation, 25th and 75th percentiles), as well as the minimum, maximum, start, end, and absolute differences, characterized both over the whole signal and restricted to the treatment period. In addition, the first-order rate of change between the minimum and maximum of the signal was characterized over the whole signal and treatment period, as well as the periods corresponding to the three most significant frequencies from a Fourier transform of the data over the whole signal. For treatment-period features, a window of 27 weeks was used in feature extraction. All 180 of these dynamical features from the QSP model were used as covariates in the survival model described below.
Statistical model
From the sampling distribution of VPs with matched OS and censoring, a dataset of 10,000 representative VPs in the atezolizumab treatment group was sampled and were then split into 90% training and 10% testing sets, with all features being standardized relative to the training set. Data were explored using Cox proportional hazard models, before training a fully parametric log-normal accelerated failure time model, using the Python packages lifelines and scikit-learn33,34. For the parametric model, the log-normal distribution used to represent survival was selected among other candidate probability density functions by comparison of the Akaike information criterion (AIC)35.
In each case, the training set was used to tune the regularization hyperparameter corresponding to the L2 penalty via 5-fold cross-validation, selecting the value that maximized validation c-index36. Following hyperparameter tuning, models were trained on all of the training data and used to predict on the atezolizumab test data, with imputed OS labels for comparison. The same model was then used to predict on treatment groups in the virtual cohort, providing estimates of survival curves for chemotherapy and atezolizumab + chemotherapy, as well as the associated hazard ratio.
For the log-normal model, we applied a similar methodology as in Claret et al.24, where prediction intervals for hazard ratios were obtained by sampling model parameters 1000 times from the mean and standard error of parameter estimates. For each replicate, the parametric model predicts patient-level survival curves as a function of time, from which median survival time for each VP could be defined. Additionally, a mean survival probability curve for the entire cohort was captured, and was used to plot survival curves in Fig. 3. The OS predictions were used to fit univariable Cox proportional hazards models to provide estimates of hazard ratio, which were then summarized by the median and 95% prediction intervals across the 1000 replicates. Within each replicate, patients with undefined median survival were dropped, and censoring labels were sampled from a Bernoulli-distributed random variable (p = 0.43) to approximate the censoring frequency observed in the clinical trial data.
Fig. 3. Survival curve predictions using the log-normal model.

The figure shows survival curves predicted by the log-normal model. A Displays the model's predictions on the atezolizumab test data, with a Kaplan–Meier curve of imputed overall survival (OS) on the test data shown for comparison. The shaded region indicates the 95% confidence interval for the model prediction. B Shows the model's predictions on the virtual patients for both treatment groups: chemotherapy alone and atezolizumab plus chemotherapy. The shaded regions represent the 95% prediction intervals for each treatment group.
Results
Cox model
For each of the features derived from the dynamical time series (see Section “Feature extraction” above), a univariable Cox model was fit, providing estimates of hazard ratio as well as p-values from a χ 2 test for each parameter estimate. Table 3 shows 20 features from this analysis, ranked based on p-value, together with their corresponding hazard ratios. Notably, all of these pertain to the same three time-series from the QSP model, T, the tumor size, Cyde, total cytotoxic death, and Ag, tumor antigens in the tumor space. The highest ranked feature was the rate of change between minimum and maximum of the tumor curve within the treatment period, with a hazard ratio of 1.49 predicting greater hazard for tumors with higher growth rates. Fig. 4 shows the number of significant features from a univariable model for each of the 9 dynamical signals, and also indicates that features directly related to the tumor (Tumor volume, Tumor cell killing, and Tumor antigens) are generally more predictive than those describing immune cell populations. Significance was assessed at the 5% level without adjustment for multiple comparisons. Even though tumor compartment features demonstrate stronger associations with survival, Fig. 4 shows that immune cell signals (from Tregs, CTLs, and Th1 cells) all display multiple significant associations with survival in a univariate setting, indicating their complementary role to tumor-derived features in the resultant multivariable model. Importantly, we find that features like those derived from immune cell populations are also predictive of survival, despite not being directly tied to the representation of tumor dynamics in the QSP model. As many of these features were highly correlated, all of them were retained with an L2 penalty performing regularization in lieu of manual feature selection.
Table 3.
Top 20 significant features from the QSP model as measured by univariable Cox proportional hazards model, ranked by p-value, along with their corresponding hazard ratios
| Signal | Feature | Treatment Period | p-value | HR | 95% CI |
|---|---|---|---|---|---|
| Tumor volume | MinMax rate | TRUE | 1.10E-205 | 1.49 | [1.45, 1.53] |
| Tumor volume | Difference | TRUE | 5.46E-205 | 1.49 | [1.45, 1.52] |
| Tumor cell killing | Difference | TRUE | 2.36E-133 | 0.54 | [0.52, 0.57] |
| Tumor antigens | Difference | TRUE | 1.62E-116 | 0.48 | [0.45, 0.51] |
| Tumor volume | MinMax rate | FALSE | 2.72E-116 | 1.34 | [1.31, 1.38] |
| Tumor cell killing | End | TRUE | 3.20E-109 | 0.61 | [0.58, 0.63] |
| Tumor cell killing | Max | TRUE | 1.09E-108 | 0.62 | [0.59, 0.65] |
| Tumor cell killing | Standard deviation | TRUE | 1.51E-104 | 0.59 | [0.56, 0.62] |
| Tumor cell killing | Baseline | FALSE | 2.10E-93 | 1.27 | [1.25, 1.3] |
| Tumor volume | Difference | FALSE | 4.15E-92 | 1.24 | [1.21, 1.26] |
| Tumor antigens | Difference | FALSE | 1.78E-89 | 0.79 | [0.77, 0.8] |
| Tumor cell killing | Difference | FALSE | 5.47E-83 | 0.74 | [0.71, 0.76] |
| Tumor antigens | End | TRUE | 5.28E-70 | 0.64 | [0.61, 0.67] |
| Tumor cell killing | 75th percentile | FALSE | 1.91E-64 | 0.69 | [0.66, 0.72] |
| Tumor antigens | Max | TRUE | 1.01E-62 | 0.67 | [0.64, 0.7] |
| Tumor cell killing | Max | FALSE | 8.35E-60 | 0.68 | [0.65, 0.71] |
| Tumor antigens | Standard deviation | FALSE | 1.71E-59 | 0.66 | [0.63, 0.69] |
| Tumor cell killing | MinMax rate | TRUE | 9.00E-54 | 1.16 | [1.14, 1.18] |
| Tumor antigens | 75th percentile | FALSE | 1.23E-49 | 0.71 | [0.68, 0.74] |
| Tumor antigens | Baseline | FALSE | 1.34E-49 | 1.2 | [1.17, 1.23] |
Fig. 4. A comparison of the number of significant features from the QSP variables time-series as measured by univariable Cox proportional hazards models.
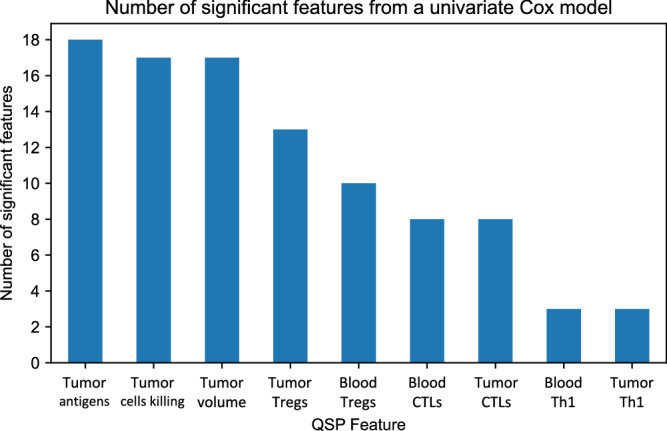
Tregs T regulatory cells, CTLs Cytotoxic T lymphocytes, Th1 T helper type 1 cells, QSP Quantitative systems pharmacology.
Parametric model
Fig. 3A shows model predictions for the final log-normal model on the atezolizumab test data, with a Kaplan-Meier of imputed OS on the test data shown for comparison. Empirically, good agreement is observed between the survival probability curve estimated by the model and that from the Kaplan-Meier model, with some divergence at later times due to censoring of survival in the test data, and small sample sizes at larger survival times inherent in clinical trial data.
Figure. 3B displays the model’s predictions on the VPs across both treatment groups. The simulated Kaplan-Meier curves indicate a qualitative treatment effect, implying a benefit for the combination therapy over chemotherapy monotherapy. The median hazard ratio as well as 95% prediction intervals, were derived from 1000 iterates of model parameters. Notably, this model, trained only on atezolizumab data, predicts a treatment effect for combination therapy over chemotherapy with a HR of 0.70 (95% PI 0.55–0.86). This can be directly compared, and is consistent with the observed marginal hazard ratio computed from the IMpower130 data of 0.79 (95% PI 0.64–0.98)22. A posterior predictive check directly comparing the distribution of HR predictions to observed HR is shown in Fig. 5.
Fig. 5. A posterior predictive check for model HR predictions compared to observed HR in the IMpower130 trial22.

The count on the vertical axis represents the total number of simulated replicates (out of 1000) that resulted in the corresponding range of hazard ratios.
Discussion
This work has demonstrated that by matching clinical patients to virtual patients simulated from a QSP model, it is possible to impute weak supervision labels for survival and censoring in virtual patients. Furthermore, we have demonstrated that using QSP covariates alone, these labels can be used to train survival models that can generalize to different treatment groups, producing estimates of treatment effect consistent with those observed in clinical trials. The fact that we can make a prediction of survival based on QSP covariates alone is a remarkable property of our approach, allowing us to train the model only once and apply it to different clinical settings (that can be represented in the QSP model).
The model predictions for the OS HR demonstrate good alignment with the observed HR in IMpower130. However, it is important to note that the observed HR was derived from an intention to treat (ITT) population. In contrast, our analysis consisted of virtual patients who required at least one post-baseline tumor size measurement to be eligible for matching, which could result in shorter survival times being truncated. Fortunately, patients with only one baseline tumor measurement usually represent only a very small subset of the clinical trial population. While acknowledging the limited presence of patients with a single tumor measurement, we may consider addressing their inclusion in future work to enhance the precision of our findings. Additionally, incorporating stratification of hazard ratio predictions based on other model covariates could help mitigate violations of the proportional hazard assumption and the influence of any other potential sources of bias. Beyond comparison of HRs, subgroup analyses would further enhance an understanding of where the model and trial data align and differ, comparing HRs and survival post-stratification to different risk groups.
We also investigated using this method to impute clinical covariates in the virtual population, in addition to OS labels, in order to use these clinical covariates as features in the survival model. While we found that they did not significantly alter the performance of the model, future work could explore hybridized approaches to predicting outcomes in virtual populations, that would involve imputing clinical features from real patients in a virtual population, in addition to the survival endpoints imputed in this work.
A unique and valuable aspect of our approach in the context of survival analysis is that our survival model not only benefits from the inclusion of tumor-derived covariates but also from non-tumor-derived covariates, particularly those derived from immune cell populations. This demonstrates that features in the QSP model that are not directly related to tumor growth can exhibit a predictive effect on survival. To the extent that QSP models accurately describe the underlying biology, future work may be able to leverage this kind of methodology to infer molecular or immunological events that are ultimately predictive of survival. Future work could expand on this by adopting a more parameter-inference focused approach, parsing out the relative contribution of immunological features in a sparser multivariable model.
Further improvement in model predictions could be made possible by alternative approaches to matching real patients to virtual patients, for example using immunological markers like PDL1 expression in matching, in addition to tumor dynamics. Expanding beyond tumor size alone could allow this methodology to generalize to other disease areas, particularly where tumor size is less predictive of survival. A multivariable matching approach that includes other clinical or biological variables like PDL1 expression could offer a more comprehensive patient representation and enhance model robustness. Further investigation of QSP feature extraction methods would also be of interest, both as a means of improving the predictive power of this approach as well as aiding in providing more detailed biological interpretations.
While survival analysis is a methodology more familiar within traditional statistics, deep learning approaches may add additional predictive power in providing in silico trial endpoints, though perhaps at the cost of some interpretability11,37. Deep learning approaches would be suited to unstructured data like time series, learning informative representations of QSP signals that would not require the heuristic feature extraction performed in this study.
This work provides the first example of an approach that could be applied to QSP models and survival data for other indications and pathways, allowing progression beyond this proof-of-concept by validation across other diseases and drug effects. While this work only considered overall survival as an endpoint, similar approaches could be extended to endpoints like progression-free-survival, which may be of clinical interest.
Supplementary information
Supplementary materials for “Predicting survival in prospective clinical trials using weakly-supervised QSP”
Related information for “Predicting survival in prospective clinical trials using weakly-supervised QSP”
Acknowledgements
The authors thank Pascal Chanu for carefully reviewing the manuscript and for providing suggestions to improve the overall readability of the manuscript.
Author contributions
M.W. performed the simulations, engineered the survival methods, and wrote the initial draft of the manuscript. M.W. and V.L. co-authored all subsequent versions of the manuscript. M.W. and V.L. jointly contributed to formulating the methodological framework of the approach. V.L. devised the original concept and the principles of the method, supervised the work, developed the QSP model and virtual population (details provided in the Related Information document), and generated the simulated QSP data. K.Y. and J.Y. provided additional statistical methodological guidance, as well as comments on key versions of the manuscript. All authors read and approved the final manuscript.
Data availability
The datasets generated in this study are not publicly available due to their proprietary nature.
Code availability
The underlying code for this study is not publicly available for proprietary reasons.
Competing interests
M.W. declares no financial or non-financial competing interests. V.L., K.Y., and J.Y. are employed by Genentech, Inc. and holds stocks in F. Hoffmann-La Roche Ltd.
Footnotes
Publisher’s note Springer Nature remains neutral with regard to jurisdictional claims in published maps and institutional affiliations.
Supplementary information
The online version contains supplementary material available at 10.1038/s41698-025-00898-6.
References
- 1.Sorger, P. K. et al. Quantitative and systems pharmacology in the post-genomic era: new approaches to discovering drugs and understanding therapeutic mechanisms. NIH White Pap. QSP Workshop Group48, 1–47 (2011). [Google Scholar]
- 2.Knight-Schrijver, V. R., Chelliah, V., Cucurull-Sanchez, L. & Le Novere, N. The promises of quantitative systems pharmacology modelling for drug development. Comput. Struct. Biotechnol. J.14, 363–370 (2016). [DOI] [PMC free article] [PubMed] [Google Scholar]
- 3.Ma, H. et al. A quantitative systems pharmacology model of T cell engager applied to solid tumor. AAPS J.22, 1–16 (2020). [DOI] [PMC free article] [PubMed] [Google Scholar]
- 4.Gong, C., Ruiz-Martinez, A., Kimko, H. & Popel, A. S. A spatial quantitative systems pharmacology platform spQSP-IO for simulations of tumor—immune interactions and effects of checkpoint inhibitor immunotherapy. Cancers13, 3751 (2021). [DOI] [PMC free article] [PubMed] [Google Scholar]
- 5.Milberg, O. et al. A QSP model for predicting clinical responses to monotherapy, combination and sequential therapy following CTLA-4, PD-1, and PD-L1 checkpoint blockade. Sci. Rep.9, 1–17 (2019). [DOI] [PMC free article] [PubMed] [Google Scholar]
- 6.Eisenhauer, E. A. et al. New response evaluation criteria in solid tumours: revised RECIST guideline (version 1.1). Eur. J. Cancer45, 228–247 (2009). [DOI] [PubMed] [Google Scholar]
- 7.Wang, Q., Gao, J. & Wu, X. Pseudoprogression and hyperprogression after checkpoint blockade. Int. Immunopharmacol.58, 125–135 (2018). [DOI] [PubMed] [Google Scholar]
- 8.Mushti, S. L., Mulkey, F. & Sridhara, R. Evaluation of overall response rate and progression-free survival as potential surrogate endpoints for overall survival in immunotherapy trials. Clin. Cancer Res.24, 2268–2275 (2018). [DOI] [PubMed] [Google Scholar]
- 9.Zhou, Z.-H. A brief introduction to weakly supervised learning. Natl. Sci. Rev.5, 44–53 (2018). [Google Scholar]
- 10.Ratner, A. et al. Snorkel: rapid training data creation with weak supervision. VLDB J.29, 709–730 (2020). [DOI] [PMC free article] [PubMed] [Google Scholar]
- 11.Wulczyn, E. et al. Deep learning-based survival prediction for multiple cancer types using histopathology images. PLoS One15, e0233678 (2020). [DOI] [PMC free article] [PubMed] [Google Scholar]
- 12.Natarajan, N., Dhillon, I. S., Ravikumar, P. K. & Tewari, A. Learning with noisy labels. Adv. neural Inf. Process. Syst.26, 1196–1204 (2013). [Google Scholar]
- 13.Zhang, S. et al. Integrating single cell sequencing with a spatial quantitative systems pharmacology model spQSP for personalized prediction of triple-negative breast cancer immunotherapy response. ImmunoInformatics1, 100002 (2021). [DOI] [PMC free article] [PubMed] [Google Scholar]
- 14.Wang, H., Arulraj, T., Kimko, H. & Popel, A. S. Generating immunogenomic data-guided virtual patients using a QSP model to predict response of advanced NSCLC to PD-L1 inhibition. NPJ Precis. Oncol.7, 55 (2023). [DOI] [PMC free article] [PubMed] [Google Scholar]
- 15.Venkatapurapu, S. P. et al. A computational platform integrating a mechanistic model of Crohn’s disease for predicting temporal progression of mucosal damage and healing. Adv. Ther.39, 3225–3247 (2022). [DOI] [PMC free article] [PubMed] [Google Scholar]
- 16.Peters, S. et al. Phase II trial of atezolizumab as first-line or subsequent therapy for patients with programmed death-ligand 1–selected advanced non–small-cell lung cancer (BIRCH). J. Clin. Oncol.35, 2781–2789 (2017). [DOI] [PMC free article] [PubMed] [Google Scholar]
- 17.Spigel, D. R. et al. FIR: efficacy, safety, and biomarker analysis of a phase II open-label study of atezolizumab in PD-L1–selected patients with NSCLC. J. Thorac. Oncol.13, 1733–1742 (2018). [DOI] [PMC free article] [PubMed] [Google Scholar]
- 18.Rittmeyer, A. et al. Atezolizumab versus docetaxel in patients with previously treated non-small-cell lung cancer (OAK): a phase 3, open-label, multicentre randomised controlled trial. Lancet389, 255–265 (2017). [DOI] [PMC free article] [PubMed] [Google Scholar]
- 19.Fehrenbacher, L. et al. Atezolizumab versus docetaxel for patients with previously treated non-small-cell lung cancer (POPLAR): a multicentre, open-label, phase 2 randomised controlled trial. Lancet387, 1837–1846 (2016). [DOI] [PubMed] [Google Scholar]
- 20.Spigel, D. et al. IMpower110: interim overall survival (OS) analysis of a phase III study of atezolizumab (atezo) vs platinum-based chemotherapy (chemo) as first-line (1L) treatment (tx) in PD-L1–selected NSCLC. Ann. Oncol.30, v915 (2019). [Google Scholar]
- 21.Lemaire, V., Rotte, A., Gadkar, K., Jin, J. & Ramanujan, S. Identifying biological signals differentiating responders and non-responders to MPDL3280A (Anti-Pdl1) in non-small cell lung cancer using quantitative systems pharmacology modeling of immune checkpoints. Clin. Pharmacol. Ther.105, S119–S119 (2019). [Google Scholar]
- 22.West, H. et al. Atezolizumab in combination with carboplatin plus nab-paclitaxel chemotherapy compared with chemotherapy alone as first-line treatment for metastatic non-squamous non-small-cell lung cancer (IMpower130): a multicentre, randomised, open-label, phase 3 trial. Lancet Oncol.20, 924–937 (2019). [DOI] [PubMed] [Google Scholar]
- 23.Claret, L. et al. Evaluation of tumor-size response metrics to predict overall survival in Western and Chinese patients with first-line metastatic colorectal cancer. J. Clin. Oncol.31, 2110–2114 (2013). [DOI] [PubMed] [Google Scholar]
- 24.Claret, L. & Jin, J. Y. & Fert. A model of overall survival predicts treatment outcomes with atezolizumab versus chemotherapy in non-small cell lung cancer based on early tumor kinetics. Clin. Cancer Res.24, 3292–3298 (2018). [DOI] [PubMed] [Google Scholar]
- 25.Chan, P. et al. Prediction of overall survival in patients across solid tumors following atezolizumab treatments: a tumor growth inhibition-overall survival modeling framework. CPT: Pharmacomet. Syst. Pharmacol.10, 1171–1182 (2021). [DOI] [PMC free article] [PubMed] [Google Scholar]
- 26.Chan, P. et al. Application of machine learning for tumor growth inhibition-overall survival modeling platform. CPT: Pharmacomet. Syst. Pharmacol.10, 59–66 (2021). [DOI] [PMC free article] [PubMed] [Google Scholar]
- 27.Bruno, R., Mercier, F. & Claret, L. Evaluation of tumor size response metrics to predict survival in oncology clinical trials. Clin. Pharmacol. Ther.95, 386–393 (2014). [DOI] [PubMed] [Google Scholar]
- 28.Claret, L., Mercier, F., Houk, B. E., Milligan, P. A. & Bruno, R. Modeling and simulations relating overall survival to tumor growth inhibition in renal cell carcinoma patients. Cancer Chemother. Pharmacol.76, 567–573 (2015). [DOI] [PubMed] [Google Scholar]
- 29.Han, K. et al. Modeling and simulation of maintenance treatment in first-line non-small cell lung cancer with external validation. BMC Cancer16, 1–9 (2016). [DOI] [PMC free article] [PubMed] [Google Scholar]
- 30.Terranova, N., Girard, P., Ioannou, K., Klinkhardt, U. & Munafo, A. Assessing similarity among individual tumor size lesion dynamics: the CICIL methodology. CPT: Pharmacomet. Syst. Pharmacol.7, 228–236 (2018). [DOI] [PMC free article] [PubMed] [Google Scholar]
- 31.Vera-Yunca, D. et al. Machine learning analysis of individual tumor lesions in four metastatic colorectal cancer clinical studies: linking tumor heterogeneity to overall survival. AAPS J.22, 1–12 (2020). [DOI] [PMC free article] [PubMed] [Google Scholar]
- 32.Wang, H., Arulraj, T., Ippolito, A. & Popel, A. S. From virtual patients to digital twins in immuno-oncology: lessons learned from mechanistic quantitative systems pharmacology modeling. NPJ Digit. Med.7, 189 (2024). [DOI] [PMC free article] [PubMed] [Google Scholar]
- 33.Davidson-Pilon, C. Lifelines: survival analysis in Python. J. Open Source Softw.4, 1317 (2019). [Google Scholar]
- 34.Pedregosa, F. et al. Scikit-learn: machine learning in Python. J. Mach. Learn. Res.12, 2825–2830 (2011). [Google Scholar]
- 35.Akaike, H. A new look at the statistical model identification. IEEE Trans. Autom. control19, 716–723 (1974). [Google Scholar]
- 36.Harrell, F. E. Jr, Lee, K. L. & Mark, D. B. Multivariable prognostic models: issues in developing models, evaluating assumptions and adequacy, and measuring and reducing errors. Stat. Med.15, 361–387 (1996). [DOI] [PubMed] [Google Scholar]
- 37.Kvamme, H., Borgan, O. & Scheel, I. Time-to-event prediction with neural networks and Cox regression. J. Mach. Learn. Res.20, 1–30 (2019). [Google Scholar]
Associated Data
This section collects any data citations, data availability statements, or supplementary materials included in this article.
Supplementary Materials
Supplementary materials for “Predicting survival in prospective clinical trials using weakly-supervised QSP”
Related information for “Predicting survival in prospective clinical trials using weakly-supervised QSP”
Data Availability Statement
The datasets generated in this study are not publicly available due to their proprietary nature.
The underlying code for this study is not publicly available for proprietary reasons.