

Abstract
Cereal rye (Secale cereale) is a grain, forage, and cover crop, with specific regional production practices. Maintaining regional varieties is challenged by rye reproductive biology, as wind pollination may dilute varietal distinction. Similarly, breeding new population varieties for regional needs lacks efficiency gains seen in other grains. We sought to address the challenges in maintaining and breeding rye population varieties in the Southeastern United States, where rye is a forage and cover crop, with emerging grain markets. Genetic and phenotypic variation within and between populations was characterized to determine varietal differentiation and test the efficacy of genomic selection for population improvement. Using 15 Southeastern rye accessions and eight breeding populations, we genotyped and phenotyped more than 500 individuals and found that most phenotypic and genetic variation is within rather than among accessions. Latitude of variety source, but not end use, contributed to intervarietal variation for heading date, but not traits associated with seed yield. Genomic prediction accuracy was moderately high (r > 0.3) for most traits, but within‐population prediction accuracy was more variable, with only some populations having nonzero within‐population prediction accuracy. This work establishes the inter‐ and intravarietal differentiation in Southeastern rye accessions, and demonstrates viability of genomics‐enabled population improvement for regional varieties.
Core Ideas
Rye population breeding is important for forage, cover crop, and grain markets in the southeastern United States.
Most phenotypic and genetic variation resides within rye populations, rather than between distinct populations.
Latitude of population development is predictive of heading date and spike size, but no other traits.
Genomic prediction accuracy was lower within populations than for individuals across multiple accessions.
Abbreviations
- BLUPs
best linear unbiased predictors
- GBLUP
genomic BLUP
- GWAS
genome‐wide association study
- MAF
minor allele frequency
- SNP
single nucleotide polymorphism
- TKW
1000‐kernel weight
1. INTRODUCTION
Cereal rye (Secale cereale) is an important grain, forage, and cover crop with worldwide distribution and cultivation (Korzun et al., 2021), in part due to its resilience to biotic and abiotic stresses (Rakoczy‐Trojanowska et al., 2021) and unique quality attributes (Brzozowski et al., 2023). Different regional needs shape rye cultivation practices and end uses. For instance, in more temperate regions, rye is more frequently cultivated for grain production, while in warmer climates, rye is an important pasture and forage crop (Miedaner & Laidig, 2019; Newell & Butler, 2013). Regional priorities for rye have resulted in the development of local landraces and population varieties (Adamo et al., 2021; Larsson et al., 2019; Monteiro et al., 2016), and these populations are a reservoir of genetic diversity for plant breeding (Hawliczek et al., 2023). However, methods to quantify variation in rye populations and strategies to leverage genetic variation to develop new locally adapted population varieties remain underdeveloped.
The degree to which historical regional landraces and population varieties harbor genetic variation has been assessed to inform rye conservation and breeding efforts. While regional varieties preserve traits essential to local production and agricultural practices, there is frequently a lack of strong genetic differentiation between accessions. In studies of regional and global rye, percentage of genetic variation attributed to within‐accessions rather than between populations exceeds 76% (Hagenblad et al., 2016; Larsson et al., 2019; Monteiro et al., 2016; Parat et al., 2016). While variation within populations often eclipses variation between populations, breeding and production practices at a continental scale have led to between‐population differentiation. For instance, the coupled forces of more intensive breeding for grain in northern Europe and less intensive selection in southern Europe for forage have contributed to population differentiation (Hagenblad et al., 2016; Parat et al., 2016). Similarly, specific cultivation practices in Fennoscandia have led to varietal distinction between local populations and other European rye (Larsson et al., 2019). Generally, however, minimal geographic structuring has been reported (Bolibok‐Brągoszewska et al., 2014; Schreiber et al., 2022; Sidhu et al., 2019), except for at the broad scale of continent of source (e.g., Asia vs. not Asia) (Maraci et al., 2018; Schreiber et al., 2019). In addition, while genetic diversity has been widely sampled, only rarely has within‐accession phenotypic variation been addressed. For example, phenotypes were measured on bulked rather than individual plants from 100 global accessions (Targońska‐Karasek et al., 2020). Together, this shows that regional accessions reflect variation necessary for local production practices, and that more variation exists within these accessions, than exists between accessions. However, tests of genetic structuring at finer geographical scales coupled with phenotypic measurements are still lacking.
Assessing genetic variation and differentiation within rye populations is challenged by rye being a seed‐propagated, allogamous, wind‐pollinated crop. As is seen in landraces and regional populations, there is an evidently high degree of intermating between rye populations, and maintaining isolated, differentiated populations is not trivial. Even rye populations maintained at gene banks are susceptible to genetic drift. For instance, rye stored in a gene bank had different allele frequencies between the original seed sample (stored in herbarium) when compared with the most recent multiplication, including loss of some alleles (Chebotar et al., 2003). Similarly, rye stored in a gene bank in Portugal was genetically distinct from on‐farm conserved rye populations (Monteiro et al., 2016). Despite these challenges, rye populations from germplasm collections have led to advances in rye association mapping, as shown in a genome‐wide association studies (GWAS) for tan spot resistance (Pyrenophora tritici‐repentis) (Sidhu et al., 2019) and winter hardiness (Båga et al., 2022). In addition, evaluating individuals within populations has also proven useful in genetic mapping. Gruner et al. (2021) evaluated 100 individual plants each from five population varieties for stem rust (Puccinia graminis f. sp. secalis) resistance and found that individuals within the populations had varied responses to three different isolates, resulting in successful quantitative trait loci mapping within the populations (Gruner et al., 2021). Together, this indicates that there can be substantial heritable phenotypic variation between and within rye population varieties, and that specifically surveying population germplasm for regional adaptation can be of value to plant breeders.
To accelerate rye population improvement, it will be critical to leverage new genomic resources and tools, including the rye genome (Li et al., 2021; Rabanus‐Wallace et al., 2021). In hybrid breeding programs, there has been successful implementation of GWAS (e.g., Madsen et al., 2024; Siekmann et al., 2021; Vendelbo et al., 2021) and genomic selection (e.g., Auinger et al., 2016; Bernal‐Vasquez et al., 2017; Galán et al., 2020). Most commercial rye breeding efforts are hybrid breeding (Geiger & Miedaner, 2009; Miedaner & Laidig, 2019), and the landscape for population development lags in research investment, especially in developing approaches for genomics‐enabled population improvement. These differences in population and hybrid investment are evidenced by relatively slower progression in yield increases in population varieties (Laidig et al., 2017). Furthermore, modern genomic techniques, such as genomic selection, have not been applied to population improvement in rye, although genomic selection for population improvement has shown promise for many allogamous crops (Esfandyari et al., 2020; Lin et al., 2016; Schwantes et al., 2020; Yabe et al., 2013). As such, it is desirable to develop genomic approaches relevant for rye population development, especially for geographic regions or end uses in which hybrid rye is not economically viable (e.g., forage, cover crops).
We thus sought to survey population variation and test new approaches for winter rye population breeding, with a specific focus on rye in the southeastern United States. Cereal rye continues to be an important forage and grazing crop in the Southeast (Kim et al., 2016; Newell & Butler, 2013), and production of grain for both specialty markets (e.g., distilling) and cover crop seed is also growing (Brzozowski et al., 2023). Historically, winter rye breeding was supported at several universities and nonprofits in the region, leading to releases of winter rye varieties still grown today (Barnett et al., 2002; Newell & Butler, 2013). Today, there are fewer public programs engaged in winter rye breeding in the Southeast, in part because rye lacks the infrastructure and support of other small grains, like wheat. Nonetheless, due to the rising demand for local rye, there is a need to characterize Southeastern rye germplasm and to assess how to integrate genomic tools for more efficient development of new, regionally adapted populations.
In this study, we evaluated genetic and phenotypic diversity of winter rye populations in the southeastern United States by developing a regional testing panel as well as a panel of populations from the University of Kentucky breeding program. Specifically, we genotyped individual plants and measured a range of developmental, yield, and quality traits. We then partitioned genetic variation of individual traits to variation within and between populations. Importantly, we sought to leverage these data to test approaches for genomics‐enabled rye population breeding. Genomic prediction accuracy of these traits across and within populations was also estimated. Overall, we have characterized germplasm diversity of important rye accessions for the Southeast and developed approaches for integrating new genomic resources in rye population improvement. Results from this work have implications for rye population breeding, emphasize the importance of maintaining regionally adapted populations, and could be extended to other outcrossing species.
Core Ideas
Rye population breeding is important for forage, cover crop, and grain markets in the southeastern United States.
Most phenotypic and genetic variation resides within rye populations, rather than between distinct populations.
Latitude of population development is predictive of heading date and spike size, but no other traits.
Genomic prediction accuracy was lower within populations than for individuals across multiple accessions.
2. MATERIALS AND METHODS
2.1. Germplasm
We used 15 diploid open‐pollinated winter rye accessions in the Southeast Panel (Table 1): n = 9 and n = 4 forage and grain accessions, respectively, developed in the southern United States, and n = 2 northern grain accessions as comparisons. For some analyses, we excluded the northern grain accessions and refer to this as the “Reduced Southeast Panel.” Primary end use, breeding program, and location were determined by Plant Variety Protection, Plant Registration, or university documentation. We were unable to find a definitive reference for Mississippi Abruzzi, and University of Kentucky breeding lines do not have references. All plants except the breeding lines were sourced from the USDA National Plant Germplasm System National Small Grains Collection. The accessions are briefly described here and in full in Supporting Information S1.
TABLE 1.
Description of accessions used in the Southeast Panel. Accession name, abbreviation (abbr.), predominant end use (use), the breeding program that developed the accession, the source of seed (source), documentation of its release (note), and rationale for inclusion (rationale). The Reduced Southeast Panel are the genotypes below but excluding ND Dylan and Rymin.
| Variety | Abbr. | Use | Breeding program | Source | Note | Rationale |
|---|---|---|---|---|---|---|
| Athens Abruzzi | AAB | Forage | University of Georgia (Athens, GA) |
NPGS, PI 534936 |
(Brown, 1973) | Regional Abruzzi selection |
| Balbo | BAL | Grain | Tennessee Agricultural Experiment Station (Oak Ridge, TN) |
NPGS, PI 534939 |
(Qualset & Hoskinson, 1967) | Well‐known heirloom grain variety |
| Bates | BAT | Forage | Noble Foundation (Ardmore, OK) |
NPGS, PI 591057 |
(Baker et al., 1996) | Noble Foundation rye variety |
| Elbon | EBO | Forage | Noble Foundation (Ardmore, OK) |
NPGS, PI 534961; Syn Cise 11 |
(Kim et al., 2016) a | First Noble Foundation forage rye variety |
| Explorer | EXP | Grain | Mississippi Agricultural Experiment Station (State College, MS) |
NPGS, PI 534962 |
(Barnes & Wells, 1960) | Regional Abruzzi selection |
| Florida Black | FLB | Forage | University of Florida (Gainesville, FL) |
NPGS, PI 534965 |
(Pfahler et al., 1985) a | Florida forage rye |
| KYSC1503C1 | KY1 | Grain | University of Kentucky (Lexington, KY) | Grain selection | ||
| KYSC1707C2 | KY2 | Grain | University of Kentucky (Lexington, KY) | Grain selection | ||
| KYSC1710C1 | KY3 | Forage | University of Kentucky (Lexington, KY) | Forage selection | ||
| KYSC1803C0 | KY4 | Forage | University of Kentucky (Lexington, KY) | Forage selection | ||
| Mississippi Abruzzi | MAB | Forage | Mississippi Agricultural Experiment Station (State College, MS) |
NPGS, PI 535154 |
– | Regional Abruzzi selection |
| ND Dylan | NDD | Grain | North Dakota Agricultural Experiment Station (Carrington, ND) | Commercial | (NDSU Research Foundation, 2020) | Major production area grain comparison |
| Rymin | RYM | Grain | University of Minnesota Agricultural Experiment Station (St. Paul, MN) |
NPGS, Cise 176 |
(Robinson, 1973) | Major production area grain comparison |
| Wrens Abruzzi | WAB | Forage | University of Georgia (Tifton, GA) |
NPGS, Cise 36 |
(Morey, 1970) | Widely grown; UGA |
| Wintergrazer‐70 | WGR | Forage |
Pennington Grain & Seed, Inc. (Madison, GA) |
NPGS, CIse 38 |
(Pennington Grain & Seed, Inc., 1978) | Well‐known heirloom forage variety |
Note: “–” indicates that documentation is not available.
Variety referenced within, not original release notice of variety.
This Southeast Panel includes five Abruzzi‐type ryes that have grain harvest potential. Abruzzi ryes were introduced to the United States from Italy in the early 1900s by the USDA (Morey, 1970), and those on the Southeast Panel include Balbo rye, released by the Tennessee Agricultural Experiment Station in 1933 (Qualset & Hoskinson, 1967); Explorer rye, released by the Mississippi Agricultural Experiment Station in 1960 as a grazing variety with potential additional harvest of a grain cash crop (Barnes & Wells, 1960); Mississippi Abruzzi was developed by Mississippi State University; Wrens Abruzzi rye by the University of Georgia in 1953 (Morey, 1970); Athens Abruzzi rye, selected for forage yield and kernel size also by the University of Georgia (Brown, 1973). The Southeast Panel also includes four ryes selected for forage yield including Florida Black, a variety developed for winter forage (Pfahler et al., 1985); Wintergrazer‐70, a variety with high tiller number and later maturity developed in Georgia (Pennington Grain & Seed, Inc., 1978); Elbon, the first rye variety released by the Samuel Roberts Noble Foundation in 1956 (Kim et al., 2016); and Bates, a forage variety release by the Samuel Roberts Noble Foundation and the Texas Agricultural Experiment Station (Baker et al., 1996). Finally, the Southeast Panel includes two grain accessions developed by breeding programs in the northern plains as comparisons. Rymin was released by the University of Minnesota Agricultural Experiment Station in 1973 (Robinson, 1973). ND Dylan is an open‐pollinated grain rye recently developed by North Dakota State University (NDSU Research Foundation, 2020).
We also grew eight other University of Kentucky breeding lines that were evaluated separately as the Kentucky Panel (Table 2). All populations in this panel were sourced from the University of Kentucky rye breeding program.
TABLE 2.
Description of accessions used in the Kentucky Panel. Accession name, abbreviation (abbr.), predominant end use (use), and rationale for inclusion (rationale).
| Variety | Abbr. | Use | Rationale |
|---|---|---|---|
| KYSC1804C0 | KY5 | Forage | 15 parents, southern USA |
| KYSC1812C0 | KY6 | Grain | 27 parents, diverse USA and Europe |
| KYSC1812C2 | KY7 | Grain | 2 cycles of selection |
| KYSC1815C0 | KY8 | Grain | 40 parents, mostly European |
| KYSC1816C0 | KY9 | Grain | 4 parents, 1 each of Pearl, Animo, Aventino, and Weszanowski |
| KYSC1902C1 | KY10 | Forage | 15 parents, mostly southern USA |
| KYSC1904C0 | KY11 | Grain | 15 parents, mostly European |
| KYSC1912C0 | KY12 | Grain | 15 parents, 7 Tenn 4063, 8 Petroske |
The third set of germplasm grown was a small evaluation of Aroostook, a common cover crop in the United States developed in Maine (USDA‐Natural Resources Conservation Service, 2015), from two different sources (Albert Lea Seed, “CCA”; NPGS PI 464583, “CCG”). With these two sources, we tested the degree to which identity was conserved between sources.
2.2. Plant growth conditions
The Southeast Panel and the Aroostook were grown in a common garden in a University of Kentucky greenhouse. Seeds were sown into flats into Promix BX potting mix in late January 2023. Note that 2 weeks after sowing, the plants were moved into a 4°C vernalization room with a 12‐h photoperiod for 10–12 weeks. The plants were then transplanted into 3.8 L pots in a greenhouse with a 14‐h photoperiod and 22°C (72°F) day/16°C (60°F) night temperatures. The plants were fertilized with Osmocote Plus 15‐9‐12 3–4 month release shortly after transplanting and watered as needed. The plants were sprayed twice with an insecticidal soap to manage aphid infestations after heading.
For each accession in the Southeast Panel, n = 24 individuals per accession were grown in a randomized complete block design in the greenhouse where 3–4 individuals per accession were in a block (greenhouse bench). The two Aroostook sources were grown with eight individual plants per accession with one per block. The perimeter of each block (bench) was a rye border.
The Kentucky Panel was likewise sown in flats and vernalized. After vernalization, individual plants were hand‐transplanted as space plants in blocks by accession, with 25 m between each accession at the University of Kentucky North Farm in Spring 2023. Accessions were grouped together such that the seed was usable for seed multiplication (rather than intermating of all accessions). Spikes were harvested at maturity in Summer 2023.
2.3. Plant phenotyping
We recorded phenotypes for individual plants in each accession. For the Southeast Panel and the Aroostook, we recorded the heading date (Zadoks 55) from May 9, 2023 until June 11, 2023. At harvest, the number of spikes (number of reproductive tillers) was recorded for individual plants. Mature spikes were cut from the plant and scanned using an Epson Perfection V800 Photo Color Scanner at 6400 dpi with a dual lens system. Images were processed in ImageJ to measure spike area (Schneider et al., 2012). We used a custom ImageJ macro to remove pollen grains and reduce awn visibility to measure spike area (Method S1). Mean spike area (mean spike size) was calculated as total spike area divided by spike count. All spikes from a plant were then threshed together. Seeds were counted and weighed, and then 1000‐kernel weight (TKW) was estimated.
For the Kentucky Panel, spike count and seed mass were measured, and TKW was estimated. For all samples with seed mass >10 g, seed composition was evaluated by near infrared (NIR) spectroscopy with a Perten DA 7250 NIR Analyzer (PerkinElmer) in the small (10 g) evaluation cup. The composition traits of starch, protein, fiber, and ash were determined by the Honing's regression rye equation available in the software (updated Spring 2024). Each sample was scanned three times, and results were averaged.
In sum, heading date, reproductive tiller number, spike area (total and mean), seed mass, and TKW were phenotyped for 344 individuals in the Southeast Panel, with complete phenotypic data for 336 individuals. Each of the 15 accessions had complete data for 21–24 individuals per accession. Aroostook was phenotyped in the same way as the Southeast Panel with 7–8 individuals with complete phenotypes per accession. There were 192 plants in the Kentucky Panel that were transplanted into the field (eight breeding populations with 24 individuals each), of which 165 survived to maturity. Of these, 117 had >10 g seed, and composition was evaluated by NIR. In sum, 16–23 per population had field phenotypes (mean 20.6), and 10–19 (mean 14.6) per population had both field and composition phenotypes. Analysis was conducted with all available phenotypic data.
2.4. Phenotypic diversity analysis
We first assessed if there were differences between accessions in the Southeast Panel using the following model:
| (1) |
where Ai is the fixed effect of accession, “Block j ” is the random effect of block (bench), and “Block:Row jk ” and “Block:Column jl ” are the random effects of row and column nested within block, respectively, and eijkl is the residual error variance. The model was fitted first to identify outliers, which were defined as values with studentized residuals >3, outliers were removed, and the model was fitted again. The model was implemented using the “lmer” function in the lme4 package in R (Bates et al., 2015), and significance testing was done with the lmerTest package (Kuznetsova et al., 2017). As there were not spatial covariates for the Kentucky Panel, we used a linear model with only the fixed effect of accession and implemented the model with the “lm” function in R. Outlier removal was conducted as for the Southeast Panel. For both the Southeast and Kentucky Panels, accession means and confidence intervals were calculated as the estimated marginal means from the described models with the emmeans package (Length, 2023), and significant pairwise differences were estimated using a Bonferroni adjustment with the “cld” function in the multcomp R package (Hothorn et al., 2008). To determine if there were significant phenotypic differences between the two Aroostook sources, which were only grown with one plant per bench (block), we used a Welch two‐sample t‐test implemented with the “t.test” function in R.
We then tested if phenotypic differences between accessions in the Southeast Panel were geographically structured by latitude of variety development using the following model:
| (2) |
where L is the fixed effect of latitude (continuous variable), and accession was fitted as a random effect; other random effects, outlier removal, and model implementation remain the same as above. We fitted the model for both the full and Reduced Southeast Panel. Results were plotted after outlier removal.
We then calculated the degree to which trait variation was partitioned between versus within accessions and attributed to experimental parameters (block, row, column). We fit Equation (1) using the “fitVCA” function in the VCA package (Schuetzenmeister & Dufey, 2022) using data with outliers removed as described above from the full and Reduced Southeast Panel, and the Kentucky Panel, all separately. We also fit Equation (1) with the addition of end use as a fixed effect to assess variance attributed to end use. We then extracted variance components for all phenotypes.
Last, we calculated best linear unbiased predictors (BLUPs) for individual plants in the Southeast Panel. Because the phenotypes of heading date, seed mass, TKW, and mean spike area were right‐skewed, those phenotypes were square‐root transformed. BLUPs were estimated for the individuals, all unreplicated, using an augmented design, where the two Aroostook accessions were repeated checks within each block:
| (3) |
The identity of the Aroostook check was denoted by “Check,” and whether the individual plant was a check or entry was identified by “new,” where entries also had individual identifiers, “ID.” The mixed model was implemented, and outliers were identified as above. The BLUPs were deregressed (Garrick et al., 2009), and the deregressed BLUPs, drBLUPs, were used in further analysis. It was not possible to calculate BLUPs for the Kentucky Panel, and so phenotypes after outlier removal (described above) were used.
2.5. Plant genotyping
We sequenced the panels with the Rye 5K SNP array by TraitGenetics. Prior to vernalization, we sampled leaf tissue from 24 individuals per accession, except for KY12 (KYSC1912C0), in which 20 individuals were sampled. For Aroostook, eight individuals were sampled from each seed source. The tissue was freeze‐dried, and DNA extraction, quality control, and sequencing were conducted by TraitGenetics.
The genotyping resulted in 564 individuals genotyped with 4960 markers. After removing the 328 markers that were fully missing, we inspected markers with missing rates >20%, and found that missing markers were spread across accessions, rather than some accessions missing the single nucleotide polymorphism (SNP), and thus removed the 69 SNPs missing in >20% of individuals. We then removed 11 individuals with fully missing data. After filtering, mean marker missingness per individual was 0.65% (30 SNPs). The SNP coding was converted to (−1, 0, 1) coding using the “atcg1234” function in sommer (Covarrubias‐Pazaran, 2016), and monomorphic SNPs were removed. This resulted in the full dataset including 553 individuals and 4528 markers. From the full data, we generated four data subsets where monomorphic SNPs were likewise removed: (1) The Southeast Panel, 351 individuals and 4524 markers; (2) The Reduced Southeast Panel with northern checks removed, 305 individuals and 4519 markers; (3) The Kentucky Panel, 278 individuals and 4523 markers; and (4) Aroostook, 15 individuals and 4264 markers.
2.6. Plant genetic diversity analysis
We first visualized the degree of genetic differentiation among accessions by genomic principal components using a scaled and centered marker matrix with the “prcomp” function in R. We then quantified population subdivision of rye using Wright's FST for the Southeast and Kentucky Panels. The data were prepared by generating a “genind” object using the “df2genind” function from the “adegenet” package (Jombart, 2008). Then pairwise FST was calculated between accessions using the “genet.dist” function with the “WC84” method in the “hierfstat” R package (Goudet, 2005). Finally, we assessed concordance as the percentage of shared alleles between individuals within and between accessions; for each locus, individuals that were identical shared two alleles, and one allele was shared if one individual was heterozygous and one individual was homozygous.
We then sought to characterize factors that contributed to varietal differentiation in the Southeast and Kentucky Panels. We started by testing if particular alleles were private to one or a few accessions (minor allele frequency [MAF] = 0, in all but one or a few accessions). We then examined the inverse: if an allele was missing from a variety (MAF = 0), but at moderate to high frequency in most other accessions. We also calculated observed heterozygosity (HO ; proportion of heterozygous calls) of individuals within accessions. We calculated estimated marginal means for individual accessions and evaluated significant contrasts between them using the “emmeans” and “contrast” functions. We then tested if observed heterozygosity (HO ) differed by predominant end use (forage or grain) for the Southeast and Kentucky Panels separately, using a linear mixed model, where end use was a fixed effect, and accession nested within end use was a random effect.
2.7. Genomic analysis and prediction
We conducted a genome‐wide association study (GWAS) to elucidate genomic regions associated with the traits as well as genomic prediction to assess the prospect of genomics‐enabled population improvement. For these applications, we used only individuals that had both complete phenotypes and genotypes, which were 336 and 291 individuals in the full and Reduced Southeast Panel, respectively. From the Kentucky Panel, this was 159 and 116 genotyped individuals with complete field and composition phenotypes, respectively.
We conducted GWAS for all traits in the Southeast Panel. Positions of SNPs in the rye genome (Rabanus‐Wallace et al., 2021) were provided by TraitGenetics (Lauren Brzozowski, personal communication, September 2024). Of the 4524 SNPs that passed filtering for the Southeast Panel, 3803 had genomic positions, and only those SNPs were used. The GWAS was implemented with a genomic relationship matrix and no other covariates in the R package “statgenGWAS” (van Rossum & Kruijer, 2022) using the “runSingleTraitGwas” function.
We then assessed the degree to which genomic prediction could be beneficial for population improvement. We used all available polymorphic SNPs, not just those aligned to the genome, for genomic prediction (4524 for Southeast Panel; 4496 and 4493 for the Kentucky Panel with field and composition phenotypes, respectively). Using the drBLUPs, we tested two models: genomic BLUP (GBLUP) implemented in rrBLUP (Endelman, 2011) and Bayes B implemented with 20,000 iterations and a burn‐in of 5000 iterations in BGLR (Pérez & de los Campos, 2014). First, we conducted fivefold cross‐validation by panels (Southeast, Reduced Southeast, and Kentucky with field and composition phenotypes separately) with 50 replications, and prediction accuracy was reported as the Pearson correlation between the predicted and observed value. Then, we assessed prediction accuracy within populations again by panel. For this analysis, we calculated marker effects using the training set of all populations in the panel except the focal population, and then predicted within that population. As an example, we assessed within‐population prediction accuracy in Explorer with the Southeast Panel using all accessions in the panel except Explorer in the training set. In both cross‐validation and within‐population prediction, we used paired t‐tests to test if there were significant differences between models.
2.8. Statistical analysis
All statistical analyses are conducted in R (R Core Team, 2016), with data visualization done in the ggplot2 (Wickham, 2016) and ggpubr packages (Kassambara, 2020).
3. RESULTS
We assessed inter‐ and intra‐accession phenotypic and genetic diversity in accessions (Southeast Panel, Table 1; Figure 1; Kentucky Panel, Table 2), and between two seed sources of Aroostook.
FIGURE 1.

Map of development locations for the accessions in the Southeast Panel. The Reduced Southeast Panel excludes the accessions from the two northern states. Accession name abbreviation is given in Table 1.
3.1. Phenotypic variation
There were significant pairwise differences between accessions in the Southeast Panel for heading date and, to a lesser extent, spike morphology traits, but rarely for seed mass or TKW (Table 3; Figure S1). For instance, there was a 22‐ and 15‐day spread in heading date in the full and Reduced Southeast Panel, respectively, and number of spikes ranged from an average of 10 to 17. Spike and seed traits were also not significantly different between varieties in the Kentucky Panel. However, there were significant differences in composition (e.g., percent protein ranged from 16.75% to 18.92% and percent fiber ranged from 2.97 to 3.64) in the Kentucky Panel (Figure S2; Table 4). Finally, Aroostook from two different seed sources had significant differences in heading date (7.5 days), and the commercial variety had 55% higher spike area and 50% higher TKW than the germplasm accession (Figure S3).
TABLE 3.
Mean (μ) and standard error (SE) of phenotypes measured in the Southeast Panel, where accession abbreviation is given in Table 1.
| Name | Heading date | Seed mass (g) | 1000‐Kernel weight (g) | Spike count | Total spike area (cm2) | Mean spike area (cm2) | ||||||||||||
|---|---|---|---|---|---|---|---|---|---|---|---|---|---|---|---|---|---|---|
| μ | SE | μ | SE | μ | SE | μ | SE | μ | SE | μ | SE | |||||||
| AAB | 140.1 | 1.0 | BCD | 4.1 | 0.5 | ABC | 23.2 | 1.1 | A | 17.2 | 1.0 | E | 108.1 | 7.7 | BCDE | 6.3 | 0.3 | ABC |
| BAL | 149.8 | 0.9 | H | 2.5 | 0.5 | A | 26.1 | 1.1 | A | 14.7 | 0.9 | ABCDE | 114.2 | 7.4 | CDE | 7.9 | 0.2 | DEFG |
| BAT | 139.1 | 0.9 | BC | 5.8 | 0.5 | C | 24.7 | 1.1 | A | 16.8 | 0.9 | DE | 120.9 | 7.4 | DE | 7.2 | 0.2 | CDEF |
| EBO | 142.9 | 0.9 | CDEF | 5.6 | 0.5 | BC | 25.9 | 1.1 | A | 16.6 | 1.0 | CDE | 121.9 | 7.5 | DE | 7.4 | 0.2 | CDEFG |
| EXP | 138.3 | 1.0 | AB | 3.0 | 0.5 | A | 24.8 | 1.1 | A | 12.1 | 1.0 | AB | 86.8 | 7.8 | ABC | 7.2 | 0.3 | BCDEFG |
| FLB | 134.0 | 0.9 | A | 2.4 | 0.5 | A | 21.3 | 1.1 | A | 12.7 | 1.0 | ABCD | 73.5 | 7.4 | A | 5.4 | 0.2 | A |
| KY1 | 139.7 | 1.0 | BCD | 5.2 | 0.5 | BC | 23.8 | 1.1 | A | 16.3 | 1.0 | BCDE | 119.0 | 7.8 | CDE | 7.2 | 0.3 | BCDEFG |
| KY2 | 144.1 | 1.0 | DEFG | 3.0 | 0.5 | A | 23.5 | 1.1 | A | 12.1 | 1.0 | AB | 95.3 | 7.6 | ABCDE | 7.9 | 0.3 | DEFG |
| KY3 | 148.1 | 1.0 | GH | 3.6 | 0.5 | AB | 25.8 | 1.2 | A | 10.5 | 1.0 | A | 87.7 | 7.8 | ABC | 8.3 | 0.3 | FG |
| KY4 | 146.5 | 1.0 | FGH | 4.5 | 0.5 | ABC | 25.8 | 1.1 | A | 16.2 | 1.0 | BCDE | 127.2 | 7.6 | E | 8.1 | 0.2 | EFG |
| MAB | 138.8 | 1.0 | BC | 2.6 | 0.5 | A | 21.6 | 1.2 | A | 12.2 | 1.0 | ABC | 79.8 | 7.9 | AB | 6.2 | 0.3 | ABC |
| NDD | 156.5 | 1.0 | I | 2.7 | 0.5 | A | 23.2 | 1.2 | A | 10.7 | 1.0 | A | 92.7 | 7.7 | ABCD | 8.4 | 0.3 | G |
| RYM | 145.3 | 1.0 | EFGH | 2.4 | 0.5 | A | 22.5 | 1.1 | A | 15.0 | 1.0 | ABCDE | 106.3 | 7.5 | BCDE | 7.0 | 0.2 | BCDE |
| WAB | 137.0 | 0.9 | AB | 3.9 | 0.5 | ABC | 24.4 | 1.2 | A | 17.4 | 0.9 | E | 105.9 | 7.4 | BCDE | 6.1 | 0.2 | AB |
| WGR | 141.5 | 1.0 | BCDE | 4.4 | 0.5 | ABC | 24.7 | 1.2 | A | 15.3 | 1.0 | BCDE | 102.4 | 7.9 | ABCDE | 6.9 | 0.3 | BCD |
Note: The estimated marginal mean and standard error are presented and the compact letter display indicates significance pairwise differences within phenotypes with p BONF < 0.05.
TABLE 4.
Mean (μ) and standard error (SE) of phenotypes measured in the Kentucky Panel, where accession abbreviation is given in Table 2.
| Name | Seed mass (g) | 1000‐Kernel weight (g) | Spike count | Starch (% DW) | Protein (% DW) | Fiber (% DW) | Ash (% DW) | ||||||||||||||
|---|---|---|---|---|---|---|---|---|---|---|---|---|---|---|---|---|---|---|---|---|---|
| μ | SE | μ | SE | μ | SE | μ | SE | μ | SE | μ | SE | μ | SE | ||||||||
| KY5 | 20.07 | 2.24 | A | 28.04 | 1.16 | A | 20.60 | 1.68 | A | 68.73 | 0.45 | BC | 18.92 | 0.45 | B | 3.13 | 0.09 | AB | 1.59 | 0.04 | C |
| KY6 | 16.17 | 2.09 | A | 28.81 | 1.11 | A | 19.30 | 1.57 | A | 70.29 | 0.44 | C | 18.76 | 0.44 | B | 2.97 | 0.09 | A | 1.46 | 0.03 | ABC |
| KY7 | 19.19 | 2.19 | A | 30.50 | 1.08 | A | 17.48 | 1.64 | A | 69.75 | 0.41 | C | 18.55 | 0.41 | AB | 3.05 | 0.09 | A | 1.34 | 0.03 | A |
| KY8 | 20.27 | 2.14 | A | 29.77 | 1.08 | A | 16.14 | 1.60 | A | 68.43 | 0.40 | BC | 17.90 | 0.40 | AB | 3.25 | 0.08 | ABC | 1.56 | 0.03 | C |
| KY9 | 14.70 | 2.09 | A | 26.07 | 1.06 | A | 13.39 | 1.57 | A | 66.44 | 0.45 | A | 16.75 | 0.45 | A | 3.55 | 0.09 | BC | 1.37 | 0.03 | AB |
| KY10 | 14.88 | 2.51 | A | 27.65 | 1.27 | A | 15.38 | 1.88 | A | 68.91 | 0.56 | BC | 18.83 | 0.55 | AB | 3.43 | 0.12 | ABC | 1.46 | 0.04 | ABC |
| KY11 | 14.46 | 2.36 | A | 26.79 | 1.20 | A | 17.11 | 1.77 | A | 67.17 | 0.56 | AB | 17.42 | 0.55 | AB | 3.64 | 0.12 | C | 1.62 | 0.04 | C |
| KY12 | 12.57 | 2.19 | A | 26.34 | 1.11 | A | 13.90 | 1.64 | A | 68.67 | 0.47 | BC | 18.36 | 0.47 | AB | 3.34 | 0.10 | ABC | 1.50 | 0.04 | BC |
Note: The estimated marginal mean and standard error are presented and the compact letter display indicates significance pairwise differences within phenotypes with p BONF < 0.05. DW, dry weight.
Some of these traits exhibited geographic structuring by the origin latitude of the accession in the Southeast Panel (Figure 2; Tables S1 and S2). Both heading date and mean spike area increased with latitude (heading date: F 1,13 = 25.65, p < 0.001; mean spike area: F 1,13 = 10.32, p = 0.007), and this relationship held even in the reduced panel with the two northern accessions removed (heading date: F 1,11 = 14.67, p = 0.003; mean spike area: F 1,11 = 38.37, p < 0.001). In addition, in the reduced panel only, there was a marginal positive relationship between latitude and TKW (F 1,11 = 4.61, p = 0.054) and total spike area (F 1,11 = 3.2, p = 0.102), largely driven by low values from Florida Black. There was no relationship between latitude and spike count or seed mass in either the full or reduced panel.
FIGURE 2.

Relationship between traits and the latitude at which the accessions were developed for the Southeast Panel (left panel) and Reduced Southeast Panel (right panel). Each point represents an individual within an accession, with outlier points removed. Accession name abbreviation is given in Table 1, and full statistical analysis is given in Tables S1 and S2. TKW, 1000‐kernel weight.
Finally, there was a higher degree of within‐ than between‐accession variation for all phenotypes in all panels except for the heading date in the Southeast Panel (Table 5). Percent variation attributed to end use classification was also less than attributed to either between or within accessions in any panel (Table S3). In the Reduced Southeast Panel, with the two northern grain accessions excluded, only mean spike area had a nonzero variance component attributed to end use (5.59%, Table S3).
TABLE 5.
Variance components for phenotypes observed in the Southeast Panel, Reduced Southeast Panel, and the Kentucky Panel from the model defined by Equation (1). Variance components are described as percent (%) of total variance by trait, and the "experimental" variance component refers to variance ascribed to block, row, and column.
| Panel | Phenotype | Between accessions (%) | Within accessions (%) | Experimental (%) |
|---|---|---|---|---|
| Southeast | Heading date | 62.32 | 34.61 | 3.07 |
| Seed mass | 19.50 | 62.20 | 18.30 | |
| TKW | 5.45 | 76.84 | 17.71 | |
| Spike count | 20.27 | 64.66 | 15.07 | |
| Total spike area | 17.28 | 63.68 | 19.04 | |
| Mean spike area | 36.57 | 56.07 | 7.36 | |
| Reduced Southeast | Heading date | 52.51 | 40.28 | 7.21 |
| Seed mass | 18.85 | 62.61 | 18.54 | |
| TKW | 6.89 | 76.15 | 16.96 | |
| Spike count | 18.94 | 67.96 | 13.10 | |
| Total spike area | 20.19 | 63.93 | 15.88 | |
| Mean spike area | 40.20 | 47.02 | 12.78 | |
| Kentucky | Seed mass | 3.55 | 96.45 | NA |
| TKW | 5.51 | 94.49 | NA | |
| Spike count | 6.17 | 93.83 | NA | |
| Starch | 30.82 | 69.18 | NA | |
| Protein | 10.81 | 89.19 | NA | |
| Fiber | 25.03 | 74.97 | NA | |
| Ash | 33.69 | 66.31 | NA |
Abbreviations: NA, not available; TKW, 1000‐kernel weight.
3.2. Genetic variation
While many accessions of the Southeast Panel were not differentiated by principal component analysis (Figure 3a,b), Rymin, ND Dylan, Balbo, Florida Black, and Elbon were distinguishable. The overall pairwise FST in the Southeast Panel ranged from 0.010 to 0.088, with a mean of 0.045 (Figure S4), and the highest mean pairwise F ST in accessions Rymin, Bablo, and ND Dylan (μ > 0.060), and lowest mean pairwise FST in accessions KY1, KY4, and Wrens Abruzzi (μ < 0.032). Likewise, the Kentucky Panel had a few breeding populations differentiate by principal component analysis (Figure 4a) and had a similar range of pairwise FST to the Southeast Panel (0.001 < F ST < 0.11, μ = 0.048; Figure S5). In neither panel was there a clear separation between “grain” and “forage” types (Figures 3c,d and 4b). The mean concordance of individuals within accessions ranged from 62.7% to 87.1% (μ = 72.7%) and mean concordance of individuals between accessions ranged from 63.2% to 84.4% (μ = 70.8%) for the Southeast Panel, and was similar in the Kentucky Panel (within: 62.7%–85.6%, μ = 72.3%; between: 63.1%–77.9%, μ = 70.3%). In almost all cases, concordance was highest within accessions (Figures S6 and S7). Finally, the two sources of Aroostook demonstrated differentiation in the PC plot (Figure S8) and concordance was higher within sources (74.25% and 74.63%, respectively) than between sources (71.33%).
FIGURE 3.
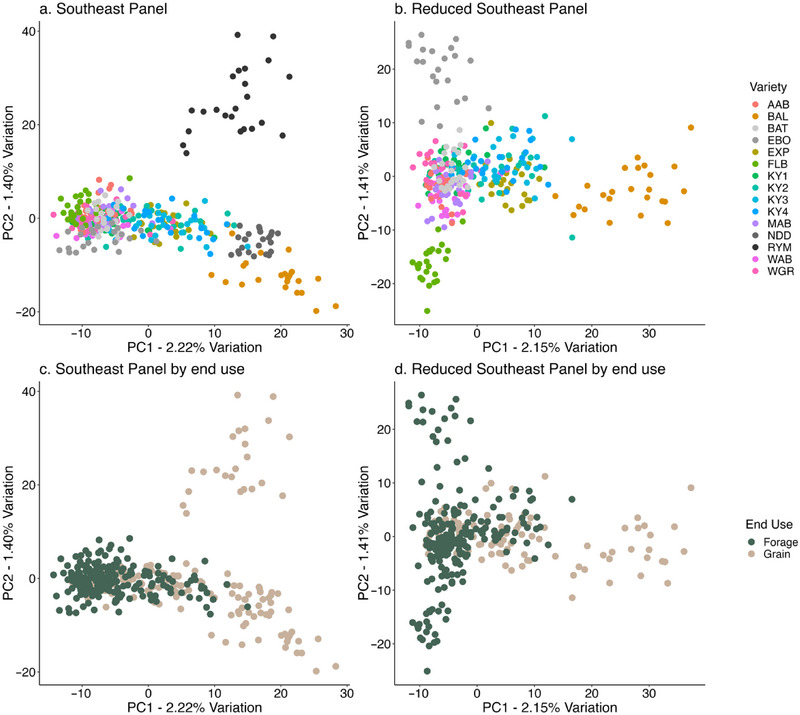
Genomic principal components for individuals within accessions in the (a) full Southeast Panel and (b) the Reduced Southeast Panel (two northern accessions removed). Accession name abbreviation is given in Table 1. Accessions colored by end use are shown for the (c) Southeast Panel (d) the Reduced Southeast Panel.
FIGURE 4.

Genomic principal components for (a) individuals within Kentucky Panel accessions and (b) accessions colored by end use. Accession description is given in Table 2.
We then sought to characterize factors that contribute to accession differentiation. There were no private alleles identified in either panel, but there were alleles that were absent in a variety (MAF = 0), but at high frequencies (MAF > 0.5) in others. In the Southeast Panel, there were nine markers that met this criterion, and it was driven by Rymin, ND Dylan, Balbo, and Elbon (Figure S9). There were 23 SNPs that met this criterion for the KY breeding lines (Figure S10), none of which overlapped with those of the Southeast Panel. Finally, mean observed heterozygosity was 0.327 and ranged from 0.279 (KY2) to 0.358 (CCA) where significant pairwise contrasts between accessions were exclusively due to low observed heterozygosity in KY2 (Table S4). While we predicted that forage accessions would have higher heterozygosity than grain accessions, there were no significant differences in observed heterozygosity between end uses in either panel (Southeast, F 1,13 = 0.32, p = 0.58; Kentucky, F 1,10 = 1.02, p = 0.34).
3.3. Genomic analysis and prediction
First, no significant loci were detected by GWAS for any trait (Figure S11). Then, genomic prediction accuracy for individual plants was assessed. In both the full and Reduced Southeast Panel, prediction accuracy was highest for heading date (r > 0.632), followed by mean spike area (r > 0.548), and prediction accuracy was highest for starch in the Kentucky Panel (r > 0.531) (Figure 5; Table S5). Prediction accuracy was the lowest for TKW in all panels (r < 0.267). While Bayes B models outperformed GBLUP for most traits, GBLUP outperformed Bayes B for TKW in the full Southeast Panel (Figure 5; Table S5).
FIGURE 5.

Genomic prediction accuracy determined by fivefold cross‐validation for all measured traits with a genomic BLUP (GBLUP) and Bayes B model. Prediction accuracy is reported for prediction models implemented separately by panel, the (a) Southeast Panel, (b) Reduced Southeast Panel, and the (c) Kentucky Panel, and reported in Table S5. Significant differences between models are indicated by the following symbols: *p < 0.05; **p < 0.01; ***p < 0.001; ****p < 0.0001. Nonsignificant comparisons do not have an indicator symbol. TKW, 1000‐kernel weight.
We then assessed genomic prediction accuracy within accessions using the other accessions as the training set. Within‐population prediction accuracy was lower than prediction accuracy assessed by cross‐validation in the entire panel. Across all accessions, mean prediction accuracy within accessions was highest (r > 0.11) for spike count, mean spike area, and heading date in the Southeast Panel; in the Reduced Southeast Panel, within‐accession prediction accuracy dropped for heading date (r < 0.067), but remained higher for spike count and mean spike area (r > 0.13) (Figure 6; Table S6). In the Kentucky Panel, there were no traits that resulted in r > 0 for all families, although a few families were well predicted (r > 0.4) for protein, fiber, and ash content (Table S7). Within panel as source of the training population (Southeast Panel or the Reduced Southeast Panel), there was only one trait with significant differences between the GBLUP and Bayes B models, but within model there were no significant differences between the training populations of the full or Reduced Southeast Panel (Figure 6). However, there were differences between accessions; for instance, across traits, mean within‐accession prediction accuracy exceeded r > 0.2 for Wrens Abruzzi and KYSC1710C1 (full and Reduced Southeast Panel) and Balbo and KYSC1707C2 (Reduced Southeast Panel only), but was r < 0 for Explorer, ND Dylan, Athens Abruzzi, Bates (full and Reduced Southeast Panel), and Mississippi Abruzzi (Reduced Southeast Panel only) (Table S6). In general, there were positive rank correlations of prediction accuracy of the Southeast Panel accessions within training population and model, but only one instance where the correlation was significant (Table S8).
FIGURE 6.

Within‐population genomic prediction accuracy for each focal population within a panel with a genomic BLUP (GBLUP) and Bayes B model. Marker effect estimates and correlations were implemented separately by panel, the Southeast Panel (n = 15 focal populations) and the Reduced Southeast Panel (n = 13 focal populations). Prediction accuracies by focal population are reported in Table S6. Comparisons within training population by model (top row) use all available populations. Comparisons of training population within model use only the n = 13 focal populations common between the Southeast and Reduced Southeast Panels. Significant differences between models are indicated by *p < 0.05. Nonsignificant comparisons do not have an indicator symbol. TKW, 1000‐kernel weight.
4. DISCUSSION
We surveyed phenotypic and genotypic variation in and among 25 accessions of cereal rye (Secale cereale) important for regional production in the Southeastern United States. Using more than 500 individuals across the accessions, we show that most phenotypic and genetic variation is within accession, with the exception of the latitudinally structured trait of heading date. Reproductive isolation afforded by extreme differences in heading date likely also drives genetic differentiation of some accessions. Yield‐related traits, such as seed mass and TKW, did not differentiate varieties, although some spike size traits and composition traits exhibited pairwise differences between varieties. We also tested the efficacy of genomic prediction for population improvement in cereal rye and found moderate to high prediction accuracies for prediction across multiple accessions, but low accuracy for prediction within accessions. We thus show that improvement of rye varieties can include selection upon variation within known population varieties, individual plant identity is critical in developing crossing blocks from populations, and selection of individual plants can be facilitated by genomic selection. In summary, this provides a framework for genomics‐enabled population improvement of rye, especially outside of major grain production regions.
We examined phenotypic variation within and between rye accessions by measuring traits at the individual plant level. Although there were some significant pairwise differences in traits between accessions, most phenotypic variation resided within accessions in both the Southeast and Kentucky Panel. The exception was heading date: in both the full and Reduced Southeast Panel, most phenotypic variation in heading date was defined between accessions. In the Kentucky Panel, there was a higher degree of inter‐accession variation for composition rather than yield component traits. A limitation of this work is that the Southeast Panel and Kentucky Panel were grown in different environments, and thus do not allow for direct comparison of accessions between panels. Nonetheless, these findings align with previous reports of Southeastern forage varieties with plot‐level measurements, where environment rather than variety accounted for the preponderance of variation in yield and quality traits (Kim et al., 2016; Webb et al., 2013). Further, even in a survey of agronomic and disease resistance traits measured in bulked samples from 100 global accessions, the authors found no significant effect of genotype on trait values (Targońska‐Karasek et al., 2020). For developmental traits specifically, they did not find significant effects of genotype or geographic origin for grain fill period and days to maturity, but heading date was not reported (Targońska‐Karasek et al., 2020). This highlights the challenges of working in open‐pollinated varieties and accessions, but our study of individual plant phenotypes shows that heading date and grain composition traits contribute to inter‐accession differentiation.
We also evaluated genetic variation within and between accessions. The two northern grain varieties, ND Dylan and Rymin, differentiated from the Southeast Panel, likely owing to more intensive selection for grain quality. In addition, Rymin has two unique and known parents (a University of Manitoba breeding line and cv. Von Lochow) (Robinson, 1973), unlike many other accessions in this study that were selected out of populations with unknown parentage. Within the Southeast Panel, Balbo and Florida Black were strongly differentiated, while various Abruzzi accessions were not. Like the Southeast Panel, two Kentucky breeding lines, KYSC1816C0 and KYSC1912C0 showed substantial differentiation from the others. Interestingly, these populations were the result of narrow crosses with few individuals as parents, compared to other populations that had more individuals from more accessions as parents. We report a mean pairwise FST between accessions in the Southeast Panel and Kentucky Panel of 0.045 and 0.048, respectively. As expected, this is lower than reported for pairwise FST between global accessions, which have ranged from 0.07 to 0.35 (Maraci et al., 2018; Parat et al., 2016). Our mean observed heterozygosity was 0.327 and aligns with previous reports of observed heterozygosity of 0.316–0.322 within accessions (Hagenblad et al., 2016), but is lower than 0.37–0.40 (Gruner et al., 2021) and 0.29–0.55 (Parat et al., 2016) reported in surveys of rye populations with more individuals. Finally, our work supports previous independent studies that the majority of genetic variance resides within accessions rather than between accessions (Hagenblad et al., 2016; Larsson et al., 2019; Monteiro et al., 2016; Parat et al., 2016). The exception to this body of work is that Adamo et al. (2021) reported more variation between rye landraces found in the Italian Alps, likely due to inbreeding. In sum, rye populations show a high degree of heterozygosity within, but low levels of differentiation between, populations.
Our goal was to couple the phenotypic and genetic evaluation to elucidate factors driving the instances of accession homogeneity and differentiation. It is well‐established that maintaining rye population varieties is challenging due to pollen flow between accessions. Even at the time of release of some varieties used in this study, researchers noted that Abruzzi rye strains from multiple locations in the eastern United States had similar performance (Morey, 1970). Similarly, a high degree of relatedness has been reported between European rye varieties, owing to shared ancestry and intermating (Bolibok‐Brągoszewska et al., 2014). At the same time, selection and genetic drift challenge variety maintenance, and one of the varieties we used, Balbo provides a historic example. At the time of registration, eight states were producing certified seed of Balbo (Qualset & Hoskinson, 1967), spanning from east of Tennessee to Illinois and Kansas (Hancock & Overton, 1960). Researchers noted later, however, that Balbo sourced from locations beyond Tennessee had a different growth habit than the Balbo maintained on an isolated Tennessee island and thus prompted plant registration and foundation stock seed development over 30 years after release (Qualset & Hoskinson, 1967). Similarly, we report here that the variety Aroostook from two different seed sources shows significant phenotypic differences in multiple traits as well as genetic differentiation. This result aligns with a survey of seven Aroostook seed lots that showed that lots varied by more than 10,000 seeds/kg (Lounsbury et al., 2022). Variation in traits like seed weight also has an environmental component (Hansen et al., 2004), but nonetheless suggests differentiation even within named, commercially sourced population varieties. It is clear that balancing the requirements of sufficient population sizes as well as reproductive isolation will continue to challenge maintenance of rye populations.
A specific factor that has been proposed to influence differentiation between rye accessions is the intersection of end use and geography (Hagenblad et al., 2016; Parat et al., 2016), even though geography broadly does not structure rye genetic diversity (Bolibok‐Brągoszewska et al., 2014; Schreiber et al., 2022; Sidhu et al., 2019). In this study, accessions were not delineated by end use categorization. This likely reflects that most rye in the United States is used for forage and cover crops, and that the breeding program at the University of Kentucky only recently included a focus on grain rather than forage breeding. Instead, the degree of reproductive isolation is likely the driving force for accession differentiation. Bolibok‐Brągoszewska et al. (2014) postulated that precise control of reproduction in a specific breeding company caused those accessions in their study to be differentiated from others more so than other factors. Likewise, Gruner et al. (2021) showed differentiation in rye populations that have been maintained with highly controlled isolation. Finally, Adamo et al. (2021) report differentiation between landraces that are separated by mountainous geography that would impede pollen flow. In our study, Florida Black and Balbo have a higher degree of differentiation, and they also have the most extreme heading dates measured. And so, due to early and late heading dates, respectively, Florida Black and Balbo likely have a degree of reproductive isolation not afforded to other accessions, especially in increases in limited area. Similarly, a survey of southeastern maize landraces also shows that flowering date contributes to isolation between varieties (Woore et al., 2024). Overall, reproductive isolation—either purposeful or due to reproductive timing—rather than other geographic factors, may be the most important contributor to rye population differentiation.
In addition to investigating variation and sources of variation in rye, we tested how rye population breeding could be improved by genomic tools. Most GWAS in rye have been conducted in inbred or testcross lines from hybrid programs, and have revealed genetic architecture for many traits, including heading date (Gaikpa et al., 2020; Siekmann et al., 2021). We did not identify any significant marker‐trait associations by GWAS using the 3803 SNPs in the accessions used in our study; this is likely due to the inability to replicate genetically distinct individuals and complex genetic basis of the traits measured. However, using 5708–6286 SNPs, Gruner et al. (2021) detected significant loci for resistance to stem rust (Puccinia graminis f. sp. secalis) in rye populations, and significant loci were likewise detected for resistance to tan spot (Pyrenophora tritici‐repentis) using 4037 SNPs in a rye germplasm panel (Sidhu et al., 2019). While increased marker density may have improved our results, these findings also underscore the challenge of mapping quantitative morphological traits in populations relative to oligogenic resistance traits. More importantly for breeding, we also tested genomic prediction accuracy. Genomic prediction is widely used in hybrid rye breeding (Miedaner et al., 2019), but has not been evaluated for population breeding. In general, prediction accuracies were moderate to high for most traits using either panel. We also found that Bayes B frequently outperformed GBLUP, but in most cases this difference was not substantial, nor was whether the training population was the full or Reduced Southeast Panel. Because of this high prediction accuracy, a promising strategy for rye population improvement would be, for instance, using genomic prediction to select individuals to intermate, as is currently used in crops like intermediate wheatgrass (Thinopyrum intermedium) (Crain et al., 2021; Zhang et al., 2016). Within‐population prediction accuracies, however, were low and varied significantly by population and trait, where only some populations exhibited acceptable within‐population prediction accuracy. Within‐population prediction accuracy was also limited by population size in the Kentucky Panel. Further work for within‐population prediction may build upon training population optimization strategies developed for within‐biparental family prediction in other grain (Juliana et al., 2022; Lian et al., 2014; Zhu et al., 2021) and fruit crops (Brault et al., 2022; da Silva et al., 2024; Roth et al., 2020). However, given that most accessions lacked meaningful genetic differentiation, rye breeders would likely have more success using genomic selection to identify individuals, regardless of accession identity, for crossing.
Overall, surveying rye genetic and phenotypic diversity, as well as identifying opportunities for genomics‐enabled rye population breeding supports regional rye breeding. In the southeastern United States, rye has continued importance as a forage crop (Bruckner & Raymer, 1990; Newell & Butler, 2013), which has likewise been the main driver of the University of Kentucky rye breeding program. Rye also serves regional needs as a cover crop, and there is growing interest in grain production for regional end uses (Brzozowski et al., 2023). Breeding rye for specific regional needs (e.g., shorter daylengths during grain fill, warmer climates) is critically important as this region is not centered in the major rye grain production areas in the northern United States and Europe where most breeding efforts are focused. Globally, rye serves unique regional niches, and in situ preservation of these rye landraces is critical for regional production systems (Adamo et al., 2021; Larsson et al., 2019; Monteiro et al., 2016). These regional landraces are also an important source of genetic variation for rye breeders (Bolibok‐Brągoszewska et al., 2014; Maraci et al., 2018), and reflect the broader role of regional landraces and varieties in mitigating the erosion of crop genetic diversity to preserve local agricultural practices (Khoury et al., 2022). In summary, we show here that regional Southeastern rye varieties, sourced almost entirely from public rye breeding programs, harbor significant variation and are amenable to further selection, including genomics‐enabled population improvement, for the benefit of regional agriculture.
AUTHOR CONTRIBUTIONS
Lauren J. Brzozowski: Conceptualization; formal analysis; funding acquisition; investigation; writing—original draft; writing—review and editing. Timothy D. Phillips: Conceptualization; funding acquisition; investigation; writing—review and editing. David A. Van Sanford: Funding acquisition; writing—review and editing.
CONFLICT OF INTEREST STATEMENT
The authors declare no conflicts of interest.
Supporting information
Supporting information
Supporting data
ACKNOWLEDGMENTS
We thank Dr. Anthony Clark for DNA tissue sampling and plant care, and undergraduates Makaslyn Dunham, Jacob Hollar, Makayla Koehler, Ignacio Sanguinetti, and Logan West for care of plants and assistance with data collection. We also thank Dr. Ann Blount sharing historic circulars about rye from the University of Florida. This work was funded in part by a Kentucky Small Grains Growers Association 2023 Research Grant to Lauren J. Brzozowski, Timothy D. Phillips, and David A. Van Sanford, a Dendrifund and Brown‐Forman grant to Lauren J. Brzozowski, Timothy D. Phillips, and David A. Van Sanford as well as Hatch funding (KY006145) and University of Kentucky start‐up funding to Lauren J. Brzozowski.
Brzozowski, L. J. , Phillips, T. D. , & Van Sanford, D. A. (2025). Diversity of cereal rye (Secale cereale) germplasm in the Southeast United States. The Plant Genome, 18, e70008. 10.1002/tpg2.70008
Assigned to Associate Editor Rajeev Gupta.
DATA AVAILABILITY STATEMENT
Phenotypic data used in this study are available as Supplementary Data S1.
REFERENCES
- Adamo, M. , Blandino, M. , Capo, L. , Ravetto Enri, S. , Fusconi, A. , Lonati, M. , & Mucciarelli, M. (2021). A ddRADseq survey of the genetic diversity of rye (Secale cereale L.) landraces from the western alps reveals the progressive reduction of the local gene pool. Plants, 10, 2415. 10.3390/plants10112415 [DOI] [PMC free article] [PubMed] [Google Scholar]
- Auinger, H.‐J. , Schönleben, M. , Lehermeier, C. , Schmidt, M. , Korzun, V. , Geiger, H. H. , Piepho, H.‐P. , Gordillo, A. , Wilde, P. , Bauer, E. , & Schön, C.‐C. (2016). Model training across multiple breeding cycles significantly improves genomic prediction accuracy in rye (Secale cereale L.). Theoretical and Applied Genetics, 129, 2043–2053. 10.1007/s00122-016-2756-5 [DOI] [PMC free article] [PubMed] [Google Scholar]
- Båga, M. , Bahrani, H. , Larsen, J. , Hackauf, B. , Graf, R. J. , Laroche, A. , & Chibbar, R. N. (2022). Association mapping of autumn‐seeded rye (Secale cereale L.) reveals genetic linkages between genes controlling winter hardiness and plant development. Scientific Reports, 12, Article 5793. 10.1038/s41598-022-09582-2 [DOI] [PMC free article] [PubMed] [Google Scholar]
- Baker, J. L. , Bates, R. P. , & Nelson, L. R. (1996). Registration of ‘Bates’ rye. Crop Science, 36, 810–810. 10.2135/cropsci1996.0011183X003600030058x [DOI] [Google Scholar]
- Barnes, B. S. , & Wells, D. G. (1960). Explorer: A new rye for Mississippi (Research Bulletin 600). Mississippi Agricultural and Forestry Experiment Station. https://scholarsjunction.msstate.edu/cgi/viewcontent.cgi?article=1400&context=mafes‐bulletins
- Barnett, R. D. , Blount, A. R. , Pfahler, P. L. , Johnson, J. W. , Buntin, G. D. , & Cunfer, B. M. (2002). Rye and triticale breeding in the south. University of Florida IFAS Extension. [Google Scholar]
- Bates, D. , Maechler, M. , Bolker, B. , & Walker, S. (2015). Fitting linear mixed‐effects models using lme4. Journal of Statistical Software, 67, 1–48. 10.18637/jss.v067.i01 [DOI] [Google Scholar]
- Bernal‐Vasquez, A.‐M. , Gordillo, A. , Schmidt, M. , & Piepho, H.‐P. (2017). Genomic prediction in early selection stages using multi‐year data in a hybrid rye breeding program. BMC Genetics, 18, Article 51. 10.1186/s12863-017-0512-8 [DOI] [PMC free article] [PubMed] [Google Scholar]
- Bolibok‐Brągoszewska, H. , Targońska, M. , Bolibok, L. , Kilian, A. , & Rakoczy‐Trojanowska, M. (2014). Genome‐wide characterization of genetic diversity and population structure in Secale . BMC Plant Biology, 14, 184. 10.1186/1471-2229-14-184 [DOI] [PMC free article] [PubMed] [Google Scholar]
- Brault, C. , Segura, V. , This, P. , Le Cunff, L. , Flutre, T. , François, P. , Pons, T. , Péros, J.‐P. , & Doligez, A. (2022). Across‐population genomic prediction in grapevine opens up promising prospects for breeding. Horticulture Research, 9, uhac041. 10.1093/hr/uhac041 [DOI] [PMC free article] [PubMed] [Google Scholar]
- Brown, A. R. (1973). Registration of Athens Abruzzi rye (reg. no. 5). Crop Science, 13, 397–398. 10.2135/cropsci1973.0011183X001300030037x [DOI] [Google Scholar]
- Bruckner, P. L. , & Raymer, P. L. (1990). Factors influencing species and cultivar choice of small grains for winter forage. Journal of Production Agriculture, 3, 349–355. 10.2134/jpa1990.0349 [DOI] [Google Scholar]
- Brzozowski, L. J. , Szuleta, E. , Phillips, T. D. , Van Sanford, D. A. , & Clark, A. J. (2023). Breeding cereal rye (Secale cereale) for quality traits. Crop Science, 63, 1964–1987. 10.1002/csc2.21022 [DOI] [Google Scholar]
- Chebotar, S. , Röder, M. S. , Korzun, V. , Saal, B. , Weber, W. E. , & Börner, A. (2003). Molecular studies on genetic integrity of open‐pollinating species rye (Secale cereale L.) after long‐term genebank maintenance. Theoretical and Applied Genetics, 107, 1469–1476. 10.1007/s00122-003-1366-1 [DOI] [PubMed] [Google Scholar]
- Covarrubias‐Pazaran, G. (2016). Genome‐Assisted prediction of quantitative traits using the R package sommer . PLoS One, 11, e0156744. 10.1371/journal.pone.0156744 [DOI] [PMC free article] [PubMed] [Google Scholar]
- Crain, J. , DeHaan, L. , & Poland, J. (2021). Genomic prediction enables rapid selection of high‐performing genets in an intermediate wheatgrass breeding program. The Plant Genome, 14, e20080. 10.1002/tpg2.20080 [DOI] [PubMed] [Google Scholar]
- da Silva, A. V. , Prado, M. , Campos, G. R. , Borges, K. L. R. , Yassue, R. M. , Husein, G. , Sposito, M. B. , Amorim, L. , Crossa, J. , & Fritsche‐Neto, R. (2024). Comparing strategies for genomic predictions in interspecific biparental populations: A case study with the Rubus genus. Euphytica, 220, Article 146. 10.1007/s10681-024-03406-2 [DOI] [Google Scholar]
- Endelman, J. B. (2011). Ridge regression and other kernels for genomic selection with R package rrBLUP. The Plant Genome, 4, 250–255. 10.3835/plantgenome2011.08.0024 [DOI] [Google Scholar]
- Esfandyari, H. , Fè, D. , Tessema, B. B. , Janss, L. L. , & Jensen, J. (2020). Effects of different strategies for exploiting genomic selection in perennial ryegrass breeding programs. G3 Genes|Genomes|Genetics, 10, 3783–3795. 10.1534/g3.120.401382 [DOI] [PMC free article] [PubMed] [Google Scholar]
- Gaikpa, D. S. , Koch, S. , Fromme, F. J. , Siekmann, D. , Würschum, T. , & Miedaner, T. (2020). Genome‐wide association mapping and genomic prediction of Fusarium head blight resistance, heading stage and plant height in winter rye (Secale cereale). Plant Breeding, 139, 508–520. 10.1111/pbr.12810 [DOI] [Google Scholar]
- Galán, R. J. , Bernal‐Vasquez, A.‐M. , Jebsen, C. , Piepho, H.‐P. , Thorwarth, P. , Steffan, P. , Gordillo, A. , & Miedaner, T. (2020). Integration of genotypic, hyperspectral, and phenotypic data to improve biomass yield prediction in hybrid rye. Theoretical and Applied Genetics, 133, 3001–3015. 10.1007/s00122-020-03651-8 [DOI] [PMC free article] [PubMed] [Google Scholar]
- Garrick, D. J. , Taylor, J. F. , & Fernando, R. L. (2009). Deregressing estimated breeding values and weighting information for genomic regression analyses. Genetics Selection Evolution, 41, Article 55. 10.1186/1297-9686-41-55 [DOI] [PMC free article] [PubMed] [Google Scholar]
- Geiger, H. H. , & Miedaner, T. (2009). Rye breeding. In Carena M. J. (Ed.), Cereals (pp. 157–181). Springer. [Google Scholar]
- Goudet, J. (2005). HIERFSTAT, a package for R to compute and test hierarchical F‐statistics. Molecular Ecology Notes, 5, 184–186. 10.1111/j.1471-8286.2004.00828.x [DOI] [Google Scholar]
- Gruner, P. , Schmitt, A.‐K. , Flath, K. , Piepho, H.‐P. , & Miedaner, T. (2021). Mapping and validating stem rust resistance genes directly in self‐incompatible genetic resources of winter rye. Theoretical and Applied Genetics, 134, 1989–2003. 10.1007/s00122-021-03800-7 [DOI] [PMC free article] [PubMed] [Google Scholar]
- Hagenblad, J. , Oliveira, H. R. , Forsberg, N. E. G. , & Leino, M. W. (2016). Geographical distribution of genetic diversity in Secale landrace and wild accessions. BMC Plant Biology, 16, Article 23. 10.1186/s12870-016-0710-y [DOI] [PMC free article] [PubMed] [Google Scholar]
- Hancock, N. I. , & Overton, J. R. (1960). Behavior and adaptation of Balbo and Tetra Petkus rye (AgResearch Bulletin no. 307). University of Tennessee Agricultural Experiment Station. [Google Scholar]
- Hansen, H. B. , Møller, B. , Andersen, S. B. , Jørgensen, J. R. , & Hansen, Å. (2004). Grain characteristics, chemical composition, and functional properties of rye (Secale cereale L.) as influenced by genotype and harvest year. Journal of Agricultural and Food Chemistry, 52, 2282–2291. 10.1021/jf0307191 [DOI] [PubMed] [Google Scholar]
- Hawliczek, A. , Borzęcka, E. , Tofil, K. , Alachiotis, N. , Bolibok, L. , Gawroński, P. , Siekmann, D. , Hackauf, B. , Dušinský, R. , Švec, M. , & Bolibok‐Brągoszewska, H. (2023). Selective sweeps identification in distinct groups of cultivated rye (Secale cereale L.) germplasm provides potential candidate genes for crop improvement. BMC Plant Biology, 23, Article 323. 10.1186/s12870-023-04337-1 [DOI] [PMC free article] [PubMed] [Google Scholar]
- Hothorn, T. , Bretz, F. , & Westfall, P. (2008). Simultaneous inference in general parametric models. Biometrical Journal, 50, 346–363. 10.1002/bimj.200810425 [DOI] [PubMed] [Google Scholar]
- Jombart, T. (2008). adegenet : A R package for the multivariate analysis of genetic markers. Bioinformatics, 24, 1403–1405. 10.1093/bioinformatics/btn129 [DOI] [PubMed] [Google Scholar]
- Juliana, P. , He, X. , Poland, J. , Roy, K. K. , Malaker, P. K. , Mishra, V. K. , Chand, R. , Shrestha, S. , Kumar, U. , Roy, C. , Gahtyari, N. C. , Joshi, A. K. , Singh, R. P. , & Singh, P. K. (2022). Genomic selection for spot blotch in bread wheat breeding panels, full‐sibs and half‐sibs and index‐based selection for spot blotch, heading and plant height. Theoretical and Applied Genetics, 135, 1965–1983. 10.1007/s00122-022-04087-y [DOI] [PMC free article] [PubMed] [Google Scholar]
- Kassambara, A. (2020). ggpubr: “ggplot2” Based Publication Ready Plots . https://CRAN.R‐project.org/package=ggpubr
- Khoury, C. K. , Brush, S. , Costich, D. E. , Curry, H. A. , Haan, S. , Engels, J. M. M. , Guarino, L. , Hoban, S. , Mercer, K. L. , Miller, A. J. , Nabhan, G. P. , Perales, H. R. , Richards, C. , Riggins, C. , & Thormann, I. (2022). Crop genetic erosion: Understanding and responding to loss of crop diversity. New Phytologist, 233, 84–118. 10.1111/nph.17733 [DOI] [PubMed] [Google Scholar]
- Kim, K.‐S. , Anderson, J. D. , Newell, M. A. , & Butler, T. J. (2016). Variations of forage yield and nutritive value in winter rye germplasm. Crop Science, 56, 1018–1024. 10.2135/cropsci2015.08.0487 [DOI] [Google Scholar]
- Korzun, V. , Ponomareva, M. L. , & Sorrells, M. E. (2021). Economic and academic importance of rye. In Rabanus‐Wallace M. T. & Stein N. (Eds.), The rye genome (pp. 1–12). Springer International Publishing. [Google Scholar]
- Kuznetsova, A. , Brockhoff, P. B. , & Christensen, R. H. B. (2017). lmerTest package: Tests in linear mixed effects models. Journal of Statistical Software, 82, 1–26. 10.18637/jss.v082.i13 [DOI] [Google Scholar]
- Laidig, F. , Piepho, H.‐P. , Rentel, D. , Drobek, T. , Meyer, U. , & Huesken, A. (2017). Breeding progress, variation, and correlation of grain and quality traits in winter rye hybrid and population varieties and national on‐farm progress in Germany over 26 years. Theoretical and Applied Genetics, 130, 981–998. 10.1007/s00122-017-2865-9 [DOI] [PMC free article] [PubMed] [Google Scholar]
- Larsson, P. , Oliveira, H. R. , Lundström, M. , Hagenblad, J. , Lagerås, P. , & Leino, M. W. (2019). Population genetic structure in Fennoscandian landrace rye (Secale cereale L.) spanning 350 years. Genetic Resources and Crop Evolution, 66, 1059–1071. 10.1007/s10722-019-00770-0 [DOI] [Google Scholar]
- Length, R. V. (2023). emmeans: Estimated Marginal Means, aka Least‐Squares Means . https://CRAN.R‐project.org/package=emmeans
- Li, G. , Wang, L. , Yang, J. , He, H. , Jin, H. , Li, X. , Ren, T. , Ren, Z. , Li, F. , Han, X. , Zhao, X. , Dong, L. , Li, Y. , Song, Z. , Yan, Z. , Zheng, N. , Shi, C. , Wang, Z. , Yang, S. , … Wang, D. (2021). A high‐quality genome assembly highlights rye genomic characteristics and agronomically important genes. Nature Genetics, 53, 574–584. 10.1038/s41588-021-00808-z [DOI] [PMC free article] [PubMed] [Google Scholar]
- Lian, L. , Jacobson, A. , Zhong, S. , & Bernardo, R. (2014). Genomewide prediction accuracy within 969 maize biparental populations. Crop Science, 54, 1514–1522. 10.2135/cropsci2013.12.0856 [DOI] [Google Scholar]
- Lin, Z. , Cogan, N. O. I. , Pembleton, L. W. , Spangenberg, G. C. , Forster, J. W. , Hayes, B. J. , & Daetwyler, H. D. (2016). Genetic gain and inbreeding from genomic selection in a simulated commercial breeding program for perennial ryegrass. The Plant Genome, 9, plantgenome2015.06.0046. 10.3835/plantgenome2015.06.0046 [DOI] [PubMed] [Google Scholar]
- Lounsbury, N. P. , Warren, N. D. , Hobbie, J. , Darby, H. , Ryan, M. R. , Mortensen, D. A. , & Smith, R. G. (2022). Seed size variability has implications for achieving cover cropping goals. Agricultural & Environmental Letters, 7, e20080. 10.1002/ael2.20080 [DOI] [Google Scholar]
- Madsen, M. D. , Kristensen, P. S. , Mahmood, K. , Thach, T. , Mohlfeld, M. , Orabi, J. , Sarup, P. , Jahoor, A. , Hovmøller, M. S. , Rodriguez‐Algaba, J. , & Jensen, J. (2024). Scald resistance in hybrid rye (Secale cereale): Genomic prediction and GWAS. Frontiers in Plant Science, 15, 1306591. [DOI] [PMC free article] [PubMed] [Google Scholar]
- Maraci, Ö. , Özkan, H. , & Bilgin, R. (2018). Phylogeny and genetic structure in the genus Secale . PLoS One, 13, e0200825. 10.1371/journal.pone.0200825 [DOI] [PMC free article] [PubMed] [Google Scholar]
- Miedaner, T. , Korzun, V. , & Bauer, E. (2019). Genomics‐based hybrid rye breeding. In T. Miedaner & V. Korzun (Eds.), Applications of genetic and genomic research in cereals (pp. 329–348). Elsevier. [Google Scholar]
- Miedaner, T. , & Laidig, F. (2019). Hybrid breeding in rye (Secale cereale L.). In Al‐Khayri J. M., Jain S. M., & Johnson D. V. (Eds.), Advances in plant breeding strategies: Cereals (pp. 343–372). Springer International Publishing. [Google Scholar]
- Monteiro, F. , Vidigal, P. , Barros, A. B. , Monteiro, A. , Oliveira, H. R. , & Viegas, W. (2016). Genetic distinctiveness of rye in situ accessions from Portugal unveils a new hotspot of unexplored genetic resources. Frontiers in Plant Science, 7, 1334. 10.3389/fpls.2016.01334 [DOI] [PMC free article] [PubMed] [Google Scholar]
- Morey, D. D. (1970). Registration of Wrens Abruzzi rye (reg. no. 3). Crop Science, 10, 209–210. 10.2135/cropsci1970.0011183X001000020034x [DOI] [Google Scholar]
- NDSU Research Foundation . (2020). ND Dylan winter rye (RFP‐282) (PVPO: 201800167). https://apps.ams.usda.gov/CMS/AdobeImages/201800167.pdf
- Newell, M. A. , & Butler, T. J. (2013). Forage rye improvement in the southern United States: A review. Crop Science, 53, 38–47. 10.2135/cropsci2012.05.0319 [DOI] [Google Scholar]
- Parat, F. , Schwertfirm, G. , Rudolph, U. , Miedaner, T. , Korzun, V. , Bauer, E. , Schön, C.‐C. , & Tellier, A. (2016). Geography and end use drive the diversification of worldwide winter rye populations. Molecular Ecology, 25, 500–514. 10.1111/mec.13495 [DOI] [PubMed] [Google Scholar]
- Pennington Grain & Seed, Inc . (1978). Wintergrazer‐70 (PVPO 72010). https://apps.ams.usda.gov/CMS/AdobeImages/007200010.pdf
- Pérez, P. , & de los Campos, G. (2014). Genome‐wide regression and prediction with the BGLR statistical package. Genetics, 198, 483–495. 10.1534/genetics.114.164442 [DOI] [PMC free article] [PubMed] [Google Scholar]
- Pfahler, P. L. , Barnett, R. D. , & Luke, H. H. (1985). Florida 401 rye: An early forage type adapted to minimum tillage, multiple cropping systems. University of Florida Agriculture Experiment Stations. [Google Scholar]
- Qualset, C. O. , & Hoskinson, P. E. (1967). Registration of Balbo rye (reg. no. 2). Crop Science, 7, 81–81. 10.2135/cropsci1967.0011183X000700010035x [DOI] [Google Scholar]
- R Core Team . (2016). R: A language and environment for statistical computing . R Foundation for Statistical Computing. [Google Scholar]
- Rabanus‐Wallace, M. T. , Hackauf, B. , Mascher, M. , Lux, T. , Wicker, T. , Gundlach, H. , Baez, M. , Houben, A. , Mayer, K. F. X. , Guo, L. , Poland, J. , Pozniak, C. J. , Walkowiak, S. , Melonek, J. , Praz, C. R. , Schreiber, M. , Budak, H. , Heuberger, M. , Steuernagel, B. , … Stein, N. (2021). Chromosome‐scale genome assembly provides insights into rye biology, evolution and agronomic potential. Nature Genetics, 53, 564–573. 10.1038/s41588-021-00807-0 [DOI] [PMC free article] [PubMed] [Google Scholar]
- Rakoczy‐Trojanowska, M. , Bolibok‐Brągoszewska, H. , Myśków, B. , Dzięgielewska, M. , Stojałowski, S. , Grądzielewska, A. , Boczkowska, M. , & Moskal, K. (2021). Genetics and genomics of stress tolerance. In Rabanus‐Wallace M. T. & Stein N. (Eds.), The rye genome (pp. 213–251). Springer International Publishing. [Google Scholar]
- Robinson, R. G. (1973). Registration of Rymin rye (reg. no. 6). Crop Science, 13, 775. 10.2135/cropsci1973.0011183X001300060075x [DOI] [Google Scholar]
- Roth, M. , Muranty, H. , Di Guardo, M. , Guerra, W. , Patocchi, A. , & Costa, F. (2020). Genomic prediction of fruit texture and training population optimization towards the application of genomic selection in apple. Horticulture Research, 7, 148. 10.1038/s41438-020-00370-5 [DOI] [PMC free article] [PubMed] [Google Scholar]
- Schneider, C. A. , Rasband, W. S. , & Eliceiri, K. W. (2012). NIH Image to ImageJ: 25 years of image analysis. Nature Methods, 9, 671–675. 10.1038/nmeth.2089 [DOI] [PMC free article] [PubMed] [Google Scholar]
- Schreiber, M. , Gao, Y. , Koch, N. , Fuchs, J. , Heckmann, S. , Himmelbach, A. , Börner, A. , Özkan, H. , Maurer, A. , Stein, N. , Mascher, M. , & Dreissig, S. (2022). Recombination landscape divergence between populations is marked by larger low‐recombining regions in domesticated rye. Molecular Biology and Evolution, 39, msac131. 10.1093/molbev/msac131 [DOI] [PMC free article] [PubMed] [Google Scholar]
- Schreiber, M. , Himmelbach, A. , Börner, A. , & Mascher, M. (2019). Genetic diversity and relationship between domesticated rye and its wild relatives as revealed through genotyping‐by‐sequencing. Evolutionary Applications, 12, 66–77. 10.1111/eva.12624 [DOI] [PMC free article] [PubMed] [Google Scholar]
- Schuetzenmeister, A. , & Dufey, F. (2022). VCA: Variance component analysis (Version 1.4.5) [Computer software]. CRAN. https://CRAN.R‐project.org/package=VCA [Google Scholar]
- Schwantes, I. A. , do Amaral, A. T. , Jr., de Almeida Filho, J. E. , Vivas, M. , Silva Cabral, P. D. , Gonçalves Guimarães, A. , de Lima e Silva, F. H. , Araújo Diniz Santos, P. H. , Gonzaga Pereira, M. , Pio Viana, A. , Ferreira Pena, G. , & Alves Ferreira, F. R. (2020). Genomic selection helps accelerate popcorn population breeding. Crop Science, 60, 1373–1385. 10.1002/csc2.20112 [DOI] [Google Scholar]
- Sidhu, J. S. , Ramakrishnan, S. M. , Ali, S. , Bernardo, A. , Bai, G. , Abdullah, S. , Ayana, G. , & Sehgal, S. K. (2019). Assessing the genetic diversity and characterizing genomic regions conferring Tan Spot resistance in cultivated rye. PLoS One, 14, e0214519. 10.1371/journal.pone.0214519 [DOI] [PMC free article] [PubMed] [Google Scholar]
- Siekmann, D. , Jansen, G. , Zaar, A. , Kilian, A. , Fromme, F. J. , & Hackauf, B. (2021). A genome‐wide association study pinpoints quantitative trait genes for plant height, heading date, grain quality, and yield in rye (Secale cereale L.). Frontiers in Plant Science, 12, 23. 10.3389/fpls.2021.718081 [DOI] [PMC free article] [PubMed] [Google Scholar]
- Targońska‐Karasek, M. , Boczkowska, M. , Podyma, W. , Pasnik, M. , Niedzielski, M. , Rucinska, A. , Nowak‐Zyczynska, Z. , & Rakoczy‐Trojanowska, M. (2020). Investigation of obsolete diversity of rye (Secale cereale L.) using multiplexed SSR fingerprinting and evaluation of agronomic traits. Journal of Applied Genetics, 61, 513–529. 10.1007/s13353-020-00579-z [DOI] [PMC free article] [PubMed] [Google Scholar]
- USDA‐Natural Resources Conservation Service . (2015). Release brochure for Aroostook cereal rye (Secale cereale L.) . USDA, Big Flats Plant Materials Center. [Google Scholar]
- van Rossum, B.‐J. , & Kruijer, W. (2022). Package ‘statgenGWAS’ (Version 1) [Computer software]. CRAN. https://CRAN.R‐project.org/package=statgenGWAS [Google Scholar]
- Vendelbo, N. M. , Mahmood, K. , Sarup, P. , Kristensen, P. S. , Orabi, J. , & Jahoor, A. (2021). Discovery of a novel powdery mildew (Blumeria graminis) resistance locus in rye (Secale cereale L.). Scientific Reports, 11, Article 23057. 10.1038/s41598-021-02488-5 [DOI] [PMC free article] [PubMed] [Google Scholar]
- Webb, S. L. , Mosali, J. , Baker, J. L. , & Newell, M. A. (2013). Estimates of variance components and repeatability for total forage yield in rye: Implications for breeding. Plant Breeding, 132, 580–585. 10.1111/pbr.12115 [DOI] [Google Scholar]
- Wickham, H. (2016). Ggplot2: Elegant graphics for data analysis. Springer‐Verlag. [Google Scholar]
- Woore, M. S. , Flint‐Garcia, S. A. , & Holland, J. B. (2024). Phenotypic characterization of Southeastern United States open‐pollinated maize landraces. Crop Science, 64, 772–787. 10.1002/csc2.21198 [DOI] [Google Scholar]
- Yabe, S. , Ohsawa, R. , & Iwata, H. (2013). Potential of genomic selection for mass selection breeding in annual allogamous crops. Crop Science, 53, 95–105. 10.2135/cropsci2012.03.0167 [DOI] [Google Scholar]
- Zhang, X. , Sallam, A. , Gao, L. , Kantarski, T. , Poland, J. , DeHaan, L. R. , Wyse, D. L. , & Anderson, J. A. (2016). Establishment and optimization of genomic selection to accelerate the domestication and improvement of intermediate wheatgrass. The Plant Genome, 9, plantgenome2015.07.0059. 10.3835/plantgenome2015.07.0059 [DOI] [PubMed] [Google Scholar]
- Zhu, X. , Leiser, W. L. , Hahn, V. , & Würschum, T. (2021). Training set design in genomic prediction with multiple biparental families. The Plant Genome, 14(3), e20124. 10.1002/tpg2.20124 [DOI] [PubMed] [Google Scholar]
Associated Data
This section collects any data citations, data availability statements, or supplementary materials included in this article.
Supplementary Materials
Supporting information
Supporting data
Data Availability Statement
Phenotypic data used in this study are available as Supplementary Data S1.