

Abstract
A safe and efficient lithium‐ion battery requires including an additive in the electrolyte. Among the additives used, vinylene carbonate (VC) is particularly interesting, because it leads to the formation of a stable and protective solid electrolyte interphase (SEI) on the negative electrode. However, the reduction behavior of VC, resulting in polymer formation, is complex, and many questions remain as to the corresponding reaction mechanisms. In particular, in conventional battery studies, it is not possible to observe the transient species formed during reduction. Using picosecond pulsed radiolysis coupled with theoretical chemistry calculations, we showed that, once formed, the anion radical VC⋅− can undergo ring opening in a few nanoseconds or generate VC2⋅−. Within 100 ns, each of these anions then leads to the formation of VCC3H2O3⋅−. This latter species starts oligomerizing. Eventually, a polymer is formed. Although it mainly consists of poly(VC) units, other chemical functions, such as alkyl groups, are also present, which highlights the role played by water, even in trace amounts. Lastly, we propose a scheme of the reaction mechanisms involved in VC reduction, leading to its polymerization. Clearly, the polymer formed from VC at the SEI of lithium‐ion batteries has a complex structure.
Keywords: Lithium-ion batteries, Radiolysis, Reaction mechanisms, Reactive intermediates, Vinylene carbonate
Using picosecond pulsed radiolysis coupled with theoretical chemistry calculations, we showed that, once formed, VC⋅− can undergo ring opening in a few nanoseconds or generate (VC)2⋅−. Within 100 ns, each of these anions then leads to the formation of (VC)(C3H2O3⋅−). Eventually, a polymer with a complex structure is produced.

Introduction
Lithium‐ion batteries are very attractive energy storage systems, due in particular to their high energy density. [1] They are therefore used in a wide range of applications, from portable electronics to electric vehicles. [2] To optimize the use of Li‐ion batteries, it is important to increase their service life, as well as their safety.
During the first charges of a battery, a solid electrolyte interphase (SEI) forms on the negative electrode material due to reduction reactions.[ 3 , 4 , 5 ] The role of SEI is of great importance, because it must prevent any further decomposition of the electrolyte, while guaranteeing the transport of lithium ions from or to the electrolyte. Obviously, the characteristics of the SEI (chemical composition, thickness, structure, etc.) determine its properties. [6] Therefore, optimizing SEI properties, and thus long‐term battery operation, requires a detailed understanding of the species present in the SEI, and of how it is formed.
To enhance the properties of the SEI, additives are added to the electrolyte composition.[ 7 , 8 ] In general, an electrolyte is composed of a mixture of cyclic and non‐cyclic carbonate solvents and a lithium salt. The role of an additive is to reduce preferentially to carbonate solvents during the first charge cycle, leading to an SEI with better properties. Their role is also to decrease gas production in electrolytes subject to charge and discharge cycles. [9]
Among the various additives commonly used, vinylene carbonate (VC, whose chemical formula is shown in Figure 1) is particularly advantageous: it is known to increase stability, reduce capacitance loss and lower the resistivity of electrochemical systems.[ 10 , 11 ] Furthermore, the chemical composition and morphology of SEI formed from electrolytes with or without VC are completely different. Unlike other carbonates, VC can undergo polymerization, due to the double bond in its chemical formula. [12] The formation of this polymer, which is often referred to as poly(VC), gives the SEI–and therefore the electrochemical system–particularly useful properties, enabling it to work better at higher temperatures. Moreover, it forms cohesive and flexible layers, thus reducing mechanical stresses.[ 10 , 13 ]
Figure 1.

(a) Evolution of the spectra recorded in the case of pure vinylene carbonate (VC) during the first 3 ns after the electron pulse. The color bar indicates the times, expressed in ps, at which the spectra were recorded. The dose is 100 Gy per pulse, with 1 Gy = 1 J.kg‐1. (b) Decomposition of the spectra, showing the formation of two species, A (black squares) and B (red circles). The small shoulders in the spectra are artefacts caused by the decomposition of a weak signal. (c) Kinetics of these two species. Black squares (respectively red circles) correspond to species whose absorption spectrum is essentially significant below (respectively above) 500 nm.
Despite the extreme importance of the formation of this polymer‐containing layer, our understanding of the mechanisms leading to its formation remains incomplete. Although some studies have focused on the reduction products of VC, to better understand how it reacts, its overall behavior is difficult to describe due to the numerous chemical species present.[ 14 , 15 , 16 ] Moreover, in battery studies, it is not possible to observe the various transient species produced under the effect of reduction processes, because their lifetimes are very short. Theoretical chemistry studies have predicted the formation of an anion radical during VC reduction, and then the opening of the ring, [17] but these species have never been observed. In addition, during the reduction reactions, other species may possibly form. Finally, the identification of transient species, coupled with the characterization of the stable products formed, may provide a better understanding of the effect of VC when added to an electrolyte.
Radiation chemistry offers the means to identify the transient species produced during VC reduction. Not only can it simulate the effects of ageing on battery electrolytes in a very short lapse of time,[ 18 , 19 ] but it also allows for time‐resolved studies, so that the various species of interest formed during oxidation or reduction processes can be identified on the basis of their UV‐visible spectra, and on timescales ranging from picoseconds to micro‐milliseconds.[ 19 , 20 , 21 , 22 ] This time‐resolved approach, coupled with the characterization of the products formed over long timescales, can identify the species created over a very wide range of timescales, and gain a better understanding of the mechanisms at work in VC reduction processes. Moreover, irradiation of nanoparticles (carbon, silicon)/electrolyte suspensions led to the formation of SEI on the surface of these nanoparticles. This artificial SEI, formed by radiolysis, has a composition very similar to that found in batteries.[ 23 , 24 ] Indeed, the degradation products formed in the two techniques are similar and lead therefore to the deposition of the same species on the surface of the active material. More recently, radiolysis was shown to mimic calendar ageing phenomena, but in a very accelerated way, leading in particular to similar SEI compositions. [25] In all these studies, we showed the similarity between the SEI formed by radiolysis and that formed in the battery studies. These previous works illustrate the value of radiation chemistry in gaining a better understanding of the phenomena leading to the formation of SEI, as well as its composition.
Thus, the aim of this work was to: i) detect the transient species formed in VC, using pulsed radiolysis experiments carried out in the ps‐μs time range; ii) identify the nature of the stable products formed, whether gaseous or polymeric; and iii) propose reaction mechanisms for ageing VC under ionizing radiation. These findings offer valuable insights into the nature of the products formed at the SEI on negative electrode materials, when the electrolyte contains VC, and in particular, into the nature of the polymer formed from VC in the SEI.
Results and Discussion
Identification of the First Species Created During Ionizing Radiation/Matter Interaction Using Picosecond Pulsed Radiolysis Coupled with Quantum Chemistry Calculations
Picosecond pulsed radiolysis experiments were initially carried out on VC to help understand the nature of the species formed shortly after the ionizing radiation/matter interaction. These species are also formed in batteries via electrochemistry, but cannot be identified directly.[ 19 , 20 , 21 , 26 ] In pulse radiolysis, a short pulse (7 ps in the present case) of high‐energy electrons delivered to a flow‐cell containing VC induces the formation of radicals that are detected here by UV‐visible spectroscopy. Transient spectra are thus recorded as a function of time, with time 0 corresponding to the irradiation of the flow‐cell with the short pulse of electrons. Our aim is then to identify the species revealed thanks to their spectra. In our experiments, transient spectra were recorded as a function of time, in the ps‐μs time range. The UV‐visible spectrum of VC (Figure S1) shows that it is possible to detect species created when the solution does not absorb too much, i. e. at wavelengths above 250–260 nm.
The spectra recorded in the case of pure VC during the first 3 ns after irradiation are shown in Figure 1a. The data obtained correspond to a matrix for which each row corresponds to a full spectrum recorded at a certain time and each column to the variation of the absorbance at a particular wavelength as a function of the time. This matrix can be seen as a sum of the contributions of the spectra of different components, related to the different absorbing species, weighted by their respective time‐dependent concentration. [27] By using the SK‐Ana program, [28] we can decompose the transient spectra and identify the number of species present in the signal (absorption spectra), as well as their respective kinetic evolution. The spectra obtained comprised two components: one absorbing mainly in the 345–450 nm wavelength range (A species), and the other in the 500–600 nm wavelength range (B species, see also Figure 1b). The decomposition of the spectro‐kinetic data is shown in Figure 1b and c. This decomposition highlights the presence of two species characterized by their absorption spectra (Figure 1b) and different decay kinetics (Figure 1c).
During irradiation, the primary effects of ionizing radiation are to ionize and excite the molecule:
 |
(1) |
Due to its high dielectric constant (126 at 298 K), [29] the excited states of VC, resulting from recombination between the cation radical and the electron ejected during ionization as well as from the direct effect from ionizing radiation, are neglected hereafter. Once formed, the pre‐solvated electron solvates:
 |
(2) |
In cyclic carbonates, electrons and pre‐solvated electrons are known to attach to carbonates, leading to the formation of anion radicals.[ 21 , 22 , 30 ] Another reaction (3) is therefore possible in the case of VC (where represents the pre‐solvated or solvated electron) because VC reduction is thermodynamically favorable, with an electron affinity value calculated to be equal to 45.4 kcal.mol−1. [17]
 |
(3) |
Consequently, the bands observed on the spectra in Figure 1a, corresponding to the very first species created after the ionizing radiation/matter interaction, may be due to the cation radical (VC + ⋅), the solvated electron or the anion radical (VC⋅−). To assign these bands, different solutes were added to pure VC. We first studied a mixture of VC and perchloric acid (HClO4, 1 mol.L−1), because perchlorate ions do not hinder the spectro‐kinetic analysis of transient absorption data and they do not react with radicals, thereby allowing the straightforward study of only the effect of adding H+ ions. The kinetics recorded in the two solutions (without and with HClO4) at different wavelengths are shown in Figure S2. The results in Figure S2 clearly show that both species detected in Figure 1 react with H+. Therefore, neither of these species can be attributed to the cation radical, but rather to the solvated electron and/or anion radical(s).
To determine whether the solvated electron is one of these species, acetone, known as an electron scavenger, was added to VC at a concentration of 1 mol.L−1 (Figure S3). The results clearly show that acetone had no effect on the measured signals (Figure S3). The solvated electron was therefore not detected at this timescale. Consequently, the two species observed in Figure 1(A and B) correspond to anion radicals. Unlike other cyclic carbonates (ethylene carbonate (EC), [30] propylene carbonate (PC) [21] and fluoroethylene carbonate, FEC [22] ) for which solvated electron attachment to the carbonate can be followed on the picosecond‐nanosecond timescale, the solvated electron was not detected in the case of VC, at the available time resolution. Therefore, the attachment of the solvated electron to the VC molecule is ultrafast and cannot be observed here.
To better understand the presence of these two anion radicals, we carried out theoretical chemistry calculations to investigate the structural and spectral properties of various VC‐based species: we calculated UV‐visible spectra and compared them with experimental data to confirm the existence of different intermediates. Figure S4 shows the predicted spectra of the and the species that can be assigned to the and B radical anions respectively. We carried out a detailed analysis of the electronic excitation process using hole‐electron analysis implemented in the Multiwfn program [31] along with the calculation of D and Sr indices (see Table S1; see also the Materials and Methods section for more details). The broad band in the wavelength region 340–450 nm was attributed to the monomeric form . This species corresponds mainly to a π‐π* local excitation as evidenced by the hole‐electron diagrams (Figure 2a) and the small D‐index. The absorption band at 524 nm (Figure S4) is fully consistent with the absorption spectrum of . It is mainly described by a local excitation (low D‐index value) as shown in the hole‐electron diagram (Figure 2b) with a π‐π* character. The Sr ‐index is quite high, up to 0.83, mainly due to the highly localized excitation of the carbon atoms on the VC ring.
Figure 2.

Real space representations of hole and electron distributions of four vinylene carbonate (VC) species: (a) for the 341 nm excitation in ; (b) for the 524 nm excitation in ; (c) for the 550 nm excitation in and (d) for the 356 nm excitation in . Blue and green regions denote the hole and electron distributions (a) isovalue 0.005 and isovalue 0.0015, respectively; (b) isovalue 0.003; (c) isovalue 0.003 and (d) isovalue 0.003 and isovalue 0.0008, respectively.
Radiolysis experiments were also carried out over longer times. The evolution of spectra as a function of time, up to 18 ns, in the 300–800 nm wavelength range is shown in Figure 3. In the 500–800 nm spectral range, a species, named C, absorbing weakly around 500–550 nm, was observed (Figure 3a and b). This is not , because C has different decay kinetics (Figure S5): on longer timescales (150 ns, see Figure 4), has disappeared, unlike C.
Figure 3.

In the wavelength range of 500–775 nm (top): (a) evolution of spectra recorded in pure VC during the first 18 ns after the electron pulse. The color bar indicates the times, expressed in ns, at which the spectra were recorded. (b) Decomposition of the spectra as a function of time, highlighting the formation of a species called C (green downward triangles); (c) corresponding kinetics at 550 nm over the first 18 ns. In the 300–550 nm wavelength range (bottom): (d) evolution of spectra recorded in pure vinylene carbonate (VC) during the first 18 ns after the electron pulse. The color bar indicates the times, expressed in ns, at which the spectra were recorded. (e) Decomposition of the spectra as a function of time, highlighting the formation of two species, called B and D. (f) Corresponding kinetics at 500 nm for B and at 356 nm for D over the first 18 ns. Blue upright triangles (respectively red circles) correspond to species with significant absorption spectra at wavelengths below (respectively above) 500 nm. The dose is 103 Gy (1 Gy=1 J.kg−1) per pulse.
Figure 4.

(a) Evolution of spectra recorded in pure vinylene carbonate (VC) during the first 150 ns after the electron pulse. The color bar indicates the times, expressed in ns, at which the spectra were recorded. Decomposition of the spectro‐kinetic data shows the presence of two species: spectra of species D (b, blue triangles) and C (c, green downward triangles). (d) Kinetics of species D (blue upright triangles) and C (green downward triangles). The dose is 100 Gy (1 Gy=1 J.kg−1) per pulse.
In the 300–5 nm range, decomposition of the spectro‐kinetic data reveals the presence of two species. The first, called D, had two maxima at 360 and 430 nm (Figure 3d and e), and its absorbance increased in this time range (Figure 3f). The other species absorbed mainly around 500–550 nm (Figure 3e), and its absorbance decayed to zero (Figure 3f) within 15 ns. The decay and spectrum of this latter intermediate were the same as those described in Figure 1 for . Therefore, this species corresponds to . Furthermore, it is clear that the spectrum measured for species C, as well as the evolution of its absorbance as a function of time, differs from that of , even though it absorbs in the same spectral range (see Figures 1 and 3). This is thus a different species . Furthermore, the decay of cannot explain the formation of D, since it disappears within 15 ns, whereas species D is formed in 100 ns (Figure 4). Nevertheless, the decay of may partly explain the formation of D.
In the 150 ns time range, only C and D were observed (Figure 4). Although the signal from C was weak, spectral decomposition shows that there was indeed a species absorbing between 500 and 600 nm. Interestingly, absorbance of these two intermediates over time shows that the disappearance of C correlated with the formation of D (Figure 4d). Figure 4b shows that D had a structured spectrum with two maxima, one at 356 nm and the other around 440 nm.
On a longer timescale (5 μs, Figure S6), spectral decomposition shows that only the D species remained (Figure S6b), disappearing after a few μs (Figure S6a).
To further clarify the nature of species D, experiments were carried out by adding 5 mM silver perchlorate (AgClO4) in VC (Figure S7). The results proved that D is negatively charged (Figure S7) and is a reducing species. This characterization also suggests that its precursor, C, is also negatively charged. Thus, all intermediates detected by pulsed radiolysis were negatively charged. Moreover, the rapid formation of the negatively charged C (within a few ns, Figure 3) suggests that it readily forms from VC anion radicals. Ring‐opening may explain this phenomenon. [32] For example, in the case of FEC, it has been reported that ring opening of the anion radical is an exergonic process. [22] Consequently, C may correspond to the anion radical formed after the VC ring opening. Reduced VC is known to undergo ring opening via a homolytic C(carbonyl atom)‐O cleavage, leading to the formation of O−C⋅OCH−CHO−, [33] which will be written hereafter as ⋅−. Note that small molecules such as CO or CO2 may be released during cycle opening. [22] Further, ⋅− leads to the formation of another intermediate with a much higher extinction coefficient around 300–400 nm than that of ⋅− around 500 nm. We hypothesize that D corresponds to (VC) ⋅−). The species (VC) ⋅−) disappeared following second‐order kinetics (Figure 5d). Two types of reaction are possible: dimerization or disproportionation. The results presented below suggest that a dimerization reaction is more likely to occur.
Figure 5.

(a) MALDI‐TOF mass spectra of samples irradiated with gamma radiation at 440 Gy (blue) and 590 Gy (red) for m/z values ranging from 1000 to 5000; (b) corresponds to an enlargement of the mass spectrum of the sample irradiated at 590 Gy, with m/z values ranging from 1450 to 1510. Measurements were carried out in positive mode.
We carried out quantum chemical calculations to confirm the nature of the C and D species. The hypothesis of identifying these intermediates as and respectively was confirmed by comparing the experimental and calculated spectra (Figure S8). In the case of the intermediate the 356 nm absorption band corresponds to an excitation from a π orbital to a more diffuse identified as a 3 s‐Rydberg orbital. These orbitals are localized in the open VC part of (VC) ⋅−). Although there is a certain degree of localization (the value of D‐index is not very high, see Table S1), the low value of Sr and the hole‐electron diagram suggest a non‐negligible charge transfer excitation (Figure 2d and Table S1). Regarding the electronic spectra of the absorption band at 550 nm results from charge transfer as shown in the hole‐electron diagram and confirmed by the high value of D‐index and the low value of Sr (Figure 2c and Table S1). The reactions observed by pulse radiolysis are summarized in Scheme 1. Typically, ring opening from to takes place within a few nanoseconds.
Scheme 1.

Reactions observed by pulsed radiolysis in the UV‐visible range during the first 5 μs after radiation/matter interaction. The solvated electron was not observed under our experimental conditions.
Characterization of the Solid Formed After Gamma Irradiation (Low‐Dose‐Rate Irradiation)
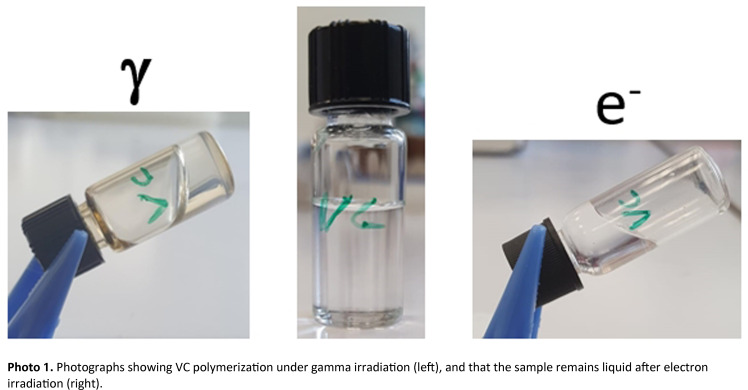
Over long periods of time, VC behaves differently depending on the nature of the ionizing radiation. It becomes solid after gamma irradiation, whereas it remains liquid after electron irradiation (Photo 1). The main difference between these two types of radiation lies in their dose rate values: gamma irradiation is continuous, with a dose rate of 4.5 Gy.min−1, whereas the electron beam used is pulsed and has a dose rate of 20 Gy.pulse−1, with electron pulses lasting 10 ns.
The solid formed after gamma irradiation was characterized first.
Figure 5 shows MALDI‐TOF spectra recorded for m/z ratios ranging from 1000 to 5000 for two VC samples irradiated with gamma irradiation at doses of 440 and 590 Gy. The mass spectra shown in Figure 5 are characteristic of polymer formation in the irradiated samples. These spectra show molecular mass distributions centered at approximately 1500 Da for the sample irradiated at 440 Gy and at 1600 Da for that irradiated at 590 Gy (Figure 5). Because the sample irradiated at a higher dose shows more intense peaks detectable at higher masses, the molar mass of the compound increased with dose. Nevertheless, characterization of individual peaks was not possible due to the superposition of several species. In particular, Figure 5b shows that there are four or five different ions, for m/z values ranging from 1450 to 1510. In conclusion, these analyses demonstrate the formation of a polymer, whose chemical formula is not easily identifiable, being composed of different motifs. This is expected, because the double bond −CH−CH− in VC is known to trigger polymerization upon reduction.
To better characterize these polymers, thermogravimetric analyses (TGA) were carried out (Figure S9). Figure S9 shows that the polymers formed under VC irradiation at different doses (440 Gy and 590 Gy) have the same temperature behavior. Both polymers decomposed very rapidly in a single step between 215 °C and 355 °C, and lost 89 % of their total mass between room temperature and 800 °C. These results suggest that they have the same chemical composition. It should be noted that TGA analyses carried out only on poly(vinylene carbonate), or poly(VC), obtained after polymerization of VC (see Figure S10 for its chemical structure)[ 34 , 35 , 36 ] using experimental conditions identical to those applied here, showed that poly(VC) decomposed in a single step at temperatures ranging from 220 °C to 360 °C, similarly to our measurements. [37] However, the mass loss measured in ref. [37] (77 % between room temperature and 800 °C) is lower than that obtained in our experiments (89 % here). Consequently, these TGA experiments suggest that the polymer formed under gamma irradiation probably contains poly(VC), but also other species, in agreement with the MALDI‐TOF results (Figure 5). These results are also consistent with various macroscopic observations: studies carried out on poly(VC) show that the latter is flexible and dissolves in various solvents, such as dimethylformamide (DMF) and dimethylsulfoxide (DMSO).[ 34 , 35 , 36 , 37 ] In contrast, the polymer recovered after irradiation consists of hard blocks, and is only soluble in DMSO. Therefore, the polymer consists of poly(VC), but clearly other units are also present.
The polymer formed was also characterized by IR spectroscopy (Figure 6). The attribution of the various bands observed is given in Table S2. Clearly, and in agreement with the TGA results, the spectra measured for compounds formed after irradiation at 440 Gy and 590 Gy were identical (Figure 6b). The broad bands observed in the irradiated compounds reflected the formation of polymers, leading to a heterogeneous environment (Figure 6b).
Figure 6.

Fourier‐transform infrared (FT‐IR) spectra of pure vinylene carbonate (VC, black) and the polymer (blue) obtained after gamma irradiation at a dose of 440 Gy (a). Comparison of spectra of polymers obtained after irradiation at a dose of 440 Gy and 590 Gy (b).
The pure VC spectrum revealed characteristic bands (Table S2). [38] Thus, there is a band at 3171 cm−1 attributed to a −C−H stretching mode, another weak band at 1630 cm−1 corresponding to C−C stretching vibration with the C−O stretching modes around 1800 cm−1 (Figure 6a). [38] For irradiated compounds, a band at 3000 cm−1 attributed to C−H vibration appeared, while the intensity of the band at 3171 cm−1 decreased significantly. This pattern suggests that some VC remains trapped in the polymer structure, despite prior drying of the material. A previous study showed that the infrared spectrum of poly(VC) exhibits infrared characteristics very similar to those observed in this work. [15] For example, the bands at 718 cm−1 corresponding to out‐of‐plane C−H vibrations, at 1078 cm−1 to O−C−O bonds and 1810 cm−1 to C−O stretching modes, are characteristic of poly(VC). [15] These infrared bands indicate its presence in the irradiated material.
To gain a better understanding of the other species present in this polymer, apart from poly(VC), NMR experiments were carried out. First, the proton and carbon NMR spectra (liquid NMR) of VC alone were recorded (Figure S11). The proton spectrum (1H) reveals the presence of a singlet at 7.7 ppm, attributed to protons linked to the double bond in VC (−O−CH−CH−O−). Turning to the carbon spectrum (13C), two distinct chemical shifts were observed. The first, at 132.5 ppm, corresponded to the carbons of the double bond (−CH−CH−), and the second at 154.3 ppm, corresponded to the carbon atom bonded to the oxygen atoms (−OC(−O)O−).
Solid‐state NMR experiments were carried out on material recovered after gamma irradiation at a dose of 590 Gy. Proton NMR results (1H), including 2D mapping (1H‐1H), as well as carbon NMR (13C), are shown in Figure 7. 1H and 13C signals were assigned using data from the literature (see Table 1).[ 3 , 11 ] The proton and carbon spectra show a wide range of signals (Figure 7b). Different regions stand out in the proton spectrum. A relatively thin peak, located at 7.3 ppm, corresponds to VC residues trapped in the structure, in agreement with observations made by IR spectroscopy (Figure 6). Free VC is not seen in the 13C CP spectrum (Figure 7c) because the polarization transfer from 1H→13C, fundamental to cross polarization, is highly inefficient for dynamic moieties due to full or partial averaging of the dipole‐dipole interaction. The 1H MAS NMR spectrum is dominated by a broad signal at 5.2 ppm, which can be attributed to protons linked to sp3 carbons close to heteroatoms such as the (−CHO−) function present in poly(VC).[ 3 , 11 , 14 ] The broadness of this signal may be an indication for disorder in the polymer, because homogeneous line broadening was reduced in the experimental conditions applied: fast MAS (60 kHz sample spinning used) and high magnetic field strength (21.1 T). The fact that two autocorrelation peaks but no coupling peaks were observed in the DQ‐SQ (Figure 7a) 1H‐1H spectrum may be due to the presence of spatially separated and chemically different regions, one richer in oxygen at around 5.2 ppm than the other around 2–2.5 ppm. The pattern of peaks appears to therefore imply chemical and/or structural heterogeneity within the material. The most intense peak in the 13C CP NMR spectrum at 77 pm is most likely bound to oxygen, or at least in close proximity to several oxygen atoms, based on its chemical shift value. [3] There were other peaks that could be attributed, even if their intensity was low (Figure 7c). The chemical shift at 109 ppm, although weak, can be attributed to an acetal carbon linked to a cyclic R group, present in poly(VC). [39] Methoxy groups (R−O‐CH3) may also be present, as suggested by the slight contribution at 3.9 ppm in the proton spectrum and at 64 ppm in the carbon spectrum. Finally, the peaks observed at 1.8 ppm and 2.7 ppm in the proton spectrum, as well as at 22 ppm and 28 ppm in the carbon spectrum, most likely correspond to aliphatic carbons. According to Michan et al., these signals can be attributed to the presence of alkyl groups, which are relatively close to oxygen atoms in the structure of the polymer formed. [14]
Figure 7.

(a) 2D double quantum‐single quantum (DQ‐SQ) 1H‐1H correlation spectrum of the polymer recovered after irradiation at 590 Gy. (b) 1H MAS NMR spectrum of the polymer. (b) 13C CP NMR spectrum of the polymer. All spectra were recorded using a 21.1 T magnet.
Table 1.
Table comparing the experimental chemical shifts obtained in this work (Figure 7) with those in the literature.[ 3 , 11 , 14 ]
|
Chemical shift (ppm) |
References and corresponding chemical shift (ppm) |
Assignment |
|
|---|---|---|---|
|
Proton (1H) |
1.8 |
Aliphatic carbons relatively close to oxygen atoms |
|
|
2.7 |
|||
|
3.9 |
3.5 (refs. [3, 11]) |
RO−CH3 |
|
|
5.2 |
5.1 (refs. [3, 11]) |
−CHO− in poly(VC) |
|
|
7.3 |
7.3 (refs. [3, 11]) |
−OCH−CHO− (VC) |
|
|
Carbon (13C) |
22 and 28 |
20–40 (ref. [14]) |
Alkyl groups (−CH2R, etc.) |
|
64 |
59 (refs. [3, 11]) |
RO−CH3 |
|
|
77 |
77 (refs. [3, 11]) |
R2CHOR’ in poly(VC) |
|
|
109 |
108 (refs. [3, 11]) |
−HC(OR)(OR’) |
|
|
134 |
133 (refs. [3, 11]) |
−CH=CH− (VC) |
|
|
153 |
155 (refs. [3, 11]) |
C of carbonate in VC |
These observations highlight the complexity of the chemical environment resulting from the polymerization of VC under irradiation, as also evidenced in ref. [3]. Despite the low number of hydrogen atoms in the VC structure, the products formed during irradiation contain many hydrogen atoms. These observations suggest that even trace amounts of water must play an important catalytic role, as also evidenced in ref. [32]. Our results also show that the results we obtained are consistent with those obtained in the literature by means of reduction other than those using radiation chemistry. In particular, all these results are consistent with those obtained from battery studies in which the electrolyte used contained only VC as solvent (see also Table 1).
Identification and Quantification of Gas Production Under Ionizing Radiation
To better understand the nature of the stable products formed, and to determine the VC degradation processes, the main gaseous species formed during irradiation were quantified and/or identified using different gas chromatography tools (μ‐GC and GC‐MS).
After irradiation, the quantity of gas (H2, CO and CO2) evolved linearly with the radiation dose (Figure 8a). The slope of the straight line corresponds to the measured radiolytic yield, i. e. the quantity of gas produced per quantity of energy deposited on the sample. Figure 8b shows that CO and CO2 were the main gases formed under irradiation, with H2 being produced to a lesser extent. Note that CO production was at its highest after electron irradiation (high‐dose‐rate irradiation), but CO2 dominated after gamma irradiation (low‐dose‐rate irradiation). Adding up the radiolytic yields of the various gases quantified by μ‐GC according to the type of ionizing radiation shows that these total production values were very high (~11 μmol‐J−1 for gamma irradiation and ~7 μmol‐J−1 after electron irradiation). By way of comparison, the sum of the radiolytic yields of the main gases measured, for an electrolyte containing ethylene carbonate, ethyl methyl carbonate, LiPF6 at 1 M and VC at a maximum concentration of 10 %, after gamma irradiation, are, at most, on the order of 0.7 μmol‐J−1. [9] This tenfold‐higher gas production after gamma irradiation is the signature of polymerization. After electron irradiation, values were of the same order of magnitude, albeit slightly lower; therefore, oligomerization–not polymerization–of VC occurs when it is irradiated with electrons.
Figure 8.

(a) Production of CO, CO2 and H2, measured by μ‐GC, after irradiation of pure vinylene carbonate (VC) with 10 MeV electrons, as a function of irradiation dose. Points correspond to experimental data. Lines correspond to fits to the data. Uncertainty was estimated at 10 %. The slopes of the lines correspond to the radiolytic yields of the different gases produced. (b) Evolution of radiolytic yield, expressed in μmol‐J−1, as a function of gas type and type of ionizing radiation.
Furthermore, GC‐MS experiments showed that the gaseous species formed were not the same depending on the nature of the source of the ionizing radiation, for the same dose value (Figure S12). Only CO2 and traces of water were identified when using gamma irradiation (Figure S12a), but CO2 and C2H2 were produced when using electron irradiation (Figure S12b). Interestingly, Ota et al. (2004) reported that acetylene (C2H2) was detected during VC reduction. [11] In the latter case, C2H2 formation shows that VC decomposes by ring opening at the double bond. Our observations, especially under gamma irradiation, are consistent with the polymerization of VC at the surface of the negative electrode, which is mainly accompanied by the release of CO2.[ 40 , 41 ]
Finally, an irradiation experiment conducted in air (rather than in an Ar atmosphere) revealed that VC does not polymerize in air under gamma irradiation. Therefore, VC polymerization follows a radical mechanism.
The differences between gamma irradiation and electron irradiation are due to differences in dose rates between the two experiments (between 4 and 5 Gy per minute for gamma irradiation, versus 20 Gy in 10 ns for irradiation with accelerated electrons). This effect can be understood through the notion of kinetic chain length (λ). Kinetic chain length represents the average number of monomers that bind to a growing polymer chain before a termination reaction occurs. In other words, it corresponds to the number of monomer units consumed per unit of monomer activated by the initiation step. Kinetic chain length is expressed as the ratio of the propagation rate to polymerization initiation rate:[ 42 , 43 ]
| (4) |
The propagation rate corresponds to the rate at which a growing polymer chain reacts with monomers to form new units. In the case of bimolecular termination and for experiments carried out at constant temperature in a homogeneous medium with freely moving species, the propagation rate can be considered to be proportional to the square root of the dose rate ( : [42]
| (5) |
The initiation rate ( ) refers to the rate at which reactive chemical species, which initiate the formation of the free radicals necessary for polymer chain growth, are formed. The rate of initiation is directly proportional to the dose rate.
| (6) |
Thus, when the mobility of the species is not overly affected by the solidification of the reaction medium, it is possible to write:
| (7) |
The length of kinetic chains is therefore proportional to the inverse of the square root of the dose rate, giving in the present case:
| (8) |
Thus, after electron irradiation, VC oligomerizes, whereas it polymerizes during gamma irradiation.
Proposed Reaction Mechanisms
Determining the reaction mechanisms of VC is important to better understand its behavior in battery experiments, and in particular, the formation of the film on the negative electrode, a film whose composition is far more complex than that of poly(VC) alone. [3]
The first stage in radiation/matter interaction is the ionization and excitation of a molecule (1). Ionization leads to the formation of a cation radical and an electron.
The direct effect of ionizing radiation as well as the recombination reaction between the cation radical (VC + ⋅) and the electron, both of which lead to the formation of VC in the excited state (VC*, (9)), are poorly favored due to high dielectric constant of VC (126 at 298 K). [29] Therefore, it is reasonable to consider that H2 production (which exhibits a low radiolytic yield value) comes essentially from the excited states (10–11. [9]
| (9) |
 |
(10) |
 |
(11) |
In addition, dihydrogen formation can also occur via other reaction paths, such as the reaction between the anion radical and the protonated solvent molecule (VCH+, (12–13).
 |
(12) |
 |
(13) |
The reaction involving the cation radical can be described in a similar way to that proposed in the case of irradiated ethylene carbonate. [9] In this case, the VC(−H)⋅ radical is formed following proton transfer from the solvent molecule to the cation radical formed by ionizing radiation (14). Subsequently, the VC(−H)⋅ ring can be opened, leading in particular to the formation of CO2 15.
 |
(14) |
 |
(15) |
In what follows, we focus on radical reduction mechanisms, as highlighted by pulsed radiolysis experiments. These reaction mechanisms involving VC reduction are those of interest for the study of batteries, to account for the species deposited at the SEI on the surface of negative electrodes. These mechanisms lead, by means of radical polymerization, to a polymer whose complexity can be approached as described below.
As far as reduction pathways are concerned, the electron is very rapidly trapped by VC molecules, leading to the formation of VC⋅− (Scheme 1). For simplicity, in the following, we only write the species VC⋅−, and not , because both lead to the formation of (VC)( ⋅−) (Scheme 2) after ring opening. Although the formation of has not been reported in the literature up to now (due to a lack of experimental techniques to detect it), ring opening phenomenon has been predicted by theoretical studies. [17] Shkrob et al. have shown that this process is exothermic and readily leads to the formation of an anion radical, which is accompanied by the formation of CO2 only (green box, step 1, Scheme 2). [44] However, gas analyses carried out during VC irradiation revealed the formation of CO in addition to CO2 (Figure 8). We suggest here that ring opening of the anion radical also leads to CO formation. An initial reaction leading to CO formation is proposed in the gray box (step 1′) of Scheme 2. In the following, however, we focus on reaction pathways leading to CO2 formation. Michan et al. have shown that the anion radical reacts rapidly with H+ ions from residual water, even in trace amounts, to form a radical (purple box, step 2, Scheme 2). [14] The latter was identified as the intermediate species in the reduction of fluoroethylene carbonate (FEC). [14] The radical formed in step 2 is stabilized by a mesomeric effect, leading to the formation of two mesomeric radicals, a1 and b1 (orange box, step 3, Scheme 2). These two mesomers can react with VC molecules (steps 4 and 5). Nevertheless, it is reasonable to assume that the most stable molecule from step 4 is the one containing an aldehyde (b2). However, the signature of this functional group was not revealed during our various physicochemical characterizations. The mesomeric forms generated in step 5 can initiate polymerization to lead to poly(VC) and other intermediates via radical polymerization (red box, step 6).[ 11 , 45 , 46 ]
Scheme 2.

Proposed reduction reactions from vinylene carbonate (VC). The first steps, described in Scheme 1, have been simplified here for greater clarity. Please refer to Scheme 1 for a precise description of the first steps. From step 1 onwards, the VC molecule is omitted.
It is also reasonable to assume that reactions from step 4 onwards can lead to the formation of molecules such as CO2 and CO. Shkrob et al. have shown that decarboxylation (from step 4 to step 5′ in Scheme 2), i. e. the loss of CO2 molecules, is highly exothermic. [44] Given that the radiolytic yields of CO2 and CO are high, it is conceivable that the emission of these small molecules can also take place as of step 4, leading to the presence of poly(VC), but also of linear parts in the polymer, obtained from ring opening. The loss of CO, after the loss of CO2, would account for aliphatic parts in this polymer, without the presence of aldehyde functional groups, as observed by NMR (Figure 7). It should be noted, however, that the spectroscopic techniques used to characterize the polymer show that it consists mainly of poly(VC) (Figures 6 and 7). The other components, which not only contribute to its heterogeneity in terms of chemical function, but are also responsible for gas production, are relatively minor CO2 and CO radiolytic yield values reported here were significant. Nonetheless, these other components are sufficient to induce macroscopic properties very different from those of poly(VC) (see description of the polymer above).
All these experiments show the complexity of the species formed in the presence of VC, and suggest that the compound formed in batteries in the SEI, consists not only of poly(VC), but also possesses other chemical functions. In addition, radiolysis experiments coupled with quantum chemical calculations clearly highlight the different species formed in the reductive pathway, providing valuable insights into the processes at work in batteries, especially for species formed at short times that have been characterized based on their UV‐visible spectra. Finally, another advantage of VC is that, when added as an additive to an electrolyte, it reduces the amount of gas formed. [9]
Conclusions
Here, we used radiation chemistry as a tool to understand the behavior of VC under reduction. The first stages of radiation/matter interaction, as well as the evolution of VC behavior, were followed using pulsed radiolysis experiments, coupled with quantum chemistry calculations. These experiments, carried out over short timescales (from ps to several μs), enabled us to identify VC⋅− as the first species formed after reduction. After the ring opening of VC⋅− that takes place within a few nanoseconds, the anion radical ( ⋅−) is formed. It disappears in less than 100 ns, leading in particular to the formation of (VC)( ⋅−), which disappears within several microseconds. Over short timescales, the species is also formed. It also leads to the formation of the (VC)( ⋅−) species after the opening of one ring. The species, which can only be detected and identified using time‐resolved techniques coupled with quantum chemistry calculations, had never been observed before. All these transient species were characterized from their UV‐visible spectra.
Over longer periods of time, VC behaves differently depending on the dose rate of the ionizing radiation. Polymerizing after low‐dose‐rate gamma irradiation, it oligomerizes after high‐dose‐rate electron irradiation. This difference in behavior is due to the length of the kinetic chains formed during irradiation, which depends on the value of the dose rate. Furthermore, measurements of the radiolytic yields of H2, CO and CO2 (~11 μmol‐J−1 for gamma irradiation and ~7 μmol‐J−1 after electron irradiation) are consistent with VC polymerization/oligomerization depending on the value of the dose rate of the ionizing radiation. Various studies have shown that VC polymerization leads to poly(VC) formation. However, observations and analyses in this work have shown that, although the polymer does contain mostly poly(VC)‐type units, other motifs are also present, leading to a polymer that exhibits different macroscopic properties compared with poly(VC). Solid state NMR analysis revealed the presence of several chemical groups (R−O‐CH3, aliphatic carbons, etc.) in addition to poly(VC). In fact, the presence of water, even in very small quantities, is partly responsible for the complexity of the chemical environment obtained. Finally, we proposed reaction mechanisms to account for the polymerization of VC under irradiation. Clearly, this work sheds light on the complexity of the reaction mechanisms involved in VC reduction and, hence, in the formation of the polymers deposited at the SEI on the surface of negative electrodes in Li‐ion batteries. Thus, the polymer deposited at the SEI on the negative electrode in Li‐ion batteries, and due to the presence of VC in the electrolyte, is far more heterogeneous and complex than the simple chemical formula poly(VC) would suggest.
Materials and Methods
Chemical Products
VC was purchased from Solvionic (purity>99.8 %). It was handled in a glove box (O2<3 ppm and H2O<1 ppm). Water concentration, measured by coulometric Karl‐Fischer titration, never exceeded 30 ppm. The solutes used (HClO4, acetone ((CH3)2CO), AgClO4) were purchased from Sigma‐Aldrich.
Irradiation Experiments
Pulsed Picosecond Radiolysis on the ELYSE Platform
To understand the phenomena that occur in the early stages of radiation/matter interaction, picosecond pulsed radiolysis experiments were carried out using the ELYSE electron accelerator. During these experiments, the various samples were systematically degassed with Ar before and during all experiments, to avoid any water uptake. The electron energy was 7.6 MeV. Pulse duration was around 7 ps, with a repetition rate of 5 Hz. The transient absorbance of the samples was measured in a flow cell with a 5 mm optical path. Two experimental configurations were used, depending on the timescale considered.
In the first configuration, we recorded signals from ps to 10 ns with a pump‐probe set‐up described in ref. [22]
In the second configuration, we recorded signals on the ns‐μs timescale using a streak camera and a flash lamp. In a single experiment, we recorded spectra (in the wavelength range 300–800 nm) as a function of time, simultaneously obtaining kinetics at different wavelengths. Absorbance values were averaged over 600–900 pulses. Measurement accuracy was around a mean optical density (mO.D.) of 2.
The dose per pulse was deduced from the absorbance of the hydrated electron in water, measured just before a series of experiments, as detailed in ref. [22]
Spectro‐Kinetic Analysis of the Data Obtained
The spectro‐kinetic matrix consists of absorbance values measured at different times and wavelengths. A wavelength‐dependent baseline correction was then applied to enable multivariate curve resolution alternating least squares (MCR‐ALS) analysis using the SK‐Ana spectrokinetic analysis code.[ 27 , 28 ]
The number of absorbing species in a global matrix was evaluated using singular value decomposition. [47] Positivity constraints were imposed for both spectra and kinetics.
Gamma Irradiation and Accelerated Electrons Irradiation for Characterizing Stable Species Formed Under Ionizing Radiation
To avoid the presence of dissolved dioxygen, the electrolytes were placed in airtight ampoules beforehand and degassed for 30 min with Ar bubbling. They were then degassed to approximately 1 mbar. The ampoules were then filled with 1.6 bar of ultra‐pure (99.9999 %) Ar. They were then irradiated either with gamma irradiation or with 10 MeV accelerated electrons. The two types of irradiation applied enabled experiments to be carried out with extremely different dose rates (low dose rate for gamma irradiation, and high dose rate for irradiation with accelerated electrons).
Gamma Irradiation
A Gammacell 3000 gamma irradiator with a 137Cs source was used. The dose rate (4.5±0.2 Gy.min−1, 1 Gray, noted Gy, being equal to 1 J.kg−1) was measured using the Fricke dosimeter. [48] In general, a sample was irradiated four successive times. After each irradiation, the gas measurements described below were performed.
Irradiation with the ALIENOR Electron Accelerator
The samples were also irradiated using the ALIENOR linear electron accelerator (10 MeV). We worked at a frequency of 2 Hz to avoid heating the sample. The dose rate was systematically and precisely determined using Fricke dosimetry [48] and proved to be around 20 Gy.pulse−1.
In all irradiation experiments, and taking into account the values of the stopping powers in VC and in water, the dose received by VC was considered equal to that received in water with the Fricke dosimeter.
Gas Measurements using Micro‐Gas Chromatography and Gas Chromatography Coupled to Mass Spectrometry
Gases generated by irradiation were identified and quantified. H2, CH4, CO and CO2, if present, were quantified by micro‐gas chromatography (μ‐GC) (μ‐GC−R3000, SRA instrument) using very high purity (99.9999 %) Ar and He as carrier gases.
In addition, to identify other compounds formed in the gas phase, an Agilent 6890 chromatograph coupled with an Agilent 5973 MS mass spectrometer (GC‐MS) was used. The mass spectrometer has an electron impact (EI) source and a quadrupole mass analyzer. Helium was used as the carrier gas with a flow rate of 2 mL min−1. Separation was performed in split mode using a PorabondQ column (25 m×0.32 mm) (Agilent). The injector was set at 110 °C. Masses ranged from 1 to 200 amu, with detection limits in the 1 ppm range. GC‐MS analysis was performed at least twice for each sample.
Processing the Resulting Polymer
The polymer obtained after gamma irradiation formed a gel consisting of a mixture of liquid VC and products of VC polymerization. The remaining liquid VC had to be removed before the characterization of the polymer. The resulting gel was therefore cold‐extracted in a solution of tetrahydrofuran (THF), then filtered over Büchner. The filtrate was then dried under vacuum for 48 h.
Matrix‐Assisted Laser Desorption/Ionization Time‐Of‐Flight Experiments
The polymer (which was solubility‐restricted) was characterized following a mechanical mixing of 3 mg of the sample with an equal weight of the alpha‐cyano‐4‐hydroxycinnamic acid (CHCA) matrix. A few drops of dichloromethane were added to help have a homogeneous sample during the mixing. Then, a dry transfer of the resulting powder onto the surface of the matrix‐assisted laser desorption/ionization time‐of‐flight (MALDI) sample holder with a spatula (solvent‐free method) was performed. The MALDI‐time‐of‐flight (MALDI‐TOF) spectra were collected using a Bruker AutoFlex Speed instrument (Bremen, Germany). Measurements were performed in both positive and negative ionization modes and operated in the linear mode. Spectra were acquired in m/z range from 500 to 10,000. At least three summed spectra were recorded for each sample and 1000 shots were accumulated for each spectrum. The laser intensity was kept at around 90 % for all measurements. All spectra were processed by FlexAnalysis Bruker software.
Fourier‐Transform Infrared Spectroscopy
Fourier‐transform infrared (FT‐IR) spectroscopy measurements were carried out on a Bruker Tensor 27 FT‐IR spectrometer. Transmission measurements were carried out using pellets weighing approximately 100 mg. The composition of the pellets corresponded to a mixture of polymer (1 % by mass) diluted in potassium bromide (KBr, FT‐IR grade). The resulting powder was pressed to around 10 t, for a homogeneous pellet. The baseline was measured using a pure KBr pellet. Using OPUS software, IR spectra were recorded over a wavenumber range from 4500 to 370 cm−1, at a frequency of 10 kHz, accumulating 100 acquisitions. The resolution was 4 cm−1.
Nuclear Magnetic Resonance Spectroscopy Experiments
Solid‐state nuclear magnetic resonance (NMR) spectra were recorded on a Bruker Avance NEO spectrometer at 900 MHz (21.1 T) equipped with 3‐channel HCN 1.3 mm and 4‐channel HCND 3.2 mm CPMAS probes. Magic angle spinning (MAS) was used to average out chemical shift anisotropy. For nuclei with low resonance signals or low natural abundance, a technique known as cross polarization (CP) was combined with MAS. [49] Samples were placed in 1.3 mm and 3.2 mm zirconia rotors and spun at frequencies of up to 60 kHz and 20 kHz, respectively, at room temperature using dry N2 gas.
1D spectra of the proton (1H) were obtained using a rotor‐synchronized Hahn echo pulse sequence with half‐echo delays of one rotor period (0.017 ms at a rotation speed of 60 kHz). The and π pulse durations were 3.0 and 6.0 μs respectively, and 16 transients were summed. The 1H‐1H double quantum‐single quantum (DQ‐SQ) spectrum was obtained with the symmetry based pulse sequence to reintroduce homonuclear dipolar coupling during MAS. [50] Recycle delays were set to 8.7 s, which is equivalent to 1.3*T1. 1H chemical shifts were referenced to tetramethylsilane.
1D CP NMR spectra under MAS [49] of carbon (13C) were obtained by transferring polarization from 1H to 13C using variable amplitude during a contact time of 1 ms while spinning the sample at 20 kHz. [51] During acquisition, 83 kHz heteronuclear decoupling was performed using a spinal‐64 pulse sequence. [52] The recycling delay was set at 7 s, equivalent to 1.3*T1 of the proton spins. 65 k transients were accumulated. 13C chemical shifts were referenced to tetramethylsilane.
Computational Methods
Geometry Optimization
The geometry optimization of the monomer was performed with the r2 SCAN‐3c composite density functional theory (DFT) method [53] using the ORCA 5.0.4 program. [54] The approach combines the r2 SCAN meta‐generalized‐gradient approximation with triple‐ζ Gaussian basis set and the semi‐classical D4 and gCP correction potentials for London‐dispersion and basis set superposition error. A conformational search was carried out for the species first to determine the most favorable conformers. We applied the CREST [55] workflow to screen the conformational space. Lastly, we conducted the final geometry optimization of the dimer conformers at the r2 SCAN‐3c level.
Excited States
The theoretical electronic absorption spectra were calculated on the optimized ground‐state geometry using time‐dependent DFT (TDDFT) with the ωB2GPPLYP long‐ranged corrected double‐hybrid functionals optimized for excitation energies. [56] They provide a balanced description of local‐valence, Rydberg, and charge‐transfer states. The def2‐TZVPD basis set was used for TDDFT calculations of the different species. [57]
To obtain spectra from calculations that can be compared with the experiments, we applied a Gaussian broadening function over the single oscillator strength calculated values. We included an energy correction and, only subsequently, we converted the spectra to nm. In the final step, we scaled the calculated intensities for a better similarity with experimental spectra.
Post‐Processing, Analysis and Visualization of Results from ORCA
All calculations (including spectra and excited state properties) were analyzed using Multiwfn (development version 3.8) software27 and visualized using VMD 1.9.4 software. [58] The electronic excitations were analyzed in terms of hole and electron distributions. [59] The hole distribution describes where the excited electrons come from, and the electron distribution describes where the excited electrons go after excitation. Further analyses helped determine which molecular orbitals contributed significantly to the holes and electrons.The overall distribution of holes and electrons can be quantitatively characterized by calculating D and Sr indices. The D‐index represents the distance between centroids of holes and electrons, and Sr represents the hole‐electron overlap.
Conflict of Interests
The authors declare no conflict of interest.
1.
Supporting information
As a service to our authors and readers, this journal provides supporting information supplied by the authors. Such materials are peer reviewed and may be re‐organized for online delivery, but are not copy‐edited or typeset. Technical support issues arising from supporting information (other than missing files) should be addressed to the authors.
Supporting Information
Acknowledgments
We thank the CEA′s Focus Batteries program, as well as funding from the French National Research Agency (ANR ACETONE N° ANR‐20‐CE09‐0010‐01) for financial support. We gratefully acknowledge the Fondation Maison de la Chimie. We would also like to thank the French EMIR&A network and Jean‐Philippe Larbre for providing irradiation beam time at the ELYSE platform and also the French EMIR&A network and Jorge Vieira for providing irradiation beam time at the ALIENOR platform. The authors wish to thank Dr. Christophe Fajolles for fruitful discussions.
Souid Y., Puget M., Ortiz D., Piveteau L., Denisov S., Herlin-Boime N., Mostafavi M., Dognon J.-P., Le Caër S., ChemSusChem 2025, 18, e202402091. 10.1002/cssc.202402091
Data Availability Statement
The data that support the findings of this study are available from the corresponding author upon reasonable request.
References
- 1. Tarascon J. M., Armand M., Nature 2001, 414, 359–367. [DOI] [PubMed] [Google Scholar]
- 2. Armand M., Tarascon J.-M., Nature 2008, 451, 652–657. [DOI] [PubMed] [Google Scholar]
- 3. Jin Y., Kneusels N.-J. H., Marbella L. E., Castillo-Martínez E., Magusin P. C. M. M., Weatherup R. S., Jónsson E., Liu T., Paul S., Grey C. P., J. Am. Chem. Soc. 2018, 140, 9854–9867. [DOI] [PubMed] [Google Scholar]
- 4. Martínez de la Hoz J. M., Balbuena P. B., Phys. Chem. Chem. Phys. 2014, 16, 17091–17098. [DOI] [PubMed] [Google Scholar]
- 5. Xu C., Lindgren F., Philippe B., Gorgoi M., Björefors F., Edström K., Gustafsson T., Chem. Mater. 2015, 27, 2591–2599. [Google Scholar]
- 6. Lin Y.-X., Liu Z., Leung K., Chen L.-Q., Lu P., Qi Y., J. Power Sources 2016, 309, 221–230. [Google Scholar]
- 7. Haregewoin A. M., Wotango A. S., Hwang B.-J., Energy Environ. Sci. 2016, 9, 1955–1988. [Google Scholar]
- 8. Ming J., Cao Z., Wu Y., Wahyudi W., Wang W., Guo X., Cavallo L., Hwang J.-Y., Shamim A., Li L.-J., Sun Y.-K., Alshareef H. N., ACS Energy Lett. 2019, 4, 2613–2622. [Google Scholar]
- 9. Levieux-Souid Y., Martin J.-F., Moreau P., Herlin-Boime N., Le Caër S., Small Methods 2022, 6, 2200712. [DOI] [PubMed] [Google Scholar]
- 10. Aurbach D., Gamolsky K., Markovsky B., Gofer Y., Schmidt M., Heider U., Electrochim. Acta 2002, 47, 1423–1439. [Google Scholar]
- 11. Ota H., Sakata Y., Inoue A., Yamaguchi S., J. Electrochem. Soc. 2004, 151, A1659. [Google Scholar]
- 12. El Ouatani L., Dedryvère R., Siret C., Biensan P., Reynaud S., Iratçabal P., Gonbeau D., J. Electrochem. Soc. 2009, 156, A103. [Google Scholar]
- 13. Martin L., Martinez H., Ulldemolins M., Pecquenard B., Le Cras F., Solid State Ion. 2012, 215, 36–44. [Google Scholar]
- 14. Michan A. L., Parimalam B. S., Leskes M., Kerber R. N., Yoon T., Grey C. P., Lucht B. L., Chem. Mater. 2016, 28, 8149–8159. [Google Scholar]
- 15. Grugeon S., Jankowski P., Cailleu D., Forestier C., Sannier L., Armand M., Johansson P., Laruelle S., J. Power Sources 2019, 427, 77–84. [Google Scholar]
- 16. Fasulo F., Muñoz-García A. B., Massaro A., Crescenzi O., Huang C., Pavone M., J. Mater. Chem. A 2023, 11, 5660–5669. [Google Scholar]
- 17. Wang Y., Nakamura S., Tasaki K., Balbuena P. B., J. Am. Chem. Soc. 2002, 124, 4408–4421. [DOI] [PubMed] [Google Scholar]
- 18. Ortiz D., Steinmetz V., Durand D., Legand S., Dauvois V., Maître P., Le Caër S., Nat. Commun. 2015, 6, 6950. [DOI] [PMC free article] [PubMed] [Google Scholar]
- 19. Ortiz D., Jimenez Gordon I., Baltaze J.-P., Hernandez-Alba O., Legand S., Dauvois V., Si Larbi G., Schmidhammer U., Marignier J. L., Martin J.-F., Belloni J., Mostafavi M., Le Caër S., ChemSusChem 2015, 8, 3605–3616. [DOI] [PubMed] [Google Scholar]
- 20. Ortiz D., Jimenez Gordon I., Legand S., Dauvois V., Baltaze J.-P., Marignier J. L., Martin J.-F., Belloni J., Mostafavi M., Le Caër S., J. Power Sources 2016, 326, 285–295. [Google Scholar]
- 21. Le Caër S., Ortiz D., Marignier J. L., Schmidhammer U., Belloni J., Mostafavi M., J. Phys. Chem. Lett. 2016, 7, 186–190. [DOI] [PubMed] [Google Scholar]
- 22. Puget M., Shcherbakov V., Denisov S., Moreau P., Dognon J.-P., Mostafavi M., Le Caër S., Chem. Eur. J. 2021, 27, 8185–8194. [DOI] [PubMed] [Google Scholar]
- 23. Varenne F., Alper J. P., Miserque F., Bongu C. S., Boulineau A., Martin J.-F., Dauvois V., Demarque A., Bouhier M., Boismain F., Franger S., Herlin-Boime N., Le Caër S., Sustainable Energy Fuels 2018, 2, 2100–2108. [Google Scholar]
- 24. Bongu C. S., Surblé S., Alper J. P., Boulineau A., Martin J.-F., Demarque A., Coulon P.-E., Rosso M. O., Franger F. S., Herlin-Boime N., Le Caër S., J. Phys. Chem. C 2019, 2019, 28550–28560. [Google Scholar]
- 25. Souid Y., Herlin-Boime N., Franger S., Le Caër S., J. Electrochem. Soc. 2024, 171, 090527. [Google Scholar]
- 26. Marignier J. L., Torche F., Le Caër S., Mostafavi M., Belloni J., J. Phys. Chem. B 2016, 120, 2388–2396. [DOI] [PubMed] [Google Scholar]
- 27. Ruckebusch C., Sliwa M., Pernot P., de Juan A., Tauler R., J. Photochem. Photobiol. 2012, 13, 1–27. [Google Scholar]
- 28.P. Pernot, in https://zenodo.org/record/1120307#.X_b3ouhKi9I (Ed: L. d. C. Physique) 2017.
- 29. Väli R., Jänes A., Lust E., J. Electrochem. Soc. 2016, 163, A851–A857. [Google Scholar]
- 30. Wang F., Varenne F., Ortiz D., Pinzio V., Mostafavi M., Le Caër S., ChemPhysChem 2017, 18, 2799–2806. [DOI] [PubMed] [Google Scholar]
- 31. Lu T., Chen F., J. Comput. Chem. 2012, 33, 580–592. [DOI] [PubMed] [Google Scholar]
- 32. Gogoi N., Lundström R., Hernández G., Berg E. J., J. Electrochem. Soc. 2024, 171, 050506. [Google Scholar]
- 33. Wang Y., Balbuena P. B., J. Phys. Chem. B 2002, 106, 4486–4495. [Google Scholar]
- 34. Smets G., Hayashi K., J. Polym. Sci. 1958, 29, 257–274. [Google Scholar]
- 35. Field N. D., Schaefgen J. R., J. Polym. Sci. 1962, 58, 533–543. [Google Scholar]
- 36. Ding L., Li Y., Li Y., Liang Y., Huang J., Eur. Polym. J. 2001, 37, 2453–2459. [Google Scholar]
- 37. Chai J., Liu Z., Ma J., Wang J., Liu X., Liu H., Zhang J., Cui G., Chen L., Adv. Sci. 2017, 4, 1600377. [DOI] [PMC free article] [PubMed] [Google Scholar]
- 38. Dorris K. L., Boggs J. E., Danti A., Altpeter L. L., J. Chem. Phys. 1967, 46, 1191–1193. [Google Scholar]
- 39. Leifer N., Smart M. C., Prakash G. K. S., Gonzalez L., Sanchez L., Smith K. A., Bhalla P., Grey C. P., Greenbaum S. G., J. Electrochem. Soc. 2011, 158, A471. [Google Scholar]
- 40. Zhang B., Metzger M., Solchenbach S., Payne M., Meini S., Gasteiger H. A., Garsuch A., Lucht B. L., J. Phys. Chem. C 2015, 119, 11337–11348. [Google Scholar]
- 41. Zhou H., Liu H., Li Y., Yue X., Wang X., Gonzalez M., Meng Y. S., Liu P., J. Mater. Chem. A 2019, 7, 16984–16991. [Google Scholar]
- 42. Ashfaq A., Clochard M.-C., Coqueret X., Dispenza C., Driscoll M. S., Ulański P., Al-Sheikhly M., Polymers (Basel) 2020, 12, 2877. [DOI] [PMC free article] [PubMed] [Google Scholar]
- 43. Defoort B., Larnac G., Coqueret X., Rad. Phys. Chem. 2001, 62, 47–53. [Google Scholar]
- 44. Shkrob I. A., Wishart J. F., Abraham D. P., J. Phys. Chem. C 2015, 119, 14954–14964. [Google Scholar]
- 45. Jung R., Metzger M., Haering D., Solchenbach S., Marino C., Tsiouvaras N., Stinner C., Gasteiger H. A., J. Electrochem. Soc. 2016, 163, A1705–A1716. [Google Scholar]
- 46. Nie M., Demeaux J., Young B. T., Heskett D. R., Chen Y., Bose A., Woicik J. C., Lucht B. L., J. Electrochem. Soc. 2015, 162, A7008–A7014. [Google Scholar]
- 47. Golub G. H., Van Loan C. F., Matrix Computation, The John Hopkins University Press, London: 1989. [Google Scholar]
- 48. Fricke H., Hart E. J., in Radiation Dosimetry, Vol. 2, Second Edition ed (Eds: Attix F. H., Roesch W. C.), Academic press, New York and London, 1966, pp. 167–232. [Google Scholar]
- 49. Pines A., Gibby M. G., Waugh J. S., J. Chem. Phys. 2003, 59, 569–590. [Google Scholar]
- 50. Hu B., Delevoye L., Lafon O., Trébosc J., Amoureux J. P., J. Magn. Resonance 2009, 200, 178–188. [DOI] [PubMed] [Google Scholar]
- 51. Peersen O. B., Wu X. L., Kustanovich I., Smith S. O., J. Magn. Resonance A 1993, 104, 334–339. [Google Scholar]
- 52. Fung B. M., Khitrin A. K., Ermolaev K., J. Magn. Resonance 2000, 142, 97–101. [DOI] [PubMed] [Google Scholar]
- 53. Grimme S., Hansen A., Ehlert S., Mewes J.-M., J. Chem. Phys. 2021, 154, 064103. [DOI] [PubMed] [Google Scholar]
- 54. Neese F., WIREs Comput. Mol. Sci. 2022, 12, e1606. [Google Scholar]
- 55. Pracht P., Bohle F., Grimme S., Phys. Chem. Chem. Phys. 2020, 22, 7169–7192. [DOI] [PubMed] [Google Scholar]
- 56. Casanova-Paez M., Dardis M. B., Goerigk L., J. Chem. Theory Comput. 2019, 15, 4735–4744. [DOI] [PubMed] [Google Scholar]
- 57. Rappoport D., Furche F., J. Chem. Phys. 2010, 133, 134105. [DOI] [PubMed] [Google Scholar]
- 58. Humphrey W., Dalke A., Sch K., ulten, J. Mol. Graphics 1996, 14, 33–38. [DOI] [PubMed] [Google Scholar]
- 59. Liu Z., Lu T., Chen Q., Carbon 2020, 165, 461–467. [Google Scholar]
Associated Data
This section collects any data citations, data availability statements, or supplementary materials included in this article.
Supplementary Materials
As a service to our authors and readers, this journal provides supporting information supplied by the authors. Such materials are peer reviewed and may be re‐organized for online delivery, but are not copy‐edited or typeset. Technical support issues arising from supporting information (other than missing files) should be addressed to the authors.
Supporting Information
Data Availability Statement
The data that support the findings of this study are available from the corresponding author upon reasonable request.