

Abstract
Chemical risk assessors use physiologically based pharmacokinetic (PBPK) models to perform dosimetric calculations, including extrapolations between exposure scenarios, species, and populations of interest. Assessors should complete a thorough quality assurance (QA) review to ensure biological accuracy and correct implementation prior to using these models. This process can be time-consuming, and we developed a PBPK model template that allows for faster, more efficient QA review. The model template consists of a single model “superstructure” with equations and logic commonly found in PBPK models, allowing users to implement a wide variety of chemical-specific PBPK models. QA review can be completed more quickly than for conventional PBPK model implementations because the general model equations have already been reviewed and only parameters describing chemical-specific model and exposure scenarios need review for any given model implementation. We have expanded a previous version of the PBPK model template by adding features commonly included in PBPK models for volatile organic compounds (VOCs). We included multiple options for representing concentrations in blood, describing metabolism, and modeling gas exchange processes to allow for inhalation exposures. We created PBPK model template implementations of published models for seven VOCs: dichloromethane, methanol, chloroform, styrene, vinyl chloride, trichloroethylene, and carbon tetrachloride. Simulations performed using our template implementations matched published simulation results to a high degree of accuracy (maximum observed percent error: 1%). Thus, the model template approach can now be applied to a broader class of chemical-specific PBPK models while continuing to bolster efficiency of QA processes that should be conducted prior to using models for risk assessment applications.
Keywords: PBPK model, template model, risk assessment, pharmacokinetics, VOCs
Physiologically based pharmacokinetic (PBPK) models facilitate chemical risk assessments by enabling dosimetric calculations. These mathematical models describe the disposition of a chemical in various parts of an animal’s body following exposure by accounting for absorption of the chemical, distribution of the chemical to different tissues and organs, and the ultimate elimination of the chemical from the body. Such models include parameters that describe anatomy and physiology of the animal and biochemical interactions and processes (including metabolism and preferential partitioning of the chemical into different tissue types). PBPK models can be used to predict the time course concentrations of a chemical in blood and specific tissues and organs. Chemical risk assessors use these models to extrapolate between different exposure scenarios, species, or populations of interest. However, before being used in risk assessment, a PBPK model should undergo a thorough quality assurance (QA) review (McLanahan et al., 2012). This involves evaluating the model’s structure, purpose, and mathematical description, as well as ensuring that the computer implementation of the model is accurate and that the model can reproduce experimental data with reasonable accuracy and precision (Clark et al., 2004; IPCS, 2010; U.S. EPA, 2018, 2020).
We have developed a PBPK model template to allow faster and more efficient implementation of PBPK models available through the U.S. Environmental Protection Agency’s (U.S. EPA) Environmental Dataset Gateway (https://doi.org/10.23719/1527967). The model template consists of a single model “superstructure” with equations and logic commonly used to perform PBPK simulations. This superstructure includes a wide variety of features so that many different types of PBPK models can be implemented using the template, but in general, not all features are needed when implementing a given model. The structure of a given chemical-specific PBPK model can be mapped to this superstructure with no loss of detail or accuracy in model simulations by setting parameter values which determine what parts of the superstructure are included or excluded. To perform a simulation, the user only needs to provide the appropriate parameter values and dosing scenario information in a pair of input spreadsheets. The model template code (which includes equations and logic underlying the model) has undergone a careful QA process (U.S. EPA, 2020), so when implementing a chemical-specific model, users do not need to perform a full QA review of the general equations. Rather, they can focus their review on whether the equations and logic they have selected for inclusion are appropriate to the PBPK model of interest and on verifying that the input spreadsheets contain accurate parameter values and dosing information to perform their desired simulations.
Other general PBPK models exist, but they do not seek to exactly reproduce chemical-specific models as does our PBPK model template. Rather, these models either attempt to approximate published models (Mumtaz et al., 2012a,b; Ruiz et al., 2011) or to enable pharmacokinetic (PK) simulations for chemicals for which published PBPK models aren’t available, using relatively simple, generic PBPK models that involve a relatively small number of parameters (Brightman et al., 2006; Jongeneelen and ten Berge, 2012; Jongeneelen and Ten Berge, 2011; Pearce et al., 2017). Many of these generic models are intended for screening purposes and they do not include the full set of features needed to implement a given chemical-specific PBPK model. For example, the Agency for Toxic Substances and Disease Registry has created a “PBPK model tool kit” that contains published models for environmental contaminants as well as a generic PBPK model for volatile organic compounds (VOCs) (Mumtaz et al., 2012a,b; Ruiz et al., 2010, 2011). These models are not capable of reproducing specific model results for published PBPK models but are simpler models intended for use by nonexperts. Other general PBPK models are paired with databases of physicochemical data to use when there are no in vivo data available to parameterize a chemical-specific model. Examples of these types of models include the PBPK models found in the R package httk (“High-Throughput Toxicokinetics”) (Pearce et al., 2017) or the model in IndusChemFate for volatile or semivolatile chemicals (Jongeneelen and ten Berge, 2012; Jongeneelen and Ten Berge, 2011). Our PBPK model template currently does not include a comparable database of model parameters−users of the template must enter model parameters and select specific model features to conduct PK simulations.
For the first version of the PBPK model template (Bernstein et al., 2021), we focused on reproducing results from published PBPK models for per- and polyfluoroalkyl substances (PFAS). We demonstrated that the template could be used to successfully reproduce simulation results from published PBPK models for five PFAS. We have since extended the capabilities of the PBPK model template to include features from a wider variety of chemical-specific PBPK models by focusing on PBPK models for volatile organic chemicals (VOCs). The model template was extended to allow for inhalation exposures, metabolism pathways not previously included, and a variety of different representations of blood compartments and gas exchange regions. We used the template to implement published models for seven VOCs: dichloromethane (DCM) (U.S. EPA, 2011), methanol (U.S. EPA, 2013), chloroform (Sasso et al., 2013), styrene (Ramsey and Andersen, 1984), and a general PBPK model from Yoon et al. (2007) for vinyl chloride, trichloroethylene (TCE), and carbon tetrachloride (CCl4). We were successful in reproducing simulation results for each of these models.
Materials and methods
All data processing and analyses described herein were performed using R version 4.0.2 (R Core Team, 2020) on a Dell Latitude 5300 2-in-1 computer running Microsoft Windows 10. The PBPK model template was implemented using the MCSim model specification language (Bois, 2009) and was subsequently translated into C and compiled for use in R. Input parameters and selections of model structure options for specific models are provided via Microsoft Excel files in a pair of input spreadsheets for (1) chemical- and species-specific model parameters and (2) exposure and dosing parameters for specific simulations. Scripts and relevant data files are available through the U.S. EPA’s Environmental Dataset Gateway (https://doi.org/10.23719/1527967).
A QA review was applied to the model template as well as the template versions of each of the considered published models. This review was performed according to the QA protocols for dosimetry models described by U.S. EPA (2020). This document covers the basic data collection and modeling methodologies for dosimetry and mechanism-based models, including PBPK models, and describes steps for completing and documenting QA review. For the PBPK model template, we assessed the biological plausibility of each of the included features and verified that all the equations and logic were implemented correctly within the full superstructure. For individual implementations of the model template, we verified that the correct input parameters were used and consistent with the original models and verified that the data (both the published model simulations and the published experimental observations) we used for comparisons with PBPK model template output were correctly extracted from the original publications.
Model structure
Bernstein et al. (2021) described a first version of the PBPK model template. That version included multiple generic tissue compartments, several options for describing fecal excretion, a kidney model that included urinary excretion and saturable reabsorption from the kidney filtrate, and oral and intravenous routes of exposure. We have extended the template to encompass a wide variety of chemical-specific PBPK models, and the new features are described herein. Figure 1 shows the superstructure for the PBPK model template, and a full listing of all equations in the model template can be found in the files available on the U.S. EPA’s Environmental Dataset Gateway (https://doi.org/10.23719/1527967) and default values for the parameters can be found in the Supplementary Materials.
Figure 1.
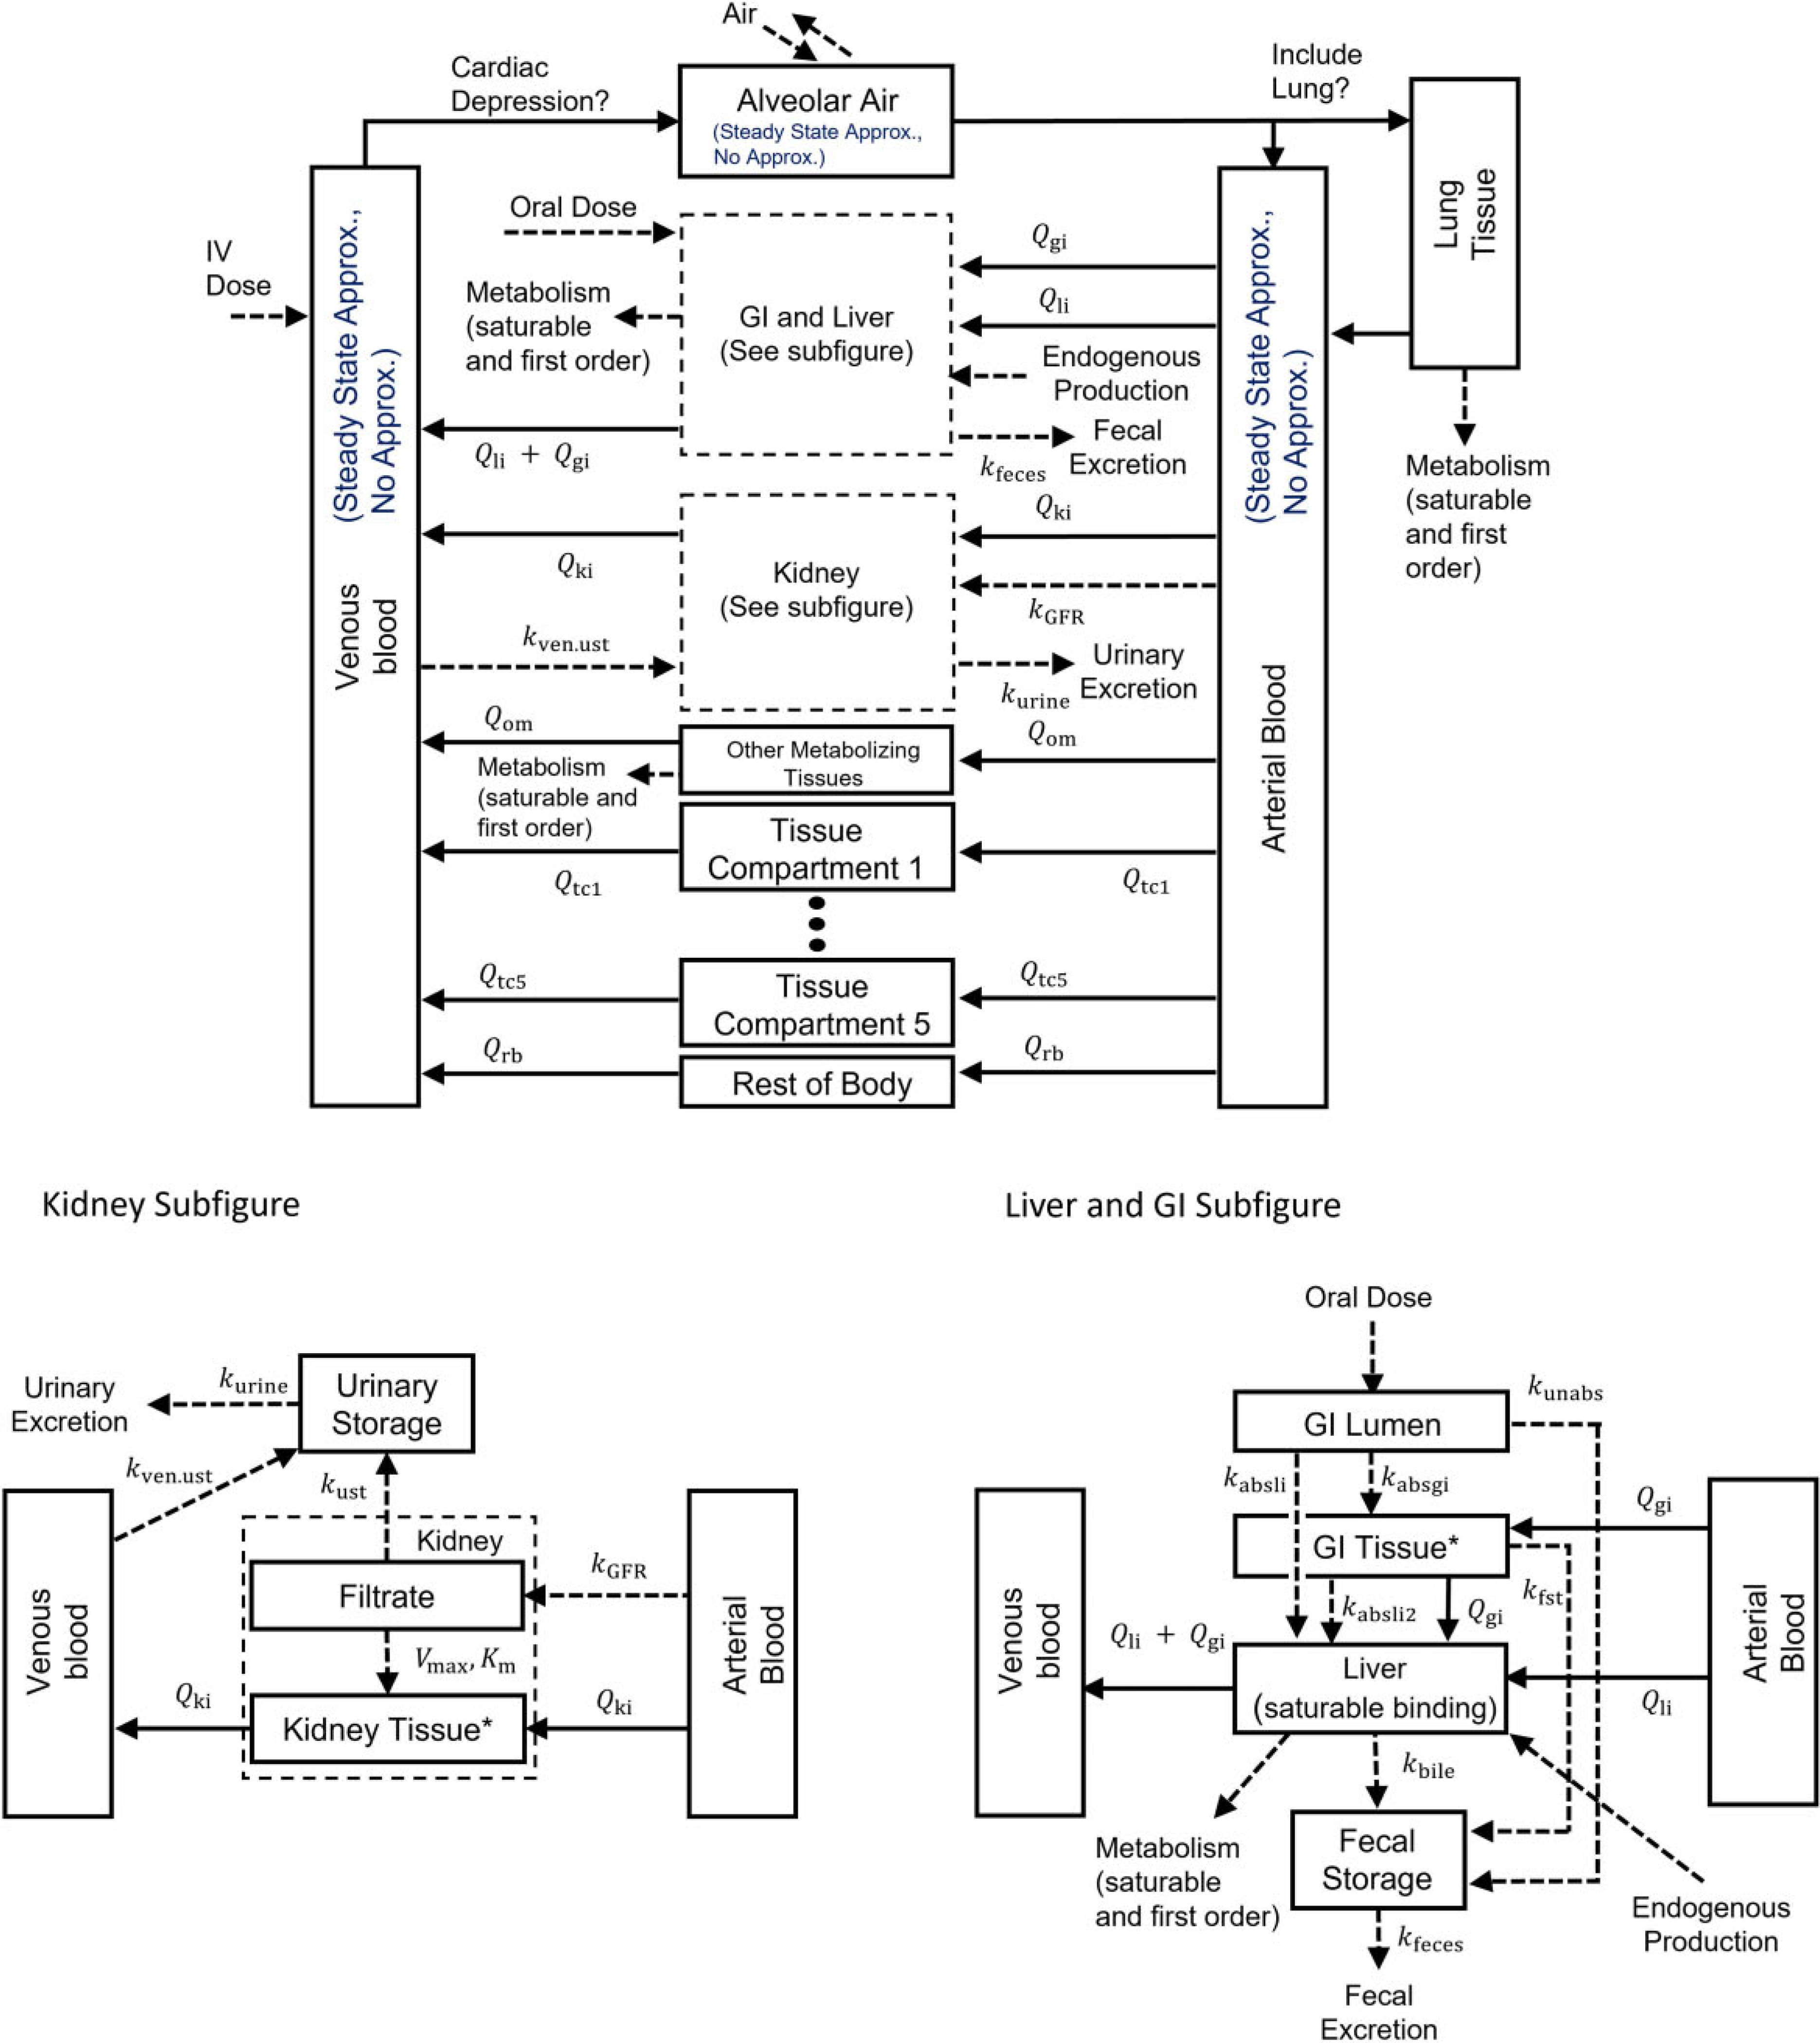
Model template superstructure for PBPK models. Chemical is introduced into the plasma (IV), the GI lumen (oral), or the alveolar air (inhalation).The absorbed fraction of an oral dose enters the GI tissue or the liver by a first-order absorption rate constant or , respectively, and chemical absorbed into the GI tissue is absorbed into the liver by a first-order absorption rate constant . Note, by setting the GI blood flow to zero, the “GI Tissue” compartment can be used to represent a second GI compartment. The unabsorbed fraction enters the fecal storage compartment by a first-order rate constant . Chemical can also pass to the fecal storage compartment from the GI tissue by the first-order rate constant or from the liver by the first-order rate constant . The kidney is separated into the filtrate compartment and the tissue compartment. Chemical enters the filtrate from the plasma by a first-order rate constant , and, once in the filtrate compartment, chemical can be reabsorbed by a saturable process with maximum transport rate and affinity constant or eliminated to the urinary storage compartment by a first-order rate constant . Chemical can also be eliminated to the urinary storage compartment from the venous blood by a first-order rate constant . Chemical is eliminated from the fecal and urinary storage compartments by first-order rate constants and , respectively. is the plasma flow rate between plasma and tissue . Tissue compartments 1–5 are basic tissue compartments without metabolism, facilitated transport, or saturable binding processes. Saturable and first-order metabolic pathways are included in the liver, lung, and other metabolizing tissue compartments. A zero-order production rate is included in the liver to model endogenous production or background exposures to the chemical. A cardiac depression term is included that is based on the concentration in the rest of body compartment. Venous blood, arterial blood, and gas exchange in the alveolar air can each be modeled with or without a steady state approximation, and the lung compartment can be optionally excluded as an explicit compartment if using the steady state approximation for the gas exchange process. Additional information and a listing of all parameters included in the template are available in the Supplementary Materials.
Blood compartment models
In the previous version of the template, Bernstein et al. (2021) used a single compartment to represent combined arterial and venous blood outside of the tissue compartments. The current version of the template retains this option while also allowing for separate venous and arterial blood compartments. Using two compartments for the blood enables certain new model capabilities, including inhalation uptake, and the user indicates whether one or two blood compartments should be used in the model parameter input spreadsheet. Furthermore, if using the option to have separate venous and arterial blood compartments, one can choose to model substance concentration in those compartments using a steady-state approximation described by algebraic equations or avoid the steady-state approximation by modeling substance mass in those compartments using state variables described by differential equations. Both options are commonly seen in published PBPK models, and thus both are included in the model template.
Gas exchange
To model inhalation exposures, the model template includes multiple options for standard gas exchange models. Gas exchange can be modeled with a steady-state approximation that uses an algebraic equation to describe the concentration of chemical in the pulmonary vein. In this case, the modeler can also choose whether to explicitly include the lung tissue compartment, and if not, the concentration in the pulmonary vein will go directly to the arterial blood compartment (cf. Fig. 1). Alternatively, gas exchange can be modeled without using an approximation of the concentration in the pulmonary vein and instead be described with a differential equation in which terms for the rate of inhalation and exhalation are included within the lung compartment. In either case, the user can also set the fraction of inhaled chemical that is absorbed into blood as an empirical adjustment for wash-in/wash-out effects.
Metabolism
The PBPK model template includes both saturable and first-order metabolism pathways (Campbell et al., 2012) in multiple compartments to accommodate multiple sites of metabolism. Saturable pathways are included in the liver and lung compartments, which are commonly considered as sites of metabolism in PBPK models, as well as in a generic compartment called “other metabolizing tissues.” For example, this compartment could be used to represent the kidney cortex when metabolism occurs there. The rates (mg/h) at which the chemical is metabolized via a saturable pathway are given by
where for each compartment (“li” for liver, “lu” for lung, and “om” for other metabolizing tissues), is the maximum metabolic rate constant in the compartment (mg/h), is the affinity constant for this pathway in the compartment (mg/l), is the concentration of chemical in the compartment (mg/l) at time , and is the equilibrium ratio (partition coefficient) for concentrations in the relevant tissue versus blood. The maximum metabolic rate constant is scaled allometrically by body mass with a default exponent of 0.75 and the exponent can be set by the user in the model parameters input spreadsheet. Additionally, first-order metabolic pathways are available for each of these compartments. The first-order rates (mg/h) at which chemical is metabolized are given by
where for each compartment (“li” for liver, “lu” for lung, and “om” for other metabolizing tissues), is the first-order metabolic rate constant in the compartment (1/h) and is the volume of the compartment (l). The first-order metabolic rate constant is also scaled allometrically by body mass with a default exponent of −0.25, and the user can specify a different value for the exponent in the model parameters input spreadsheet.
Endogenous production and background exposure rates
Some models include a known background exposure rate or an endogenous rate of production of chemical, and we have included options to address both situations within the model template. The user can specify a measured venous blood concentration, and the model template will automatically compute a corresponding zero-order rate of production in the liver (where we assume all endogenous production occurs) that produces the given measured concentration at steady state. Alternatively, in the case that the user knows the endogenous rate of production in the liver, they can directly specify that quantity for use in the model. While we recognize that endogenous production can occur outside the liver and that observed baseline internal concentrations sometimes result from external background exposures rather than endogenous production, treating the liver as the “source” is in most cases a reasonable approximation. For example, for dietary background exposures, it is reasonable to treat the liver as the “source” because chemical ingested orally would first appear in the body in the liver, where it would arrive via the portal vein upon absorption from the gastrointestinal (GI) tract.
To compute a zero-order rate of production in the liver based on a known venous blood concentration, we solve an optimization problem. We set parameters describing the exposure or dose to zero so that the only source of chemical for the organism is the (hypothetical) endogenous liver production. Then, we determine the rate of production that results in the specified venous blood concentration at steady state. Whether determined by the optimization calculation or provided directly by the user, the production rate parameter is used in a simulation with no additional external exposure to the chemical to determine the steady-state values for all state variables (ie, amounts of chemical in each compartment at steady state). These steady-state values are then used as the initial conditions for exposure scenario simulations.
Cardiac depression
We included a term for cardiac depression to model situations in which increased concentrations of chemical within the body cause decreased respiration and cardiac output rates following the approach described in Appendix B of U.S. EPA (2013). We first calculate a cardiac depression factor as
where is the concentration in the “rest of body” compartment (mg/l), is the equilibrium ratio (partition coefficient) for concentration in the “rest of body” compartment versus blood, is the inhibition constant, and is an empirically determined constant. The cardiac output is then calculated as
where is the undepressed cardiac output (l/h).
Enzyme loss and resynthesis
Enzyme loss and resynthesis terms were included to accommodate models in which loss of enzyme activity by suicide inhibition (proportional to the rate of metabolism) is considered. The equations that model these phenomena were used in an approach described by Sasso et al. (2013) based on a PBPK model developed by Corley et al. (1990). Metabolizing enzyme loss rates (mg/h2) are calculated as
where is the rate constant for enzyme destruction (l/mg), and for each compartment (“li” for liver, “lu” for lung, and “om” for other metabolizing tissues), is the time-dependent maximum metabolic rate in the compartment (mg/h), is the volume of the compartment (l), and is the rate of saturable metabolism in the compartment (mg/h) (Sasso et al., 2013). Along with the enzyme resynthesis rate, the enzyme loss rate is then used to calculate the time rates of change for the maximum metabolic rates
where is the metabolizing enzyme resynthesis rate constant (1/h) for each compartment (“li” for liver, “lu” for lung, and “om” for other metabolizing tissues), is a “set point” level of enzyme activity for which there is no resynthesis of enzymes in the compartment (mg/h) (and it is the enzyme activity level that the body attempts to maintain), is the time-dependent maximum metabolic rate in the compartment (mg/h), and is the metabolizing enzyme loss rate in the compartment (mg/h2) (Corley et al., 1990; Sasso et al., 2013).
Urinary excretion
In the first version of the PBPK model template, urinary excretion was modeled as a process that moves the substance from the kidney filtrate compartment to a bladder compartment and then to an “excreted” compartment (as urine). For this initial option, the substance is first moved from the arterial blood to the filtrate compartment, corresponding to the physiological process of glomerular filtration, from where a portion of the substance may be resorbed to the kidney tissue via a saturable process. The template now also includes an option to model urinary excretion as a process that removes substance from the venous blood compartment. Some PBPK models, including the model for methanol considered herein, describe urinary excretion in this latter way (Loccisano et al., 2011; U.S. EPA, 2013).
Reproducing published results
Using the model template, we recreated simulations from the published versions of PBPK models for DCM (U.S. EPA, 2011), methanol (U.S. EPA, 2013), chloroform (Sasso et al., 2013), and styrene (Ramsey and Andersen, 1984), as well as a general PBPK model from Yoon et al. (2007) that simulates exposure to vinyl chloride, TCE, and CCl4.We first mapped the published models to the template by comparing the corresponding model equations (from the published model and the template) and identified the features necessary to implement each model. For features, compartments, or pathways in the template that were not included in the original PBPK model, the corresponding first-order rate constants or blood flow rates were set to zero. The mapping of the DCM and methanol published models to the template superstructure is shown in Figure 2 and the mapping of each of the other published models to the template superstructure is shown in Supplementary Figure 2. Lighter colored arrows, boxes, and text show which features, tissues, and pathways were unused in each implementation.
Figure 2.

Mapping published PBPK model structures to the model template superstructure. To implement a published model using the PBPK model template, the existing structure must be mapped onto the model template superstructure by setting the appropriate parameters. For each of the published models, we set unused parameters to zero, and for unused compartments we set the blood flow for that compartment to zero. Each mapping is shown here by using lighter colored arrows, boxes, and text for parameters and compartments that are “switched off” or set to zero for (A) the DCM model of U.S. EPA (2011) and (B) the methanol model of U.S. EPA (2013). Mapping diagrams for the chloroform model of Sasso et al. (2013), the styrene model of Ramsey and Andersen (1984), and the general VOC model of Yoon et al. (2007) are shown in Supplementary Figure 2.
Once we completed the mapping for a published model, we used that information to populate the pair of input spreadsheets for (1) chemical- and species-specific model parameters and (2) exposure and dosing parameters for specific simulations. Example images of these spreadsheets are shown in Supplementary Figure 1. The first section of the model parameter input spreadsheet contains a series of flags (“Y,” “N,” “1,” or “2”) that are set to determine what options are used for representing blood and gas exchange. The second section of the spreadsheet contains the specific parameter values to be used. The exposure parameter spreadsheet contains information necessary for specific exposure simulations. However, some scenarios will need additional information provided in the scripts that run the model simulations, such as tables for changing body weights over time or the proportion of dose consumed at each time point for a drinking water exposure. After creating the input spreadsheets, we wrote R scripts to perform the desired simulations and analysis. Details of the spreadsheets and R scripts including additional examples and all the necessary files to use the model template software can be found in the files available on the U.S. EPA’s Environmental Dataset Gateway (https://doi.org/10.23719/1527967).
To evaluate the ability of the template to reproduce results from simulations with the original models, we considered the absolute percent error between the simulation values obtained using the model template implementation and the original implementation. For models for which we had access to the original model simulation values, we computed such errors as
where is the output value generated using the original implementation and is the output value generated using the PBPK model template implementation. If the absolute difference between and was less than 10−6, the absolute and relative error tolerance of the numerical integration algorithm used for the template simulations, then we did not compute the percent difference and took the error to be nominally zero instead. For models for which we did not have access to the original model simulation values, we digitized the published model simulations and data points using WebPlotDigitizer (Rohatgi, 2022). We then considered the absolute percent error between the simulation values obtained using the model template implementation and the original implementation relative to the maximum ordinate (“y”) value of a given digitized figure from published simulation results. We computed such errors as
where is the largest labeled value on the ordinate axis of the digitized figure.
DCM model
The U.S. EPA (2011) PBPK model for DCM, which is based on the PBPK model of Andersen et al. (1991), was mapped to the model template as shown in Figure 2A (subfigure mapping is shown in the Supplementary Materials). We set the parameters for three of the general tissue compartments to the values given for the fat, slowly perfused tissues, and richly perfused tissues, and the other two general tissue compartments were omitted from the model by setting the blood flow to them to zero (the default value). Similarly, the blood flows to the kidney compartment and the other metabolizing tissues compartment in the PBPK model template implementation were set to zero so that these compartments were effectively excluded. We also set blood flow through the GI tissue to zero, though the GI lumen was included as the route of entry for oral exposure with a pathway for transport of chemical directly (ie, not via blood flow) to the liver. The DCM PBPK model does not include terms for fecal or urinary excretion, so all parameters related to those features were also set to zero. Metabolism was included in the model using both the saturable and first-order pathways in the liver and lung compartments. We used the option to model blood using separate venous and arterial blood compartments and used the steady state approximation for each. To model gas exchange, we used the steady state approximation to determine the amount of chemical in the pulmonary vein (cf. the “Alveolar Air” compartment in Fig. 2A) from which substance flows into the lung tissue compartment. These options and features were selected to create a model template implementation that matches the original model implementation.
Methanol model
The U.S. EPA (2013) PBPK model for methanol, which is based on the PBPK model of Ward et al. (1997), was mapped to the PBPK model template as shown in Figure 2B (subfigure mapping is shown in the Supplementary Materials). We set the parameters for one of the general tissue compartments to match those values used for the fat compartment in the original model, and the remaining general tissue compartments were omitted by setting the blood flows to them to zero. We also set the blood flows to the kidney and other metabolizing tissue compartments to zero as they are unused in this model. The blood flow to the GI tissue was set to zero, though the GI lumen and GI tissue compartments were still used for modeling the absorption of chemical to the liver during oral exposures. In effect, the “GI tissue” compartment represents a second stage of the GI lumen with these settings.
Depending on the exposure scenario, we used both 1-compartment and 2-compartment GI absorption pathways (cf. liver and GI subfigure of Fig. 1) in order to match the published simulation results, and the absorption parameters between the “GI lumen” (mapped from the “stomach” compartment in the published model), “GI tissue” (mapped from the “2nd GI” compartment in the published model), and “liver” compartments were set appropriately. We also mapped the “body” compartment in the published model to the “rest of body” compartment in the model template by setting the values of the corresponding parameters to match those used in the published model. The methanol model does not include fecal elimination, so all related rate constants were set to zero. The methanol model assumes urinary excretion is dependent on the concentration in venous blood, so we set the urinary excretion rate constant (cf. kidney subfigure of Fig. 1) to the appropriate value and set the rate constant for urinary excretion from the kidney filtrate compartment to zero. For human simulations, the urinary storage compartment was also included and the corresponding rate constant for the flow of substance out of the urinary storage compartment was set to the value used in the published model. Liver metabolism was included in the model by setting the parameters for the saturable pathway in the liver compartment, and metabolic pathways for the lung and other metabolizing tissues (as well as the first-order pathway in the liver) were unused and corresponding rate parameters were set to zero.
To reproduce the endogenous production described in the published methanol model, we also included an endogenous production term in the differential equation describing the rate of change of the amount of methanol in the liver. The appropriate value for the endogenous production rate parameter was determined using a steady state concentration in the venous blood. Following the methanol PBPK modeling methods of U.S. EPA (2013), we used cardiac depression for rat simulations but not for human simulations. The published methanol model did not use steady state approximations for the venous and arterial blood or to model gas exchange and included an explicit lung tissue compartment; therefore, we set the PBPK model template to describe these compartments using the differential equations as was done in the original U.S. EPA (2013) implementation.
Chloroform model
The Sasso et al. (2013) PBPK model for chloroform was mapped to the PBPK model template as shown in Supplementary Figure 2C. In this case, we matched the model template parameters to the parameters reported by Sasso et al. (2013) for the following general tissue compartments: slowly perfused tissues, richly perfused tissues, and adipose (fat) tissues. Sasso et al. (2013) modeled the kidney using a medulla compartment and a cortex compartment; to match this model design, we represented the medulla using the general kidney compartments (cf. Supplementary Fig. 2C) and the cortex using the “other metabolizing tissues” compartment. This allowed us to easily include saturable metabolism in the kidney cortex. As with the DCM and methanol models, the remaining unused general tissue compartments were turned off by setting blood flows to those compartments to zero. Urine and fecal elimination were not included in the published model, and so we excluded these elimination routes by setting the corresponding rate constants to zero. The Sasso et al. (2013) PBPK model included oral and inhalation routes of exposure, and we set the parameters corresponding to these routes of exposure to the published values in our template implementation. The model assumes saturable metabolism in the liver and kidney cortex and uses a steady state gas exchange approximation with no explicit lung tissue compartment. For the PBPK model template implementation, we used the option for separate venous and arterial blood compartments and used the steady state approximations for each of these compartments to match the original model implementation. Enzyme resynthesis and destruction was included in the liver and other metabolizing tissue compartments for simulations of chloroform inhalation studies in mice as was done in the original Sasso et al. (2013) implementation.
Styrene model
We mapped the Ramsey and Andersen (1984) PBPK model for styrene to the PBPK model template with the mapping shown in Supplementary Figure 2D. We set the parameter values for three of the general tissue compartments to those for fat, muscle, and richly perfused tissues, and the remaining general tissue compartments were omitted by using blood flow values of zero (the default value) for those compartments. Likewise, blood flows to the kidney, other metabolizing tissues, and GI tissue compartments were set to zero to exclude them. The styrene model does not include any urinary or fecal excretion terms, so the corresponding rate constants were set to zero. Metabolism via the saturable pathway was included in the liver compartment and the corresponding parameter values were set to appropriate values (provided by Ramsey and Andersen, 1984) while all other metabolism pathways were excluded. To match the original published model, we selected the options for the steady state approximations for venous and arterial blood and for gas exchange in the alveolar air region, and we included an explicit lung tissue compartment.
Yoon et al. (2007) VOC model
The Yoon et al. (2007) PBPK model for VOCs was mapped to the PBPK model template as shown in Supplementary Figure 2E. This mapping was the same for vinyl chloride, TCE, and CCl4; only the chemical-specific tissue-to-blood partition coefficients and values of the metabolic parameters differed for these three models. We set the parameter values for four of the general tissue compartments to those for slowly perfused tissue, fat, brain, and rapidly perfused tissue. The remaining general tissue compartment and the rest of body compartment were omitted by setting the blood flows to them to zero. In order to include extrahepatic metabolism in the kidneys, we set the parameter values for the other metabolizing tissues compartment to those used for the kidneys in the Yoon et al. (2007) model, including the saturable pathway for metabolism. Then, the “kidney” compartment of the model template was omitted by setting the blood flow and the glomerular filtration rate to zero. We also set the parameters for the GI tissue, liver, and lung compartments to those used by Yoon et al. (2007), including metabolism via the saturable pathway for both the liver and lungs. The Yoon et al. (2007) model does not include any urinary or fecal excretion terms, so the corresponding rate constants were set to zero. The published model used steady state approximations for the venous and arterial blood concentrations as well as for modeling gas exchange, so we used the appropriate corresponding options in the model template implementation.
Results
DCM model
Using the PBPK model template, we recreated simulation results reported by U.S. EPA (2011) for rats and mice exposed to DCM.
We simulated male rats and mice exposed to various levels of DCM in drinking water for two years and calculated the amount of chemical metabolized by the saturable (CYP) and first-order (GST) metabolism pathways at each dose level for comparison with the published results of U.S. EPA (2011). The template implementation results matched the published results to within 0.02% indicating that we successfully reproduced the model simulations. Supplementary Tables 1 and 2 contain a full listing of these simulation results. Note, for these simulations, the proportion of dose consumed at each time point during the day was provided in scripts rather than via the input spreadsheets.
Figure 3 shows simulation results for male rats exposed to three different concentrations of DCM (ranging from 100 to 1000 ppm) via inhalation in a closed chamber. The simulation output from the template implementation matched the published output to within 5 × 10⁻⁴%, indicating the template version accurately replicated the published result.
Figure 3.
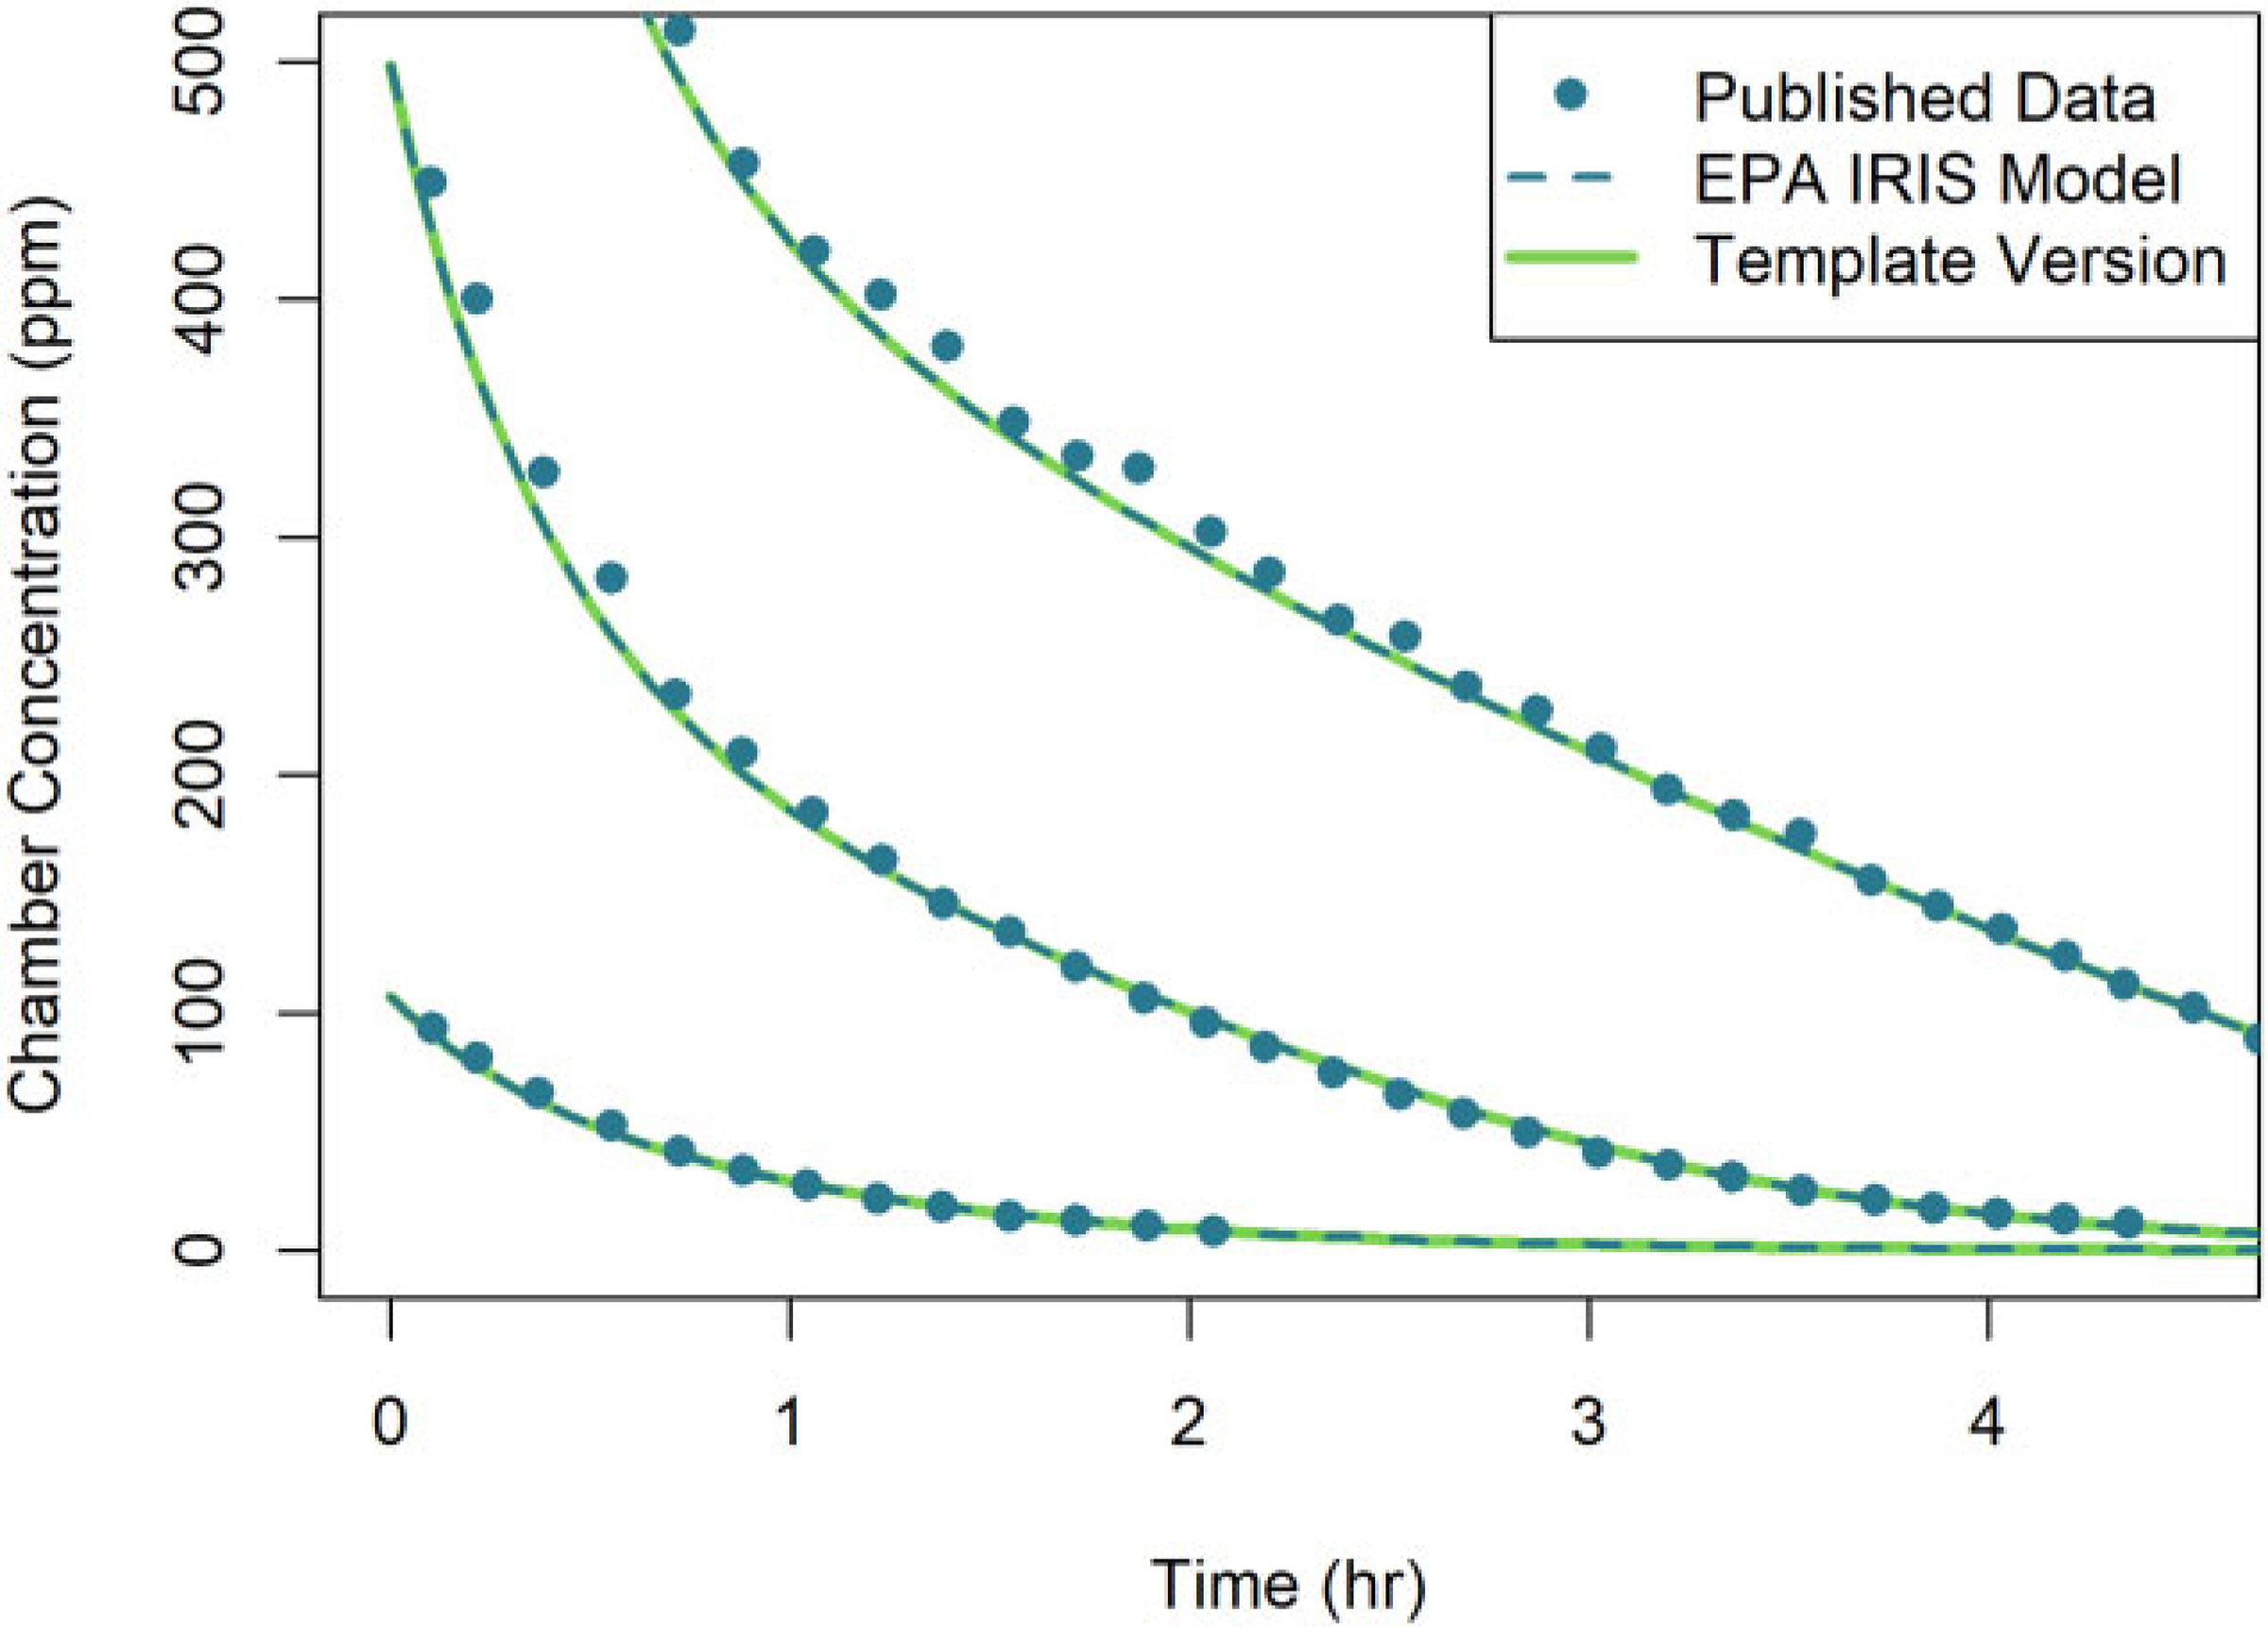
Comparison of simulation results obtained using two different implementations of the U.S. EPA (2011) PBPK model for DCM: (1) the original U.S. EPA (2011) (or “EPA IRIS Model”) implementation (dashed lines) and (2) the PBPK model template implementation (solid lines). Results are shown for the respiratory uptake by three rats in a closed-chamber exposed to three concentrations of DCM (107, 498, and 1028 ppm). Simulation results from the original U.S. EPA (2011) implementation and published data of Gargas et al. (1986) (points) were obtained from Figure C-3 of U.S. EPA (2011). Note that the respective predictions from each model implementation are nearly indistinguishable visually.
Methanol model
Using the PBPK model template implementation of the methanol model, we reproduced published simulations of U.S. EPA (2013) for rats and humans. Figure 4 shows a comparison of simulation results from the template implementation of the methanol model and the original model implementation for female Sprague-Dawley rats exposed to a constant concentration of methanol for 8 h with exposure concentrations ranging from 100 to 20 000 ppm. The simulation output from the template implementation matched the published output to within 6 × 10⁻⁴%, indicating the template version accurately replicated the published result. Additional simulation results for the same exposure scenario at a larger number of concentrations (from 100 to 20 000 ppm) are shown in the Supplementary Materials.
Figure 4.

Comparison of simulation results obtained using two different implementations of the U.S. EPA (2013) PBPK model for methanol: (1) the original U.S. EPA (2013) (or “EPA IRIS Model”) implementation (dashed lines) and (2) the PBPK model template implementation (solid lines). Results are shown for the venous blood concentration of female rats exposed to five constant concentration levels of methanol (ranging from 1000 to 20 000 ppm) for 8 h. Simulation results from the original U.S. EPA (2013) implementation and published data of Perkins et al. (1996) (points) were obtained from Figure B-4, Panel A, of U.S. EPA (2013). Note that the respective predictions from each model implementation are nearly indistinguishable visually.
Figure 5 shows a comparison of simulation results obtained using the template implementation of the model and the published model for female Sprague-Dawley rats given a single oral dose of 100 mg of methanol per kg of body mass (100 mg/kg). The published model was implemented using both a 1-compartment GI model and a 2-compartment GI model, so we implemented each of the GI models using the template to compare with both sets of simulation results. Simulation outputs from the template implementation of the model matched the published model simulations within 5 × 10⁻⁵% for the 2-compartment GI model and within 0.003% for the 1-compartment GI model.
Figure 5.
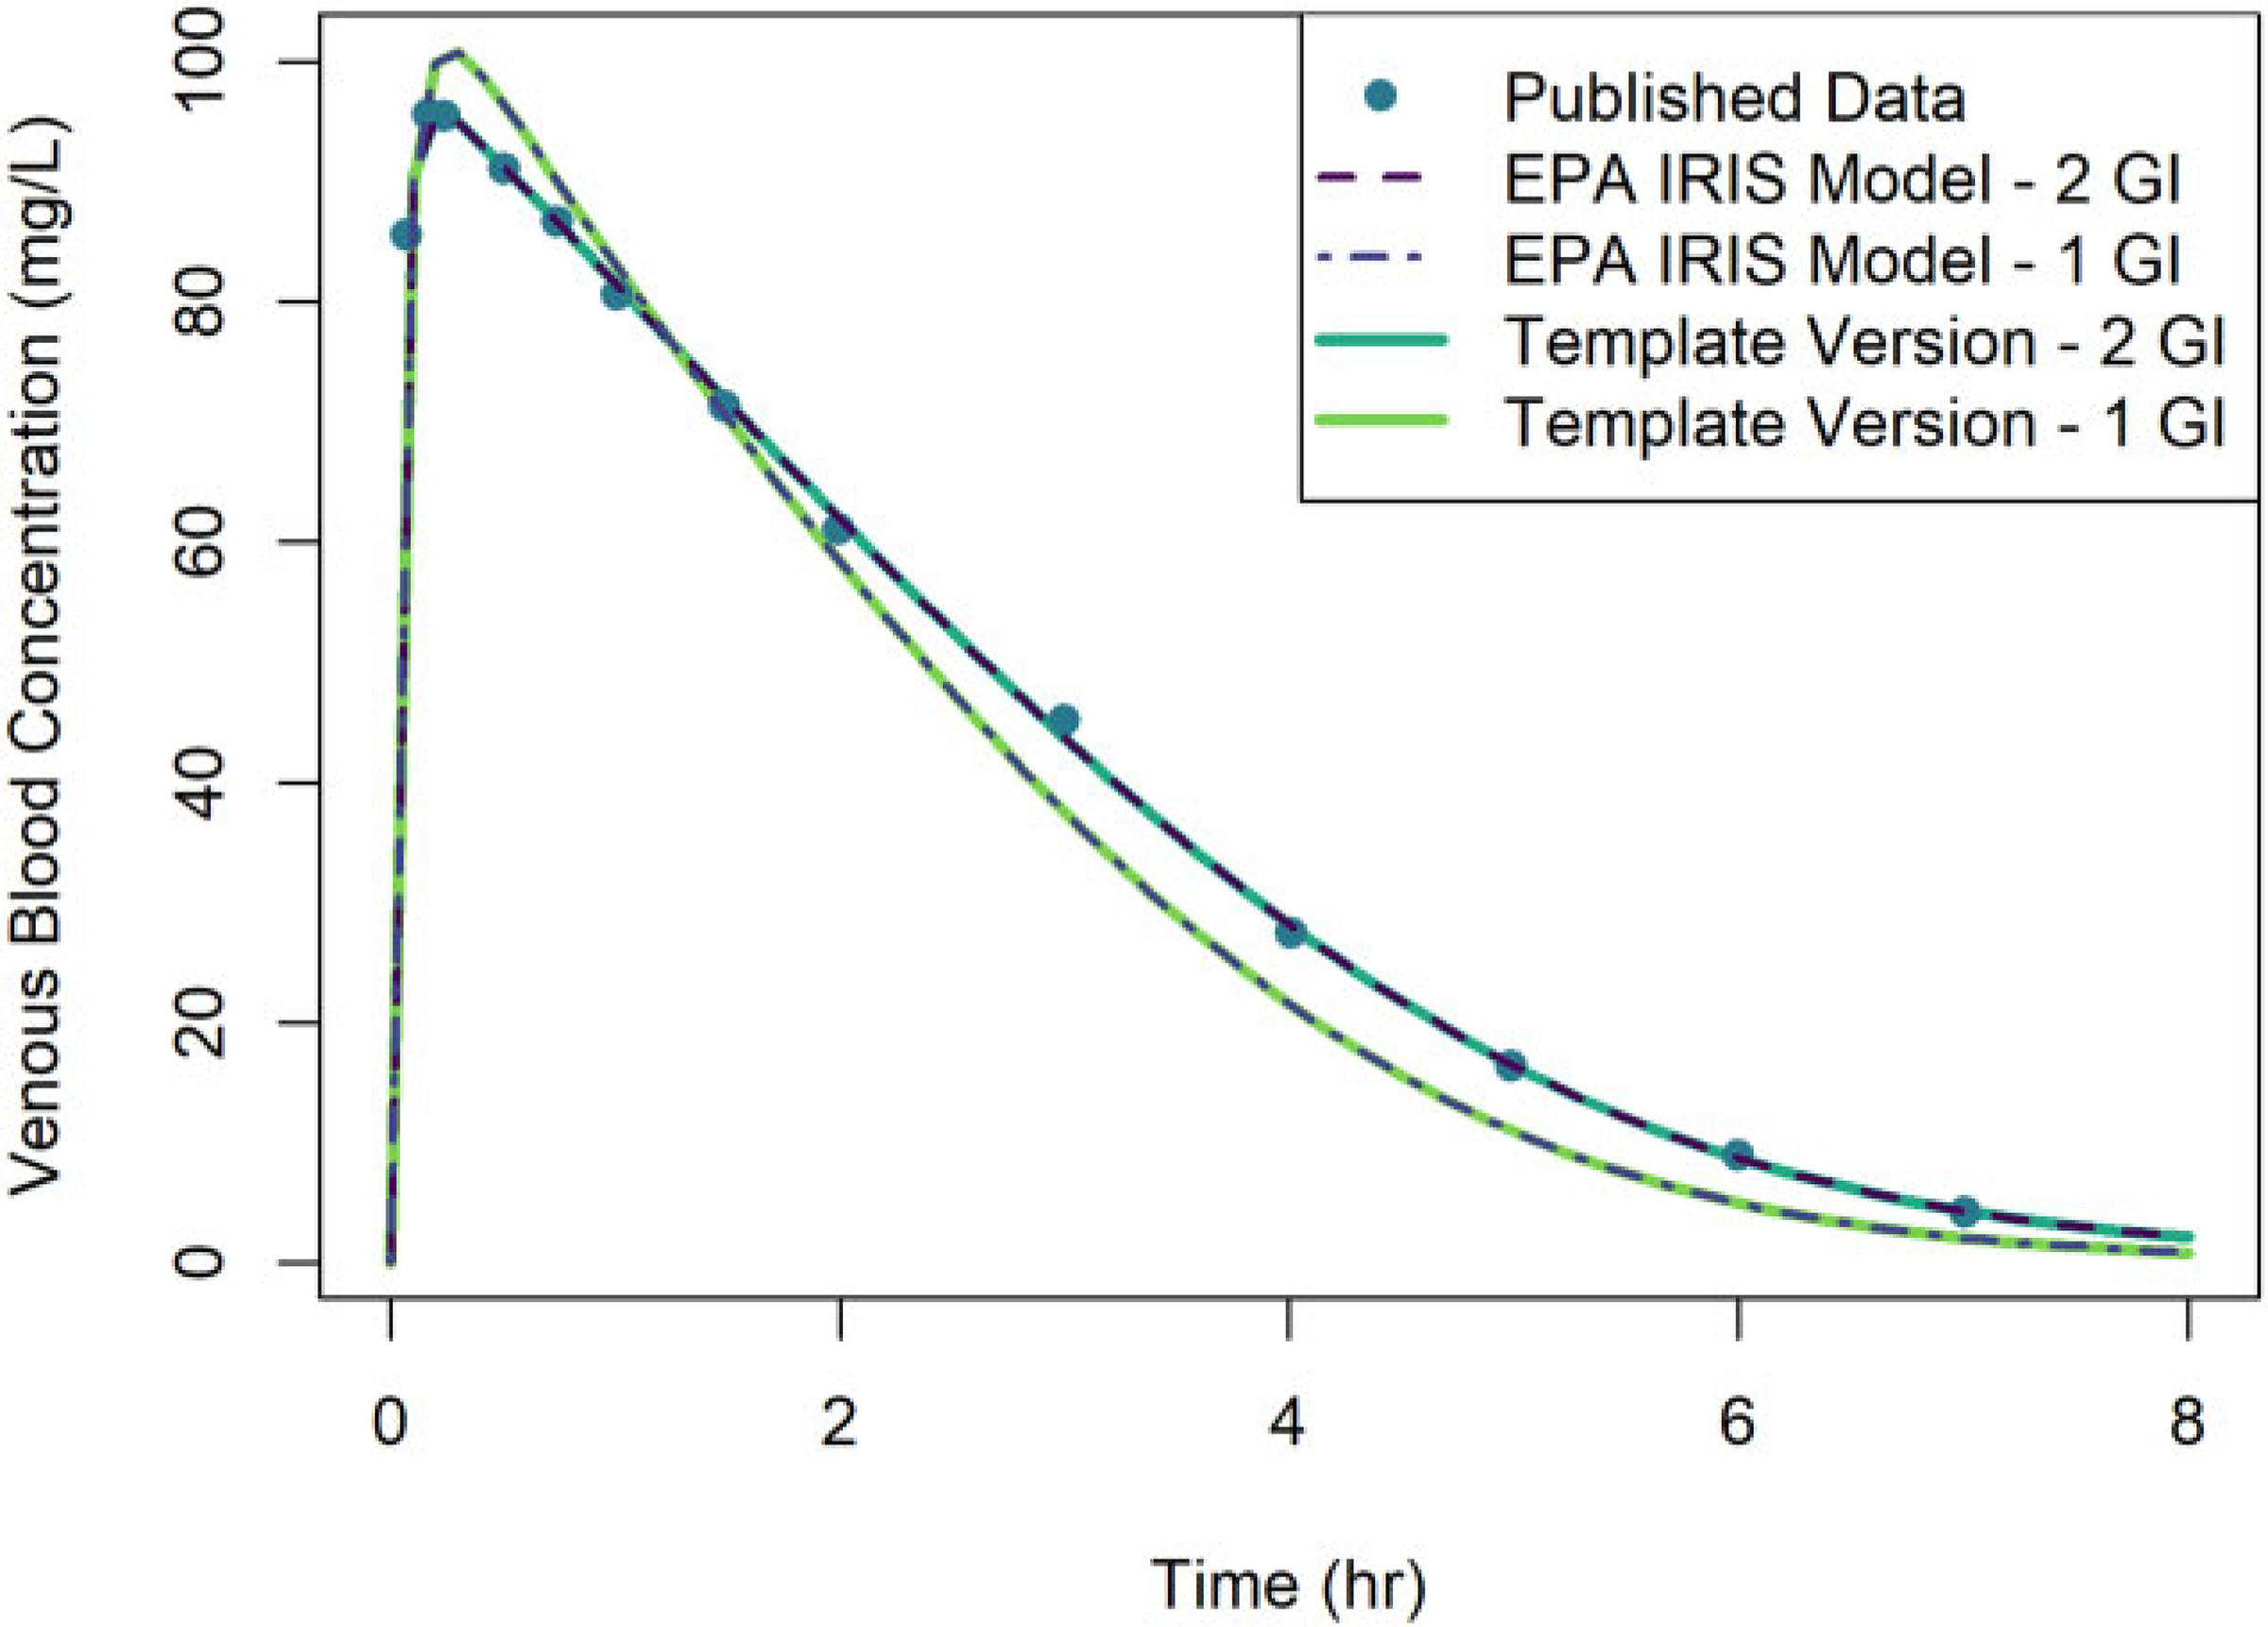
Comparison of simulation results obtained using two different implementations of the U.S. EPA (2013) PBPK model for methanol: (1) the original U.S. EPA (2013) (or “EPA IRIS Model”) implementation (dashed lines) and (2) the PBPK model template implementation (solid lines). Results are shown for the venous blood concentration of rats given a single oral dose of 100 mg/kg of methanol. Simulations were performed using both a 1-compartment model for the GI tract and a 2-compartment model. Simulation results from the original U.S. EPA (2013) implementation and published data of Ward et al. (1997) (points) were obtained from Figure B-5 of U.S. EPA (2013). Note that the respective predictions from each model implementation are nearly indistinguishable visually.
Using the template implementation of the model, we performed simulations of humans exposed to multiple concentrations of methanol via inhalation for 8 h and compared with published simulations by U.S. EPA (2013) as shown in Figure 6. The simulation results obtained from the model template implementation matched the published results to within 7 × 10⁻⁴%, indicating the model template simulations accurately replicated the published results.
Figure 6.

Comparison of simulation results obtained using two different implementations of the U.S. EPA (2013) PBPK model for methanol: (1) the original U.S. EPA (2013) (or “EPA IRIS Model”) implementation (dashed lines) and (2) the PBPK model template implementation (solid lines). Results are shown for simulations of humans exposed to three concentrations of methanol in inhaled air (78, 157, and 231 ppm). Simulations from the original U.S. EPA (2013) implementation and published data of Sedivec et al. (1981) (points) were obtained from Figure B-8 (top panel) of U.S. EPA (2013). Note that the respective predictions from each model implementation are nearly indistinguishable visually.
Figure 7 shows a comparison of simulation results from the template implementation and the published model for humans given a single oral dose of 10 mg of methanol per kg of body mass (10 mg/kg). The simulation output from the template implementation matches the published simulation output with an absolute difference less than 10−6, indicating accurate replication of the exposure simulation.
Figure 7.

Comparison of simulation results using two different implementations of the U.S. EPA (2013) PBPK model for methanol: (1) the original U.S. EPA (2013) (or “EPA IRIS Model”) implementation (dashed line) and (2) the PBPK model template implementation (solid line). Results are shown for venous blood concentrations of methanol for humans given a bolus oral dose of 10 mg/kg of methanol. Simulations from the original U.S. EPA (2013) implementation and published data of Schmutte et al. (1988) (points) were obtained from Figure B-11 of U.S. EPA (2013). Note that the respective predictions from each model implementation are nearly indistinguishable visually.
We performed a simulation of humans given an intravenous (IV) injection of 10 mg of methanol per kg of body mass (10 mg/kg) over a period of 10 min and compared with the published simulation results as shown in Figure 8. The simulation results from the template implementation match the published simulation results to within 3 × 10⁻⁵%.
Figure 8.

Comparison of simulation results using two different implementations of the U.S. EPA (2013) PBPK model for methanol: (1) the original U.S. EPA (2013) (or “EPA IRIS Model”) implementation (dashed line) and (2) the PBPK model template implementation (solid line). Results are shown for venous blood concentrations of methanol for humans exposed to an IV dose of 10 mg/kg of methanol given over a period of 10 min. Simulations from the original U.S. EPA (2013) implementation and published data of Haffner et al. (1992) (points) were obtained from Figure B-13 of U.S. EPA (2013). Note that the respective predictions from each model implementation are nearly indistinguishable visually.
Chloroform model
Using the template implementation of the chloroform PBPK model, we reproduced a model from Sasso et al. (2013) that considered two different simulations that were performed using different exposure scenarios. The first Sasso et al. (2013) simulation was based on a series of experiments by Take et al. (2010), wherein 18-week-old F344/DuCrj SPF male rats were administered chloroform through a simultaneous oral dosing and inhalation exposure. Figure 9 shows the simulation results for rats administered a single oral dose of 55 mg of chloroform per kg of body mass (55 mg/kg) and concurrently exposed to a constant air concentration of 100 ppm of chloroform for 360 min. The template implementation matched the published model with an absolute difference less than 10−6, indicating accurate model replication. Separate oral and inhalation doses were also administered, and results from running simulations from these experiments can be found in the Supplementary Materials.
Figure 9.

Comparison of simulation results using two different implementations of the chloroform PBPK model of Sasso et al. (2013): (1) the original Sasso et al. (2013) implementation (dashed line) and (2) the PBPK model template implementation (solid line). Results are shown for venous blood, fat, liver, and kidney chloroform concentrations for rats given an oral bolus dose of 55 mg/kg of chloroform and simultaneously exposed to a constant concentration of 100 ppm of chloroform for 360 min. Simulations from the original Sasso et al. (2013) implementation and published data from Take et al. (2010) (points) were obtained from Figure 3 of Sasso et al. (2013). Note that the respective predictions from each model implementation are nearly indistinguishable visually.
Another simulation from Sasso et al. (2013) was based on a series of closed-chamber experiments by Corley et al. (1990) that exposed mice to three different concentrations of chloroform (ranging from 1000 to 5000 ppm), and simulation results obtained using the template implementation and the original implementation are shown in Figure 10. Sasso et al. (2013) ran simulations using two sets of parameters: (1) those that were used by Corley et al. (1990) and (2) those that included “updated” parameters compiled by Sasso et al. (2013). A full list of parameters is given in the Supplementary Materials. The absolute difference between the simulation results obtained from the template implementation and the original implementation was less than 10−6 in each case, indicating accurate model replication. An experiment involving rats in an inhalation chamber was also simulated; results can be found in the Supplementary Materials.
Figure 10.

Comparison of simulation results using two different implementations of the chloroform PBPK model of Sasso et al. (2013): (1) the original Sasso et al. (2013) (or “Published Model”) implementation (dashed lines) and (2) the PBPK model template implementation (solid lines). Results are shown for the respiratory uptake in mice exposed to three concentrations of chloroform (1000, 2500, and 5000 ppm). Simulations from the original Sasso et al. (2013) implementation and experimental published data from Corley et al. (1990) (points) were obtained from Figure 2 of Sasso et al. (2013). Note that the respective predictions from each model implementation are nearly indistinguishable visually.
Styrene model
Using the template implementation of the styrene model, we reproduced published simulations for rats shown by Ramsey and Andersen (1984). Figure 11 shows a comparison of simulation results from a template implementation of the model and the original model for rats exposed to a constant concentration of styrene for 6 h with exposure concentrations ranging from 80 to 1200 ppm. The template implementation results matched the published simulation results to within 0.3% relative to the scale of the digitized figure.
Figure 11.

Comparison of simulation results using two different implementations of the Ramsey and Andersen (1984) PBPK model for styrene: (1) the original Ramsey and Andersen (1984) (or “Published Model”) implementation (dashed lines) and (2) the PBPK model template implementation (solid lines). Results are shown for venous blood concentrations of styrene for rats exposed to a constant inhaled concentration of styrene (ranging from 80 to 1200 ppm) for 6 h. Simulations from the original Ramsey and Andersen (1984) implementation and published data of Young et al. (1979) (points) were digitized from Figure 2 of Ramsey and Andersen (1984). Note that the respective predictions from each model implementation are nearly indistinguishable visually.
We also performed a simulation of rats given a 9.4 mg/kg IV dose administered as an infusion over 1.8 min. Figure 12 shows a comparison of the simulation results obtained from the template implementation of the model and the original model. Ramsey and Andersen (1984) listed an infusion time of 0.5 min; however, when using 0.5 min the simulated concentration values were significantly higher for the initial time-points than those shown by Ramsey and Andersen (1984). A better match was obtained using an infusion time of 1.8 min (0.03 h). Also, during the earliest times of the simulation, the template implementation clearly shows a rise in chemical concentration as it is infused into the blood, while the results shown by Ramsey and Andersen (1984) do not show an increase during the initial infusion of chemical. We suspect that the output resolution for the simulation results shown in the published figure was lower than the resolution we used for our simulations and that this explains the discrepancy. However, after the initial 3 min of simulation time, the template implementation matched the published simulation results to within 0.41% relative to the scale of the digitized figure, indicating a good reproduction of the model.
Figure 12.

Comparison of simulation results using two different implementations of the Ramsey and Andersen (1984) PBPK model for styrene: (1) the original Ramsey and Andersen (1984) (or “Published Model”) implementation (dashed lines) and (2) the PBPK model template implementation (solid lines). Results are shown for arterial blood concentrations of styrene for rats exposed to a 9.4 mg/kg IV dose of styrene administered over a period of 1.8 min. Simulations from the original Ramsey and Andersen (1984) implementation and published data of Withey and Collins (1977) (points) were digitized from Figure 3 of Ramsey and Andersen (1984). Note that the respective predictions from each model implementation are nearly indistinguishable visually after 0.1 h.
Yoon et al. (2007) VOC model
Using the template implementation of the styrene model, we simulated rats exposed to vinyl chloride, TCE, or CCl4 via periodic inhalation for comparison with published dose metrics from Yoon et al. (2007) using the parameter values listed in Tables 1 (for 2-month-old rats), 2, 3, and 4 of that paper. We calculated the peak venous blood concentration of the parent chemical , the average daily amount under the parent chemical concentration curve in arterial blood (AUC), and the average daily amount of metabolite formed in the body (AM), in the liver (AML), in the kidneys (AMK), and in the lungs (AMLU). The initial template implementation results matched the published results for these metrics (listed in Table 5 of Yoon et al., 2007) for the simulations with no extrahepatic metabolism to within 1%, indicating successful replication of the models. However, the simulation results using the template implementation did not match the published results when including extrahepatic metabolism for vinyl chloride. Careful reading of the full paper revealed that in the case of vinyl chloride, the value for the metabolic affinity constant, , had been increased to better match the value from other published studies rather than using the value listed in Table 4 (obtained from parameter estimation using in vitro data). Once the affinity constant, , was set to match the value stated in the text, all the published results agreed to within 1%. Supplementary Table 3 contains a full listing of these simulation results.
Discussion
Differences between PBPK model template implementation results and original simulations
We observed small differences, quantified as percent errors, between results generated using our PBPK model template implementations of models and published results based on the original implementations. For the models for which we did not have the original model source code (styrene, vinyl chloride, TCE, and CCl4), these errors may be due to missing information related to the details of how those simulations were performed. For example, for the Ramsey and Andersen (1984) styrene PBPK model simulation results for rats given an IV dose of styrene, the larger differences seen in early time-points of the simulation (see Fig. 12) are likely due to differences in the output resolution of the simulation results. Additionally, for the styrene PBPK model, we compared our simulation results with results that were digitally extracted from figures in the original publication, and we recognize that the digital extraction process can introduce additional errors. Therefore, for those comparisons, we computed the percent differences relative to the ordinate scale of the digitized figure to adjust for the impact of errors in digitization when assessing our recreation of the published results.
Differences between results obtained using the template implementation of a model and the original implementation also appeared for models for which we did have the original model source code (DCM, methanol, and chloroform) and thus for which we could directly obtain the published simulation values with high precision. The small percent errors observed in these cases may be attributed to differences in the software platforms used, including differences in error tolerances and algorithms used for numerical integration. Our choice of error measurement may also explain why our PBPK model template simulations for some of the models, such as the DCM PBPK model, appear to reproduce the original implementation results less precisely than others, such as the template simulations for the methanol PBPK model. Since our error measurement in these cases is calculated as a percent error in the template simulation results relative to the published simulation results, at very small values of a given published simulation output the percent error we calculate may be relatively large even when there is only a small absolute difference between the template implementation and the original implementation. A different choice of how to calculate the error, such as a percent difference (ie, the ratio of the absolute difference of the values to the average of the values) or a ratio of the absolute difference of the values to the maximum value from either simulation, may result in errors that are more similar across model template implementations for different PBPK models. However, as seen in the “Results” section and accompanying figures, the model template simulations visually reproduce the originally published simulation results and the percent errors are small, so we did not explore this further.
Using the template in risk assessment
The PBPK model template has undergone a rigorous QA process as described by U.S. EPA (2020). This includes assessing the biological plausibility of the included features and ensuring that the model code and logic used to implement a given PBPK model is accurate. Therefore, a reviewer can be confident that individual features within a model template implementation of a PBPK model are correctly represented. However, it does not eliminate the reviewer’s responsibility to assess whether the features selected for inclusion for a particular PBPK model implementation are appropriate to the specific chemical being modeled. A reviewer must also evaluate whether the model parameters used are accurate and consistent with their sources and whether published data used for comparisons has been accurately extracted from text, tables, and figures in the relevant publications.
When a reviewer is attempting to recreate simulation results from a published PBPK model, acceptability of a template implementation of the model is determined based on the QA guidelines established by U.S. EPA (2020). If a reviewer has access to the source code for the original published model and thus the exact simulation values, we consider a template implementation of a model to be acceptable if the results match to within 0.1%. If the original model source code is not available and the reviewer must rely on digitized values for comparison of simulation results, we expect to obtain a visual match between the simulation results and consider differences of up to 2% (relative to the scale of the digitized figure) between the digitized values and template implementation values to be acceptable for considering the template implementation to be an exact reproduction of the original. If the template implementation of the model does not meet these criteria, then additional investigation as to the source of the discrepancy should be conducted. For example, when we initially implemented the vinyl chloride model of Yoon et al. (2007) for which we did not have the original model source code, the template simulation results for the amount of chemical metabolized were significantly larger than those in the published table of results. A more careful review of the paper was needed to identify the source of the discrepancy: the value actually used in their simulations was different from the one listed in the parameter table. After changing the value of , the percent error was 1%, indicating the template implementation was an acceptable reproduction of the original model.
In some cases, it might not be possible to identify the source of a discrepancy between results from a PBPK model template implementation and those provided in a paper or report. Either a parameter value error (a difference between values used in code vs those listed in a table) or an error in an equation in the code could exist. In this case, we propose that if results with the PBPK model template match the published results to within 20%, and still match experimental data reasonably well, then the difference can be considered of minimal consequence. One’s judgment of the quality of the model should not be degraded by a difference of this magnitude. For larger differences between the PBPK model template and published results, the original model may be considered nonreproducible, and re-estimation of model parameters or possible changes to the model structure should be considered to assure an adequate fit to any experimental data.
Using the template to evaluate model assumptions
One of the goals of the model template is to enable the reproduction of a wide variety of published PBPK models. Therefore, we have included options for different modeling assumptions that are commonly used, such as the steady state approximations that are available for the venous and arterial blood compartments. Since switching between these options only requires modelers to change their desired assumptions within the input spreadsheets, modelers can perform simulations with various sets of assumptions to see how the results are affected. This type of analysis could also be performed by those who want to use a previously published model to see if assumptions made by the original model authors (to use a steady state approximation, for example) have significant impacts on the results. This flexibility of the model template can be seen in the simulation results from Figure 5. In the original publication, the methanol model of U.S. EPA (2013) was used to test whether modeling the GI tract using a 1-compartment or a 2-compartment model was more accurate. Using the model template, it was simple to change only the rate constants describing the movement of chemical between different GI compartments, and each of these options was already available in the model template without the need to change the source code containing the model equations.
Similarly, since a wide variety of features (eg, different metabolic pathways and sites and flexibility in selecting tissue compartments) is already included in the model template, it is also straightforward to include or exclude model features and assess the impact on simulations. Of course, this requires the modeler to know any parameters necessary for implementing those features. For example, to add one or more tissue compartments, the modeler would need to provide the correct tissue-to-blood partition coefficients. Thus, one could use the template to test hypotheses regarding how processes in one part of the body effect chemical concentrations in another. For example, for the DCM PBPK model, one could test how lung metabolism impacts blood concentration by including or excluding that route of metabolism and examining the differences in the predicted blood concentrations. The flexibility of the PBPK model template can also be leveraged to quickly update a previously created model as additional experiments and studies are performed. For example, suppose model authors originally lumped multiple tissues together due to a lack of data regarding partitioning of the chemical, but subsequently a study was performed to determine partition coefficients for each of the tissues. In this case, the model could be quickly updated to include the new information and simulations could be performed to determine whether the updated model generates improved predictions.
Mapping to the template superstructure
There may be multiple ways to map any given PBPK model to the model template superstructure. For example, for the chloroform PBPK model of Sasso et al. (2013), there were multiple possibilities for representing the kidney structures using the PBPK model template. The original model split the kidney into two compartments: the kidney cortex, which includes a saturable metabolism pathway, and the kidney medulla. These two compartments each receive a portion of the kidney blood flow, but otherwise they do not interact with each other. We mapped the kidney cortex to the “other metabolizing tissues” compartment since that compartment allows for a saturable metabolism pathway. For the kidney medulla, we chose to map it to the existing “kidney tissue” compartment in the model template with the parameters related to the filtrate (glomerular filtration rate, urinary excretion rates, and maximum saturable reabsorption rate) set equal to zero. This effectively makes the “kidney tissue” compartment behave identically to any of the general tissue compartments in the model; in fact, we could have mapped the kidney medulla to one of those general compartments to obtain equivalent results. In that case, we would have still set all the filtrate-related parameters to zero and additionally set the blood flow rate to the “kidney tissue” compartment to zero to exclude that compartment while setting the blood flow rate to our chosen general tissue compartment to the correct value for the blood flow rate into the kidney medulla.
Using the template for developing new models
The model template can also be used to construct novel PBPK models. The wide variety of features available within the template superstructure allows for implementation of PBPK models that describe PK mechanisms for many diverse chemicals without adjusting the model template software source code. When developing new models, one must decide which features and equations should be included as well as whether to use steady state approximations for the venous blood, arterial blood, and gas exchange (when implementing a model with two blood compartments). The model is implemented by setting the appropriate parameter values in the PBPK model template input files, and minimally the model structure must include blood and one tissue compartment into which the chemical distributes. Because the PBPK model template equations have already undergone QA review, any subsequent QA review of a PBPK model implemented using the template can focus on the appropriateness of the features selected for inclusion and the parameter values that have been entered into the input spreadsheets.
Future features of the PBPK model template
We plan to continue improving the PBPK model template by making it easier to use and expanding the available features to accommodate more types of PBPK models. Future versions of the template will include default input parameter sets corresponding to different animal species as well as different lifestages and demographic groups. We will also improve the template by adding tools for performing Monte Carlo analyses for different populations. To allow for upper respiratory tract dosimetry, we plan to include more options and compartments for more complex model representations of inhalation, deposition (including explicit models for wash-in/wash-out effects), and absorption of inhaled chemicals. Additionally, we plan to include the ability to track one or more metabolites along with a parent compound.
Conclusions
We have extended the PBPK model template originally presented by Bernstein et al. (2021) to allow for implementation of a wider variety of chemical-specific PBPK models, including those for VOCs. As with the previous version of the template, all logic and equations encoded in the software have undergone careful QA, so users of the template can focus any QA of specific models on the input spreadsheets, which specify assumptions, selected model features, parameter values, and details of specific exposure scenarios. Using this new version of the template, we showed that we can successfully implement five VOC PBPK model structures (applying seven sets of model parameters) with a high degree of accuracy. Thus, the PBPK model template can now be used to implement a greater variety of PBPK models.
Supplementary Material
Acknowledgements
The authors would like to acknowledge Caroline Ring and Elaina Kenyon for their careful review of an early draft of this manuscript.
Funding
This project was supported in part by an appointment (A.S.B.) to the Research Participation Program at the Center for Public Health and Environmental Assessment, U.S. EPA, administered by the Oak Ridge Institute for Science and Education through an interagency agreement between the U.S. Department of Energy and EPA.
Footnotes
Declaration of conflicting interests
The authors declared no potential conflicts of interest with respect to the research, authorship, and/or publication of this article.
Disclaimer: The views expressed in this manuscript are those of the authors and do not necessarily represent the views or policies of the U.S. EPA.
Data availability
Supplementary data are available at https://doi.org/10.23719/1527967.
References
- Andersen ME, Clewell HJ III, Gargas ML, Macnaughton MG, Reitz RH, Nolan RJ, and Mckenna MJ (1991). Physiologically based pharmacokinetic modeling with dichloromethane, its metabolite, carbon monoxide, and blood carboxyhemoglobin in rats and humans. Toxicol. Appl. Pharmacol. 108, 14–27. [DOI] [PubMed] [Google Scholar]
- Bernstein AS, Kapraun DF, and Schlosser PM (2021). A model template approach for rapid evaluation and application of physiologically based pharmacokinetic models for use in human health risk assessments: A case study on per- and polyfluoroalkyl substances. Toxicol. Sci. 182, 215–228. [DOI] [PMC free article] [PubMed] [Google Scholar]
- Bois FY (2009). GNU MCSim: Bayesian statistical inference for SBML-coded systems biology models. Bioinformatics 25, 1453–1454. [DOI] [PubMed] [Google Scholar]
- Brightman FA, Leahy DE, Searle GE, and Thomas S. (2006). Application of a generic physiologically based pharmacokinetic model to the estimation of xenobiotic levels in rat plasma. Drug Metab. Dispos. 34, 84–93. [DOI] [PubMed] [Google Scholar]
- Campbell JL Jr, Clewell RA, Gentry PR, Andersen ME, and Clewell HJ III. (2012). Physiologically based pharmacokinetic/toxicokinetic modeling. Methods Mol. Biol. 929, 439–499. [DOI] [PubMed] [Google Scholar]
- Clark LH, Setzer RW, and Barton HA (2004). Framework for evaluation of physiologically-based pharmacokinetic models for use in safety or risk assessment. Risk Anal. 24, 1697–1717. [DOI] [PubMed] [Google Scholar]
- Corley RA, Mendrala AL, Smith FA, Staats DA, Gargas ML, Conolly RB, Andersen ME, and Reitz RH (1990). Development of a physiologically based pharmacokinetic model for chloroform. Toxicol. Appl. Pharmacol. 103, 512–527. [DOI] [PubMed] [Google Scholar]
- Gargas ML, Clewell HJ III, and Andersen ME (1986). Metabolism of inhaled dihalomethanes in vivo: Differentiation of kinetic constants for two independent pathways. Toxicol. Appl. Pharmacol. 82, 211–223. [DOI] [PubMed] [Google Scholar]
- Haffner HT, Wehner HD, Scheytt KD, and Besserer K. (1992). The elimination kinetics of methanol and the influence of ethanol. Int. J. Legal Med. 105, 111–114. [DOI] [PubMed] [Google Scholar]
- IPCS. (2010). Characterization and application of physiologically based pharmacokinetic models in risk assessment. Harmonization Project Document No. 9, World Health Organization, Geneva, Switzerland. [Google Scholar]
- Jongeneelen F, and ten Berge W. (2012). Simulation of urinary excretion of 1-hydroxypyrene in various scenarios of exposure to polycyclic aromatic hydrocarbons with a generic, cross-chemical predictive PBTK-model. Int. Arch. Occup. Environ. Health 85, 689–702. [DOI] [PubMed] [Google Scholar]
- Jongeneelen FJ, and Ten Berge W. (2011). A generic, cross-chemical predictive PBTK model with multiple entry routes running as application in MS excel; design of the model and comparison of predictions with experimental results. Ann. Occup. Hyg. 55, 841–864. [DOI] [PubMed] [Google Scholar]
- Loccisano AE, Campbell JL Jr, Andersen ME, and Clewell HJ III. (2011). Evaluation and prediction of pharmacokinetics of PFOA and PFOS in the monkey and human using a PBPK model. Regul. Toxicol. Pharmacol. 59, 157–175. [DOI] [PubMed] [Google Scholar]
- McLanahan ED, El-Masri HA, Sweeney LM, Kopylev LY, Clewell HJ, Wambaugh JF, and Schlosser PM (2012). Physiologically based pharmacokinetic model use in risk assessment−why being published is not enough. Toxicol. Sci. 126, 5–15. [DOI] [PubMed] [Google Scholar]
- Mumtaz M, Fisher J, Blount B, and Ruiz P. (2012a). Application of physiologically based pharmacokinetic models in chemical risk assessment. J. Toxicol. 2012, 1. [DOI] [PMC free article] [PubMed] [Google Scholar]
- Mumtaz MM, Ray M, Crowell SR, Keys D, Fisher J, and Ruiz P. (2012b). Translational research to develop a human PBPK models tool kit-volatile organic compounds (VOCs). J. Toxicol. Environ. Health A 75, 6–24. [DOI] [PMC free article] [PubMed] [Google Scholar]
- Pearce RG, Setzer RW, Strope CL, Sipes NS, and Wambaugh JF (2017). HTTK: R package for high-throughput toxicokinetics. J. Stat. Softw. 79, 1–26. [DOI] [PMC free article] [PubMed] [Google Scholar]
- Perkins RA, Ward KW, and Pollack GM (1996). Methanol inhalation: Site and other factors influencing absorption, and an inhalation toxicokinetic model for the rat. Pharm. Res. 13, 749–755. [DOI] [PubMed] [Google Scholar]
- R Core Team. (2020). R: A Language and Environment for Statistical Computing. R Foundation for Statistical Computing, Vienna, Austria. [Google Scholar]
- Ramsey JC, and Andersen ME (1984). A physiologically based description of the inhalation pharmacokinetics of styrene in rats and humans. Toxicol. Appl. Pharmacol. 73, 159–175. [DOI] [PubMed] [Google Scholar]
- Rohatgi A. (2022). WebPlotDigitizer, version 4.6, Pacifica, California, USA. Available at: https://automeris.io/WebPlotDigitizer. Accessed February 13, 2022. [Google Scholar]
- Ruiz P, Fowler BA, Osterloh JD, Fisher J, and Mumtaz M. (2010). Physiologically based pharmacokinetic (PBPK) tool kit for environmental pollutants–metals. SAR QSAR Environ. Res 21, 603–618. [DOI] [PubMed] [Google Scholar]
- Ruiz P, Ray M, Fisher J, and Mumtaz M. (2011). Development of a human physiologically based pharmacokinetic (PBPK) toolkit for environmental pollutants. Int. J. Mol. Sci. 12, 7469–7480. [DOI] [PMC free article] [PubMed] [Google Scholar]
- Sasso AF, Schlosser PM, Kedderis GL, Genter MB, Snawder JE, Li Z, Rieth S, and Lipscomb JC (2013). Application of an updated physiologically based pharmacokinetic model for chloroform to evaluate CYP2E1-mediated renal toxicity in rats and mice. Toxicol. Sci. 131, 360–374. [DOI] [PubMed] [Google Scholar]
- Schmutte P, Bilzer N, and Penners BM (1988). Zur Nuchternkinetik Der Begleitalkohole Methanol Und Propanol-1 [Kinetics of the congeners methanol and propanol-1 in the absence of ethanol]. Blutalkohol. 25, 137–142. [PubMed] [Google Scholar]
- Sedivec V, Mraz M, and Flek J. (1981). Biological monitoring of persons exposed to methanol vapours. Int. Arch. Occup. Environ. Health 48, 257–271. [DOI] [PubMed] [Google Scholar]
- Take M, Yamamoto S, Ohnishi M, Matsumoto M, Nagano K, Hirota T, and Fukushima S. (2010). Chloroform distribution and accumulation by combined inhalation plus oral exposure routes in rats. J. Environ. Sci. Health A Tox. Hazard. Subst. Environ. Eng. 45, 1616–1624. [DOI] [PubMed] [Google Scholar]
- U.S. EPA. (2011). Toxicological review of dichloromethane (methylene chloride) (CAS No. 75–09-2): In support of summary information on the integrated risk information system (IRIS). EPA Report No. EPA/635/R-10/003F, Washington, DC. [Google Scholar]
- U.S. EPA. (2013). Toxicological review of methanol (noncancer) (CAS No. 67–56-1) in support of summary information on the integrated risk information system (IRIS). EPA Report No. EPA/635/R-11–001F, Washington, DC. [Google Scholar]
- U.S. EPA. (2018). An umbrella quality assurance project plan (QAPP) for PBPK models. EPA Report No. ORD QAPP ID No: B-0030740-QP-1–1, Research Triangle Park, NC. [Google Scholar]
- U.S. EPA. (2020). Umbrella quality assurance project plan (QAPP) for dosimetry and mechanism-based models. Report No. EPA QAPP ID No: L-CPAD-0032188-QP-1–2, Research Triangle Park, NC.. [Google Scholar]
- Ward KW, Blumenthal GM, Welsch F, and Pollack GM (1997). Development of a physiologically based pharmacokinetic model to describe the disposition of methanol in pregnant rats and mice. Toxicol. Appl. Pharmacol. 145, 311–322. [DOI] [PubMed] [Google Scholar]
- Withey JR, and Collins PG (1977). Pharmacokinetics and distribution of styrene monomer in rats after intravenous administration. J. Toxicol. Environ. Health 3, 1011–1020. [DOI] [PubMed] [Google Scholar]
- Yoon M, Madden MC, and Barton HA (2007). Extrahepatic metabolism by CYP2E1 in PBPK modeling of lipophilic volatile organic chemicals: Impacts on metabolic parameter estimation and prediction of dose metrics. J. Toxicol. Environ. Health A 70, 1527–1541. [DOI] [PubMed] [Google Scholar]
- Young JD, Ramsey JC, Blau GE, Karbowski RJ, Nitschke KD, Slauter RW., and Braun WH. (1979). Pharmacokinetics of inhaled or intraperitoneally administered styrene in rats. In: Toxicology and Occupational Medicine. Developments in Toxicology and Environmental Science, 4th ed. (Deichmann WB, Ed.), pp. 297–310. Elsevier/North-Holland, New York. [Google Scholar]
Associated Data
This section collects any data citations, data availability statements, or supplementary materials included in this article.
Supplementary Materials
Data Availability Statement
Supplementary data are available at https://doi.org/10.23719/1527967.