

Abstract
Nalbuphine (NAL) is a -agonist/-antagonist opioid being developed as an oral extended formulation (ER) for the treatment of chronic cough in idiopathic pulmonary fibrosis and itch in prurigo nodularis. NAL is extensively glucuronidated and likely undergoes enterohepatic recirculation (EHR). The purpose of this work is to develop pharmacokinetic models for NAL absorption and enterohepatic recirculation (EHR). Clinical pharmacokinetic (PK) data sets in healthy subjects from three trials that included IV, oral solution, and ER tablets in fed and fasted state and two published trials were used to parametrize a novel partial differential equation (PDE)-based model, termed “PDE-EHR” model. Experimental inputs included in vitro dissolution and permeability data. The model incorporates a continuous intestinal absorption framework, explicit liver and gall bladder compartments, and compartments for systemic drug disposition. The model was fully PDE-based with well-stirred compartments achieved by rapid diffusion. The PDE-EHR model accurately reproduces NAL concentration–time profiles for all clinical data sets. NAL disposition simulations required inclusion of both parent and glucuronide recirculation. Inclusion of intestinal P-glycoprotein efflux in the simulations suggests that NAL is not expected to be a victim or perpetrator of P-glycoprotein-mediated drug interactions. The PDE-EHR model is a novel tool to predict EHR and food/formulation effects on drug PK. The results strongly suggest that even intravenous dosing studies be conducted in fasted subjects when EHR is suspected. The modeling effort is expected to aid in improved prediction of dosing regimens and drug disposition in patient populations.
Keywords: nalbuphine, enterohepatic recirculation, partial differential equations, pharmacokinetic models
Graphical Abstract

INTRODUCTION
Nalbuphine (NAL) is a mixed -agonist/-antagonist opioid currently marketed as Nalbuphine HCl for Injection for the management of pain.1 A NAL extended-release oral tablet (NAL ER) is currently being developed for the treatment of chronic cough in idiopathic pulmonary fibrosis2 and itch in prurigo nodularis.3 NAL is a low-molecular-weight, water-soluble molecule with low protein binding (50%). NAL oral bioavailability is low (12–16%)4,5 with high intersubject variability (>30%).5-6,7 The low oral bioavailability is likely due to extensive first-pass metabolism.8,9 The elimination half-life of NAL following IV administration is approximately 2.5–4.6 h4,5 compared to a ranging between 4.7 and 9 h following oral administration of NAL as an oral solution (Lo) or NAL ER tablets.7 The main pathway of NAL metabolism involves glucuronic acid conjugation8,10 and CYP oxidation.11 The longer than expected terminal half-life of NAL upon oral dosing has been attributed to enterohepatic recirculation (EHR).5
EHR occurs when a drug or metabolite is secreted into the intestine via the bile and either the parent is reabsorbed, or the metabolite is converted back to the parent drug and reabsorbed.12 This process can greatly affect the concentration–time () profile of some drugs. The first step of drug EHC is the apical transporter-mediated secretion of parent drug or metabolite from the liver into the bile, e.g., by P-gp, BCRP, or MRP2. When the bile is released into the intestine, parent drug can be reabsorbed immediately, whereas metabolites (e.g., glucuronides) must be converted back to parent, usually enzymatically (e.g., by glucuronidases). Glucuronidases in the gut are primarily bacterial and are located in the distal intestine.13 Therefore, there can be a significant lag between biliary secretion of metabolite and reabsorption of the parent drug. As such, NAL is a good model drug for EHR as it is extensively glucuronidated.
There have been several general approaches to include EHR in pharmacokinetic (PK) models.14-19 All previously published EHR models are based on ordinary differential equations (ODEs). For example, a relatively simple model can include first-order absorption and metabolism with secretion modeled as a first-order transfer function to the site of reabsorption.20 Other models may include time delays21 or modeling biliary secretion with a sine function.22 Models that include explicit gall bladder compartments with filling and emptying functions have also been reported.23,24
We have previously published continuous intestinal absorption models for human and rat.25-27 These models, based on the convection-diffusion-reaction equation,28 consider intestinal concentrations as a function of time and distance along the intestinal tract and are velocity-based, ensuring that the drug pulse is accurately positioned along the intestine over time. Although compartmental models are based on ODEs, a model with concentrations varying with both time and distance is solved by partial differential equations (PDEs). Unlike compartmental intestinal models, these PDE-based models can allow physiological parameters to vary continuously along the length of the intestine and accurately reproduce drug concentration–time () profiles. An EHR model must include interactions over time between the intestine and the rest of the body. However, combining an ODE-based PK model with a PDE intestinal model is challenging. In this report, we present a full PDE-based PDE-EHR framework with NAL as a model drug and use NAL PK data for model parametrization. Data for IV, oral solution, and extended-release NAL PK studies were modeled, and the impact of EHR on NAL disposition was evaluated.
EXPERIMENTAL SECTION
Clinical Studies.
Studies 1–3 were Phase 1 studies conducted in healthy subjects sponsored by Trevi Therapeutics and conducted in accordance with the Declaration of Helsinki. All aspects of the study were conducted in accordance with national, state, and local laws and regulations. All amendments and informed consent form (ICF) were reviewed and approved by the Investigator, clinic staff, and Institutional Review Board (see Table S1). All patients provided written, signed informed consent prior to entering the study and before any study-related procedures were performed. Patient demographics and additional details for all studies are given in Tables S2 and S3, respectively. A brief description of the studies is provided below. All doses and formulation dose strengths are expressed relative to the NAL HCl salt.
Study 1 was a NAL absolute bioavailability and mass balance crossover study following single IV and oral [3H-]-radiolabeled NAL administration in the fasted state. Subjects were fasted overnight for at least 10 h and then dosed a 10 mg IV dose solution (10 mg/mL) or 45 mg of NAL oral solution. The formulations were spiked with 50 Ci 3H-NAL. No food was allowed for 4 h post-dose. A standard meal was consumed approximately 4 h after dosing. An evening meal was served 11 h after dosing.
Study 2 was a single-dose PK assessing the food effect and bioavailability of the NAL extended-release (NAL ER) tablet relative to an oral solution in healthy subjects. All subjects were fasted overnight for at least 10 h. Subjects received either 60 mg of NAL administered as an oral solution or 120 mg of NAL (NAL ER tablets) administered as 2 × 60 mg NAL ER tablets in the fasted state. For fed state studies, subjects were fed a high-fat, high-calorie breakfast 30 min before administration of the drug product. The meal was eaten within 25 min after starting the meal. Study drug was administered 30 min after the start of the meal with a total of 240 mL water. No food is allowed for 4 h post-dose and a standard meal is consumed at approximately 4 h after dosing. Evening meal served 9 h after dosing.
Study 3 was a single-dose PK dose proportionality study in the fasted state following the administration of NAL ER tablets at NAL doses of 30, 60, 120, and 180 mg. Subjects were fasted overnight for at least 10 h and then dosed with NAL ER tablets. No food was allowed for 4 h post-dose and a standard meal was consumed at approximately 4 h after dosing. An evening meal was served 9 h after dosing.
In Vitro Studies.
In vitro drug release studies were conducted as a function of time and pH following standard methods at pH 1, 4.5, and 6.8. Experimental details can be found in the Supporting Information and Figure S2. Caco-2 and MDCK-MDR1 transport studies were conducted following standard protocols, and details are presented in the Supporting Information (Tables S5-S7).
Intestinal Modeling.
The human continuous intestinal model reported previously27 was used to model intestinal absorption of NAL and the hydrolysis of the glucuronide metabolite. The intestinal model is a velocity-based model that uses experimental velocities to position intestinal drug content at the correct position with respect to time (Figure 1A). This model allows intestinal properties to vary as a function of the distance along the intestine (). The 7 m intestine was modeled with with velocity approaching 0 at 7 m (Figures 1, 2A and 3). These properties are shown in Figure 2 and include velocity, diffusion, cross-sectional area, surface area, pH, and glucuronidase activity. Since the initial publication, we modified the dimensions of the intestine. The cross-sectional areas of our initial model were based on a smooth tube with radii of 1.25 and 2.5 cm for small and large intestines, respectively. Since the cross section is nonspherical due to peristalsis, the cross-sectional surface area dimensions of the small and large were decreased by a factor of 2.4 to account for the nonspherical cross section due to peristalsis (Figure 1A). The surface areas of the intestine were not altered, but the decrease in cross-sectional dimensions resulted in higher drug concentrations. Therefore, the Caco-2 scaling factor was reduced from 2.4 to 1.1. The resulting modifications do not have a large impact on permeability but do alter the dissolution and precipitation.
Figure 1.

Schematic of the PDE-EHR model. (A) Intestine is modeled as a physiological continuous compartment based on the convection-diffusion-reaction equation. The intestine is a 7 m continuous tube (plus 1 m with velocity = 0) with radii and for the small intestine and colon, respectively. Cross-sectional view: concentric tubes depict the lumen (drug concentration, C1), apical membrane (C2), enterocyte cytosol (C3), and intracellular lipid (C4). The two-dimensional depiction of the concentric tubes is modeled as a five-compartment model with drug concentrations C1–C4 and input into liver via ; fg: fraction of drug dose escaping gut metabolism. (B) Upon dosing into the stomach, the parent drug moves along the length of the intestine and is absorbed into the liver compartment. The liver compartment is connected reversibly via hepatic blood flow to central compartment A, where IV dosing as well as plasma sampling occurs. The central compartment A is reversibly connected to peripheral compartments B and C via first-order rate constants. Parent drugs in the liver can be glucuronidated. Both parent and glucuronide can distribute from the liver to compartments A–C and can be secreted into the gall bladder. The gall bladder secretes the parent and glucuronide into the duodenum. The parent can be recycled via absorption into the liver (red arrows). The glucuronide can be hydrolyzed by β-glucuronidase (GUS) expressed in the lower intestine to parent drug, which results in recycling of parent via glucuronidation-deglucuronidation (blue arrows). Parent concentrations in the intestinal lumen (C1 in Figure 1) are predicted upon dosing (I), upon recycling from the gall bladder (II), and after several hours via deglucuronidation (III) (see related simulations in Figure 5). Parent and glucuronide are eliminated from the system via a combination of presystemic loss and hepatic plus nonhepatic elimination.
Figure 2.

Physiological functions describing intestinal physiology, input functions from the stomach, and gall bladder emptying. Functions are shown for (A) intestinal velocity, , (B) intestinal effective diffusion, , (C) intestinal cross-sectional area, , (D) lumenal surface area, , (E) microvilli expansion factor, , (F) intestinal pH, , (G) intestinal GUS expression function, , (H) input function from fasted stomach, (I) input function from fed stomach, (J) gall bladder emptying distance function, , and (K) post-prandial gall bladder output, .
Figure 3.
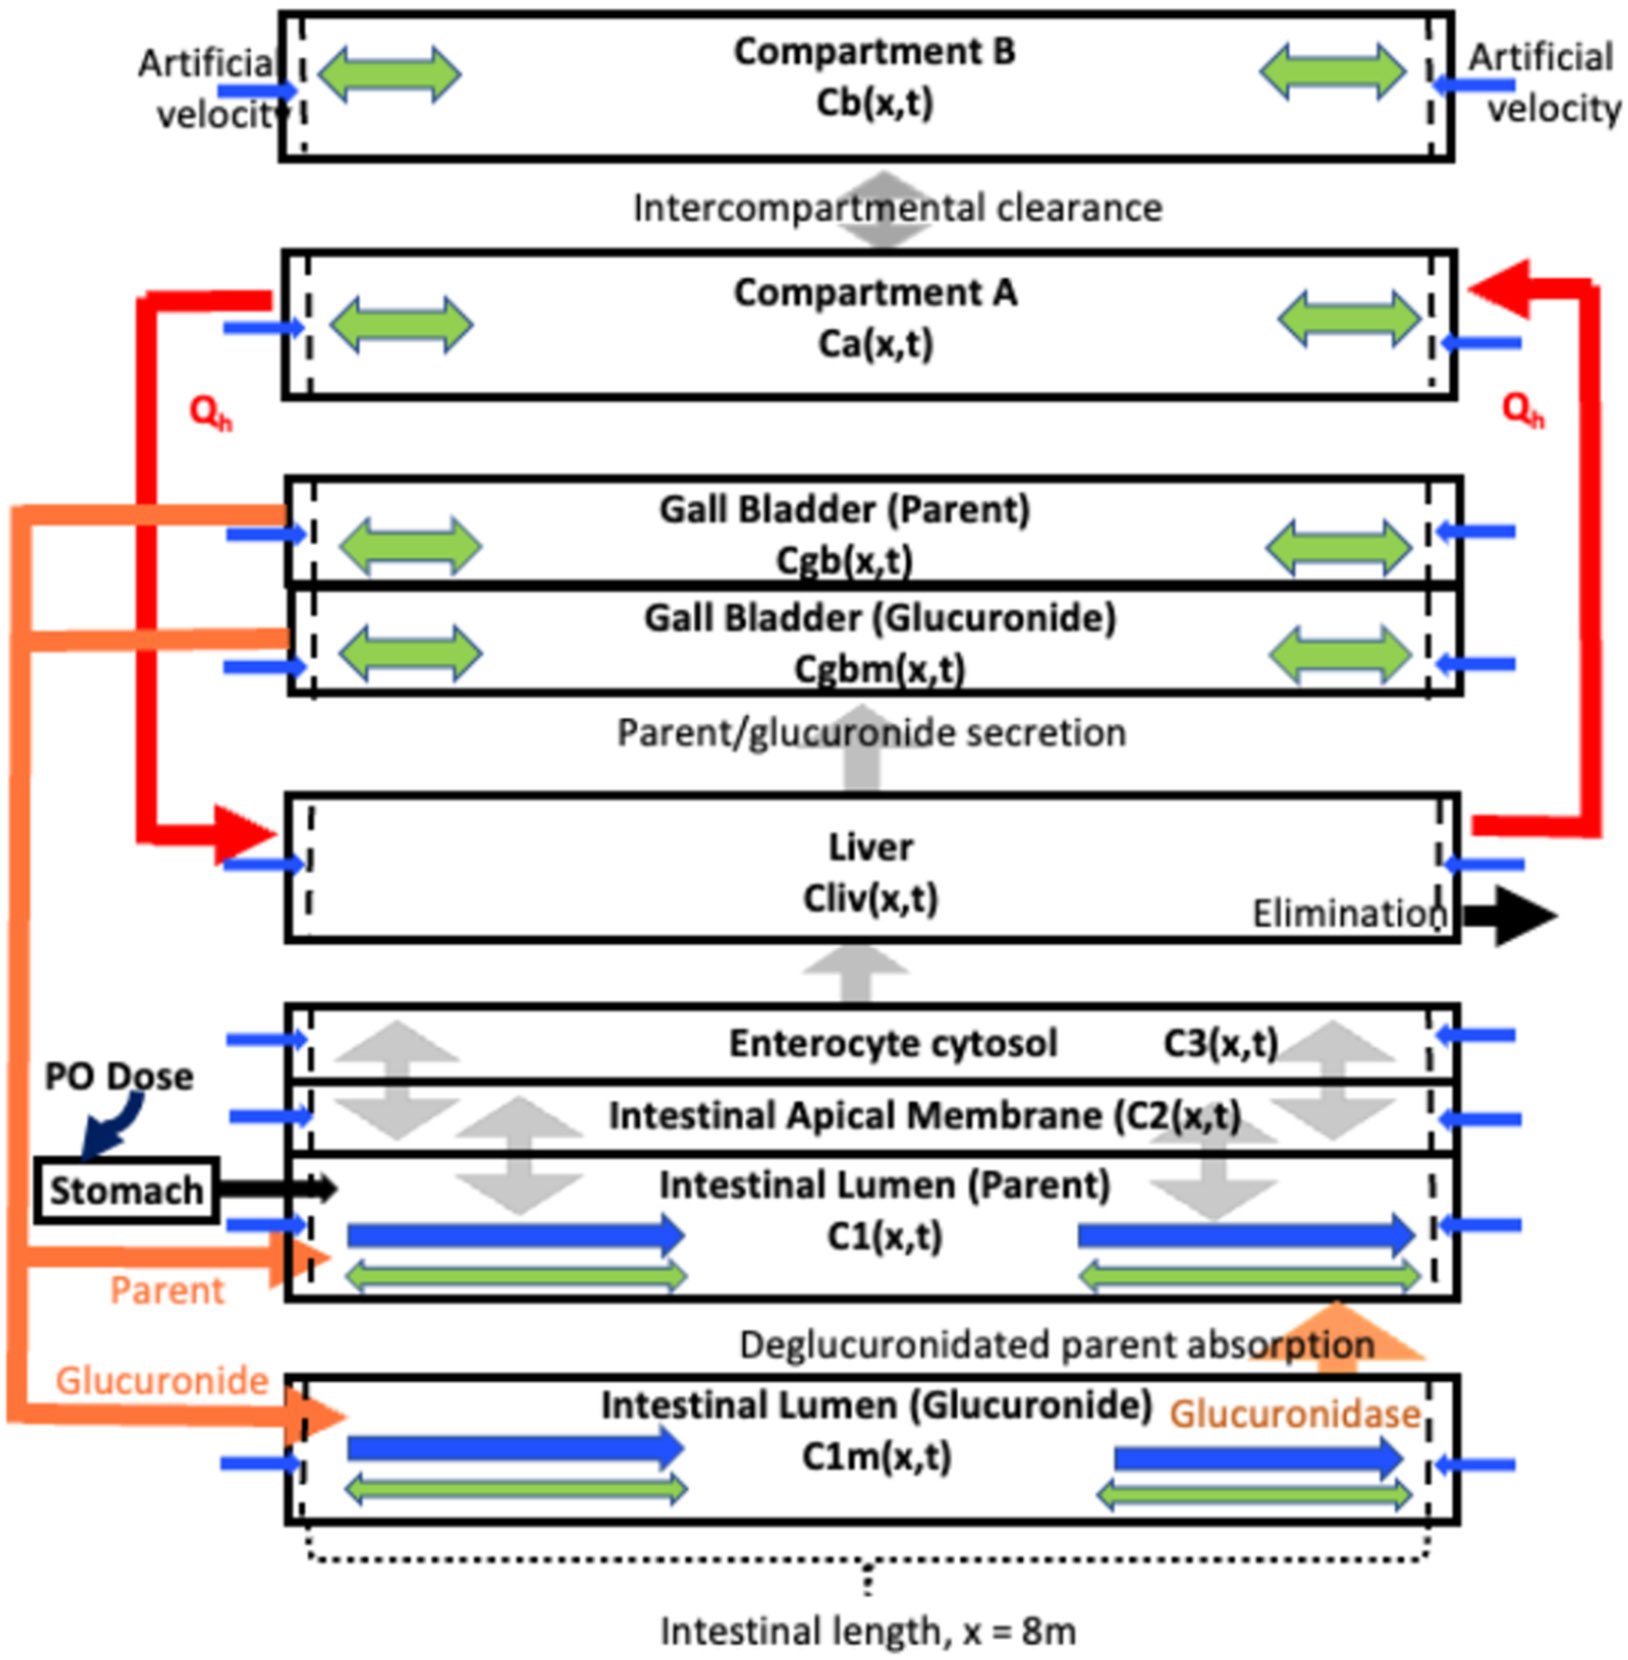
Schematic for the PDE-EHR model. Compartments (except stomach) have a length of . Bidirectional diffusion with thicker arrows denoting fast diffusion: green arrows; velocity terms (either a physiological, for the intestinal lumen compartments, or an artificial): blue arrows; intercompartmental clearances (modeled along the length): gray arrows; secretion from the gall bladder into the duodenum lumen, and deglucuronidated parent (via GUS) colonic absorption: orange arrows. Compartmental concentrations are defined in eqs 22-34 in the Experimental Section.
From the intestinal lumen (C1), the drug diffuses passively into the enterocyte apical membrane (C2, Figure 1A). The apical membrane must be included, since P-gp transports drugs from inside the membrane. Clearance in and out of membranes is modeled with experimental permeabilities and membrane partition coefficients. Experimental permeabilities are obtained from transwell assays, and membrane partition coefficients are obtained from microsomal partitioning assays. Since two membranes must be crossed in a transwell permeability assay, clearance into a membrane can be modeled as , where is the clearance into a membrane, is the measured apparent permeability, and SA is the surface area.29,30 Clearance out of a membrane () is , where is the membrane partition coefficient. From the apical membrane compartment, the drug diffuses into the enterocyte cytosol (C3) and partitions into intracellular lipids (C4). From the cytosol, the drug can diffuse across the basolateral membrane (with ) into the portal vein (not modeled) and then onto the liver.
For general use, the output from the intestine () is integrated over all intestinal length () and the portal vein amount as a function of time is used as the input function to an ODE-based model, e.g., compartmental or PBPK. However, enterohepatic recycling results in constant interactions between the whole-body (via bile) and the intestine. Therefore, it was necessary to construct a whole-body model compatible with a PDE intestinal model. This was accomplished by constructing 2- and 3-compartment models with added explicit liver and gall bladder compartments with a mathematical dimension in of 8 m (Figures 1B and 3). The necessary volumes of these compartments were achieved with the appropriate cross-sectional surface area. These compartments were made well-stirred by using a very high diffusion term in the PDEs. Thus, while intestinal lumen compartments have physiological diffusion, well-stirred compartments have very high artificial diffusion. Also, since we are explicitly modeling glucuronide disposition, it was necessary to include separate intestinal lumen and gall bladder compartments for the glucuronide metabolites (Figure 3).
A significant issue with well-stirred PDE compartments is that mathematical instabilities at the boundary regions can develop over time. We found that a stable model could be obtained if we include a very small region at the boundaries of these compartments () in which diffusion = 0 (eq 1 and Figure 3) and with artificial velocities to move drug back into the compartment (positive velocity adjacent to and negative velocity adjacent to , eq 2 and Figure 3).
Since both velocity and diffusion are functions of , derivatives of these functions are necessary when integrating by parts. Since derivatives of unit step functions are not defined, we use sigmoidal functions to construct steep, step-like functions when derivatives are required and unit step functions when derivatives are not required.
| (1) |
| (2) |
The constants and are the rapid diffusion and artificial velocity constants, respectively, and , , and and are the lengths of the intestinal PDE (8 m) and buffer regions (0.01 m), respectively.
Intercompartmental Clearances.
Well-stirred compartments (very high diffusion) include central and peripheral compartments, liver, and gall bladder. Clearances between central and peripheral compartments, between central and liver compartments, between liver and gall bladder, and intrinsic hepatic clearance occur across the entire length of the compartment, minus the buffer regions. For example, the clearance between the central compartment (A) and the first peripheral compartment (B) is
| (3) |
where is the diffusional clearance between A and B and is calculated from a standard 2- or 3-compartment model (e.g., ). In the PDE, this clearance is divided by () to provide the correct integrated clearance.
Modeling the Gall Bladder.
The gall bladder is modeled as a well-stirred compartment connected to the liver and intestine. Input into the gall bladder includes parent and glucuronide from the liver and glucuronide metabolite from the gut. Input into the gall bladder from the liver represents the amount of parent glucuronide and glucuronide secreted into the bile that will ultimately undergo enterohepatic recycling. Drug and metabolites that will not be recycled are considered to be part of intrinsic hepatic clearance (). Given the presumed high hepatic extraction ratio, the amount of parent and glucuronide secretion is limited by the hepatic blood flow. Since the ratio of parent to glucuronide secretion in the bile is unknown, these values were optimized to equal secretory clearance of parent and glucuronide by the liver (). The secretory clearances occur along the well-stirred liver and gall bladder, less the two buffer zones.
For parent
| (4) |
Additional glucuronide is likely formed via intestinal metabolism. Although the exact amount of intestinal metabolism is unknown, the fraction escaping gut metabolism () was assumed to be 0.85, since severely hepatically impaired patients show a bioavailability of 0.85.31 The fraction of intestinal glucuronide metabolite that is recycled (, via hepatic uptake and biliary secretion) was optimized to provide the best profile (). We bypassed the liver by considering only the fraction of glucuronide that is recycled, and the resulting input into the gall bladder from the gut is (). As discussed previously,30 is the passive permeability clearance across the basolateral enterocyte membrane (Figure 1A).
Gall bladder emptying is modeled with two components, a constant slow emptying clearance (15% of bile input) into the intestine between meals () and a rapid (75%) emptying in a first-order manner after meals . The rapid post-prandial emptying was modeled as a 40 min pulse after a meal.32 For all clinical studies in this analysis, meals were provided 4 and 9 h after dosing. An additional meal at 20 h after dosing was modeled, although this was not defined in the study protocol. The post-prandial emptying component for three meals is given by
| (5) |
where is the volume of the gall bladder (16 mL32,33), , , and are feeding times, and is the duration of the post-prandial emptying pulse.
The input into the intestine via the bile duct was modeled to occur at the middle of the duodenum with a width () of 0.01 m
| (6) |
Within the PDEs, the output time course is multiplied by the position function (e.g., ). The parent is deposited into the duodenum of the parent lumen and reabsorption can begin immediately. The glucuronide is deposited into a mathematically separate glucuronide lumen and must travel to the colon for hydrolysis. The position of -glucuronidase (GUS) activity (Figure 2G) is modeled as
| (7) |
Solution Dosing.
As described previously, the input from the stomach to the intestine for fasted solution dosing (pulse()) provides a zero-order input over 20 min, smoothed by logistic functions.
| (8) |
| (9) |
| (10) |
where is the initial concentration, lag is 0.1 h, pl is 0.3 h, is dose/250 mL, is the radius of the small intestine, and is the velocity at .
For fed solution dosing, a combination of three input pulse functions was used (Figure 2I)
| (11) |
where to 3.
| (12) |
where to 3.
| (13) |
where , , and . The resulting input function is shown in Figure 2I.
Solid Dosing.
Dissolution of ER formulations showed first-order dissolution under all pH conditions in buffer. Therefore, the dissolution function used for drugs with different particle sizes25,27 was replaced by a simple dissolution rate constant. Dissolution in the intestine () and in the stomach () were optimized for each preparation. The dissolution in the stomach when fasted was modeled with the following ODEs
| (14) |
| (15) |
| (16) |
with initial conditions , , and .
The fasted solid () and dissolved solid () input functions to the intestine are
| (17) |
| (18) |
For dissolution in the stomach when fed, the volume of the ODE (eq 11) was replaced with
| (19) |
The fed solid () and dissolved solid () input functions to the intestine are
| (20) |
| (21) |
Solution Dosing PDEs.
(intestinal lumen, parent, solution dosing)
| (22) |
(intestinal lumen, metabolite, solution dosing, or solid dosing)
| (23) |
(apical membrane, parent, solution dosing, or solid dosing)
| (24) |
(enterocyte cytosol, parent, solution dosing, or solid dosing)
| (25) |
(intracellular lipid, solution dosing, or solid dosing)
| (26) |
(central compartment, parent, solution dosing, or solid dosing)
| (27) |
(peripheral compartment B, parent, solution dosing, or solid dosing)
| (28) |
(peripheral compartment , parent, solution dosing, or solid dosing)
| (29) |
(liver compartment, parent, solution dosing, or solid dosing)
| (30) |
(gall bladder compartment, parent, solution dosing, or solid dosing)
| (31) |
(gall bladder compartment, glucuronide metabolite, solution dosing, or solid dosing)
| (32) |
Solid Dosing PDEs.
(intestinal lumen, solid parent, solid dosing)
| (33) |
(intestinal lumen, solution parent, solid dosing)
| (34) |
Initial conditions for all compartments were set to zero. Boundary conditions for all compartments set to zero for all compartments except: for fasted solution dosing, ; for fed solution dosing, ; for fasted solid dosing: and ; for fed solid dosing: and .
Model Parameterization.
Initial efforts to parametrize the complete model used the three data sets for which both IV and oral data were available with a crossover study design. One data set was obtained from an internal study (Study 1), one was previously published by Aitkenhead et al.4 and one was published by Lo et al.5 Study 1 and the Aitkenhead data both gave IV PK profiles with 3-compartmental characteristics (Table 1), whereas the Lo et al. data gave a 2-compartment profile. Since these were crossover studies, they were used to optimize some of the initial model parameters for solution data sets. Parameters optimized were the ratio of parent to glucuronide secreted by the liver (varied between 0.4 and 0.6, final value of 0.5) and the fraction of glucuronide recycled after intestinal metabolism (varied between 0 and 1, final value of 0.5). Drug parameters were not optimized. For intestinal parameters, only the radial diffusion function (used to decrease the colonic absorption in the terminal colon) was altered. This function was shifted to a later distance to allow absorption at later times post-dosing. Using the resulting model parameters and solution data, -glucuronidase position and activity were optimized (Figure 2G).
Table 1.
Pharmacokinetic Compartmental Modeling Parameters and Metrics for IV Studiesa
| Study 1 | Aitkenhead et al. | Lo et al. | |
|---|---|---|---|
| IV dose (mg) | 10 | 20 | 10 |
| 9.66 ± 2.76 | 31.52 ± 6.51 | 2.22 ± 0.67 | |
| 3.42 ± 0.32 | 9.68 ± 1.08 | 1.87 ± 0.41 | |
| 2.93 ± 0.78 | 5.09 ± 0.35 | ||
| 1.35 ± 0.46 | 1.24 ± 0.38 | ||
| 2.05 ± 0.32 | 2.60 ± 0.29 | 0.86 ± 0.09 | |
| 57.9 ± 9.6 | 31.9 ± 3.6 | 128.0 ± 12.0 | |
| CL (L/h) | 118.7 | 78.9 | 109.6 |
| AUC (μg h/L) | 78.1 | 232.0 | 86.2 |
| 347 | 267 | 280 | |
| 2.86 | 4.58 | 2.47 |
Parameter and metric estimates are reported as either best-fit estimate or best-fit estimate ± SE.
Stomach and intestinal dissolution rate constants ( and ) were optimized for the ER preparations. In addition, for fed data sets, three pulses were used in the feeding function. The contribution of the pulses was optimized between 15 and 25% for pulse 1, 10 and 15% for pulse 2, and 60 and 75% for pulse 3. The optimized values were 20, 10, and 70% (Figure 2I).
Simulating the Impact of P-gp on NAL Absorption.
NAL is a P-gp substrate with an in vitro efflux ratio of 12 in Caco-2 cells (Supporting Information, Table S6). Efflux of parent NAL into the bile will result in EHR since NAL is well absorbed in the intestine. To model the possible effect of P-gp on NAL absorption, P-gp activity was added to the intestinal model as described previously for the P-gp substrate fexofenadine absorption.27 The reported P-gp abundance profile34 was used to parametrize the spatial distribution of P-gp along the intestine. The transporter activity was expected to be nonsaturable since the observed P-gp IC50 was >269 μM (Supporting Information, Table S7). Since the efflux ratio for fexofenadine is 36 (and 12 for NAL), a range of activities were simulated for NAL at 0.5×, 1×, and 2.5× the for fexofenadine.
Modeling studies were conducted in Mathematica (Mathematica 13.3, Wolfram Research, Inc.). For compartment-only PK modeling and for stomach dissolution functions (eqs 13-15), the ODEs were solved with NDSolve with default settings. 2- and 3- compartment models were optimized using NonlinearModelFit with 1/Y2 weighting. PDEs were solved with NDSolve using IDA time integration,35 method of lines for PDE discretization, and tensor product grid for spatial discretization.
Errors were calculated for all simulations with the following equation36
RESULTS
The purpose of this study was to develop a model for EHR, using NAL as a model compound. For scientific rigor, all three available crossover studies with fast IV and PO arms were evaluated. The three IV data sets were modeled independently to calculate the compartmental parameters (Table 1). Study 1 and Aitkinhead et al.4 exhibited 3-compartment characteristics, and the Lo et al.5 data set exhibited 2-compartment kinetics. The kinetic parameters for all three studies were comparable and were within the high intersubject variability reported in all studies.
The three profiles in Figure 4A show the simulation of the 45 mg oral solution profiles for study 1 without recycling, with parent recycling, and with both parent and glucuronide recycling. The longer for oral dosing is indicative of EHR since absorption is still occurring at times after absorption of the original dose should be complete (e.g., >5 h in Figure 4A). The simulated concentration of parent drug in the lumen is shown for each simulation in Figure 4B-D. For the optimized model, the parent from the bile is released into the duodenum and is rapidly absorbed, whereas the glucuronide from the bile travels down the intestine to the colon where it is hydrolyzed to parent and absorbed more slowly.
Figure 4.

Predictions of profiles upon a solution dose with and without enterohepatic recirculation. (A) Observed data set (blue circles) and predicted profile (PO 45 mg NAL solution dose, Study 1) without recirculation (magenta), with only parent recirculation (green), and with recirculation of both parent and glucuronide (green). (B–D) Predicted intestinal lumen parent concentration-distance-time profile of NAL (B) without any parent or glucuronide recirculation, (C) with parent recirculation only, and (D) with both parent and glucuronide recirculation.
The parameters from the IV compartmental fits (Figure 5A-C and Table 1) were used to parametrize the fasted oral NAL solution models for the three independent crossover studies with the PDE-EHR model (Figure 5D-F). The model predicts the general profiles well for all three solution data sets with similar errors. The intersubject variability is high in all three data sets (see Table 2). Identical model and drug parameters were used for all data sets. A model without the EHR was not able to simulate the observed profiles.
Figure 5.

Prediction of profiles for IV/PO crossover studies with PO solution dosing to fasted subjects. IV data for (A) Study 1, (B) Aitkenhead et al.,4 and (C) Lo et al.5 Mean IV data (filled circles), compartmental model-predicted profile (solid line). (D) PO data for Study 1, (E) Aitkenhead et al.,4 and (F) Lo et al.5 Mean PO observed data ± SD (shaded band). Model-predicted profile (solid black line). Standard errors for PO predictions are listed.
Table 2.
Plasma PK Parameters for NAL following Administration of NAL HCl in Healthy Subjects
| Study 1 (absolute BA and mass balance) |
absolute BA (Aitkenhead) |
absolute BA (Lo) |
Study 2 relative bioavailability and food effect | Study 3 dose proportionality in fasted state | |||||||
|---|---|---|---|---|---|---|---|---|---|---|---|
| NAL HCl dose | 45 mg | 60 mg | 45 mg | 60 mg | 60 mg | 120 mga | 120 mga | 30 mg | 60 mg | 120 mg | 180 mg |
| formulation | slution | tablets | solution | solution | sSolution | ER tablets | ER tablets | ER tablets | ER tablets | ER tablets | ER tablets |
| food state | fasted | fasted | fasted | fasted | fed | fasted | fed | fasted | fasted | fasted | fasted |
| n | 19 | 10 | 24 | 12 | 12 | 12 | 12 | 22 | 24 | 19 | 15 |
| 8.2 ± 3.5 | 21.4 (6.0–36.2) | 14.4 ± 6.2 | 18.5 ± 7.9 | 16.9 ± 6.8 | 12.5 ± 7.1 | 18.6 ± 10.7 | 4.1 ± 2.3 | 7.8 ± 6.0 | 13.3 ± 6.5 | 19.2 ± 11.0 | |
| b | 0.92 ± 0.54c | 0.78d (0.23–1.5) | 0.75 (0.5–1.5) | 0.5 (0.5–1.5) | 1.9 (1–4) | 3.5 (2–12) | 6 (1.5–6) | 3 (1.5–8) | 6 (3–12) | 6 (1–12) | 6 (1–16) |
| AUC (ng h/mL) | 42 ± 15 | 79 (31–136) | 70 ± 33 | 84 ± 24 | 103 ± 30 | 159 ± 60 | 170 ± 70 | 43 ± 20 | 95 ± 40 | 192 ± 83 | 319 ± 167 |
| 7.7 ± 3.8 | 4.7 (2.7–8.3) | 7.4 ± 3.1 | 6.9 ± 1.2e | 6.6 ± 2.1e | 6.5 ± 1.3e | 6.7 ± 2.3e | 7.7 ± 2.3f | 8.0 ± 1.7g | 9.1 ± 1.9g | 8.3 ± 1.9h | |
| 11.8 | 16.4 ± 8.4 | ||||||||||
| i | 40 (11.2%) | 88 (12.60%) | 66 (17.1%) | 91 | 104 | 157 | 168 | 46 | 115 | 180 | 297 |
Dose administered as 2 × 60 mg ER tablets.
reported as median (min-max) unless otherwise specified.
Data reported as mean ± SD.
Data reported as mean (range).
.
.
and.
.
and recalculated following naïve pooled analysis based on mean plasma concentrations for PK modeling.
Figure 6 compares fasted and fed condition models for both solution and NAL ER tablets (Study 2) using the Study 1 IV kinetic parameters. For the solution data (Figure 6A,B), the fed condition resulted in a more variable and higher compared to those fasted (Table 2). This was modeled with a slower stomach emptying function for the fed condition (Figure 2H vs I). Comparing the naïve pool area-under-the-curve values (, Table 2), there is no statistically significant food effect for fasted versus fed dosing.
Figure 6.

Prediction of profiles for fasted versus fed studies upon solution or ER tablet dosing, Study 2. Mean observed data are depicted by blue circles with the ± SD depicted by the shaded band. Model-predicted profiles are depicted by the solid black line. IV data from Study 1 were used for parametrization. Standard errors for each prediction are listed. (A) 60 mg fasted solution, (B) 60 mg fed solution, (C) 120 mg fasted ER tablet, and (D) 120 mg fed ER tablet.
For NAL ER tablets, in vitro drug release as a function of pH showed first-order dissolution across the NAL ER tablets 30–180 mg dose strengths (Supporting Figure S2). Inclusion of the drug release profile in the profiles for NAL ER tablets in the fasted state resulted in an increased relative to that in the solution study, similar to the observed values (Figure 6C). No change in was observed under fed relative to fasted state for the ER tablet (Table 2). The same stomach emptying functions as for solution (Figure 2H,I) were used, and the dissolution rate constant in the stomach () was optimized. The for fed was higher than fasted (3.5 vs 1.3) consistent with the higher gastric pH under fed conditions (1.7 vs 5.037).
The PDE-EHR model was able to successfully simulate observed PK differences in formulations and food effect between NAL solution and NAL ER tablets over a wide dose range (30–180 mg). The latter is illustrated in Figure 7 that shows the observed results (Study 3) and simulated profiles for doses of 30, 60, 120, and 180 mg NAL ER tablets under fasted state. Similar simulations were obtained when the solution and solid data sets in Figures 6 and 7 were conducted using the Aitkenhead et al. IV kinetics (see Figures S3 and S4).
Figure 7.

Prediction of profiles for PO ER tablet dosing studies, Study 3. Mean observed data are depicted by blue circles with ± SD depicted by the shaded band. Model-predicted profile is depicted by the solid black line. IV data from Study 1 were used for parametrization. Standard errors for each prediction are listed. (A) 30 mg, (B) 60 mg, (C) 120 mg, and (D) 180 mg.
Given the high permeability of NAL (biopharmaceutical classification system (BCS) Type 1, Table S8), P-gp activity is not expected to impact intestinal absorption. Though not explicitly included in the models above, the impact of P-gp on the absorption profile of the 180 mg ER tablet (Study 3) was simulated using the reported P-gp abundance profile34 along with the increasing P-gp expression ( parameters of 0.5×, 1×, and 2.5× the ) that bracketed those previously used to model the efflux of fexofenadine, a sensitive P-gp substrate.27 As expected, values of 0.5×, 1×, and 2.5× the resulted in minimal changes in profiles (Figure 8A) and AUC values (2, 3, and 7% decrease, respectively) (Figure 8B).
Figure 8.

Predicting impact of intestinal P-gp on absorption of NAL. Mean observed data for Study 3 180 mg dose are depicted by blue circles with ± SD depicted by the shaded band. 0.5–2.5× P-gp activity was modeled as described under Methods. (A) Model-predicted profiles are depicted by solid lines as follows: black, no P-gp; green, −0.5× P-gp; blue, −1× P-gp; and purple, 2.5× P-gp. (B) Predicted AUCs for each profile and the % AUC relative to no P-gp.
DISCUSSION
EHR has been modeled previously with ODE-based frameworks including a variety of time-delayed recycling schemes.14-18,20,21,23,24 Spatial aspects, such as bile secreted by gall bladder into the duodenum, have been previously modeled with discretized ODE-based intestinal models. Commercial software such as SimCYP, GastroPlus, and GI-Sim include a gall bladder compartment linking the liver to the duodenum “dissolved drug” compartment via a transfer rate constant.23,38 We have previously discussed comparisons between the PDE-based continuous intestinal absorption model and discrete ODE-based intestinal models.25-26,27 To our knowledge, the present manuscript is the first description of a PDE-based PDE-EHR model including a continuous intestinal compartment with a gall bladder and liver connected to a compartmental disposition model. An important addition to the previous continuous intestinal model includes a GUS expression function in the lower intestine to model gut deglucuronidation. The gall bladder emptying function, and gall bladder output as a combination of continuous drainage and post-prandial emptying, are based on literature physiological data.32,33 Together, these novel spatiotemporal elements of the PDE-EHR model were necessary for the prediction of observed NAL profiles upon oral dosing (Figures 4-7). Both parent drug and metabolite deglucuronidation EHR were necessary to recapitulate the observed PK profiles. The PDE-EHR model is more mechanistic in its mathematical representation of the intestine and gall bladder physiology than previous ODE-based models.
Most compartments in PK are modeled as well-stirred with the ODEs, whereas the PDE-based continuous intestinal absorption model considers spatial and temporal aspects of absorption. However, it is difficult to mathematically combine the ODE- and PDE-based models. In applied mathematics, stepwise solutions exist which are complex and time-consuming.39
Alternatively, PDEs can be converted into ODEs and solved with methods such as Method of Lines, again invoking large and complex matrices. Previously, we used the PDE-based absorption model output as an input function for the ODE-based PK models. With EHR, this unidirectional PDE-to-ODE framework does not work because of the continuous bidirectional recycling of drug between the intestine and systemic circulation via biliary secretion and reabsorption. One solution to this conundrum is to build PDE-based compartments with artificial rapid diffusion, where diffusion is sufficiently fast to eliminate the spatial differences in concentration. This PDE compartment mirrors a well-stirred ODE compartment. In the present PDE-EHR model, the ODE compartments were converted to 8 m long PDE compartments with cross-sectional areas required to achieve the correct volumes. This provides a facile method (see code, Supporting Information) to convert ODE-based PK models into PDE models.
Comparison of NAL PK upon IV versus PO solution dosing exhibits clear differences in terminal elimination half-life, indicating complexities in its disposition. NAL is known to be extensively glucuronidated, making it a good candidate for enterohepatic recirculation. This work developed a novel PDE-EHR model to predict the impact of NAL as well as NAL-glucuronide recirculation on drug disposition in healthy humans. The NAL data sets used are ideal to parametrize the PDE-EHR model because: (i) NAL is BCS class I with high solubility and high permeability; (ii) rich data sets from three independent clinical with IV and PO solution dosing are available (Figure 5); and (iii) for all data sets (Figures 5-7), post-dose feeding times are documented, a factor necessary for accurate absorption modeling.
The PDE-EHR simulations accurately model the impact of enterohepatic recirculation on the NAL disposition (Figures 5-7). For all studies used, the interindividual variability (standard deviations depicted in Figures 5-7 as shaded bands; see also Table 2) was very high. Given this high interindividual variability, the PDE-EHR simulations provide reasonable predictions of the population average NAL disposition. The model is expected to predict reasonably well altered drug disposition for special populations including varying DME genotype/phenotype, as well as disease states.
Presence of food decreased the NAL absorption rate for solution and ER tablet formulations, evidenced by increased variability in (Table 2). This food effect is expected and has been documented for numerous drugs. Delayed absorption due to food effects was simulated in the PDE-EHR model with the use of a food-delayed stomach emptying function (Figure 2I). It is interesting to compare the IV profiles used in this study (Figure 5A-C) with data in an additional publication.6 All three studies used in this work show a distinct early distribution phase. In these studies, subjects were fasted overnight and 4 h postdosing. The Lo et al. study was conducted with fed subjects and was not included in our analysis due to the absence of a PO arm. Interestingly, the IV data set therein exhibited no early distribution phase, likely due to the presence of food (ad lib diet). Plots for individual subjects in that study show many secondary peaks during the distribution phase (Figure S1). This highlights the importance of conducting fasted studies even with IV dosing when EHR is suspected.
For solid dosing studies, NAL concentrations at early time points were well predicted by the PDE-EHR model (Figures 6 and 7). Dissolution was modeled as a first-order process consistent with in vitro dissolution results (Supporting Information). For all fasted data sets in Study 2 and Study 3, the dissolution rate constant in the stomach, , was fixed at an optimized value of 0.13 min−1. For the fed data set in Study 2, an optimized value of 0.35 min−1 was used. An optimized intestinal dissolution rate constant, , of 0.15 min−1 was used. This value was doubled to 0.3 min−1 for the small tablet size (Study 3, 30 mg) and when two tablets were used (Study 2, 120 mg dosed as two 60 mg tablets). A higher intestinal dissolution rate is expected with increased surface area of the formulation. Previously, we modeled dissolution based on drug formulation particle size, and successfully reproduced disposition profiles for different formulations.25,27 In this study, dissolution modeling was simplified due to the availability of in vitro dissolution data across pH values for the different tablet formulations.
The potential impact of an intestinal P-gp – NAL interaction as a perpetrator or victim is an important clinical consideration in drug absorption. NAL is a P-gp substrate with efflux ratio of 10–15 in both Caco-2 and MDR1-MDCK cells, providing a mechanistic basis for parent EHR. However, the Study 1 mass balance results indicate that NAL is fully absorbed (>80% radioactivity secreted in urine, and <1% parent in feces) following oral administration (Table S4). Also, a proportional increase in oral exposure ( and AUC) over a wide dose range is observed (NAL ER 30–180 mg, Study 3). As expected for a BCS class 1 drug, simulations in Figure 8 show that NAL is unlikely to be a victim of P-gp inhibition. The change in NAL exposure with added P-gp activity is minimal (at most, a 7% change in AUC is predicted).
Notably, NAL is not a P-pg inhibitor. The IC50 for P-gp inhibition by NAL is >269 μM, with no inhibition of 10 μM digoxin with 269 μM NAL (>0.1 dose in 250 mL) in MDR1-MDCK cells (Table S7). The maximum NAL luminal concentration in solution for the highest dose (180 mg) is predicted by the PDE-EHR model to be 134 μM (Figure S5). Therefore, NAL is not expected to be a P-gp inhibitor at the clinical doses.
The PDE-EHR framework was developed with several rich and complete data sets for NAL, and future efforts with additional drugs including BCS classes 2–4 are planned for further refinement and eventual validation. Future improvements in EHR prediction will require additional experimental inputs e.g., spatial expression and activity of intestinal UGTs and GUS, and kinetics of hepatic apical transporter activity. For example, late peaks in profiles may be due to intestinal glucuronidation and efflux into the lumen (enteric cycling40). This could be modeled using UGT relative spatial expression and activity. We have modeled gall bladder emptying and refilling as simple first-order processes, whereas the physiological organ volume changes may be more complex. More complex models can be incorporated in future work, e.g., PBPK, physiological liver.
CONCLUSIONS
The PDE-EHR framework was developed based on a continuous intestinal absorption model interfaced to well-stirred liver, gall bladder, and central and peripheral compartments. The resulting models were able to simulate the hydrolysis and reabsorption of glucuronides in the distal intestine and accurately reproduce NAL concentration–time profiles for all clinical data sets. Accurate PK models in the presence of EHR can predict the impact of clinically relevant processes such as drug interactions and hepatic impairment, etc. The PDE-EHR model includes the entire hepatobiliary-gastrointestinal system and can model the impact of any pathophysiological change in these systems on drug disposition. For NAL, the PDE-EHR model can predict the impact of food as well as oral formulations on drug PK. We anticipate using the model in future formulation development and dosing regimen design for drugs undergoing an EHR.
Supplementary Material
ABBREVIATIONS
- AUC
area under the curve
- bdwidth
bile duct width in the gall bladder compartment
- BP
blood:plasma ratio
concentration–time
secretory clearance of metabolite
secretory clearance of parent
constant gall bladder emptying clearance
post-prandial, gall bladder emptying clearance
clearance into a membrane
intrinsic hepatic clearance
- dif
diffusion coefficient
- EHR
enterohepatic recirculation
fraction escaping gut metabolism
fraction of intestinal metabolite recycled
feeding time at
- GUS
β-glucuronidase
- ICF
informed consent form
first-order dissolution rate constant
first-order dissolution rate constant in stomach
length of buffer region
length of intestine
- NAL
nalbuphine
- NAL ER
nalbuphine extended-release oral tablet
- ODE
ordinary differential equation
- PDE
partial differential equation
- PK
pharmacokinetic
duration of the post-prandial emptying pulse
pulse from stomach to intestine, dissolved solid
pulse from stomach to intestine, solid
volume of the central compartment
- vel
velocity
volume of the gall bladder
cross-sectional surface area
Footnotes
Supporting Information
The Supporting Information is available free of charge at https://pubs.acs.org/doi/10.1021/acs.molpharma-ceut.4c00424.
Details of the clinical studies, in vitro studies, inputs for the PDE-EHR model development; prediction of profiles for fasted versus fed studies upon solution or ER tablet dosing (Study 2); prediction of profiles for PO ER tablet dosing studies (Study 3); simulation of soluble NAL in the lumen as a function of time and distance along the intestine for the 180 mg ER dose (Study 3); and full model code (Mathematica version 13.3) for PDE-EHR using IV data from Study 1 and 30 mg data from Study 3 (PDF)
The authors declare the following competing financial interest(s): S.N. and K.K. are co-founders of Kinetics & Simulation, LLC and are paid consultants at Trevi Therapeutics. AH is currently a paid consultant at Trevi Therapeutics Inc. She was previously a salaried employee of and owns stock in Trevi Therapeutics. DC and TS are salaried employees and own stock in Trevi Therapeutics Inc.
Contributor Information
Ken Korzekwa, Department of Pharmaceutical Sciences, Temple University School of Pharmacy, Philadelphia, Pennsylvania 19140, United States.
Swati Nagar, Department of Pharmaceutical Sciences, Temple University School of Pharmacy, Philadelphia, Pennsylvania 19140, United States.
David Clark, Trevi Therapeutics, New Haven, Connecticut 06510, United States.
Thomas Sciascia, Trevi Therapeutics, New Haven, Connecticut 06510, United States.
Amale Hawi, A. Hawi Consulting, Ridgefield, Connecticut 06877, United States.
REFERENCES
- (1).Nubain Product Label, 2019. https://www.accessdata.fda.gov/drugsatfda_docs/label/2019/018024s042lbl.pdf (accessed June 18, 2023).
- (2).Maher TM; Avram C; Bortey E; Hart SP; Hirani N; Molyneux PL; Porter JC; Smith JA; Sciascia T Nalbuphine Tablets for Cough in Patients with Idiopathic Pulmonary Fibrosis. NEJM Evid. 2023, 2 (8), No. EVIDoa2300083. [DOI] [PubMed] [Google Scholar]
- (3).Weisshaar E; Szepietowski JC; Bernhard JD; Hait H; Legat FJ; Nattkemper L; Reich A; Sadoghi B; Sciascia TR; Zeidler C; et al. Efficacy and safety of oral nalbuphine extended release in prurigo nodularis: results of a phase 2 randomized controlled trial with an open-label extension phase. J. Eur. Acad. Dermatol. Venereol 2022, 36 (3), 453–461. [DOI] [PubMed] [Google Scholar]
- (4).Aitkenhead A; Lin E; Achola K The pharmacokinetics of oral and intravenous nalbuphine in healthy volunteers. Br. J. Clin. Pharmacol 1988, 25 (2), 264–268. [DOI] [PMC free article] [PubMed] [Google Scholar]
- (5).Lo MW; Schary WL; Whitney CC Jr. The disposition and bioavailability of intravenous and oral nalbuphine in healthy volunteers. J. Clin. Pharmacol 1987, 27 (11), 866–873. [DOI] [PubMed] [Google Scholar]
- (6).Lo MW; Lee FH; Schary WL; Whitney CC The Pharmacokinetics of Intravenous, Intramuscular, and Subcutaneous Nalbuphine in Healthy-Subjects. Eur. J. Clin. Pharmacol 1987, 33 (3), 297–301. [DOI] [PubMed] [Google Scholar]
- (7).Hawi A; Alcorn H Jr.; Berg J; Hines C; Hait H; Sciascia T Pharmacokinetics of nalbuphine hydrochloride extended release tablets in hemodialysis patients with exploratory effect on pruritus. BMC Nephrol. 2015, 16, No. 47, DOI: 10.1186/s12882-015-0043-3. [DOI] [PMC free article] [PubMed] [Google Scholar]
- (8).Errick JK; Heel RC Nalbuphine. A preliminary review of its pharmacological properties and therapeutic efficacy. Drugs 1983, 26 (3), 191–211. [DOI] [PubMed] [Google Scholar]
- (9).Aungst BJ; Lam G; Shefter E Oral and rectal nalbuphine bioavailability: first-pass metabolism in rats and dogs. Biopharm. Drug Dispos 1985, 6 (4), 413–421. [DOI] [PubMed] [Google Scholar]
- (10).Schmidt WK; Tam SW; Shotzberger GS; Smith DH; Clark R; Vernier VG Nalbuphine. Drug Alcohol. Depend 1985, 14 (3), 339–362. [DOI] [PubMed] [Google Scholar]
- (11).Liang RJ; Shih YN; Chen YL; Liu WY; Yang WL; Lee SY; Wang HJ A dual system platform for drug metabolism: Nalbuphine as a model compound. Eur. J. Pharm. Sci 2020, 141, No. 105093. [DOI] [PubMed] [Google Scholar]
- (12).Gao S; Sun R; Singh R; So SY; Chan CTY; Savidge T; Hu M The role of gut microbial beta-glucuronidase in drug disposition and development. Drug Discovery Today 2022, 27 (10), No. 103316. [DOI] [PMC free article] [PubMed] [Google Scholar]
- (13).Sekirov I; Russell SL; Antunes LC; Finlay BB Gut microbiota in health and disease. Physiol. Rev 2010, 90 (3), 859–904. [DOI] [PubMed] [Google Scholar]
- (14).Ezzet F; Krishna G; Wexler DB; Statkevich P; Kosoglou T; Batra VK A population pharmacokinetic model that describes multiple peaks due to enterohepatic recirculation of ezetimibe. Clin. Ther 2001, 23 (6), 871–885. [DOI] [PubMed] [Google Scholar]
- (15).Plusquellec Y; Barre J; de Biasi J; Trenque T; Tillement JP; Houin G Application of a pharmacokinetic model with multiple enterohepatic cycles to a new inotropic drug after infusion and oral administration. J. Pharm. Sci 1992, 81 (10), 1020–1023. [DOI] [PubMed] [Google Scholar]
- (16).Huntjens DRH; Strougo A; Chain A; Metcalf A; Summerfield S; Spalding DJ; Danhof M; Della Pasqua O Population pharmacokinetic modelling of the enterohepatic recirculation of diclofenac and rofecoxib in rats. Br. J. Pharmacol 2008, 153 (5), 1072–1084. [DOI] [PMC free article] [PubMed] [Google Scholar]
- (17).Patterson BH; Levander OA; Helzlsouer K; McAdam PA; Lewis SA; Taylor PR; Veillon C; Zech LA Human selenite metabolism: a kinetic model. Am. J. Physiol 1989, 257 (3 Pt 2), R556–R567. [DOI] [PubMed] [Google Scholar]
- (18).Pollack GM; Brouwer KLR Physiologic and metabolic influences on enterohepatic recirculation: Simulations based upon the disposition of valproic acid in the rat. J. Pharmacokinet. Biopharm 1991, 19 (2), 189–225. [DOI] [PubMed] [Google Scholar]
- (19).Younis IR; Malone S; Friedman HS; Schaaf LJ; Petros WP Enterohepatic recirculation model of irinotecan (CPT-11) and metabolite pharmacokinetics in patients with glioma. Cancer Chemother. Pharmacol 2009, 63 (3), 517–524. [DOI] [PMC free article] [PubMed] [Google Scholar]
- (20).Colom H; Lloberas N; Andreu F; Caldes A; Torras J; Oppenheimer F; Sanchez-Plumed J; Gentil MA; Kuypers DR; Brunet M; et al. Pharmacokinetic modeling of enterohepatic circulation of mycophenolic acid in renal transplant recipients. Kidney Int. 2014, 85 (6), 1434–1443. [DOI] [PubMed] [Google Scholar]
- (21).Steimer JL; Plusquellec Y; Guillaume A; Boisvieux JF A time-lag model for pharmacokinetics of drugs subject to enterohepatic circulation. J. Pharm. Sci 1982, 71 (3), 297–302. [DOI] [PubMed] [Google Scholar]
- (22).Soulele K; Karalis V On the population pharmacokinetics and the enterohepatic recirculation of total ezetimibe. Xenobiotica 2019, 49 (4), 446–456. [DOI] [PubMed] [Google Scholar]
- (23).Stamatopoulos K; Pathak SM; Marciani L; Turner DB Population-Based PBPK Model for the Prediction of Time-Variant Bile Salt Disposition within GI Luminal Fluids. Mol. Pharmaceutics 2020, 17 (4), 1310–1323. [DOI] [PubMed] [Google Scholar]
- (24).Okour M; Jacobson PA; Ahmed MA; Israni AK; Brundage RC Mycophenolic Acid and Its Metabolites in Kidney Transplant Recipients: A Semimechanistic Enterohepatic Circulation Model to Improve Estimating Exposure. J. Clin. Pharmacol 2018, 58 (5), 628–639. [DOI] [PMC free article] [PubMed] [Google Scholar]
- (25).Nagar S; Radice C; Tuohy R; Stevens R; Bennyhoff D; Korzekwa K The Rat Continuous Intestine Model Predicts the Impact of Particle Size and Transporters on the Oral Absorption of Glyburide. Mol. Pharmaceutics 2023, 20 (1), 219–231. [DOI] [PMC free article] [PubMed] [Google Scholar]
- (26).Radice C; Korzekwa K; Nagar S Predicting Impact of Food and Feeding Time on Oral Absorption of Drugs with a Novel Rat Continuous Intestinal Absorption Model. Drug Metab. Dispos 2022, 50 (6), 750–761. [DOI] [PMC free article] [PubMed] [Google Scholar]
- (27).Nagar S; Korzekwa RC; Korzekwa K Continuous Intestinal Absorption Model Based on the Convection-Diffusion Equation. Mol. Pharmaceutics 2017, 14 (9), 3069–3086. [DOI] [PMC free article] [PubMed] [Google Scholar]
- (28).Ni PF; Ho NFH; Fox JL; Leuenberger H; Higuchi WI Theoretical model studies of intestinal drug absorption V. Nonsteady-state fluid flow and absorption. Int. J. Pharm 1980, 5 (1), 33–47. [Google Scholar]
- (29).Korzekwa K; Nagar S Process and System Clearances in Pharmacokinetic Models: Our Basic Clearance Concepts Are Correct. Drug Metab. Dispos 2023, 51 (4), 532–542. [DOI] [PMC free article] [PubMed] [Google Scholar]
- (30).Korzekwa K; Yadav J; Nagar S Using partition analysis as a facile method to derive net clearances. Clin. Transl. Sci 2022, 15 (8), 1867–1879. [DOI] [PMC free article] [PubMed] [Google Scholar]
- (31).Rohatagi S; Marbury C; Wyatt D; Sciascia T Safety and Pharmacokinetics of Nalbuphine Following Administration of Nalbuphine ER Tablets in Subjects with Impaired Hepatic Function. In 50th Annual European Society for Dermatological Research Meeting 2021, 2021. [Google Scholar]
- (32).Mackie CR; Baxter JN; Grime JS; Hulks G; Cuschieri A Gall bladder emptying in normal subjects–a data base for clinical cholescintigraphy. Gut 1987, 28 (2), 137–141. [DOI] [PMC free article] [PubMed] [Google Scholar]
- (33).Howard PJ; Murphy GM; Dowling RH Gall bladder emptying patterns in response to a normal meal in healthy subjects and patients with gall stones: ultrasound study. Gut 1991, 32 (11), 1406–1411. [DOI] [PMC free article] [PubMed] [Google Scholar]
- (34).Drozdzik M; Gröer C; Penski J; Lapczuk J; Ostrowski M; Lai Y; Prasad B; Unadkat JD; Siegmund W; Oswald S Protein Abundance of Clinically Relevant Multidrug Transporters along the Entire Length of the Human Intestine. Mol. Pharmaceutics 2014, 11 (10), 3547–3555. [DOI] [PubMed] [Google Scholar]
- (35).Hindmarsh AC; Brown PN; Grant KE; Lee SL; Serban R; Shumaker DE; Woodward CS SUNDIALS: Suite of nonlinear and differential/algebraic equation solvers. ACM Trans. Math. Softw 2005, 31 (3), 363–396. [Google Scholar]
- (36).Pilari S; Huisinga W Lumping of physiologically-based pharmacokinetic models and a mechanistic derivation of classical compartmental models. J. Pharmacokinet. Pharmacodyn 2010, 37 (4), 365–405. [DOI] [PubMed] [Google Scholar]
- (37).Malagelada J-R; Longstreth GF; Summerskill WHJ; Go VLW Measurement of Gastric Functions During Digestion of Ordinary Solid Meals in Man. Gastroenterology 1976, 70 (2), 203–210. [PubMed] [Google Scholar]
- (38).Gerner B; Scherf-Clavel O Physiologically Based Pharmacokinetic Modelling of Cabozantinib to Simulate Enterohepatic Recirculation, Drug-Drug Interaction with Rifampin and Liver Impairment. Pharmaceutics 2021, 13 (6), No. 778, DOI: 10.3390/pharmaceutics13060778. [DOI] [PMC free article] [PubMed] [Google Scholar]
- (39).Susto GA; Krstic M Control of PDE–ODE cascades with Neumann interconnections. J. Franklin Inst 2010, 347 (1), 284–314. [Google Scholar]
- (40).Chen J; Lin H; Hu M Metabolism of flavonoids via enteric recycling: role of intestinal disposition. J. Pharmacol. Exp. Ther 2003, 304 (3), 1228–1235. [DOI] [PubMed] [Google Scholar]
Associated Data
This section collects any data citations, data availability statements, or supplementary materials included in this article.