Abstract
We developed a quantitative enzyme immunoassay (EIA) for antibody to hepatitis E virus (HEV) by using truncated HEV capsid protein expressed in the baculovirus system to improve seroepidemiology, to contribute to hepatitis E diagnosis, and to enable vaccine evaluations. Five antigen lots were characterized; we used a reference antiserum to standardize antigen potency. We defined Walter Reed antibody units (WR U) with a reference antiserum by using the four-parameter logistic model, established other reference pools as assay standards, and determined the conversion factor: 1 WR U/ml = 0.125 World Health Organization unit (WHO U) per ml. The EIA performed consistently; median intra- and intertest coefficients of variation were 9 and 12%, respectively. The accurate minimum detection limit with serum diluted 1:1,000 was 5.6 WR U/ml; the test could detect reliably a fourfold antibody change. In six people followed from health to onset of hepatitis E, the geometric mean antibody level rose from 7.1 WR U/ml to 1,924.6 WR U/ml. We used the presence of 56- and 180-kDa bands by Western blotting as a confirmatory test and to define true-negative and -positive serum specimens. A receiver-operating characteristics plot identified 30 WR U/ml as an optimum cut-point (sensitivity, 86%; specificity, 89%). The EIA detected antibody more sensitively than a commercially available test. The EIA was transferred to another laboratory, where four operators matched reference laboratory results for a panel of unknowns. Quantitation of antibody to HEV and confirmation of its specificity by Western blotting make HEV serology more meaningful.
Hepatitis E is acute self-limited hepatitis caused by hepatitis E virus (HEV), which is excreted in feces and transmitted orally. In large parts of Asia and Africa, this disease is common, causing sporadic and epidemic illness (12). HEV serology to diagnose disease and identify individuals previously infected has improved steadily (2-6, 8, 9, 11, 18, 19). Nevertheless, the art remains imperfect (13).
Among the best tests for antibody to HEV are enzyme immunoassays (EIAs) that use recombinant open reading frame 2 (ORF2) protein expressed in insect cells by the baculovirus system (7, 19). We decided to improve this EIA by making it quantitative and reproducible. We used a highly purified antigen to reduce background signal and standardized it for potency to improve consistency across antigen lots or within a lot over time. We used a reference antibody standard and the four-parameter logistic model (17) for accurate quantitation of antibody potency. We established assay control parameters to ensure consistency.
The performance of an EIA is strongly determined by its antigen. Several lines of evidence identify the ORF2 protein as the HEV capsid protein (10, 19). When the HEV capsid protein is expressed by using the baculovirus system (rHEV capsid), it assumes a conformation that enables self-assembly into capsomers or particles and confers strong antigenicity (14, 15). The rHEV capsid protein truncated at amino acid 112 retains strong antigenicity with improved solubility. These results are observed whether the expression construct itself is truncated (14, 21) or harvest of expressed protein is delayed until amino-terminal posttranslational cleavage occurs (16). Posttranslational carboxy-terminal cleavage can also occur, yielding 62- and 56-kDa proteins and several minor species (14, 16). We evaluated both 62-kDa (14) and 56-kDa (16) proteins as antigens, eventually choosing the 56-kDa antigen because it was used as well to formulate a candidate HEV vaccine that entered clinical development at the Walter Reed Army Institute of Research (WRAIR) in collaboration with GlaxoSmithKline Biologicals.
The initiation of clinical trials with an HEV vaccine candidate at WRAIR heightened the imperative for quantitation of HEV capsid antibody by validated methods. Moreover, we recognized the need for a confirmatory test to improve specific detection of antibody for vaccine testing and seroepidemiology. Herein we report the preparation of reference pools of human HEV antiserum, their use in EIA to determine antigen and antibody potency, EIA performance and validation results, comparison of the WRAIR EIA to a commercially available test, and a Western blot confirmatory test. These data support the use of these methods for seroepidemiology and evaluations of HEV vaccine.
(Portions of this research were presented as an abstract at the IX Triennial International Symposium on Viral Hepatitis and Liver Diseases, Rome, Italy, 1996, and as an abstract at the annual meeting of the American Society of Tropical Medicine and Hygiene, Atlanta, Ga., 1997.)
MATERIALS AND METHODS
Reference human antibodies.
Two reference HEV antisera, designated pools 1 and 2, were prepared from serum collected from 43 (pool 1) and 35 (pool 2) donors from Nepal who were selected because a first-generation EIA (Genelabs Diagnostics, Singapore) indicated they had been infected with HEV. After a year of testing, we replaced these antiserum pools with larger ones sufficient for many years of routine use. Pool 4, which replaced pool 1, was prepared from serum collected from four donors approximately 6 months after they developed hepatitis E in Nepal. Pool 5, which replaced pool 2, was prepared from four similar convalescent specimens of lower potency. A negative control antiserum with reactivity equal to that of a no-serum control was prepared from an outdated plasma unit (blood bank, Walter Reed Army Medical Center, Washington, D.C.). Pool 1 was arbitrarily defined to contain 1,250 Walter Reed antibody units (WR U) per ml. The potency of all other reference HEV antisera was determined relative to pool 1. When a World Health Organization (WHO) reference HEV antibody standard became available (National Institute for Biological Standards and Control, Potters Bar, Hertfordshire, United Kingdom), we determined its potency to calculate a conversion factor from WR U per milliliter to WHO U per milliliter.
Other reference antibodies.
Monoclonal antibody 18.3A3.1.1F3 made to 62-kDa HEV antigen was a gift of Genelabs Technologies, Inc. (Redwood City, Calif.). Rabbit antibody to Sf9 cells infected with baculovirus was a gift of Novavax, Inc. (Rockville, Md.).
rHEV antigens.
Testing was initiated with lot 4b of 62-kDa rHEV capsid protein provided by Genelabs Technologies (14); it was arbitrarily assigned a potency of 10,000 Walter Reed antigen units (WR Ag U) per ml. Titration of lot 4b against pools 1 and 2 diluted 1:100 and 1:1,000 suggested that 100 ng of antigen per well, equal to a concentration of 33 WR Ag U/ml, gave acceptable sensitivity and economy. Subsequently, testing was done with rHEV capsid protein from Novavax (lots 229.2, 235, 246, and 247) containing 56-kDa rHEV capsid protein (16). The potency of antigen lot 229.2 was defined relative to the 4b reference lot. Later, antigen lot 235 was made the antigen standard, and the potency of subsequent antigen lots was defined relative to it.
Relative potency.
The relative potency of reference antisera and antigen, as well as that of new working antigen lots, was determined by parallel line assay and calculation of a common slope (1). The standard and test article were tested on the same 96-well plate in at least three replicate wells at 5 or 6 serial dilutions with no greater than threefold differences. Antigen potency was defined with pool 1 diluted 1:20,000. Antibody potency was defined with antigen diluted to 33 WR Ag U/ml. The EIA protocol is described below. Optical density (OD) values and dilutions were log transformed to give linear dose-response plots.
SDS-PAGE and Western blot analysis.
For sodium dodecyl sulfate-polyacrylamide gel electrophoresis (SDS-PAGE), rHEV capsid protein or other control antigens, diluted in phosphate-buffered saline (PBS), were denatured for 3 min at 100°C in Tris-glycine-SDS sample buffer (Novex, San Diego, Calif.) with or without 10% 2-mercaptoethanol. Samples were electrophoresed on 1-mm-diameter precast 4 to 20% acrylamide gels (Novex), which were either stained with Coomassie blue solution or transferred to polyvinylidene difluoride (PVDF; Novex) in Towbin's buffer for 16 h at 65 mA. Western blotting was carried out on rinsed membranes treated with EIA blocking buffer (see Results) for 2 h at room temperature and then washed three times in 10 mM PBS (pH 7.4) containing 0.05% Tween 20 (PBST). Treated PVDF membranes or strips were incubated for 16 to 18 h at room temperature with reference antibodies or test serum specimens diluted 1:500 in EIA blocking buffer. Following washing, membranes were incubated for 1.5 h at room temperature with goat anti-human immunoglobulin A (IgA) plus IgG plus IgM (heavy plus light chains [H+L]) conjugated to alkaline phosphatase (Kirkegaard and Perry, Gaithersburg, Md.) diluted 1:2,000 in EIA blocking buffer. Following washing with PBST and 0.05 M Tris (pH 8.0), membranes were incubated for 3 min in room temperature-warmed 5-bromo-4-chloro-3-indolylphosphate-nitroblue tetrazolium (BCIP/NBT) phosphatase substrate (Kirkegaard and Perry). The reaction was stopped by immersing the membranes in water. Each immunoblot strip used to confirm the presence of antibody to rHEV capsid contained 1 μg of rHEV antigen. Strips were considered positive for antibody to rHEV capsid protein if assay-positive and -negative controls gave the expected results and a band was clearly visible at both 56 and 180 kDa.
WRAIR EIA optimization.
We identified an optimal 96-well plate, blocking solution, and antibody conjugate dilution in that order. The readout for optimization tests was a signal/noise ratio with pool 1 and the negative control standard (each diluted 1:100 to 1:10,000) reacted with 33 WR Ag U/ml. We tested six microtiter plates from four manufacturers and blocking buffers comprised of 10 mM PBS (pH 7.4) supplemented with various mixtures of bovine serum albumin, gelatin, casein, goat serum, and Tween 20 (all from Sigma, St. Louis, Mo.). We tested goat anti-human IgA plus IgG plus IgM (H+L) conjugated to horseradish peroxidase (HRP; Kirkegaard and Perry) at twofold dilutions from 1:500 to 1:4,000.
WRAIR EIA protocol.
One hundred microliters of antigen containing 3.3 WR Ag U diluted in 0.05 M carbonate-bicarbonate buffer (pH 9.6) (Sigma) was added to each well of a 96-well plate for 1 h at room temperature and 18 h at 4°C. The plate was machine washed (Skan Washer; Skatron, Sterling, Va.; with all washes throughout the EIA protocol repeated seven times and with the sixth wash left to soak 1 min) with PBST. Blocking buffer was added at 270 μl per well for 1 h at 37°C, and then the plate was machine washed. Serum specimens, six serial dilutions of the reference antibody standard, the midrange positive control, and the negative control serum, all freshly diluted in blocking buffer, were added to replicate wells at 100 μl per well for 2 h at 37°C. The plate was machine washed. Goat anti-human Ig-HRP tag in blocking buffer with 0.2% Tween 20 was added at 100 μl per well for 1.5 h at 37°C. The plate was machine washed. All wells except the two blank wells were filled with 3,3′,5,5′-tetramethylbenzidine (TMB) peroxidase substrate (Kirkegaard and Perry) at 100 μl per well for exactly 10 min. The reaction was stopped by addition of 100 μl of 0.18 N sulfuric acid to each well except the blanks. Within 5 min, the plate was read with the plate blank subtracted, at 450/650 nm in a SpectraMax 340 EIA reader (Molecular Devices, Sunnyvale, Calif.) set for four-parameter analysis. The instrument's software fit a four-parameter dose-response curve to the OD results of the standards, calculated the correlation (R2) between the diluted antibody standard's measured and expected results, and calculated the antibody content of unknowns from the standard curve equation.
Serum specimens.
Serum specimens stripped of personal identifiers were obtained from archives at the WRAIR and the Armed Forces Research Institute of Medical Sciences. All were from volunteers enrolled in research protocols approved by local Institutional Review Boards and the Human Subjects Research Review Board of the U.S. Army Surgeon General. Serum specimens and controls were stored at −20°C. Specimens were thawed and stored at 4°C until testing was complete; antibody controls were aliquoted into small volumes to minimize repeated freeze-thaw cycles.
WRAIR EIA control parameters.
Initial assay runs revealed that operator technique strongly affected quantitation; therefore, control parameters were required to ensure accuracy and consistency. Eighteen wells on each plate were utilized for the following controls tested in duplicate: 6 half-log dilutions of the HEV antibody standard (pool 4),the midrange positive control (pool 5), the negative control, and a no-serum control. After one of us (J.S.) ran this assay several times per week for more than a year, 30 consecutive technically adequate runs were reviewed to calculate limits for control parameters as the mean ± 1.96 (standard deviation [SD]) of log-transformed values (OD units or WR U per milliliter, as appropriate). Thereafter, assays were accepted according to these limits.
Quantitation.
By using the four-parameter logistic model for quantitation, accuracy is greatest at the midpoint of the standard curve and least at the lower and upper limits. We established the following protocol to ensure consistency. Specimens were always tested in duplicate—initially at 1:1,000 unless a high level of antibody was anticipated—and results were rejected if the coefficient of variation (CV) was >20%. Specimens tested at 1:1,000, which gave low values out of range, were reported as <1 WR U/ml; values <3 WR U/ml were recognized to be imprecise, but accurate quantitation of low-level antibody to HEV was of secondary importance. Specimens giving high values out of range or any OD of >3.50 were diluted 1:10,000 and 1:100,000 and were retested. Specimens tested initially at 1:10,000, which gave an OD of <0.500, were retested at 1:1,000. When temporal changes in an individual's antibody level required determination, all specimens were tested on the same plate.
WRAIR EIA performance and validation.
Accuracy of quantitation was determined by comparing observed versus expected values for pool 4 standard dilutions and the midrange positive control. Reproducibility was assessed by testing many replicates of a specimen panel in duplicate plates twice over a week and by plotting the trend of the midrange positive, negative, and no-serum controls over 50 consecutive technically adequate assays performed over 1 year. The EIA was transferred from one operator in Washington, D.C., to several in Bangkok, Thailand, by use of identical materials and training. A competency panel of 24 coded specimens ranging in antibody content from 5.7 to 1,266.7 WR U/ml was created and retested to assign reference values. Aliquots of these specimens were sent to Bangkok. A new operator was certified to perform the test when three of four consecutive assay runs were acceptable and the correlation between observed and reference values for the competency panel in each run was >0.9.
Comparison of antibody potency by WRAIR and Genelabs Technologies EIAs.
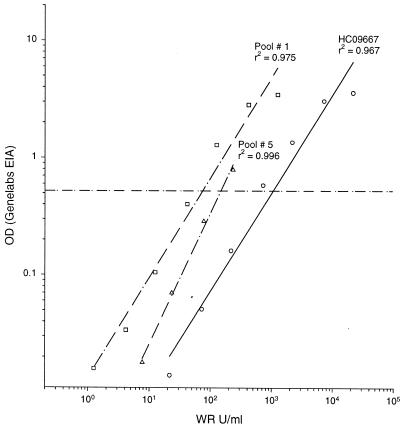
To characterize the relationship between antibody potency determined in the WRAIR EIA and a widely used commercial test (HEV enzyme-linked immunosorbent assay [ELISA]; Genelabs Technologies, Singapore), we tested dilutions of three specimens in both tests. The commercial test employs a mixture of recombinant HEV ORF2 and ORF3 polypeptides expressed in Escherichia coli, which are absent from the WRAIR test's 56-kDa rHEV capsid antigen. The commercial test results were expressed in OD units, whereas WRAIR EIA results were expressed in WR U per milliliter. Three regression lines were derived, and the portions of each titration curve above each assay's cut-point were compared.
RESULTS
Purity and potency of HEV capsid antigens.
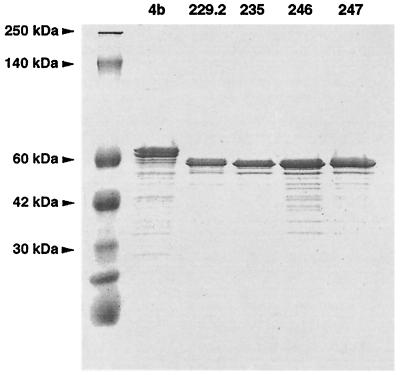
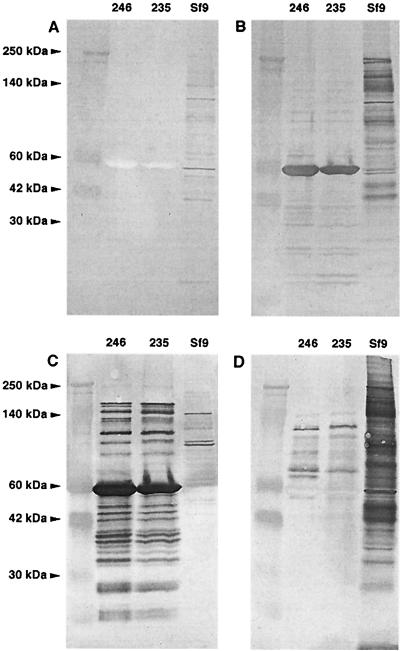
We evaluated the purity of rHEV capsid antigen lots by SDS-PAGE analysis. Both 62- and 56-kDa antigens had similar Coomassie blue staining patterns with few protein bands (Fig. 1). To further analyze the purity of the antigens, Western blots of lots 235 and 246 were probed with negative control serum (Fig. 2A), pool 1 (Fig. 2B), monoclonal antibody to HEV capsid (Fig. 2C), and antiserum to Sf9 cells infected with baculovirus (Fig. 2D). The results showed that rHEV antigen contained highly antigenic 56-kDa protein and other forms of rHEV antigen of higher and lower molecular weight recognized by polyclonal and monclonal antibodies. There was no reaction of the negative control serum with any antigen component. Some host cell proteins were identified, but markedly less than in the Spodoptera frugiperda (Sf9) host cell control antigen. The antigens' purity and similar reaction profiles suggested they could be interchanged with an adjustment for different potencies (Table 1). Pilot experiments defined 33 WR Ag U/ml as the optimal antigen concentration.
FIG. 1.
SDS-PAGE analysis of five rHEV antigens lots stained with colloidal Coomassie blue. Lot 4b was 62-kDa antigen, and all other lots were 56-kDa antigen.
FIG. 2.
Western blots of two rHEV antigen lots run with Sf9 host cell antigens (7 μg of each sample, denatured without mercaptoethanol); blots are probed with normal human control antiserum (A), pool 1 human antiserum to HEV (B), monoclonal antibody to HEV capsid (C), and antiserum to Sf9 cells infected with baculovirus (D).
TABLE 1.
Relative potency of rHEV antigen lots calculated by parallel line assay
| Antigen lot | Amt of protein (μg/ml) | WR Ag
|
Relative potency | |
|---|---|---|---|---|
| U/ml | U/mg | |||
| 4ba | 0.345 | 10,000 | 29,000 | 1st interim standard |
| 229.2 | 0.458 | 11,970 | 26,900 | 0.9b |
| 235 | 0.380 | 11,000 | 28,900 | 2nd interim standard |
| 246 | 1.230 | 41,800 | 34,000 | 1.2c |
| 247 | 2.100 | 39,600 | 18,900 | 0.6c |
Molecular mass, 62 kDa; molecular mass in all other lots, 56 kDa.
Compared to lot 4b.
Compared to lot 235.
Potency of reference antibodies.
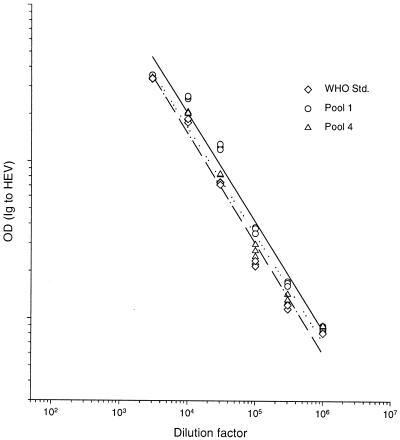
When work began on this test, there was no reference standard for antibody to HEV. We created pool 1 as an in-house standard, reasoning that it contained potent antibodies that were elicited a defined interval (<6 months) after infection. Because we recognized that antibody activity in a direct EIA might be influenced by the interval between infection and collection of a serum specimen, we created pool 2 from donors with more remote infections (>1 year up to at least several years). Comparison of these two antisera in a parallel line assay showed that they had a common slope (data not shown), suggesting that pool 1 could be used as a standard to quantitate both recently and remotely elicited antibody to rHEV capsid. When new standards were introduced into the EIA, they also were subjected to the parallel line assay (Fig. 3) to measure their potency relative to pool 1 (Table 2). Recently, a WHO reference HEV antibody standard (100 WHO U/ml) became available. Its potency by parallel line assay (Fig. 3) was 800 WR U/ml; accordingly, the conversion factor from WR U per milliliter to WHO U per milliliter is 0.125.
FIG. 3.
Parallel line assay comparing three reference antibodies: the WHO reference standard (Std.) (dashed line), pool 4 (dotted line), and pool 1 (solid line).
TABLE 2.
Potency of reference antibodies to rHEV calculated by parallel line assay
| Reference antibody pool | No. of donors | Interval from infection (mo) | Potency (WR U/ml) |
|---|---|---|---|
| 1 | 43 | ∼3 | 1,250a |
| 2 | 35 | ≥12 | 360 |
| 4 | 4 | 8 | 944 |
| 5 | 4 | 8 | 232 |
| WHO standard | 1 | Acute serum | 800 |
Potency of pool 1 was set at 1,250 WR U/ml; other standards were defined relative to it.
EIA optimization.
We performed pilot experiments to select the 96-well plate, blocking buffer, and antibody conjugate dilution. The Immulon-1 plate (Dynex Technologies, Chantilly, Va.) gave the highest signal/noise ratio of six plates tested (data not shown). The blocking buffer finally selected was 10 mM PBS (pH 7.4) containing 0.5% casein and 0.5% bovine serum albumin. The antibody conjugate dilution prepared in blocking buffer supplemented with 0.2% Tween 20 giving the highest signal/noise ratio was 1:4,000. All subsequent assays used these specifications.
EIA control parameters and assay stability.
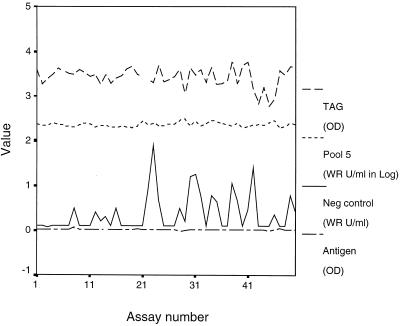
To ensure EIA accuracy and consistency, we empirically set control parameters and used individual plate standards and controls. The stability of the assay was apparent from a plot of control parameters for 50 consecutive acceptable assays performed over 1 year (Fig. 4) and their narrow interquartile ranges (Table 3).
FIG. 4.
Plots of the HRP label (TAG), midrange positive control (Pool 5), negative control (Neg), and no-serum control (Antigen) over 50 technically adequate assays.
TABLE 3.
Variation in EIA control parameters observed over 1 year in 50 consecutive acceptable assays
| Parameter | Acceptable valuesa | Value(s) over 1 yr (n = 50)
|
|
|---|---|---|---|
| Median | Interquartile range | ||
| Expected response for zero antibody level (OD units) | 0-0.138 | 0.043 | 0.022-0.078 |
| Expected response for infinite antibody level (OD units) | 3.625-5.075 | 4.068 | 3.850-4.219 |
| Median effective antibody level (WR U/ml) | 27-192 | 96 | 60-135 |
| Slope of the corresponding logit-log plot | 0.992-1.541 | 1.208 | 1.140-1.306 |
| Pool 5 midrange serum control (WR U/ml) | 189-324 | 226 | 214-250 |
| Negative serum control (WR U/ml) | 0-2 | 0.1 | 0.1-0.5 |
Minimum to maximum.
EIA accuracy, reproducibility, and detection limit.
We characterized assay accuracy by evaluating the goodness of fit between the six reference antibody values created by serial dilution and the observed dose-response curve generated by the four-parameter logistic model. In 50 acceptable assays, the mean (±SD) goodness-of-fit statistic (R2) was 0.999 (±0.00039). The consistently small difference between observed and expected values of the standard provided evidence for test accuracy. Additionally, we defined the error of quantitation for the mid-range-positive control in the same 50 assay data set. The percent error for each assay was calculated by comparing the calculated and reference values. The median error was 7.7% (range, 0.1 to 34.2%).
To characterize assay reproducibility, we selected 8 test specimens with antibody levels ranging from 11 to 401 WR U/ml and tested them as 7 to 12 replicates on two plates daily for 2 days (Table 4). Median intratest variation expressed as percent CV was 9% (range, 2 to 21%); median intertest variation was 12% (range, 6 to 37%). As is characteristic of quantitation with the four-parameter logistic, Table 4 shows that the intertest percent CV was greatest for samples having low levels of antibody (34 to 37% for samples with <20 WR U/ml) and smallest for samples near the assay midpoint (6 to 9% for samples with 46 to 176 WR U/ml).
TABLE 4.
Intra- and interassay variation observed for quantitation of eight unknowns
| Mean level (WR U/ml) of Ig to HEV in test seruma | % CVb (mean Ig to HEV [WR U/ml])
|
||||
|---|---|---|---|---|---|
| Intratest
|
Intertestc | ||||
| Day 1
|
Day 2
|
||||
| Plate 1d | Plate 2 | Plate 1 | Plate 2 | ||
| 11 (4-18) | 14 (14) | 8 (16) | 10 (8) | 8 (9) | 34 |
| 19 (5-33) | 13 (29) | 14 (22) | 4 (13) | 4 (14) | 37 |
| 46 (40-52) | NDe | ND | 3 (43) | 2 (48) | 6 |
| 125 (110-140) | ND | ND | 7 (123) | 5 (126) | 6 |
| 176 (146-206) | ND | ND | 7 (168) | 8 (184) | 9 |
| 304 (227-381) | 7 (338) | 12 (312) | 10 (275) | 13 (292) | 13 |
| 378 (289-467) | 5 (421) | 10 (353) | ND | ND | 12 |
| 401 (276-526) | 7 (398) | 21 (404) | ND | ND | 16 |
From all replicates, the 95% confidence interval (CI [in parentheses]) was estimated as the mean ± (1.96 × SD).
CV is 100 × SD/mean.
Calculated with data from all plates.
There were 7 to 12 replicates of each specimen per plate.
ND, not determined.
Consistent performance of the assay was demonstrated by plots of the midrange positive, negative, tag, and no-serum controls over 50 technically adequate assays (Fig. 4).
The assay's predicted detection limit based on the pool 4 standard is 0.1 WR U/ml. To characterize the assay's detection limit in practice, we tested serial twofold dilutions of the midrange positive control. The limit of detection was defined as the lowest observed quantitation with <50% error. In experiments conducted on 3 separate days, the limit of accurate detection was 5.6 WR U/ml (Table 5).
TABLE 5.
Assay detection limit established by titration of pool 5 reference antiserum
| Expected value from dilution factor (WR U/ml) | Value observed in assay (WR U/ml)a
|
Accurate quanti- tation | ||
|---|---|---|---|---|
| Expt 1 | Expt 2 | Expt 3 | ||
| 180.0 | 177.1 (−1.6) | 179.8 (0.1) | 182.9 (1.6) | Yes |
| 90.0 | 74.2 (−17.6) | 83.4 (−7.3) | 82.8 (−8.0) | Yes |
| 45.0 | 36.6 (−18.7) | 38.4 (−14.7) | 39.5 (−12.2) | Yes |
| 22.5 | 17.5 (−22.2) | 20.0 (−11.1) | 19.1 (−15.1) | Yes |
| 11.2 | 9.9 (−11.6) | 10.2 (−8.9) | 9.0 (−19.6) | Yes |
| 5.6 | 4.9 (−12.5) | 4.8 (−14.3) | 3.6 (−35.7) | Yes |
| 2.8 | 0.3 (−89.3) | 1.0 (−64.3) | 0.6 (−78.6) | No |
The percent error is given in parentheses.
Definition of seroconversion.
To define what increase in antibody over time could be equated with a seroconversion, we investigated how antibody levels changed in paired serum specimens collected 6 months apart from healthy adults (n = 58) residing in the United States, where there is little to no transmission of HEV. The median antibody level in the first serum specimen was 13.6 WR U/ml (range, 3.0 to 33.0 WR U/ml); the mean percent change in antibody, reflecting both true antibody concentration variation and random test and specimen dilutional error, was 29% (SD = 21%). Given this small error, we conservatively defined a twofold difference (i.e., the mean plus 8 SD) as the upper limit of random variation and a fourfold difference as a true antibody concentration change.
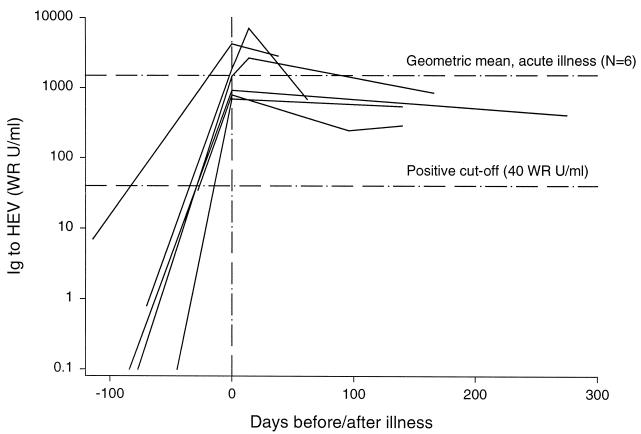
To define what rise in antibody level is typical in hepatitis E, we selected six members of a cohort of healthy pregnant females in Nepal, who after cohort entry developed hepatitis E defined by jaundice, elevated alanine aminotransferase levels, and detection of HEV RNA detected by reverse transcription-PCR assay (20). Their geometric mean antibody level pre-illness was 7.1 U/ml, rose to 1,924.6 WR U/ml on the day of illness evaluation, and declined slightly to 721.1 WR U/ml a median of 140 days later (range, 38 to 275 days) (Fig. 5).
FIG. 5.
Levels of antibody to HEV in six patients with hepatitis E determined before infection, when acutely ill (vertical reference line at day 0), and during convalescence. The lower horizontal reference line is the more specific assay cut-point (40 WR U/ml), and the upper reference line is the geometric mean level of acute illness antibody (1,925 WR U/ml).
EIA cut-point and confirmatory test.
To use the EIA to define population exposure to HEV, a conservative lower limit of antibody indicating past infection had to be defined. High specificity, meaning a high cut-point, was needed to draw correct epidemiological inferences. On the other hand, to conservatively assess the immunogenicity of a candidate HEV vaccine, an upper limit of antibody indicating immunological naivete was desirable. High sensitivity, meaning a low cut-point, was required to make an unbiased estimate of vaccine effect. These competing needs suggested no single cut-point could satisfy both requirements. More problematic was that any estimate of a cut-point's specificity required identification of people truly lacking antibody to HEV.
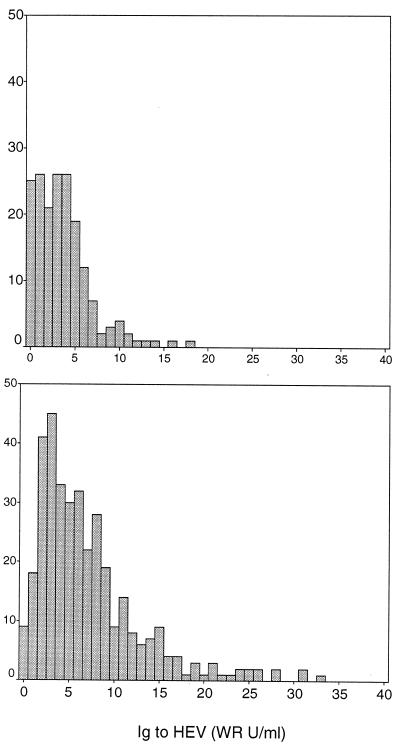
Initially, specificity was assessed with a specimen set from people without epidemiologically plausible exposure to HEV based on geography or age. Specimens came from the following individuals: healthy infants in Bangkok 6 to 9 months of age (n = 79); children 2 to 14 years of age with dengue fever in Bangkok at hospital discharge (n = 99); healthy adults from Greater Washington, D.C., who participated in vaccine studies (n = 194); healthy U.S. soldiers from Fort Bragg, N.C., who participated in a vaccine study (n = 58); and healthy U.S. soldiers deployed to Haiti (n = 108). We considered this set to be true-negative specimens. The distribution of EIA results differed between Thailand children (mean = 3.6 WR U/ml, SD = 3.1 WR) and U.S. adults (mean = 7.1 WR U/ml, SD = 6.1). Nevertheless, in both subsets, most had antibody to rHEV capsid protein <10 WR U/ml, and few had an antibody level of ≥20 WR U/ml (Fig. 6).
FIG. 6.
Histogram of EIA values in specimen sets from donors lacking plausible exposure to HEV. The top panel includes 178 infants and children from Bangkok, Thailand (mean = 3.6 WR U/ml, SD = 3.1). The bottom panel includes 360 adults from the United States (mean = 7.1 WR U/ml, SD = 6.1).
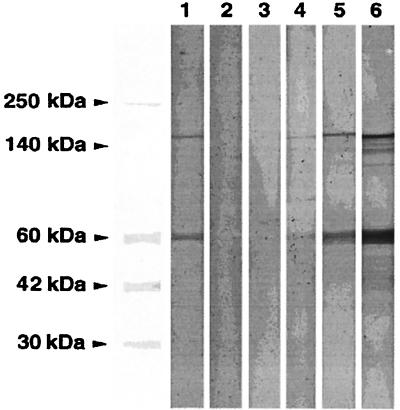
We suspected that the EIA occasionally detected antibodies to low-level insect cell and/or baculovirus proteins present in the 56-kDa antigen that could cause false positives. Accordingly, we used a Western blot confirmatory test (Fig. 7) to identify true-positive specimens with antibody to HEV (i.e., bands at 56 and 180 kDa) and true negatives without antibody to HEV capsid (i.e., absent bands at both 56 and 180 kDa). A convenience sample of specimens (n = 359) from the following individuals were tested by EIA and Western blotting: healthy adults from Washington, D.C., Iowa, and North Carolina (n= 122); healthy employees of the U.S. State Department returning from overseas (n = 38); healthy German and Australian travelers returning from Nepal (n = 40); healthy Brazilian gold prospectors living in the Amazon (n = 52); healthy soldiers from India, Bangladesh, Nepal, and Pakistan (n = 61); and patients with jaundice in Nepal (n = 46). Few specimens with a level of Ig to HEV of <10 WR U/ml were confirmed by Western blotting, whereas the proportion of EIA results confirmed by Western blotting increased from 32% to 63% as the EIA cut-point was raised from 20 WR U/ml to 40 WR U/ml (Table 6). All specimens with ≥100 WR U/ml were confirmed positive.
FIG. 7.
Western blot confirmation test. Lanes: 1, pool 5 positive control; 2, negative control; 3, negative specimen with 30 WR U/ml; 4, positive specimen with 56 WR U/ml; 5, positive specimen with 137 WR U/ml; 6, positive specimen with 713 WR U/ml.
TABLE 6.
Proportion of EIA-positive specimens confirmed by Western blotting, stratified by donor category
| Donor category (n) | No. positive/no. tested by EIA result (WR U/ml) of:
|
||||
|---|---|---|---|---|---|
| <10 | 10-19.9 | 20-39.9 | 40-99.9 | ≥100 | |
| U.S., healthy adults (122) | 7/102 | 1/7 | 6/7 | 4/4 | 2/2 |
| U.S., State Department employees (38) | 0/10 | 4/14 | 5/9 | 5/5 | |
| German/Australian healthy travelers to Nepal (40) | 0/23 | 0/3 | 0/10 | 0/3 | 1/1 |
| Brazil, healthy gold prospectors from Amazon (52) | 0/14 | 0/5 | 1/3 | 12/25 | 5/5 |
| South Asiaa, healthy soldiers (61) | 3/30 | 0/2 | 9/10 | 19/19 | |
| Nepal, hepatitis patients (46) | 0/9 | 6/6 | 31/31 | ||
| Total (359) | 10/188 | 1/17 | 11/34 | 36/57 | 63/63 |
| % Confirmed (95% CI)b | 5 (3-10) | 6 (0-29) | 32 (17-49) | 63 (49-76) | 100 (94-100) |
India, Bangladesh, Nepal, and Pakistan.
Exact confidence interval (CI) for the binomial distribution.
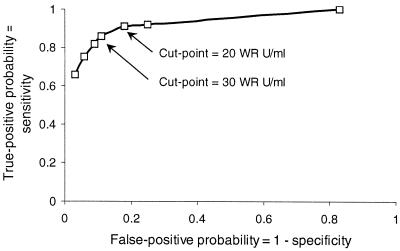
The convenience set's true-negative (n = 238) and -positive (n = 121) specimens, defined by Western blotting, were used to estimate test specificity and sensitivity for cut-point values ranging from 1 to 60 WR U/ml. A receiver-operating characteristic curve plotting these data (Fig. 8) identified 30 WR U/ml as the cut-point combining the greatest sensitivity and specificity.
FIG. 8.
Receiver-operating characteristics plot for EIA based on true-negative and -positive samples defined by Western blotting.
Assay validation.
Four operators at the Armed Forces Research Institute of Medical Sciences in Bangkok, Thailand, were trained to perform the EIA. Within several weeks, all met the certification criteria (see Materials and Methods), furnishing strong evidence that the EIA can be used for accurate and reproducible quantitation in a recipient laboratory.
Comparison of antibody potency by WRAIR and Genelabs Technologies EIA.
We found a consistent and highly correlated relationship between antibody binding assessed by the WRAIR EIA and a commercial test widely available in Asia for three serum samples containing recently elicited antibodies (pool 1 and HCO9667) or remotely elicited antibodies (pool 5) to HEV (Fig. 9). Nevertheless, a proportion of each titration curve was to the right of the WRAIR cut-point (30 WR U/ml; i.e., positive), but below the Genelabs cut-point (i.e., negative). The greater sensitivity of the WRAIR test for low levels of antibody makes it better suited than the Genelabs test for seroepidemiology or screening vaccine trial subjects for prior exposure to HEV infection. In the case of the HC09667 and pool 1 specimens, which contain IgM and IgG to HEV (data not shown), the ability of the WRAIR test to detect total Ig, in contrast to the Genelabs Diagnostics test, which detects IgG only, may have conferred additional sensitivity to the WRAIR test.
FIG. 9.
Comparison of antibody quantitation by WRAIR and Genelabs Technologies EIA. The dashed horizontal reference line is the cut-point for the Genelabs test.
DISCUSSION
We have developed and validated an accurate and reproducible indirect EIA to quantitate antibody to HEV. The EIA uses well-characterized reagents, the potency of which is determined relative to that of reference preparations. We enhanced the value of the test by developing a Western blot confirmatory assay. EIA performance was exhaustively evaluated. The methods described could standardize testing for antibody to HEV, making seroepidemiology studies more easily comparable and making evaluation of an HEV vaccine candidate possible.
The foundation of the EIA is a highly pure rHEV truncated capsid antigen. The antigen purity used in an earlier version of this test (19) was not disclosed. Our test's antigen consisted of rHEV contaminated by minimal amounts of Sf9 host cell and baculovirus proteins that could be detected with a potent antiserum, but were undetectable with a negative serum control. Nevertheless, we did observe that some human serum specimens contain antibodies to these proteins that cause background reactivity and false-positive EIA tests, depending on the cut-point established.
Although the rHEV capsid antigen had a predominant molecular mass of 56 kDa, it also contained smaller and larger immunoreactive molecules presumably representing cleavage products and oligomers of these and the 56-kDa capsid molecule. These oligomers could be partially disrupted by heating with 2-mercaptoethanol. Whether variation in the complexity of the rHEV capsid antigen alters its antigenicity is unknown.
On the other hand, we observed that antigen lots prepared at research scale (up to several hundred milligrams) by two manufacturers were similarly pure and had similar antigenicity. In five lots tested, the antigen content per milligram of total protein varied twofold. Because this variability could potentially contribute to assay instability, we controlled for this effect by developing a protocol to measure antigen potency by using a reference antiserum. Knowledge of antigen potency allowed us to specify the antigen activity used in the test. By testing each working stock of antigen periodically, we were able to adjust the antigen dilution to consistently meet the test's specification. We believe this procedure contributed importantly to assay stability, and we demonstrated that the test performed consistently over 1 year.
Another critical step in developing the EIA was the creation of reference antibody pools to HEV by using human convalescent antiserum from Nepal where hepatitis E is endemic. We found that four pools from a variety of donors sampled in either 1988 or 1992 yielded dose-response curves varying only in relative potency when reacted with rHEV antigen. When a WHO reference antibody from a single donor convalescent from hepatitis E in India became available, it also had a similar dose-response curve. Because the pools were collected a few months to several years after infection, they presumably contained various amounts of IgM and IgG to HEV. Nevertheless, the results suggested that serum reactivity to the test antigen is independent of the Ig isotype mix or place or time of donor infection and dependent only on the concentration of Ig to HEV. Consequently, the antibody potency of all pools could be estimated relative to reference pool 1, initially assigned an arbitrary value in WR U per milliliter. The largest highly potent reference antibody pool (pool 4) was designated the working standard. By including dilutions of pool 4 in every assay, the potency of any unknown specimen could be determined relative to it. Furthermore, WR U are convertible to WHO U (conversion factor, 0.125) now that a WHO antibody standard is available and has been shown to yield a titration curve parallel to pool 4.
Of the several approaches for EIA quantitation of an unknown by using a standard curve, we chose the four-parameter logistic model, generally considered to be the most accurate and reproducible (17). Six half-log dilutions of the pool 4 standard generated a sigmoid dose-response curve ranging from 1 to 313 WR U/ml; this gave the EIA a broad dynamic range and allowed most unknown specimens to be tested (in duplicate) at a single 1:1,000 dilution. In a set of 50 consecutive assays, these 6 dilutions yielded median expected response values for zero and infinite antibody doses of 0.043 and 4.068 OD units, respectively. Reproducible generation of the standard curve was apparent from the narrow interquartile ranges for the curves' four parameters (Table 3) and from the stability of the test over 1 year in which 85% of plates tested had acceptable control parameters. Median intra- and intertest CVs were typical of well-controlled immunoassays at 9 and 12%, respectively. The test's reproducible accuracy also was reflected in the 7% median error over 1 year in quantitation of the midrange standard.
Having preliminarily characterized the test's performance, we wanted to establish a cut-point to allow detection of uninfected or previously infected individuals. First, we determined that the limit of accurate HEV antibody detection was 5.6 WR U/ml by using a single convalescent specimen. Then we examined the distribution of results for serum specimens from infants and children in Bangkok, Thailand, and adults from throughout the U.S. Because there is no endemic hepatitis E in either country, we considered the results to be representative of uninfected persons. Most results in children were <10 WR U/ml, whereas most results in adults were <20 WR U/ml. The difference suggested that some adults were acquiring antibody either to HEV or to host or vector proteins contaminating the recombinant HEV antigen. Therefore, we determined the presence of specific antibody to rHEV capsid by Western blotting in another set of specimens from adults, including long-term residents of areas of HEV endemicity. These showed that fewer than 5 to 6% of specimens with a level of Ig to HEV of <20 WR U/ml had antibodies to rHEV capsid; reactivity in many cases came from antibodies binding to distinct bands presumably representing Sf9 cell proteins. In contrast, all specimens with a level of Ig to HEV of ≥100 WR U/ml contained antibodies to rHEV capsid. We concluded that when avoidance of false-positive results is essential, one must confirm all EIA results of <100 WR U/ml with a Western blot. Nevertheless, testing with EIA alone can yield meaningful results, because test specificity and sensitivity for an optimum cut-point of 30 WR U/ml identified by a receiver-operating characteristic curve were 89 and 86%, respectively.
A cut-point is most relevant when only a single serum specimen is available to assess an individual's past exposure to HEV. On the other hand, in observational cohort or vaccine studies, a more important task is to identify individuals who have rising or falling antibody levels. We defined the fold change in antibody level representing a true change by evaluating paired serum specimens from presumably uninfected individuals in the United States with no HEV exposure over 6 months. From this analysis, we inferred that changes in Ig to HEV ≥4-fold over baseline represented a true change, such as might be observed after immunization or infection. Consequently, a seroconversion should be defined as a rise in antibody at least fourfold to a level that exceeds the cut-point (set from 20 to 40 WR U/ml).
Antibody quantitation acquires additional meaning, especially in the context of assessing a vaccine's immunogenicity, when levels of antibody elicited by natural HEV infection are quantitated. Accordingly, we examined serial specimens from six women observed before and after they sustained acute hepatitis E. Among five women whose serum specimens were collected several months before illness, the mean level of pre-illness antibody was quite low (1.6 WR U/ml) and rose several hundred-fold to more than 1,000 WR U/ml during acute illness. These results establish that the characteristics of the HEV EIA are well suited to differentiate levels of antibody associated with acute disease from those seen in susceptible or remotely infected individuals. Accordingly, the test can support diagnosis of hepatitis E. Detection of Ig to HEV greater than 250 WR U/ml within 3 months of hepatitis onset suggests recent HEV infection that may have contributed to the illness; levels greater than 1,000 WR U/ml are consistent only with recent infection. For complete evaluation of suspected hepatitis E, a test for total HEV Ig should be supplemented with tests for HEV IgM and virus genome in serum and feces by PCR (3); other causes of hepatitis must be excluded as well.
There are at least two tests for antibodies to HEV that are commercially available in some parts of the world. We had an opportunity to test serial dilutions of three convalescent specimens in parallel by using the WRAIR and Genelabs Diagnostics tests. The performance of the tests was similar across a range of dilutions, although the results suggested the WRAIR test would be more versatile in detecting low levels of antibody reflecting past infection.
Validation of a test method implies that the technique has been transferred successfully to other laboratories. We transferred this test as reagent kits and a standard operating procedure to a sister laboratory in Bangkok, where four experienced technologists received brief training in the method. After the training, each technologist achieved certification for the procedure by repeatedly testing a specimen panel until three of four consecutive assays were acceptable and the correlation of observed to expected results exceeded 0.9.
In conclusion, the test method described herein enables accurate quantitation of Ig to HEV, including the extremely low levels associated with absence of immunity and susceptibility to infection, the intermediate levels associated with late convalescence, and the extremely high levels associated with acute illness. The addition of quantitation to HEV serology greatly increases its power as a tool for epidemiology and reveals how a test for total Ig to HEV can support laboratory diagnosis of hepatitis E. Moreover, this test now enables HEV vaccine candidates to be evaluated for immunogenicity.
Acknowledgments
We gratefully acknowledge Craig Morrissette, who wrote the program to calculate relative potency. Khagendra B. Shrestha and Devendra B. Malla of the Royal Nepal Army Medical Department, and Mona Bomgaars, Mira Hada, Kundu Norkyl, Junu Thapa of Patan Hospital, Lalitpur, Nepal, were our dedicated physician collaborators who collected specimens from their patients with hepatitis E. Martin Wolfe generously provided serum specimens from U.S. State Department employees. We thank Leonard N. Binn for innumerable valuable suggestions.
Financial support was provided by the U.S. Army Medical Research and Materiel Command and GlaxoSmithKline Biologicals under a Cooperative Research and Development Agreement.
REFERENCES
- 1.Armitage, P., and G. Berry. 1987. Statistical methods in medical research, 2nd ed. Blackwell Scientific Publications, Boston, Mass.
- 2.Bryan, J. P., S. A. Tsarev, M. Iqbal, J. Ticehurst, S. U. Emerson, A. Ahmed, J. Duncan, A. R. Rafiqui, I. A. Malik, R. H. Purcell, and L. J. Legters. 1994. Epidemic hepatitis E in Pakistan: patterns of serologic response and evidence that antibody to hepatitis E virus protects against disease. J. Infect. Dis. 170:517-521. [DOI] [PubMed] [Google Scholar]
- 3.Clayson, E. T., K. S. Myint, R. Snitbhan, D. W. Vaughn, B. L. Innis, L. Chan, P. Cheung, and M. P. Shrestha. 1995. Viremia, fecal shedding, and IgM and IgG responses in patients with hepatitis E. J. Infect. Dis. 172:927-933. [DOI] [PubMed] [Google Scholar]
- 4.Dawson, G. J., K. H. Chau, C. M. Cabal, P. O. Yarbough, G. R. Reyes, and I. K. Mushahwar. 1992. Solid-phase enzyme-linked immunosorbent assay for hepatitis E virus IgG and IgM antibodies utilizing recombinant antigens and synthetic peptides. J. Virol. Methods 38:175-186. [DOI] [PubMed] [Google Scholar]
- 5.Favorov, M. O., H. A. Fields, M. A. Purdy, T. L. Yashina, A. G. Aleksandrov, M. J. Alter, D. M. Yarasheva, D. W. Bradley, and H. S. Margolis. 1992. Serologic identification of hepatitis E virus infection in epidemic and endemic settings. J. Med. Virol. 36:246-250. [DOI] [PubMed] [Google Scholar]
- 6.Favorov, M. O., Y. E. Khudyakov, E. E. Mast, T. L. Yashina, C. N. Shapiro, N. S. Khudyakova, D. L. Jue, G. G. Onischenko, H. S. Margolis, and H. A. Fields. 1996. IgM and IgG antibodies to hepatitis E virus (HEV) detected by an enzyme immunoassay based on an HEV-specific artificial recombinant mosaic protein. J. Med. Virol. 50:50-58. [DOI] [PubMed] [Google Scholar]
- 7.Ghabrah, T. M., S. A. Tsarev, P. O. Yarbough, S. U. Emerson, G. T. Strickland, and R. H. Purcell. 1998. Comparison of tests for antibody to hepatitis E virus. J. Med. Virol. 55:134-137. [PubMed] [Google Scholar]
- 8.Goldsmith, R., P. O. Yarbough, G. R. Reyes, K. E. Fry, K. A. Gabor, M. Kamel, S. Zakaria, S. Amer, and Y. Gaffar. 1992. Enzyme-linked immunosorbent assay for diagnosis of acute sporadic hepatitis E in children. Lancet 339:328-331. [DOI] [PubMed] [Google Scholar]
- 9.He, J., A. W. Tam, P. O. Yarbough, G. R. Reyes, and M. Carl. 1993. Expression and diagnostic utility of hepatitis E virus putative structural proteins expressed in insect cells. J. Clin. Microbiol. 31:2167-2173. [DOI] [PMC free article] [PubMed] [Google Scholar]
- 10.He, J., L. N. Binn, J. D. Caudill, L. V. Asher, C. F. Longer, and B. L. Innis. 1999. Antiserum generated by DNA vaccine binds to hepatitis E virus (HEV) as determined by PCR and immune electron microscopy (IEM): application for HEV detection by affinity-capture RT-PCR. Virus Res. 62:59-65. [DOI] [PubMed] [Google Scholar]
- 11.Krawczynski, K., and D. W. Bradley. 1989. Enterically-transmitted non-A, non-B hepatitis: identification of virus-associated antigen in experimentally infected cynomolgus macaques. J. Infect. Dis. 159:1042-1049. [DOI] [PubMed] [Google Scholar]
- 12.Labrique, A. B., D. L. Thomas, S. K. Stozek, and K. E. Nelson. 1999. Hepatitis E: an emerging infectious disease. Epidemiol. Rev. 21:162-179. [DOI] [PubMed] [Google Scholar]
- 13.Mast, E. E., M. J. Alter, P. V. Holland, and R. H. Purcell. 1998. Evaluation of assays for antibody to hepatitis E virus by a serum panel. Hepatitis E Virus Antibody Evaluation Group. Hepatology 27:857-861. [DOI] [PubMed] [Google Scholar]
- 14.McAtee, C. P., Y. Zhang, P. O. Yarbough, T. R. Fuerst, K. L. Stone, S. Samander, and K. R. Williams. 1996. Purification and characterization of recombinant hepatitis E protein vaccine candidate by liquid chromatography-mass spectrometry. J. Chromatogr. B 685:91-104. [DOI] [PubMed] [Google Scholar]
- 15.McAtee, C. P., Y. Zhang, P. O. Yarbough, T. Bird, and T. R. Fuerst. 1996. Purification of a soluble hepatitis E open reading frame 2-derived protein with unique antigenic properties. Protein Expr. Purif. 8:262-270. [DOI] [PubMed] [Google Scholar]
- 16.Robinson, R. A., W. H. Burgess, S. U. Emerson, R. S. Leibowitz, S. A. Sosnovtseva, S. A. Tsarev, and R. H. Purcell. 1998. Structural characterization of recombinant hepatitis E virus ORF2 proteins in baculovirus-infected insect cells. Protein Expr. Purif. 12:75-84. [DOI] [PubMed] [Google Scholar]
- 17.Rodbard, D., and P. J. Munson. 1980. Radioimmunoassay data processing, p. 343-349. In N. R. Rose and H. Friedman (ed.), Manual of clinical immunology, 2nd ed. American Society for Microbiology, Washington, D.C.
- 18.Touze, A., N. Enogat, Y. Buisson, and P. Coursaget. 1999. Baculovirus expression of chimeric hepatitis B virus core particles with hepatitis E virus epitopes and their use in a hepatitis E immunoassay. J. Clin. Microbiol. 37:438-441. [DOI] [PMC free article] [PubMed] [Google Scholar]
- 19.Tsarev, S. A., T. S. Tsareva, S. U. Emerson, A. Z. Kapikian, J. Ticehurst, W. London, and R. H. Purcell. 1993. ELISA for antibody to hepatitis E virus (HEV) based on complete open-reading frame-2 protein expressed in insect cells: identification of HEV infection in primates. J. Infect. Dis. 168:369-378. [DOI] [PubMed] [Google Scholar]
- 20.Tsarev, S. A., L. N. Binn, P. J. Gomatos, R. R. Arthur, M. K. Monier, H. van Cuyck-Gandre, C. F. Longer, and B. L. Innis. 1999. Phylogenetic analysis of hepatitis E virus isolates from Egypt. J. Med. Virol. 57:68-74. [DOI] [PubMed] [Google Scholar]
- 21.Zhang, Y., P. McAtee, P. O. Yarbough, A. W. Tam, and T. Fuerst. 1997. Expression, characterization, and immunoreactivities of a soluble hepatitis E virus putative capsid protein species expressed in insect cells. Clin. Diagn. Lab. Immunol. 4:423-428. [DOI] [PMC free article] [PubMed] [Google Scholar]


