Abstract
The three-dimensional structure of recombinant human monoamine oxidase A (hMAO A) as its clorgyline-inhibited adduct is described. Although the chain-fold of hMAO A is similar to that of rat MAO A and human MAO B (hMAO B), hMAO A is unique in that it crystallizes as a monomer and exhibits the solution hydrodynamic behavior of a monomeric form rather than the dimeric form of hMAO B and rat MAO A. hMAO A's active site consists of a single hydrophobic cavity of ≈550 Å3, which is smaller than that determined from the structure of deprenyl-inhibited hMAO B (≈700 Å3) but larger than that of rat MAO A (≈450 Å3). An important component of the active site structure of hMAO A is the loop conformation of residues 210–216, which differs from that of hMAO B and rat MAO A. The origin of this structural alteration is suggested to result from long-range interactions in the monomeric form of the enzyme. In addition to serving as a basis for the development of hMAO A specific inhibitors, these data support the proposal that hMAO A involves a change from the dimeric to the monomeric form through a Glu-151 → Lys mutation that is specific of hMAO A [Andrès, A. M., Soldevila, M., Navarro, A., Kidd, K. K., Oliva, B. & Bertranpetit, J. (2004) Hum. Genet. 115, 377–386]. These considerations put into question the use of MAO A from nonhuman sources in drug development for use in humans.
Keywords: flavin, neurotransmitter, membrane protein, antidepressant target
Human monoamine oxidase A (hMAO A) is an outer mitochondrial membrane-bound flavoenzyme that catalyzes the oxidation of the neurotransmitters serotonin, dopamine, and norepinephrine. Recent studies have demonstrated that a deficiency or low level of expression of this enzyme results in a phenotype of aggressive behavior (1, 2). The elucidation of the 3D structures of human MAO B (hMAO B) (3, 4) (72% sequence identity with hMAO A) and of rat MAO A (rMAO A) (5) (92% sequence identity with hMAO A with no insertions or deletions) has provided insights into the structure and mechanism of these pharmacologically important enzymes. There are several functional properties of hMAO A that differentiate it from rMAO A, despite their high level of sequence identity. hMAO A has been shown to exhibit a 10-fold lower affinity (IC50) than rMAO A for the specific irreversible inhibitor clorgyline (6). Comparisons of the influence of a Phe-208 → Ile mutation on MAO A from human (7) and rat (8) also show differential effects on activities and sensitivities to irreversible inhibition. Functional differences between hMAO A and rMAO A have been implicated in comparison with their respective sensitivities to phentermine inhibition (9). These differences in properties between hMAO A and rMAO A suggest structural differences exist for these two enzymes.
With the development of a high-level expression system for hMAO A in our laboratory (10) and successes with the structural elucidation of hMAO B (3, 4), a collaborative program was established to elucidate the structure of hMAO A by x-ray crystallography. Here, we report the structures of two hMAO A crystal forms and demonstrate structural differences between hMAO A and rMAO A as well as hMAO B. Our data indicate that the considerable literature on MAO A-inhibitor development by using rat models may require modification when applied to humans. This information should be an important resource in the testing and development of new hMAO A-specific inhibitors.
Experimental Section
Protein Preparations. hMAO B and hMAO A were expressed and purified from Pichia pastoris as published in refs. 10 and 11. The hMAO B purification procedure originally described was modified by replacing the polymer fractionation steps with a single anion-exchange chromatographic step using Bio-Rad High Q resin. hMAO A and hMAO B preparations were homogeneous on denaturing gel electrophoresis and exhibited catalytic properties expected for fully functional enzymes.
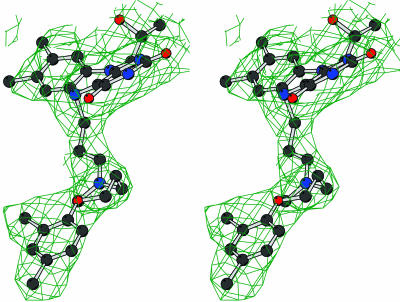
Crystallography. Before crystallization experiments, recombinant hMAO A was incubated with a 10-fold molar excess of clorgyline. Crystallization experiments were carried out by the sitting-drop vapor diffusion method at 4°C. The protein solutions contained 5–10 mg/ml inhibited hMAO A, 0.8% (wt/vol) β-octyl glucoside, 1 mM DTT, and 50 mM potassium phosphate buffer (pH 7.0). The reservoir solution contained 5% (wt/vol) polyethylene glycol 6000, 50 mM lithium sulfate, and 100 mM sodium citrate (pH 5.6). X-ray diffraction data were collected at 100 K at the Advanced Photon Source at Argonne National Laboratory (Argonne, IL) and the Swiss Light Source (Villigen, Switzerland). For data collection, crystals were transferred into a mother liquor solution containing 18% (wt/vol) glycerol and flash-cooled in a stream of gaseous nitrogen at 100 K. Data processing and scaling (Table 1) were carried out by using mosflm (12) and programs of the CCP4 package (13). Two crystal forms of hMAO A were obtained (X1 and X2). Crystal form X1 exhibited diffraction to 3.0-Å resolution, whereas crystal form X2 diffracted to 3.15 Å (Table 1). Both forms belong to the C2 space group with two monomers in the asymmetric unit but exhibit different crystal packing and unit cell parameters. Structures were solved by molecular replacement using the coordinates of hMAO B (3, 4). The initial electron density maps were then subject to multiple-crystal averaging (14). This density modification procedure involved the averaging of the electron density of the four crystallographically independent subunits (both crystal forms contain two monomers in the asymmetric unit) and resulted in a dramatically improved electron density map, which was used to build the initial model. Refinements were performed with the programs refmac5 (15) and o (16). The phases obtained from the inversion of the multiple-crystal averaged electron density map were incorporated as additional restraints in maximum-likelihood structure refinement. For both crystal forms, tight noncrystallographic symmetry restraints were applied (Fig. 1). The deprenyl complex of hMAO B was crystallized and structurally analyzed following the protocols described in ref. 4 by using data measured at the European Synchrotron Radiation Facility (Grenoble, France). Refinement statistics are listed in Table 1.
Table 1. Data collection and refinement statistics.
| hMAO A clorgyline
|
|||
|---|---|---|---|
| Form X1 | Form X2 | hMAO B deprenyl | |
| Resolution, Å | 3.0 | 3.15 | 2.2 |
| Space group | C2 | C2 | C222 |
| Cell, Å | 143.5, 109.6, 81.3 | 158.4, 152.1, 82.2 | 132.8, 225.8, 85.7 |
| Cell, ° | 90.0, 95.2, 90.0 | 90.0, 104.5, 90.0 | 90.0, 90.0, 90.0 |
| Unique reflections | 23,085 | 27,718 | 60,540 |
| Completeness,* % | 96.9 (97.3) | 91.3 (67.1) | 95.9 (98.4) |
| Redundancy | 6.7 | 2.0 | 2.7 |
| Rsym† | 0.094 (0.512) | 0.130 (0.404) | 0.089 (0.412) |
| Rcryst‡ | 0.192 | 0.268 | 0.237 |
| Rfree‡ | 0.237 | 0.330 | 0.298 |
| rmsd bond angle, ° | 1.7 | 1.6 | 1.7 |
| rmsd bond length, Å | 0.018 | 0.017 | 0.017 |
| Number of atoms average B factor, Å2 | |||
| Protein + FAD | 2 × 3,614/64.1 | 2 × 3,971/37.6 | 8,017/32.6 |
| Ligand | 2 × 17/74.2 | 2 × 17/50.2 | 2 × 14/62.1 |
| Waters | 0 | 0 | 489/39.4 |
| Ramachandran, % | |||
| Most allowed | 88.5 | 80.1 | 90.6 |
| Additional allowed | 9.5 | 17.3 | 8.5 |
| Generously allowed | 0.9 | 1.9 | 0.4 |
| Disallowed | 0.9 | 0.7 | 0.5 |
rmsd, rms deviation.
Values in parentheses are for reflections in the highest-resolution shell.
Rsym = Σ|Ii - 〈I〉|/ΣIi, where Ii is the intensity of ith observation and 〈I〉 is the mean intensity of the reflection.
Rcryst = Σ|Fobs - Fcalc|/Σ|Fobs| where Fobs and Fcalc are the observed and calculated structure factor amplitudes, respectively. Rcryst and Rfree were calculated by using the working and test set, respectively.
Fig. 1.
Stereoview of the final 2Fo – Fc electron density map for the clorgyline inhibitor covalently bound to the flavin in the X1 crystal form. The contour level is 1σ. The map was calculated with phases obtained by combining the phases obtained from inversion of the multiple-crystal 4-fold averaged electron density and the phases calculated from the refined model. Blue, nitrogens; black, carbons; red, oxygens; yellow, sulfurs.
Figures were produced by molscript (17), bobscript (18), and raster3d (19). The 3D structures were analyzed with the programs voidoo (20), procheck (21), o (16), and ccp4 (13).
Solution Oligomeric States of hMAO A and hMAO B. Analytical ultracentrifugation experiments were conducted as described in ref. 22. A Beckman model XLA instrument (Biozentrum, Basel) equipped with absorption optics was used. Solution densities were determined with an Anton Paar (Graz, Austria) density meter. The data were analyzed using the segal program (Ariel Lustig, Biozentrum, Basel) and are presented in Table 2. Clorgyline-inhibited hMAO A and pargyline-inhibited hMAO B were used in these experiments.
Table 2. Analytical ultracentrifugation data on hMAO A and hMAO B.
| Sample | Conc., mg/ml | Detergent* (%, wt/vol) | Solution† | Solvent density, g/cm3 | Rotor speed,‡ rpm | Oligomeric state |
|---|---|---|---|---|---|---|
| MAO A | 0.7 | β-OG (1.8) | KPi/sucrose | 1.086 | 12,000 | 60% 330 kDa§ |
| MAO A | 2.0 | β-OG (1.8) | KPi/sucrose | 1.086 | 6,800 | 60% 330 kDa§ |
| MAO A | 0.46 | ZW (0.26) | KPi/D2O | 1.0449 | 15,000 | 40% 65 kDa§ |
| MAO A | 1.4 | ZW (0.26) | KPi/D2O | 1.0449 | 18,000 | 40% 65 kDa§ |
| MAO B | 0.46 | ZW (0.26) | KPi/D2O | 1.0449 | 15,000 | 100% 130 kDa |
| MAO B | 1.4 | ZW (0.26) | KPi/D2O | 1.0449 | 18,000 | 100% 130 kDa |
β-OG, β-octyl glucoside; ZW, Zwittergent 3-12.
KPi, 50 mM potassium phosphate (pH 7.0). Sucrose was added to samples to obtain the desired solution density to achieve “detergent gravitational transparency” (22).
Sedimentation equilibrium runs were recorded with absorption optics at 280 nm with optical pathlengths of 4 or 12 mm and carried out with a Beckman XLA analytical ultracentrifuge at 20°C.
Polydisperse solution; the measured molecular mass of the major oligomeric form is indicated.
Results and Discussion
hMAO A Monomer Structure. The crystallographic analysis of hMAO A is based on two crystal forms that grow under identical conditions. Structures derived from these two crystal forms have virtually identical conformations (rms deviation of 0.42 Å, 443 equivalent Cα atoms). In crystal form X1, the C-terminal residues are disordered after residue 464 (hMAO A contains 527 residues) most likely because of crystal-packing interactions. In contrast, in crystal form X2, the C-terminal residues are visible to residue 506 so that the first turns of the C-terminal membrane-bound helix are defined (Fig. 2A). Another difference between the two crystal forms is that residues 211–213 of the active site cavity-shaping loop (Fig. 2) are defined in the electron density of X2 but are disordered in crystal form X1. Therefore, monomer A of the refined structure from X2 was used in model analysis and creation of the figures.
Fig. 2.
Overall structure of hMAO A. The orientation is as in Fig. 1. (A) Ribbon representation of the monomer. The FAD-binding domain (residues 13–88, 220–294, and 400–462) is in blue; the substrate-binding domain (89–219 and 295–399) is in red; and the C-terminal membrane region (463–506) is in green. Residues 1–12, 111–115, and 507–527 are not visible in the electron density map. A dashed line connects residues 110–116. FAD and clorgyline are depicted in yellow and cyan ball-and-stick representation, respectively. The active site cavity-shaping loop 210–216 is depicted as black coil. (B) Stereoview of the superposition of the Cα traces of human MAO A (black) and MAO B (red). FAD and clorgyline bound to MAO A are shown as black ball-and-stick. Loop 210–216 of hMAO A and the equivalent loop 201–206 of hMAO B are shown as thick coils to highlight their different conformations.
The overall structure of hMAO A (Fig. 2) is quite similar to that of hMAO B (rms deviation of 1.2 Å, 488 equivalent Cα atoms) and that of rMAO A (rms deviation of 1.2 Å, 488 equivalent Cα atoms). The only significant structural difference observed is the conformation of the cavity-shaping loop 210–216 (Fig. 2 A). These residues are important for the structure of the hMAO A active site and exhibit different conformations on comparison of the rat and human enzymes. Removal of these residues from the structural comparisons results in a reduced rms deviation, which decreases to 0.7 Å in the superpositions of hMAO A with both rMAO A and hMAO B. Therefore, this segment shows a clear difference in structure unique to hMAO A.
Differences in MAO Quaternary Structures. Another unique structural feature of hMAO A is that it crystallizes as a monomer (Fig. 2A). This aspect of hMAO A is of interest because hMAO A has considerable sequence homologies to rMAO A and hMAO B, both of which crystallize as dimers with large surface contact area between monomers (≈15% of total monomer surface area) (3, 5). To further verify this apparent difference, we investigated the oligomeric properties in solutions of inhibited hMAO A and hMAO B by analytical ultracentrifugation. These experiments (Table 2) demonstrate that hMAO B exists as a monodisperse species of 130 kDa in aqueous detergent solutions. This species perfectly corresponds to the dimer observed in the hMAO B crystals. In contrast, hMAO A is polydisperse with monomeric species being the major component in Zwittergent 3-12 (a detergent giving poorly diffracting crystals) and a 330-kDa oligomer (Table 2) as the major species in β-octyl glucoside solution (the detergent providing the crystals reported in this paper).
Both crystallographic and solution hydrodynamic data from hMAO A provide remarkable agreement with the conclusions of Andrés et al. (23). These authors found a selective Glu-151 → Lys mutation that is unique to hMAO A among a wide variety of vertebrate MAOs (both A and B isozymes). Crystal structures of hMAO A show that Lys-151 is located remote from the active site on the protein surface (Fig. 2 A). This surface location is proximal to a cluster of charged residues involved in monomer–monomer contacts to form the dimer in hMAO B and rMAO A. No other significant alterations are observed in comparing those residues involved in the dimerization of rMAO A or hMAO B with the analogous residues in hMAO A. These structural data support the intriguing suggestion (23) that this hMAO A specific mutation destabilizes its dimeric state, resulting in the observed monomeric form.
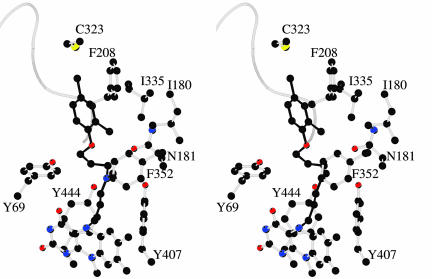
Active Site Structure of hMAO A. The electron density and the derived model due to the flavocyanine structure of the flavin–clorgyline adduct is shown in Fig. 1. Adduct formation is between the flavin N5 position and the inhibitor as shown previously for the pargyline (3) and rasagiline (24) adducts of hMAO B and for the clorgyline adduct of rMAO A (5). The inhibitor binding site is formed by a single cavity that extends from the flavin ring to the cavity-shaping loop consisting of residues 210–216 (Fig. 3). The volume of this cavity is estimated to be ≈550 Å3 and is lined by 11 aliphatic and 5 aromatic residues, which demonstrate that, as in hMAO B, this cavity is quite hydrophobic (Fig. 3 and Table 3).
Fig. 3.
Stereo closed-up view of the clorgyline site in hMAO A. Atom colors are as in Fig. 1. The backbone trace of loop 210–216 is shown as a coil.
Table 3. Active site residues in hMAO A and B.
| hMAO A | hMAO B | Cα atoms separation,* Å |
|---|---|---|
| Tyr-69 | Tyr-60 | 0.5 |
| Gln-74 | Gln-65 | 0.4 |
| Val-91 | Val-82 | 0.5 |
| Val-93 | Glu-84 | 0.3 |
| Leu-97 | Leu-88 | 0.5 |
| Ile-180 | Leu-171 | 0.5 |
| Asn-181 | Cys-172 | 0.3 |
| Ile-207 | Ile-198 | 0.6 |
| Phe-208 | Ile-199 | 0.6 |
| Ser-209 | Ser-200 | 1.2 |
| Val-210 | Thr-201 | 4.3 |
| Glu-216 | Glu-207 | 0.8 |
| Cys-323 | Thr-314 | 0.7 |
| Ile-325 | Ile-316 | 0.1 |
| Ile-335 | Tyr-326 | 0.2 |
| Leu-337 | Leu-328 | 0.3 |
| Met-350 | Met-341 | 0.4 |
| Phe-352 | Phe-343 | 0.4 |
| Tyr-407 | Tyr-398 | 0.3 |
| Tyr-444 | Tyr-435 | 0.3 |
Residues lining the active site cavity of hMAO A as calculated by the program voidoo are tabulated.
Distance between equivalent of Cα atoms after superposition of the hMAO A structure and the complex of hMAO B with deprenyl.
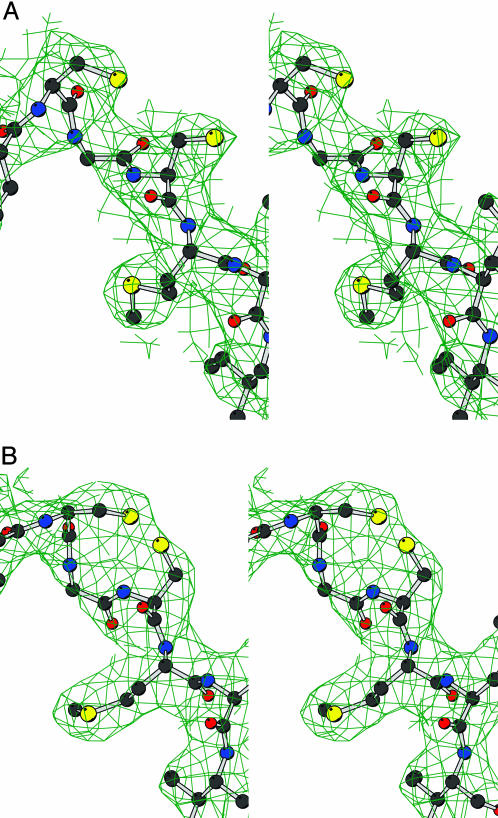
Two cysteine residues (Cys-321 and Cys-323) are located near the entry of the catalytic site (Figs. 4 and 5A). The side chain of Cys-323 is in van der Waals contact with the aromatic ring of the bound clorgyline. In crystal form X2, the thiol groups are in their reduced form (Fig. 4A). In crystal form X1, the electron density indicates that, at least in part of the crystalline protein molecules, these two thiol groups might be oxidized to a disulfide bridge (Fig. 4B). Mass spectrometry data (25) have conclusively shown the absence of any disulfide bridges in either hMAO A or hMAO B. Therefore, the apparent oxidation of these two thiol groups may be an artifactual consequence of the time period required (weeks) for crystal growth. Quite possibly, the oxidation of these thiol groups may be a determinant of which crystal form is produced. Shih's group (26) has systematically mutagenized each cysteine residue in hMAO A to a serine residue and found that such mutations in Cys-321 or Cys-323 do not influence the catalytic activity. On the other hand, MAO A activity is known to be quite sensitive to thiol oxidation and to thiol reagents (27), and therefore the modification of these thiol groups may be the reason for this sensitivity. It is possible that the oxidation of these thiol groups to a disulfide could influence the catalytic activity of hMAO A, which might be a mechanism of redox control of its function in the oxidation of amine neurotransmitters. It remains for future work to determine whether this proposal is a viable mechanism for enzyme regulation.
Fig. 4.
Stereoview of the final 2Fo – Fc electron density map for the Cys-321–Cys-323 pair in the X2 (A) and X1 (B) crystal forms. The maps were calculated as in Fig. 1, and the level was contoured at 1σ. Atom colors are as in Fig. 1.
Fig. 5.
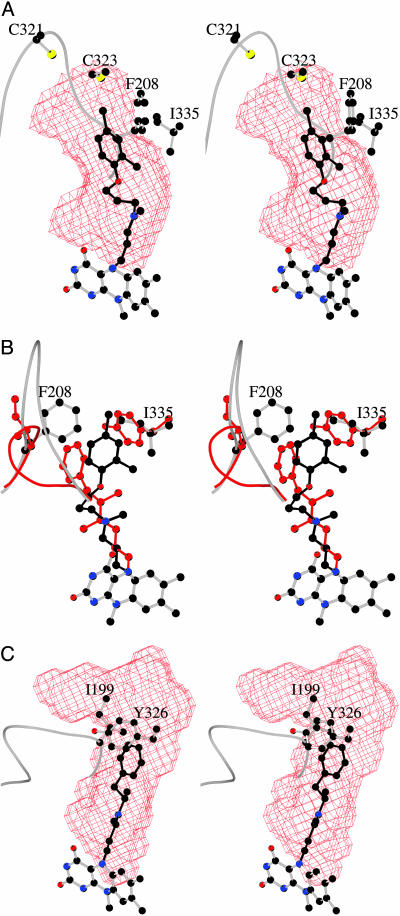
Active site cavities in hMAO A and hMAO B. (A) The surface of active site cavity in hMAO A is shown in red chicken-wire representation in the same orientation as in Fig. 3. Clorgyline is depicted in black. (B) Active site comparison of hMAO A and hMAO B with the crucial Phe-208 and Ile-335 residues of hMAO A superimposed to the corresponding Ile-199 and Tyr-326 residues of hMAO B. The protein and inhibitor atoms of hMAO B are in red. With respect to A, the model has been rotated by ≈90° around the vertical axis in the plane of the drawing. (C) The active site cavity (red surface) of hMAO B in complex with deprenyl (black) is depicted in the same orientation as in A.
Structural Comparisons of hMAO A with hMAO B. An ultimate benefit of the structural comparison of hMAO A with hMAO B is that it would provide the molecular foundation for the design of highly specific reversible inhibitors for each enzyme. Because clorgyline and deprenyl are biochemically the most widely used specific MAO inhibitors, we determined the structure of hMAO B after inhibition with deprenyl as a comparison with the structure of clorgyline-inhibited hMAO A. Although the overall chain-folds of the two isozymes are quite similar (see Fig. 2B), there are similarities and differences in their respective active sites (Fig. 5). The structures of the covalent FAD coenzymes and the two tyrosines constituting the “aromatic cage” (28) in the active sites are identical. Because this region of the active sites is directly involved in substrate oxidation, this close similarity is consistent with the notion that both enzymes follow the same catalytic mechanisms (29). Instead, major differences exist in the area of the active sites opposite to the flavin that govern substrate recognition (Fig. 5). As listed in Table 3, of the 20 residues constituting the active site, 7 residues are changed in identity. In addition to the amino acid replacements, there is a major alteration in conformation of loop 210–216, which results in Cα movements up to 6 Å because of a more extended loop conformation in hMAO A (Figs. 2A and 5B). Therefore, the shapes and sizes of the active site cavities differ as a result of a combination both of amino acid replacements and conformational alterations. hMAO A has a single substrate cavity of ≈550 Å3 (Fig. 5A), which is shorter in length and wider than the longer and narrower cavity in hMAO B (Fig. 5 B and C), which has a size of ≈700 Å3. Substrate entry into hMAO B involves entrance, and substrate cavities that become fused when certain inhibitors (including deprenyl; Fig. 5C) are bound (4). Our structural data show that the active site cavity of hMAO A does not have such a dipartite nature.
These structures (Fig. 5) demonstrate the molecular basis for the specificity of clorgyline for hMAO A and deprenyl for hMAO B. The critical amino acid replacements in the active site of hMAO A are residues Phe-208 (Ile-199 in hMAO B) and Ile-335 (Tyr-326 in hMAO B). The binding of deprenyl would have to displace Phe-208 in hMAO A, whereas bound clorgyline would collide with Tyr-326 in hMAO B. A conclusion from these structural comparisons of human MAO A and MAO B is that conversion of one form into another is a more complex process that would require more than single or double site mutations to accomplish.
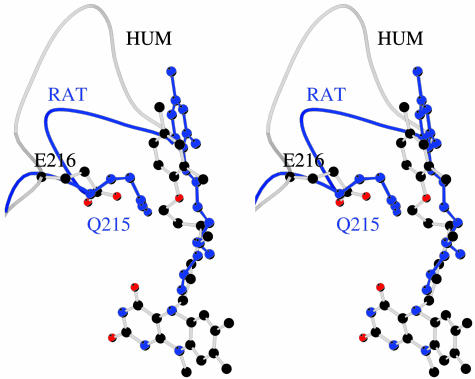
Differences in Active Site Structures Between hMAO A and rMAO A. Although the rat and human enzymes exhibit 92% sequence identity, there are differences in their active site structures. The conformation of the cavity-shaping loop 210–216 in rMAO A is unlike that found in hMAO A, but it is the same as the homologous loop in hMAO B. This difference results in a smaller volume of the active site cavity in rMAO A (450 Å3) than in hMAO A (≈550 Å3). The conformational change in the loop brings Glu-216 into direct contact with the bound clorgyline in hMAO A, and Gln-215 projects out of the active site. In rMAO A, Glu-216 points out of the active site, and Gln-215 interacts with the inhibitor (Fig. 6). The reshaping of the active site cavity forces the bound clorgyline to bind in an extended conformation in rMAO A as compared with a more folded conformation in hMAO A (Fig. 6).
Fig. 6.
The different clorgyline binding modes in hMAO A and rMAO A. Generated by superposing the Cα atoms of the two MAO A structures, the stereoview highlights the different conformations of the bound inhibitor and of residues of the active site cavity-shaping loop 210–216. Atoms of rMAO A are in blue. The orientation is the same as in Fig. 3.
Conclusions
In summary, the amino acid sequences in the active sites of hMAO A and rMAO A are identical but, paradoxically, the structure of the rMAO A cavity-shaping loop is identical with that of hMAO B. This observation raises the possibility that the conformation of this loop is governed by dimer formation because both rMAO A and hMAO B are dimers, unlike the monomeric hMAO A (see Table 2). This structural hypothesis would be a long-range effect because the dimer interface is on the opposite face of the protein from the active site entrance. Such hypothetical long-range effects through coupled network of residues are not unprecedented and have been beautifully documented in the case of dihydrofolate reductase and other enzymes (30). Therefore, the oligomeric state of MAO could influence the substrate and inhibitor specificities of these enzymes. In support of this notion, the functional properties of rMAO A and hMAO A are not identical and differ in their respective sensitivities to clorgyline and to active site mutations. It has been shown that the hMAO A gene is under positive selection (23, 31). The data in this paper suggest the positive selection for fine-tuning the catalytic properties of hMAO A has resulted from a change in oligomer state by mutation(s) that favor a monomeric vs. dimeric state. These considerations further support the conclusion (shown while comparing human with bovine MAO B) (32) that the results from investigation of one mammalian form of MAO cannot be unambiguously extrapolated to other mammalian forms.
Acknowledgments
We thank the beamline groups of the Advanced Photon Source, Swiss Light Source, and European Synchrotron Radiation Facility, whose outstanding efforts have made these experiments possible. We thank Drs. John Horton and Xiaodong Cheng (Emory University) for their assistance in crystal data collection and valuable discussions. Dr. Roberto Bossi took part in initial crystallization trials. Ms. Milagros Aldeco and Dr. Stefano Rovida provided excellent technical assistance with this project. This work was supported by National Institute of General Medical Sciences Grant GM-29433 (to D.E.E.), the Ministero dell'Instruzione, dell'Universitá e della Ricerca (FIRB and COFIN04) (to A.M.), and a Pfizer Technology Development Award (to A.M). C.B. is supported by an Investigator Fellowship from Collegio Ghislieri, Pavia, Italy. Teva Pharmaceuticals provided support for L.D.C.
Author contributions: C.B., D.E.E., and A.M. designed research; L.D.C., M.L., C.B., and A.L. performed research; L.D.C., M.L., C.B., D.E.E., and A.M. analyzed data; and D.E.E. and A.M. wrote the paper.
Abbreviations: MAO, monoamine oxidase; hMAO, human MAO; rMAO, rat MAO.
Data deposition: The atomic coordinates have been deposited in the Protein Data Bank, www.pdb.org (PDB ID codes 2BXR, 2BXS, and 2BYB).
References
- 1.Brunner, H. G., Nelen, M. R., Zandvoort, P., Abeling, N., Gennip, A. H., Wolter, E. C., Kuiper, M. A., Roper, H. H. & Oust, B. A. (1993) Am. J. Hum. Genet. 52, 578–580. [PMC free article] [PubMed] [Google Scholar]
- 2.Caspi, A., McClay, J., Moffitt, T. E., Mill, J., Martin, J., Craig, I. W., Taylor, A. & Poulton, R. (2002) Science 297, 851–853. [DOI] [PubMed] [Google Scholar]
- 3.Binda, C., Newton-Vinson, P., Hubálek, F., Edmondson, D. E. & Mattevi, A. (2002) Nat. Struct. Biol. 9, 22–26. [DOI] [PubMed] [Google Scholar]
- 4.Binda, C., Li, M., Hubálek, F., Restelli, N., Edmondson, D. E. & Mattevi, A. (2003) Proc. Natl. Acad. Sci. USA 100, 9750–9755. [DOI] [PMC free article] [PubMed] [Google Scholar]
- 5.Ma, J., Yoshimura, M., Yamashita, E., Nakagawa, A., Ito, A. & Tsukihara, T. (2004) J. Mol. Biol. 338, 103–114. [DOI] [PubMed] [Google Scholar]
- 6.Tsugeno, Y., Hirashiki, I., Ogata, F. & Ito, A. (1995) J. Biochem. (Tokyo) 118, 974–980. [DOI] [PubMed] [Google Scholar]
- 7.Tsugeno, Y. & Ito, A. (1997) J. Biol. Chem. 272, 14033–14036. [DOI] [PubMed] [Google Scholar]
- 8.Geha, R., Chen, K. & Shih, J. C. (2000) J. Neurochem. 75, 1304–1309. [DOI] [PubMed] [Google Scholar]
- 9.Nandigama, R. K., Newton-Vinson, P. & Edmondson, D. E. (2002) Biochem. Pharmacol. 63, 865–869. [DOI] [PubMed] [Google Scholar]
- 10.Li, M., Hubálek, F., Newton-Vinson, P. & Edmondson, D. E. (2002) Protein Expression Purif. 24, 152–162. [DOI] [PubMed] [Google Scholar]
- 11.Newton-Vinson, P., Hubálek F. & Edmondson, D. E. (2000) Protein Expression Purif. 20, 334–345. [DOI] [PubMed] [Google Scholar]
- 12.Leslie, A. G. W. (1999) Acta Crystallogr. D 55, 1696–1702. [DOI] [PubMed] [Google Scholar]
- 13.Collaborative Computational Project Number 4 (1994) Acta Crystallogr. D 50, 760–767.15299374 [Google Scholar]
- 14.Cowtan, K. (1994) Joint CCP4 and ESF-EACBM Newsletter on Protein Crystallography 31, 34–38. [Google Scholar]
- 15.Murshudov, G. N., Vagin, A. A. & Dodson, E. J. (1994) Acta Crystallogr. D 53, 240–255. [DOI] [PubMed] [Google Scholar]
- 16.Jones, T. A., Zou, J. Y., Cowan, S. W. & Kjeldgaard, M. (1991) Acta Crystallogr. A 47, 110–119. [DOI] [PubMed] [Google Scholar]
- 17.Kraulis, P. J. J. (1991) J. Appl. Crystallogr. 24, 946–950. [Google Scholar]
- 18.Esnouf, R. M. (1999) Acta Crystallogr. D 55, 938–940. [DOI] [PubMed] [Google Scholar]
- 19.Merritt, E. A. & Bacon, D. J. (1997) Methods in Enzymol. 277, 505–524. [DOI] [PubMed] [Google Scholar]
- 20.Kleywegt, G. J. & Jones, T. A. (1994) Acta Crystallogr. D 50, 178–185. [DOI] [PubMed] [Google Scholar]
- 21.Laskowski, R. A., MacArthur, M. W., Moss, D. S. & Thornton, J. M. (1993) J. Appl. Crystallogr. 26, 283–291. [Google Scholar]
- 22.Lustig, A., Engel, A., Tsiotis, G., Landau, E. M. & Baschong, W. (2000) Biochim. Biophys. Acta 1464, 199–206. [DOI] [PubMed] [Google Scholar]
- 23.Andrès, A. M., Soldevila, M., Navarro, A., Kidd, K. K., Oliva, B. & Bertranpetit, J. (2004) Hum. Genet. 115, 377–386. [DOI] [PubMed] [Google Scholar]
- 24.Binda, C., Hubálek, F, Li, M., Herzig, Y., Sterling, J., Edmondson, D. E. & Mattevi, A. (2004) J. Med. Chem. 47, 1767–1774. [DOI] [PubMed] [Google Scholar]
- 25.Hubálek, F., Pohl, J. & Edmondson, D. E. (2003) J. Biol. Chem. 278, 28612–28618. [DOI] [PubMed] [Google Scholar]
- 26.Wu, H. F., Chen, K. & Shih, J. C. (1993) Mol. Pharmacol. 43, 888–893. [PubMed] [Google Scholar]
- 27.Weyler, W. & Salach, J. I. (1985) J. Biol. Chem. 260, 13199–13207. [PubMed] [Google Scholar]
- 28.Binda, C., Mattevi, A. & Edmondson, D. E. (2002) J. Biol. Chem. 277, 23973–23976. [DOI] [PubMed] [Google Scholar]
- 29.Edmondson, D. E., Mattevi, A., Binda, C., Li, M. & Hubálek, F. (2004) Curr. Med. Chem. 11, 1983–1993. [DOI] [PubMed] [Google Scholar]
- 30.Benkovic, S. J. & Hammes-Schiffer, S. (2003) Science 301, 1196–1202. [DOI] [PubMed] [Google Scholar]
- 31.Gilad, Y., Rosenberg, S., Przeworski, M., Lancet, D. & Skorecki, K. (2002) Proc. Natl. Acad. Sci. USA 99, 862–867. [DOI] [PMC free article] [PubMed] [Google Scholar]
- 32.Hubálek, F., Binda, C., Khalil, A., Li, M., Mattevi, A., Castagnoli, N. & Edmondson, D. E. (2005) J. Biol. Chem. 280, 15761–15766. [DOI] [PubMed] [Google Scholar]


