

Abstract
The radiation dosimetry used to measure the ionizing radiation dose delivered during X-ray imaging procedures in planar radiography units, especially in fluoroscopy, is the dose-area product (DAP). DAP is used as the primary parameter for recording diagnostic reference levels, which are guidance values for optimizing patient radiation dose. DAP is reported by the system’s DAP meter, which needs to be calibrated appropriately. This study evaluates the influence of dosimeters and field markers on the accuracy of DAP levels in the DAP meter in situ calibration method. The aim of this study is to recommend a combination of dosimeter types and field markers with the highest accuracy for the beam-area method. Two methods of DAP meter in situ calibration were compared: the tandem method with a reference DAP meter as the reference DAP value and the beam-area method using ion chamber dosimeters, solid-state dosimeters, as well as field markers from digital radiography (DR) and computed radiography. This method was applied to the DAP meter in the Allura XPER FD 20 angiography (Philips, Amsterdam, the Netherlands) unit. The results showed that the combination of ion chamber dosimeter and DR field markers at a distance of 55 cm produced the most accurate DAP values (lowest root mean square error value, 0.10). The recommended calibration method can be used to confirm the actual DAP value in X-ray imaging in a planar radiography unit.
Keywords: Calibration, dose-area product, dose-area product meter
INTRODUCTION
The quantity used in radiation dosimetry to measure the ionizing radiation dose delivered during X-ray imaging procedures in planar radiography units, especially in fluoroscopy, is the dose-area product (DAP). DAP is used as the primary parameter for recording diagnostic reference level, which are guidance values in medical imaging to optimize patient radiation dose.
DAP is a radiation dose that can be monitored in real time and reported by systems using a DAP meter. Therefore, the accuracy of DAP meters in the system is crucial and must be ensured. To achieve adequate accuracy, DAP instruments need to be calibrated appropriately.[1,2] Calibration of DAP meters should be performed with relevant clinical situations on the machine being used, such as X-ray generator (tube current and voltage) settings and diaphragm adjustments during DAP determination.[3] Since these conditions depend on each radiology unit, DAP meter calibration needs to be done directly on each unit.[3,4,5]
International Atomic Energy Agency Technical Report Series no. 457 (IAEA TRS 457) provides the protocol for in situ calibration of a DAP meter using calibration methods with a reference DAP meter, as well as a beam-area method using an ion chamber as a dosimeter and film radiographic and computed radiography (CR) as field markers. In practice, portable DAP meters are rarely available in the clinical setting, so the beam-area method using dosimeters and field markers is a potential method to be carried out for in situ calibration by practicing medical physicists. The use of other instruments may be required as alternatives to adapt dosimeters on-site, such as cylindrical ion chambers (IC) and solid-state (SS) dosimeters, as well as field markers from CR cassette and digital radiography (DR) currently in common use.
The availability of alternative instruments opens up opportunities for users to do in situ calibration of DAP meters. However, the methods and instruments used are expected to provide accurate calibration values. Therefore, research is needed to evaluate the influence of dosimeters and field markers on the accuracy of DAP in the beam-area method. This study aims to recommend a combination of dosimeter types and field markers with the highest accuracy for the beam-area method.
MATERIALS AND METHODS
Materials
The planar radiography unit used was the Allura XPER FD 20 angiography device (Philips, Amsterdam, the Netherlands) with the installed DAP meter on the tube (the field DAP meter) is the KERMA X-plus type 989601022081 (IBA, Schwarzenbruck, Germany). The reference DAP meter used was the KERMA X-plus Model 120-131OEM HS (IBA, Schwarzenbruck, Germany). The ion chamber dosimeter used was the Ion Chamber 10 × 6–6 S/N 03–0464 (Radcal, Monrovia, USA). The SS dosimeters used were the AGMS-DM + S/N 43–1345 (Radcal, Monrovia, USA) as a SS 1 dosimeter and the Xi Classic R/FandMAM detector S/N 234921 (Unfors Raysafe, Hovås, Sweden) as a SS2 dosimeter. Measurement instruments such as distance measuring tools and Styrofoam are also utilized.
Study workflow
Figure 1 presents the steps of the study. Data collection begins by setting the collimator size to 10 cm × 10 cm at a distance of 100 cm from the focal spot. Next, position the reference DAP meter 30 cm below the field DAP meter. The dosimeter is placed 50, 55, and 60 cm below the field DAP meter. The CR cassette and DR are placed at a distance of 87 and 89 below the field DAP meter, respectively. Exposure is carried out three times for each variation and produces reference DAP values, air kerma, and field marker images. The field marker images are processed to obtain the field area value. The field area value is then multiplied by the air kerma to obtain the DAP value. Finally, the DAP value is compared with the reference value to get the root mean square error (RMSE) value.
Figure 1.

Flowchart of the measurement in the study
Tandem calibration method
The tandem calibration method was introduced by Pöyry et al. in 2006.[6] In this method, the DAP meter installed on the system, subsequently referred to as the field DAP meter, is calibrated with a reference DAP meter. Both DAP meters are simultaneously exposed to X-rays, as shown in Figure 2. The X-ray unit and the position of the field DAP meter used are the same as during clinical use, with the reference DAP meter placed at a further distance.
Figure 2.

Tandem method scheme
Beam-area calibration method
The beam-area method described in TRS 457[3] is performed with the field DAP meter installed on the system, and dosimeters and field markers are positioned at a certain distance. The field DAP meter is simultaneously exposed to X-rays along with the dosimeters and field markers, as shown in Figure 3. The DAP value was determined as the product of air kerma (Ka) measured in the center of the field area (A).
Figure 3.
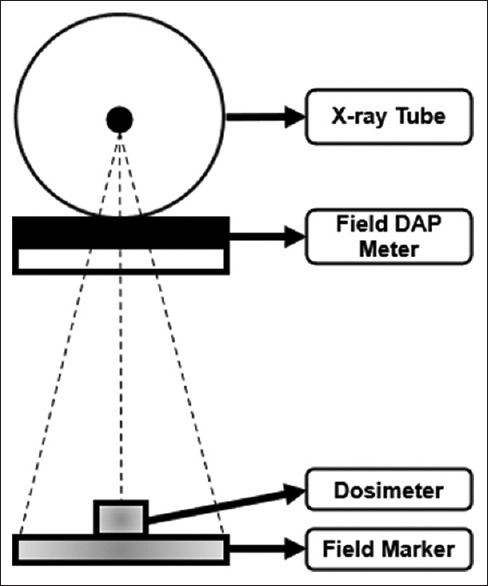
Beam-area method scheme

In situ measurements
The measurements were performed using the settings of the tandem and the beam-area methods. In both measurements, The KERMA X-plus Model 120-131OEM HS DAP meter is designated as a reference. The values read on the reference DAP meter in the tandem method will be used as the reference DAP value to be compared with the DAP value from the beam-area method. A 1 mm Al filter and automatic exposure control (AEC) mode were used, similar to clinical usage. The collimator settings during constant measurement have a field size of 10 cm × 10 cm at a distance of 100 cm from the focal spot. The result obtained from the reference DAP meter will serve as the reference DAP value to be compared with the DAP values obtained from the beam-area method. The reference DAP meter was placed at a distance of 30 cm from the field DAP meter, which was considered sufficiently large enough to avoid most of the scattering between the chambers.[2] A distance of 30 cm was also considered optimal to encompass the entire beam within the DAP meter, including the peripherals of the penumbra.[2] The distance between the field DAP meter and the dosimeter varied to 50, 55, and 60 cm from the field DAP meter. Due to the limited patient table height settings during measurement, placing the dosimeter further away was not possible for this study. CR and DR field markers were placed at distances of 87 and 89 cm, respectively.
The measurement results obtained from the CR cassette and DR were analyzed using ImageJ software (ImageJ, Bethesda, USA) to calculate the distance between the edges in the horizontal and vertical directions to determine the field area. The air kerma and field area at these distances were calculated using the inverse square law to determine the field area at the interventional reference point (IRP) distance. The field DAP meter and dosimeters were placed on top of a styrofoam with a height of 20 cm to avoid backscatter, according to the International Atomic Energy Agency recommendation.[3]
The field DAP meter, reference DAP meter, dosimeters, and field markers were simultaneously exposed, as shown in Figure 4, and obtained values for field DAP, reference DAP, air kerma, and field area. The air kerma value on the dosimeter reading is multiplied by the field area of the field marker, as shown in Equation 1, to obtain the DAP value. The statistical method used to evaluate the accuracy is the RMSE value. The RMSE expresses how closely the measured value approaches the reference value. In this case, the DAP value from the beam-area method obtained is compared with the DAP value of the reference meter as the reference value.
Figure 4.

(a) Schematic diagram and (b) photograph of the measurement setup for the in situ calibration using combined tandem and beam-area methods
Field area measurements
The images obtained from the CR cassette and DR were analyzed using ImageJ software. In the process, the horizontal and vertical edge lengths were calculated to obtain the field area value. During measurements, the collimator aperture was maintained so that the field area could cover the entire X-ray beam, including the penumbra area. The image will produce an unsharp edge due to the penumbra. Therefore, the determination of the horizontal and vertical edges of the image can be done with and without the penumbra.
Determination of the X-ray beam width can also be done using the full width at half maximum (FWHM) value by measuring the distance between points where the intensity is 50% of the peak.[7] The definition of FWHM is also used in computed tomography images, to determine the beam width (also called beam collimation).[8] ImageJ software can also perform FWHM measurements.
Therefore, the determination of the field area is carried out with several variations, namely, determining the edge with penumbra, determining the edge without penumbra, and the FWHM value of the radiation dose profile, as shown in Figure 5.
Figure 5.

Determination of field area using digital radiography images (a) with penumbra, (b) without penumbra, and (c) using full width at half maximum values
RESULTS
Dose-area product measurement value
The field marker images were evaluated, producing field area values for the CR cassette and DR field markers with varying field areas with penumbra, without penumbra, and FWHM. The field area values in the IRP are given in Figure 6.
Figure 6.

Results of the area measurement for the image field with (left) penumbra, (middle) without penumbra, and (right) using full width at half maximum values
The DAP measurement value is obtained from the air kerma value and the field area is calculated using equation 1. Because the field area measurement is carried out with three variations, the resulting DAP value will be by the field variation used: DAP (With Penumbra), DAP (Without Penumbra), and DAP FWHM. The measured DAP value, field DAP value, and reference DAP value of each dosimeter can be shown in [Figure 7a] ion chamber, 7b SS 1, and 7c SS 2 for the DR field marker and [Figure 8a] ion chamber, 8b SS 1, and 8c SS 2 for the CR field marker.
Figure 7.

Dose-area product values with distance variations for dosimeters (a) Ion chamber, (b) Solid-state 1, and (c) Solid-state 2 on the digital radiography field marker
Figure 8.

Dose-area product values with distance variations for dosimeters (a) Ion chamber, (b) Solid-state 1, and (c) Solid-state 2 on the computed radiography field marker
Beam-area method accuracy
The DAP values in the beam-area method are then compared with the reference DAP values to determine their accuracy levels. Figure 9 shows each beam-area method’s accuracy levels in comparison to the reference DAP meter. The RMSE accuracy levels are displayed as a function of distance for different instrument combinations.
Figure 9.

The accuracy level of each instrument combination in the beam-area method using penumbra for various distances
DISCUSSIONS
Dose-area product measurement value
As illustrated in Figure 6, the measurement method that accounts for the penumbra produces the largest image area. This outcome is expected, as it includes all X-ray beams passing through the field marker, encompassing both the primary beam and the penumbra, thereby increasing the calculated DAP value. Therefore, the approach that determines the field extent by considering the penumbra’s length yields DAP values closest to the reference values, as demonstrated in [Figure 7a–c] for the DR field marker and [Figure 8a–c] for the CR field marker. This finding is consistent with the operation of the reference DAP meter, which captures the entirety of the X-ray beam, including the penumbra.
Beam-area method accuracy
In situ measurements could not be conducted simultaneously across the three types of dosimeters due to spatial constraints. In addition, variations in the thickness of the dosimeters and the inability to manually control the exposure factors, which were influenced by the limitations of the AEC system, resulted in differing exposure parameters for each measurement. Consequently, the DAP values recorded by the field DAP meter and the reference DAP meter differed for each measurement, as shown in Figures 7 and 8.
Figure 9 shows the RMSE values of various dosimeters and field markers for various distances. The analysis shows that the combination of all dosimeters with DR field markers at all distances has a relatively lower RMSE value compared to the combination of dosimeters with CR field markers. This finding is in line with the majority of literature discussing the image quality of DR and CR imaging systems.[9,10,11,12] CR systems, with their phosphor storage plates, are generally considered inferior in terms of image quality and diagnostic value compared to flat-panel detectors.[9] DR is characterized by significantly higher quantum efficiency and lower system noise, which can enhance image quality compared to CR.[10] This improves the ability of DR to identify details, especially in the edge region of the image. Therefore, DR images are preferable to CR technologies because they can create clean, precise, and sharp image edges. As a result, clinical results may improve, and facilities using DR field markers will be more confident in offering their services.
In addition, the ion chamber dosimeter demonstrates higher accuracy, as indicated by lower RMSE values, regardless of whether DR or CR field markers are used. This could be attributed to the differences in air kerma measurements, where SS dosimeters are less sensitive to scatter compared to ion chamber.[13] IC measure at least 5% higher, indicating their greater sensitivity to scatter.[13] This allows the dose to be fully detected by the ion chamber as if the dose fully enters the sensitive area of the reference DAP meter.
The level of accuracy of each beam area method using edge measurements with penumbra compared to the reference meter is presented in Figure 9. The analysis indicates that the combination of IC and DR (IC-DR) is the most accurate instrument, with the lowest average RMSE across all measured distances. Conversely, the combination of SS2 and CR appears to be the least accurate, with the highest average RMSE at all measured distances. The IC-DR instrument combination has the highest accuracy (lowest RMSE), which is 0.10 at a distance of 55 cm.
CONCLUSIONS
This study demonstrates that in situ calibration of DAP meters using the beam-area method remains a viable alternative to the tandem method. Specifically, the combination of ion chamber dosimeters and DR field markers at a distance of 55 cm offers a promising approach, exhibiting a comparatively low RMSE of 0.10. This combination effectively approximates the accuracy achieved by the tandem method, providing a valuable option for routine in situ calibration of DAP meters.
Conflicts of interest
There are no conflicts of interest.
Acknowledgments
The study is supported by Universitas Indonesia through Hibah PUTI Q2 2023 Universitas Indonesia (contract number NKB-750/UN2.RST/HKP. 05.00/2023) and International Atomic Energy Agency as part of as part of the CRP E2.40.24 on “Evaluation of the Dosimetry Needs and Practices for the Update of the Code of Practice for Dosimetry in Diagnostic Radiology (TRS-457).” The authors would also like to thank BPAFK Jakarta for their calibrated DAP meter used in this study.
Funding Statement
The support from Universitas Indonesia through Hibah PUTI Q2 2023 Universitas Indonesia (contract number NKB-750/UN2.RST/HKP. 05.00/2023) and International Atomic Energy Agency as part of as part of the CRP E2.40.24 also include financial supports.
REFERENCES
- 1.Hetland PO, Friberg EG, Ovrebø KM, Bjerke HH. Calibration of reference KAP-meters at SSDL and cross calibration of clinical KAP-meters. Acta Oncol. 2009;48:289–94. doi: 10.1080/02841860802287124. [DOI] [PubMed] [Google Scholar]
- 2.Toroi P, Komppa T, Kosunen A. A tandem calibration method for kerma-area product meters. Phys Med Biol. 2008;53:4941–58. doi: 10.1088/0031-9155/53/18/006. [DOI] [PubMed] [Google Scholar]
- 3.IAEA. Dosimetry in Diagnostic Radiology: An International Code of Practice. Vienna, Austria: IAEA; 2007. [Google Scholar]
- 4.IAEA. Establishing Guidance Levels in X Ray Guided Medical Interventional Procedures: A Pilot Study. VIenna, Austria: IAEA; 2009. [Google Scholar]
- 5.Costa NA, Potiens MP. Calibration methodology application of kerma area product meters in situ: Preliminary results. Radiat Phys Chem. 2014;104:201–3. [Google Scholar]
- 6.Toroi P, Komppa T, Kosunen A. A tandem calibration method for kerma–area product meters. Phys Med Biol. 2008;53:4941. doi: 10.1088/0031-9155/53/18/006. doi:10.1088/0031-9155/53/18/006. [DOI] [PubMed] [Google Scholar]
- 7.IAEA. Quality Assurance Programme for Computed Tomography: Diagnostic and Therapy Applications IAEA Human Health Series. Vienna, Austria: IAEA; 2012. [Google Scholar]
- 8.Li B, Behrman RH. An investigation into factors affecting the precision of CT radiation dose profile width measurements using radiochromic films. Med Phys. 2015;42:1765–72. doi: 10.1118/1.4914396. [DOI] [PubMed] [Google Scholar]
- 9.Körner M, Weber CH, Wirth S, Pfeifer KJ, Reiser MF, Treitl M. Advances in digital radiography: Physical principles and system overview. Radiographics. 2007;27:675–86. doi: 10.1148/rg.273065075. [DOI] [PubMed] [Google Scholar]
- 10.Uffmann M, Prokop M, Eisenhuber E, Fuchsjäger M, Weber M, Schaefer-Prokop C. Computed radiography and direct radiography: Influence of acquisition dose on the detection of simulated lung lesions. Invest Radiol. 2005;40:249–56. doi: 10.1097/01.rli.0000159875.01324.bf. [DOI] [PubMed] [Google Scholar]
- 11.Kotter E, Langer M. Digital radiography with large-area flat-panel detectors. Eur Radiol. 2002;12:2562–70. doi: 10.1007/s00330-002-1350-1. [DOI] [PubMed] [Google Scholar]
- 12.Floyd CE, Jr, Warp RJ, Dobbins JT, 3rd, Chotas HG, Baydush AH, Vargas-Voracek R, et al. Imaging characteristics of an amorphous silicon flat-panel detector for digital chest radiography. Radiology. 2001;218:683–8. doi: 10.1148/radiology.218.3.r01fe45683. [DOI] [PubMed] [Google Scholar]
- 13.Brateman LF, Heintz PH. Meaningful data or just measurements?Differences between ionization chamber and solid-state detectors. J Am Coll Radiol. 2015;12:951–3. doi: 10.1016/j.jacr.2015.05.018. [DOI] [PubMed] [Google Scholar]