Abstract
Diagnosis of acute hepatitis E by detection of hepatitis E virus (HEV)-specific immunoglobulin M (IgM) is an established procedure. We investigated whether quantitation of HEV IgM and its ratio to HEV total Ig furnished more information than conventional IgM tests that are interpreted as positive or negative. A previously described indirect immunoassay for total Ig against a baculovirus-expressed HEV capsid protein was modified to quantitate HEV-specific IgM in Walter Reed (WR) antibody units by using a reference antiserum and the four-parameter logistic model. A receiver-operating characteristics curve derived from 197 true-positive specimens and 449 true-negative specimens identified 30 WR units/ml as an optimum cut point. The median HEV IgM level in 36 patients with acute hepatitis E fell from 3,000 to 100 WR units/ml over 6 months, suggesting that 100 WR units/ml would be a more appropriate cut point for distinguishing recent from remote IgM responses. Among three hepatitis E case series, determination of the HEV IgM-to-total-Ig ratio in acute-phase serum revealed that most patients had high ratios consistent with primary infections whereas a few had low ratios, suggesting that they had sustained reinfections that elicited anamnestic antibody responses. The diagnostic utility of the new IgM test was similar to that of a commercially available test that uses different HEV antigens. In conclusion, we found that HEV IgM can be detected specifically in >95% of acute hepatitis E cases defined by detection of the virus genome in serum and that quantitation of HEV IgM and its ratio to total Ig provides insight into infection timing and prior immunity.
Hepatitis E is acute, self-limited hepatitis caused by a virus of the same name (hepatitis E virus [HEV]) that is excreted in feces and transmitted orally. In large parts of Asia and Africa, this disease is common, causing sporadic and epidemic illness (10). Diagnosis of acute hepatitis E is based on detection of the HEV genome in serum or feces by reverse transcription-PCR (RT-PCR) (1, 2, 13) or detection of newly elicited antibodies to HEV, in particular HEV-specific immunoglobulin M (IgM) (2, 11, 12, 16, 17). An IgM test is marketed in Asia (18); this test uses recombinant HEV antigens derived from the carboxyl terminus of the capsid protein (ORF-2) and ORF-3. The good diagnostic utility of the marketed test has been characterized (2, 6). Moreover, several research laboratories have developed IgM tests based on alternative recombinant HEV (rHEV) antigens expressed in bacteria (11) or by use of the baculovirus system (12, 16).
Recently, we reported an indirect enzyme immunoassay (EIA) for total Ig against a baculovirus-expressed HEV capsid protein that quantitated antibodies to HEV in Walter Reed (WR) antibody units by using a reference antiserum and the four-parameter logistic model (9). We modified this test to detect HEV-specific IgM and employed the IgM and total-Ig tests together to characterize serum specimens from patients with suspected acute hepatitis E. We investigated whether quantitation of HEV IgM and its ratio to HEV total Ig furnished more diagnostic or epidemiological information than conventional IgM tests that are interpreted as positive or negative.
Here we report the development of an HEV IgM quantitation standard, the protocol for the IgM test, the kinetics of HEV IgM and total-Ig responses over 6 months in a case series of patients with hepatitis E, an extensive characterization of the test's sensitivity and specificity, the use of the IgM-to-total-Ig ratio to identify rare cases of clinically overt reinfection, and our test's good concordance with the marketed IgM test. We found that quantitation of IgM and total Ig together furnished novel insight into infection timing and prior immunity.
MATERIALS AND METHODS
RT-PCR.
Serum specimens were tested for the HEV genome, indicating viremia during acute infection, by use of previously published protocols that detect either a conserved region of ORF1 (2) or ORF2 (17). The previously unpublished HEV ORF2 nested PCR primers, designated set 3, are listed in Table 1.
TABLE 1.
HEV ORF2 “set 3” nested PCR primers
| Primer IDa | Direction | Sequenceb | Positionc |
|---|---|---|---|
| 2781 | Forward | GTTCATAACC TGATWGGYAT GCT | 4996-5018 |
| 2783 | Reverse | GGTTGGTTGG ATGAATATAG G | 5307-5327 |
| 2782 | Forward | GGDCTBGTTC ATAACCTGAT | 4990-5009 |
| 2784 | Reverse | GGATTGCGAA GGGCTGAGAA TCA | 5284-5306 |
ID, identification.
W, mixture of A and T; Y, mixture of C and T; B, mixture of C, G, and T.
Nucleotide position relative to the Burmese strain Bur-121 (GenBank accession number 73218).
Reference human antibodies.
Equal aliquots of acute-phase serum from 20 hepatitis E patients from Nepal were pooled; each case was diagnosed by detection of HEV viremia by RT-PCR. Pool 6, created by diluting the acute-phase serum pool with approximately 3 volumes of serum with HEV-specific total-Ig levels of <0.1 WR unit/ml, was designated the HEV IgM quantitation standard. Pool 7, created by diluting pool 6 with approximately 3 more volumes of the same negative serum, was designated the IgM positive control.
Relative potency.
The relative potencies of reference antisera and working antigen lots were determined by parallel line assay and calculation of a common slope, as previously described (9).
rHEV antigens.
The antigen for all assays was a 56-kDa recombinant capsid protein truncated at the amino and carboxyl ends to comprise amino acids 112 to 607 of the 660-amino-acid protein. The protein, made in Spodoptera frugiperda cells by using a baculovirus expression vector, was prepared by Novavax as previously described (14). All tests used 33 WR antigen units/ml; antigens were from one of the lots previously characterized (9).
EIA protocols.
The IgM assay protocol was identical to the total-Ig protocol (9) except that the goat anti-human Ig-horseradish peroxidase (HRP) conjugate was replaced with goat anti-human IgM-HRP (Kirkegaard and Perry). The optimal 1:4,000 dilution of anti-IgM conjugate was determined by testing twofold dilutions to find the highest signal-to-noise ratio.
Serum specimens.
Serum specimens stripped of personal identifiers were from archives at the Walter Reed Army Institute of Research (WRAIR, Silver Spring, Md.) and the Armed Forces Research Institute of Medical Sciences (Bangkok, Thailand). All were from volunteers enrolled in research protocols approved by local institutional review boards and the Human Subjects Research Review Board of the U.S. Army Surgeon General. The majority of hepatitis E serum specimens came from three consecutive case series in Nepal: pregnant women enrolled in an observational cohort study, a cross-sectional study of intrafamilial HEV transmission that identified hepatitis E patients and subclinical infections in persons domiciled with them, and surveillance of hepatitis E among soldiers.
IgM EIA control parameters.
Control parameters were developed to ensure accuracy and consistency. Eighteen wells on each 96-well plate were utilized for the following duplicate controls: six half-log dilutions of the HEV IgM quantitation standard (pool 6), the positive control (pool 7), the same negative control as for the total-Ig test, and a no-serum control. Thirty consecutive technically adequate runs were used to calculate limits for control parameters as the mean ± 1.96 (standard deviation) of log-transformed values (expressed as optical density [OD] or WR units per milliliter, as appropriate). Thereafter, assays were accepted according to these limits.
Quantitation.
In using the four-parameter logistic model for quantitation, accuracy is greatest at the midpoint of the standard curve and least at the lower and upper limits. We used the procedures for quantitation developed for the total-Ig test (testing in duplicate, OD limits prompting sample dilution and retesting) to ensure consistency (9).
Comparison of antibody potency by WRAIR and Genelabs Technologies IgM EIAs.
To characterize the relationship between antibody potency determined by the WRAIR IgM EIA and that determined by a widely used commercial test (HEV IgM enzyme-linked immunosorbent assay; Genelabs Technologies, Singapore), we tested dilutions of three specimens in both tests. The commercial test employs a mixture of recombinant HEV ORF2 and ORF3 polypeptides expressed in Escherichia coli which are absent from the WRAIR test's 56-kDa rHEV capsid antigen and the ORF2 polypeptide SG3 (amino acids 334 to 660), also expressed in E. coli, which overlaps 53% of the 56-kDa rHEV capsid antigen. The commercial-test results were expressed in OD units, whereas WRAIR EIA results were expressed in WR units per milliliter. Three regression lines were derived, and the portions of each titration curve above each assay's cut point were compared. Additionally, serial serum specimens from six patients with hepatitis E confirmed by detection of HEV viremia were tested in both assays, and their results were compared.
RESULTS
Potency of reference antibodies.
As previously described (9), we quantified HEV-specific total Ig by using arbitrary WR units per milliliter defined by a convalescent-phase reference serum (pool 4). We chose to quantify HEV IgM also by using WR units per milliliter, in this case by an IgM quantitation standard called pool 6, arbitrarily defined to contain 860 WR units of HEV IgM/ml. The relationship between a unit of HEV IgM and a unit of HEV total Ig is undefined, but these units are roughly equivalent, as pool 6, defined to contain 860 WR units of HEV IgM/ml, was determined to contain 820 WR units of HEV total Ig/ml by parallel line assay against pool 4. Dilutions of pool 6 were used on each assay plate to establish an IgM standard curve. Pool 7 also was used on every assay plate as an IgM positive control.
EIA control parameters and assay stability.
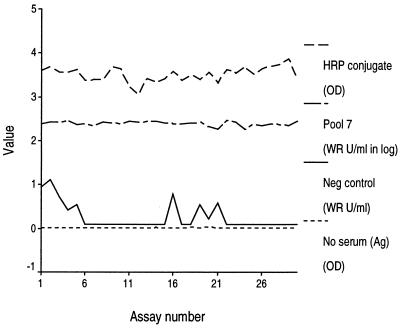
To ensure EIA accuracy and consistency, we empirically set control parameters and used individual plate standards and controls (Table 2). These control parameters were derived from 30 consecutive technically adequate assays. The limited variation of these parameters over those 30 assays is evidence that a skilled serologist can achieve consistent assay performance (Fig. 1).
TABLE 2.
IgM EIA control parameters defined by their variation over 30 consecutive assays
| Parameter | Acceptable valuesa | Distribution (n = 30)
|
|
|---|---|---|---|
| Median | Interquartile range | ||
| A: expected response for zero antibody level (OD units) | 0.00-0.17 | 0.07 | 0.05-0.12 |
| D: expected response for infinite antibody level (OD units) | 3.66-4.96 | 4.26 | 4.05-4.56 |
| C: median effective antibody level (WR units/ml) | 0.02-0.14 | 0.09 | 0.06-0.10 |
| B: slope of the corresponding logit-log plot | 0.93-1.46 | 1.19 | 1.11-1.24 |
| Pool 7 positive control (WR units/ml) | 195-304 | 249 | 235-249 |
| Negative serum control (WR units/ml) | 0-0.84 | 0.10 | 0.10-0.45 |
| No serum control (OD) | 0.009-0.026 | 0.018 | 0.014-0.021 |
Minimum-maximum.
FIG. 1.
Plots of the HRP conjugate and of positive (pool 7), negative, and no-serum (antigen) controls over 30 technically adequate assays.
Kinetics of IgM and total-Ig responses in patients with hepatitis E.
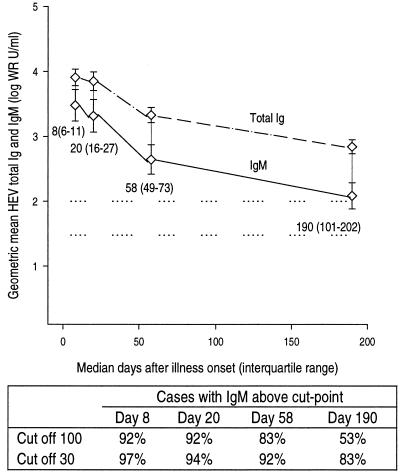
Consecutive patients with suspected acute viral hepatitis hospitalized at one center in Nepal were evaluated for hepatitis E by an RT-PCR test for viremia. Thirty-six cases of hepatitis E were identified, and HEV IgM and total-Ig levels were determined for four serial serum specimens from each of these patients collected over approximately 6 months (Fig. 2). The initial geometric mean IgM level was 3,000 WR units/ml at a median of 8 days after illness onset; the level declined slightly over the next 2 weeks and then exponentially over the next 5 months, nevertheless remaining easily detectable at 100 WR units/ml at a median of 190 days after illness onset. Geometric mean total Ig against HEV was greater than IgM at every time point analyzed, as was expected, but the decline in total Ig mirrored that in IgM.
FIG. 2.
Levels of HEV IgM (solid line) and total Ig (dashed line) among 36 patients with hepatitis E proven by detection of HEV viremia. Each patient had four consecutive serum specimens collected. Data are grouped by median day of specimen collection; these values plus the associated interquartile ranges in parentheses are given below the plot of HEV IgM. Error bars represent the 95% confidence interval for the geometric mean. Horizontal dotted reference lines are drawn at 30 and 100 WR units/ml. The table below the line plot gives the proportions of patients with HEV IgM detected at four median time points for assay cut points of 100 and 30 WR units/ml.
IgM test sensitivity, specificity, and cut point.
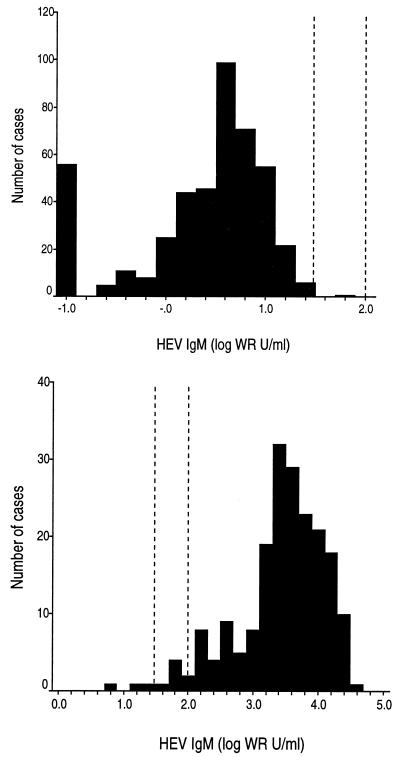
After determining the range of IgM levels likely to occur among patients, we analyzed the performance of the IgM test in order to identify a cut point. Specificity was assessed with serum specimens from 449 persons at low risk for acute HEV infection (Table 3); these were considered true-negative specimens. Approximately two-thirds were from healthy persons of all ages, including some residing in Nepal, a country where hepatitis E is endemic. Specimens from Nepal residents were collected several months before the annual epidemic, when the monthly infection rate is <2 per 10,000 (M. P. Shrestha and R. M. Scott, unpublished data). Other healthy donors were from the United States or Thailand, where hepatitis E is not endemic. Additionally, about one-third of the true-negative specimens were from patients in Thailand recently infected with bacteria or viruses other than HEV that cause hepatitis. The distribution of HEV IgM levels detected in this negative specimen set is shown in the upper histogram of Fig. 3. Most values were between 1 and 16 WR units/ml.
TABLE 3.
Composition of the true-negative specimen set (n = 449)
| Specimen donors | n | Proportion of total (%) |
|---|---|---|
| Healthy adults residing in Nepal | 75 | 16.7 |
| Healthy children residing in Nepal | 25 | 5.6 |
| Healthy U.S. adults participating in a hepatitis A vaccine study | 19 | 4.2 |
| Healthy U.S. soldiers | 101 | 22.5 |
| Healthy infants residing in Thailand | 76 | 16.9 |
| Children with dengue fever in Thailand, upon hospital discharge | 92 | 20.5 |
| Adolescents and adults with hepatitis A in Thailand | 23 | 5.1 |
| Adolescents and adults with hepatitis B in Thailand | 25 | 5.6 |
| Adolescents and adults with leptospirosis in Thailand | 13 | 2.9 |
FIG. 3.
(Top) Histogram of HEV IgM levels determined in a true-negative specimen set (n = 449). The interval scale is logarithmic; the mode is 6 WR units/ml. Vertical dotted reference lines are drawn at 30 and 100 WR units/ml. (Bottom) Histogram of HEV IgM levels determined in a true-positive specimen set (n = 197). The interval scale is logarithmic; the mode is 2,512 WR units/ml. Vertical dotted reference lines are drawn at 30 and 100 WR units/ml.
Sensitivity was assessed with serum specimens from 197 persons with acute hepatitis E infection diagnosed by detection of HEV viremia. Of these, 94% had clinically overt hepatitis E, while 6% had had subclinical infections. These patients were predominantly from Nepal; a few were from Indonesia or Bangladesh; all had their specimens submitted to our laboratories for serologic diagnosis. The distribution of HEV IgM levels detected in this positive specimen set is shown in the lower histogram of Fig. 3. Most values were between 200 and 20,000 WR units/ml.
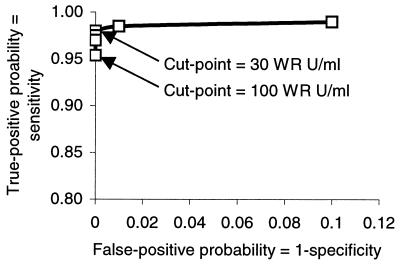
A receiver-operating characteristics curve was constructed from the test results described above by using cut points of 10, 20, 30, 40, 60, and 100 WR units/ml (Fig. 4). A cut point of 30 WR units/ml combines maximal sensitivity and specificity. Nevertheless, because elevated HEV IgM levels appear to persist for 6 months after illness onset, a cut point of 100 WR units/ml seems more appropriate for distinguishing recent from remote infection. Among the 36 cases for which data are summarized in Fig. 2, the proportion with HEV IgM levels above the cut point of 100 WR units/ml fell from 92% within 3 weeks of illness onset to 83% at 8 weeks after onset and 53% at 6 months after illness onset.
FIG. 4.
Receiver-operating characteristic plot for IgM EIA based on true-negative and true-positive specimen sets.
Ratio of HEV IgM to total Ig.
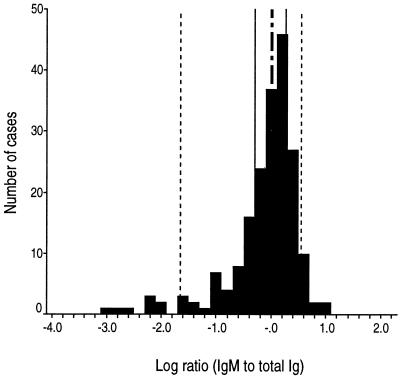
We determined the ratio of HEV IgM to total Ig for all 197 serum specimens in the true-positive specimen set. The histogram of those results (Fig. 5) shows that most values were between 0.1 and 10 and were distributed symmetrically around a median value of 1.0. Nevertheless, <5% of specimens (n = 8) had distinctly low ratios, such that these specimens appeared to constitute a separate population.
FIG. 5.
Histogram of HEV IgM-to-total-Ig ratios for the true-positive specimen set (n = 197). The interval scale is logarithmic; the mode is 1.6. Vertical reference lines mark cumulative distribution percentiles, as follows: dotted lines, 5 and 95%; solid lines, 25 and 75%; dashed-and-dotted line, 50%. Cases to the right of the 5% reference line (n = 189) appear to represent primary infections, whereas cases to the left of the 5% reference line (n = 8) appear to represent secondary infections with anamnestic antibody responses.
Serology data for acute-phase and early-convalescent-phase serum specimens from cases representing the 25th, 50th, and 75th percentiles were compared to data from the eight outlying cases with markedly low HEV IgM-to-total-Ig ratios (Table 4). All patients had HEV viremia demonstrated in the first specimens. Of the eight outlying cases, seven represented patients with clinically overt hepatitis E whereas one case was an inapparent infection detected in a family member of a patient with hepatitis E. The timing of the first specimen collection after illness onset for these eight cases was similar to, or even earlier than, that for the 25th-, 50th-, and 75th-percentile cases, excluding late collection as an explanation for low IgM levels. Nevertheless, there are striking contrasts: among the eight cases with low IgM-to-Ig ratios, the levels of IgM are low and the levels of total Ig are extremely high. These findings suggest that typical cases of hepatitis E represent primary infections with a typical evolution of Ig isotypes from IgM to IgG, whereas a minority of cases represent reinfection (secondary infections), with a typical anamnestic Ig response characterized by low levels of IgM and extremely high levels of IgG.
TABLE 4.
Serology data for all secondary cases and representative primary cases of hepatitis E in a sample of 197 patients from areas where hepatitis E is endemic a
| Antibody response | 1st specimen
|
2nd specimen
|
||||||||
|---|---|---|---|---|---|---|---|---|---|---|
| Days after illness onset | Viremia | IgM level (WR units/ml) | Total Ig level (WR units/ml) | IgM/Ig ratio | Days after illness onset | Viremia | IgM level (WR units/ml) | Total Ig level (WR units/ml) | IgM/Ig ratio | |
| Secondary | NA | Pos | 23 | 15,247 | 0.001 | |||||
| Secondary | 4 | Pos | 72 | 83,893 | 0.001 | 13 | Pos | 45 | 74,085 | 0.001 |
| Secondary | 5 | Pos | 18 | 7,079 | 0.002 | 16 | Pos | 23 | 4,185 | 0.005 |
| Secondary | 15 | Pos | 156 | 25,718 | 0.006 | 82 | ND | 89 | 4,159 | 0.021 |
| Secondary | 6 | Pos | 159 | 25,144 | 0.006 | 28 | Neg | 117 | 6,073 | 0.019 |
| Secondary | 6 | Pos | 345 | 48,035 | 0.007 | 29 | Neg | 82 | 23,597 | 0.003 |
| Secondary | (−10)b | Pos | 33 | 2,818 | 0.012 | 25 | Neg | 127 | 14,134 | 0.009 |
| Secondary | 8 | Pos | 63 | 5,171 | 0.012 | 36 | Neg | 16 | 4,762 | 0.003 |
| Primary, 25th percentile | 9 | Pos | 5,065 | 10,218 | 0.496 | 13 | Neg | 2,920 | 58,039 | 0.050 |
| Primary, 50th percentile | 8 | Pos | 19,969 | 19,536 | 1.022 | 10 | Neg | ND | 16,417 | |
| Primary, 75th percentile | 7 | Pos | 4,809 | 3,592 | 1.339 | 17 | Neg | 6,981 | 4,118 | 1.695 |
NA, not applicable (this case was an inapparent infection detected in a household survey done about 10 days after the onset of hepatitis E in an index case from the same household, and there was no 2nd specimen). Pos, positive; Neg, negative; ND, not done.
This specimen was obtained 10 days before onset of illness.
Comparison of WRAIR and Genelabs Technologies IgM EIAs.
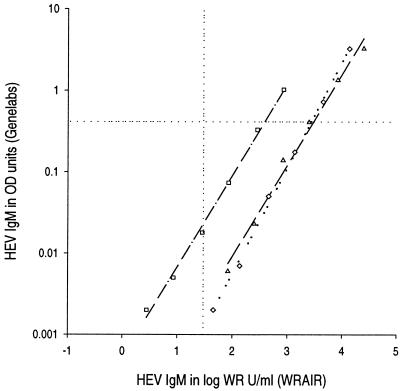
We found a consistent and highly correlated relationship between antibody binding assessment by the WRAIR IgM EIA and that by a commercial test widely available in Asia, for pool 6 and for acute-phase serum specimens from two typical hepatitis E cases in Nepal (Fig. 6). Nevertheless, a proportion of each titration curve was to the right of the WRAIR cut point (30 WR units/ml) (i.e., positive) but below the Genelabs cut point (i.e., negative). The greater sensitivity of the WRAIR test for low levels of antibody may confer some advantage on that test.
FIG. 6.
Comparison of IgM quantitation by WRAIR and Genelabs Technologies EIAs. Titration of three acute-phase serum specimens from hepatitis E patients is represented. Horizontal dotted reference line, cut point for the Genelabs test; vertical dotted reference line, cut point (30 WR units/ml) for the WRAIR test.
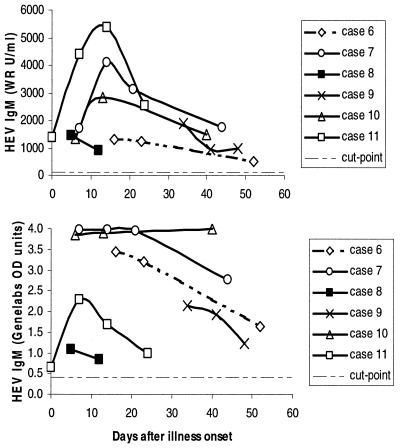
The relative utility of the two tests was compared directly in a sample of 19 specimens collected at varying intervals after disease onset (median of 40 days of follow-up after disease onset) from six hepatitis E patients diagnosed by detection of viremia. All specimens were positive in both tests. A line plot of results for each case, determined by the WRAIR test (Fig. 7, upper graph) and the Genelabs test (Fig. 7, lower graph), shows that the kinetic responses were similar in four cases and different in two (cases 7 and 10). Overall, the performance of the two tests appeared similar.
FIG. 7.
Serial determinations of HEV IgM levels for six patients with acute hepatitis E confirmed by RT-PCR detection of HEV viremia in the initial specimen. The upper graph shows results obtained by using the WRAIR IgM test; the bottom graph shows results obtained by using the Genelabs Diagnostics test. All 19 specimens were positive in each test. The cut point for each test is shown as a dashed line.
DISCUSSION
We have adapted our previously reported indirect EIA, which is able to quantitate HEV total Ig accurately and reproducibly, to quantitate HEV IgM. This is the third report describing an IgM EIA that uses a recombinant HEV capsid protein expressed in the baculovirus system, but the first HEV IgM test to offer quantitation or to be so exhaustively characterized. The performance of the IgM test was extensively evaluated, and assay specificity, sensitivity, and consistency were carefully documented. We used the IgM and previously described total-Ig tests to determine HEV IgM levels, total-Ig levels, and their ratio in acute-phase serum specimens from almost 200 cases of hepatitis E occurring in countries where hepatitis E is endemic. This dual testing allowed us to make the novel observation that a small proportion of disease is characterized by an anamnestic antibody response, suggesting that these cases result from secondary infection of a person who had previously recovered from a primary infection.
We chose an indirect EIA format for detecting and quantitating HEV IgM despite its inferior specificity compared to an IgM isotype-capture EIA. We rejected developing an IgM isotype-capture EIA after initial experiments demonstrated poor sensitivity despite use of substantially greater amounts of the rHEV antigen. We inferred from this observation that the rHEV antigen, in the physical form used in this assay (thawed from −70°C storage one to three times before use) and at concentrations that were economically feasible, was inefficient at bridging layers of specific Ig. This behavior of our rHEV antigen limited the assay format to an indirect test. One of the weaknesses of an indirect test is that IgM-rheumatoid factor in a test serum, which has activity against the Fc portion of IgG directed against HEV antigen, may elicit a false-positive result (7). We substantially reduced the risk of such nonspecific reactions by testing serum initially diluted 1:1,000. The other potential weakness of an indirect EIA format is reduced sensitivity due to competition between virus-specific IgM and IgG for antigen binding sites. The test sensitivity of 92 to 97%, depending on the cut point, suggests that IgG competition is not a limitation of this particular assay.
A necessary step in developing the quantitative IgM EIA was the creation of reference antibody pools of HEV IgM by using human serum from Nepal, where hepatitis E is endemic. By trial and error, we set the potency of the IgM quantitation standard so that a WR unit of IgM and a WR unit of total Ig (M plus G plus A isotypes) were comparable. There is no international HEV IgM reference standard, as the available World Health Organization HEV antibody standard contains only low levels of HEV-specific IgM (105.6 WR units/ml). We can provide samples of our IgM and total-Ig reference standards (available from the Department of Virus Diseases, WRAIR, upon request) to interested laboratories who wish to prepare their own in-house standards.
Of the several approaches for EIA quantitation of an unknown by using a standard curve, we chose the four-parameter logistic model, which is generally considered the most accurate and reproducible (15). We retained all procedures from our total-Ig test, previously shown to be reproducibly accurate to below the cut point (7% median error in quantitation of the mid-range standard). To achieve accurate and reproducible quantitation, an operator must perform this test with great care, using well-controlled reagents. This is more likely to be possible when the test is performed routinely, as might be expected in a research serology laboratory or a regional or national public health laboratory.
We had access to serial serum specimens collected over 6 months from 36 hepatitis E patients. These specimens demonstrated that IgM antibody levels were very high soon after illness onset, declined little over several weeks, and then declined rapidly to low levels over the next 4 to 6 months. This is typical of IgM responses to other acute, self-limited, systemic viral infections (4, 8). The weeks-long duration of markedly elevated IgM levels after disease onset means that diagnosis using even relatively insensitive IgM detection methods should be successful, even if patients come to medical attention late. Moreover, the months-long duration of IgM responses to HEV may be a boon to hepatitis E outbreak investigations, since these typically commence months after the index case occurs. A sensitive IgM test should be able to identify most disease cases from late-convalescent-phase serum specimens; the WRAIR test meets this criterion by detecting HEV IgM above a cut point of 30 WR units/ml in 92% of specimens collected a median of 2 months after disease onset and in 83% of specimens collected 6 months after disease onset. Additionally, since many HEV infections are known to be subclinical (3), sensitive tests for IgM may enable identification of all infected persons rather than those with disease only.
The preceding paragraph illustrates some of the ways in which an HEV IgM test might be used. For different uses, different assay cut points may be appropriate. The receiver-operating characteristics curve identified 30 WR units/ml as the cut point suitable for outbreak investigations, in which it is necessary to find remotely infected persons, whereas it identified 100 WR units/ml as a marginally less sensitive cut point that could distinguish a recent infection from a remote one.
We began this study anticipating that an HEV IgM test would improve serological diagnosis of hepatitis E, then based on detection of HEV-specific total Ig or IgG. We confirmed that detection of HEV IgM is the best serological test for diagnosis of hepatitis E. Yet the most interesting aspect of our work was the observation that in some cases of hepatitis E, there was a weak or absent IgM response. By combining HEV IgM and total-Ig tests, we identified primary and anamnestic HEV immune responses among adolescent and adult hepatitis E patients in areas of HEV endemicity, distinguished by widely divergent HEV IgM-to-total-Ig ratios. We inferred that anamnestic responses resulted from reinfection (secondary infection) of a person having an immunologic memory of prior HEV infection. In our experience, secondary infections are uncommon, comprising <5% of overt hepatitis E cases. This is an important observation because previously, some authorities have speculated that waning immunity explained why most cases of hepatitis E occurred among adults. The fact that more than 90% of hepatitis E cases in areas of HEV endemicity occur in patients who have a primary antibody response refutes this speculation of waning immunity, since previously exposed persons should mount an anamnestic response upon reexposure. On the other hand, we do speculate that asymptomatic secondary infections may be more common than symptomatic ones. Ultimately, the true prevalence of secondary infection and disease must be assessed prospectively. Such studies also may identify the risk factors that are associated with partial failure of immunity and determine whether clinical outcomes differ between primary and secondary disease. If secondary disease is associated with high-dose HEV exposure or waning immunity, hepatitis E vaccines now under development may have public health utility even among previously exposed persons, if they can be demonstrated to boost protective immunity.
Finally, we wanted to evaluate the WRAIR IgM test against the test marketed widely in Asia by Genelabs Diagnostics. The comparison was initiated by testing in parallel serial dilutions of three acute-phase specimens using the WRAIR and Genelabs Diagnostics tests. We found that the tests performed similarly across a range of dilutions, suggesting that these tests were comparable for serological diagnosis of acute disease. On the other hand, the results suggested that the WRAIR test would be more versatile in outbreak investigations based on its apparent superiority at detecting low levels of IgM reflecting remote infection. The comparison was completed by testing a separate panel of 19 specimens from 6 hepatitis E patients with viremia by both tests. In this limited assessment, both tests sensitively detected true acute HEV disease over a median of 40 days of follow-up. This result is consistent with an earlier report by Ghabrah and others (5), who found 96% concordance (kappa, 0.87) between an IgM test using an antigen similar to that used in the WRAIR test and the Genelabs IgM test.
In conclusion, the test method described here enables accurate quantitation of HEV IgM, including low levels associated with remote infection. Detection of HEV IgM is the method of choice for laboratory diagnosis of hepatitis E. By combining quantitation of HEV IgM and total-Ig levels, a new class of secondary infections can be detected. The epidemiological implications of secondary infections are clear, but their clinical implications must be assessed.
Acknowledgments
We gratefully acknowledge Khagendra B. Shrestha and Devendra B. Malla of the Royal Nepal Army Medical Department and Mona Bomgaars, Mira Hada, Kundu Norkyl, and Junu Thapa of the Patan Hospital, Lalitpur, Nepal, our dedicated physician collaborators who collected specimens from their patients with hepatitis E. Additional specimens were kindly provided by Andrew L. Corwin and Timothy P. Endy.
Financial support was provided by the U.S. Army Medical Research and Materiel Command and by GlaxoSmithKline Biologicals under a Cooperative Research and Development Agreement.
REFERENCES
- 1.Chobe, L. P., M. S. Chadha, K. Banerjee, and V. A. Arankalle. 1997. Detection of HEV RNA in faeces, by RT-PCR during the epidemics of hepatitis E in India (1976-1995). J. Viral Hepat. 4:129-133. [DOI] [PubMed] [Google Scholar]
- 2.Clayson, E. T., K. S. Myint, R. Snitbhan, D. W. Vaughn, B. L. Innis, L. Chan, P. Cheung, and M. P. Shrestha. 1995. Viremia, fecal shedding, and IgM and IgG responses in patients with hepatitis E. J. Infect. Dis. 172:927-933. [DOI] [PubMed] [Google Scholar]
- 3.Clayson, E. T., D. W. Vaughn, B. L. Innis, M. P. Shrestha, R. Pandey, and D. B. Malla. 1998. Association of hepatitis E virus with an outbreak of hepatitis at a military training camp in Nepal. J. Med. Virol. 54:178-182. [DOI] [PubMed] [Google Scholar]
- 4.Decker, R. H., S. M. Kosakowski, A. S. Vanderbilt, C. M. Ling, R. Chairez, and L. R. Overby. 1981. Diagnosis of acute hepatitis A by HAVAB-M, a direct radioimmunoassay for IgM anti-HAV. Am. J. Clin. Pathol. 76:140-147. [DOI] [PubMed] [Google Scholar]
- 5.Ghabrah, T. M., S. Tsarev, P. O. Yarbough, S. U. Emerson, G. T. Strickland, and R. H. Purcell. 1998. Comparison of tests for antibody to hepatitis E virus. J. Med. Virol. 55:134-137. [PubMed] [Google Scholar]
- 6.Goldsmith, R., P. O. Yarbough, G. R. Reyes, K. E. Fry, K. A. Gabor, M. Kamel, S. Zakaria, S. Amer, and Y. Gaffar. 1992. Enzyme-linked immunosorbent assay for diagnosis of acute sporadic hepatitis E in Egyptian children. Lancet 339:328-331. [DOI] [PubMed] [Google Scholar]
- 7.Hermann, K., and D. Erdman. 1995. Diagnosis by serologic assays, p. 121-138. In E. Lennette, D. Lennette, and E. Lennette (ed.), Diagnostic procedures for viral, rickettsial, and chlamydial infections, 7th ed. American Public Health Association, Washington, D.C.
- 8.Innis, B. L., A. Nisalak, S. Nimmannitya, S. Kusalerdchariya, V. Chongswasdi, S. Suntayakorn, P. Puttisri, and C. H. Hoke. 1989. An enzyme-linked immunosorbent assay to characterize dengue infections where dengue and Japanese encephalitis co-circulate. Am. J. Trop. Med. Hyg. 40:418-427. [DOI] [PubMed] [Google Scholar]
- 9.Innis, B. L., J. Seriwatana, R. A. Robinson, M. P. Shrestha, P. O. Yarbough, C. F. Longer, R. M. Scott, D. W. Vaughn, and K. S. Myint. 2002. Quantitation of immunoglobulin to hepatitis E virus by enzyme immunoassay. Clin. Diagn. Lab. Immunol. 9:639-648. [DOI] [PMC free article] [PubMed] [Google Scholar]
- 10.Labrique, A. B., D. L. Thomas, S. K. Stoszek, and K. E. Nelson. 1999. Hepatitis E: an emerging infectious disease. Epidemiol. Rev. 21:162-179. [DOI] [PubMed] [Google Scholar]
- 11.Li, F., M. A. Riddell, H. F. Seow, N. Takeda, T. Miyamura, and D. A. Anderson. 2000. Recombinant subunit ORF2.1 antigen and induction of antibody against immunodominant epitopes in the hepatitis E virus capsid protein. J. Med. Virol. 60:379-386. [DOI] [PubMed] [Google Scholar]
- 12.Li, T. C., J. Zhang, H. Shinzawa, M. Ishibashi, M. Sata, E. E. Mast, K. Kim, T. Miyamura, and N. Takeda. 2000. Empty virus-like particle-based enzyme-linked immunosorbent assay for antibodies to hepatitis E virus. J. Med. Virol. 62:327-333. [DOI] [PubMed] [Google Scholar]
- 13.Nanda, S. K., I. H. Ansari, S. K. Acharya, S. Jameel, and S. K. Panda. 1995. Protracted viremia during acute sporadic hepatitis E virus infection. Gastroenterology 108:225-230. [DOI] [PubMed] [Google Scholar]
- 14.Robinson, R. A., W. H. Burgess, S. U. Emerson, R. S. Leibowitz, S. A. Sosnovtseva, S. Tsarev, and R. H. Purcell. 1998. Structural characterization of recombinant hepatitis E virus ORF2 proteins in baculovirus-infected insect cells. Protein Expr. Purif. 12:75-84. [DOI] [PubMed] [Google Scholar]
- 15.Rodbard, D., and P. J. Munson. 1980. Radioimmunoassay data processing, p. 343-348. In N. R. Rose and H. Friedman (ed.), Manual of clinical immunology. American Society for Microbiology, Washington, D.C.
- 16.Touze, A., N. Enogat, Y. Buisson, and P. Coursaget. 1999. Baculovirus expression of chimeric hepatitis B virus core particles with hepatitis E virus epitopes and their use in a hepatitis E immunoassay. J. Clin. Microbiol. 37:438-441. [DOI] [PMC free article] [PubMed] [Google Scholar]
- 17.Tsarev, S. A., L. N. Binn, P. J. Gomatos, R. R. Arthur, M. K. Monier, H. van Cuyck-Gandre, C. F. Longer, and B. L. Innis. 1999. Phylogenetic analysis of hepatitis E virus isolates from Egypt. J. Med. Virol. 57:68-74. [DOI] [PubMed] [Google Scholar]
- 18.Yarbough, P. O., A. W. Tam, K. Gabor, E. Garza, R. A. Moeckli, I. Palings, C. Simonsen, and R. G. Reyes. 1994. Assay development of diagnostic tests for hepatitis E, p. 367-370. In K. Nishioka, H. Suzuki, S. Mishiro, and T. Oda (ed.), Viral hepatitis and liver disease. Springer-Verlag, Tokyo, Japan.


