

Abstract
Objective
To develop a set of pediatric acute care hospital referral regions for use in studying pediatric acute care delivery and test their utility relative to other regional systems.
Study design
We used state-level administrative databases capturing all pediatric acute care in 8 states to construct novel referral regions. We first constructed pediatric hospital service areas (PHSAs) based on 5 837 464 pediatric emergency department encounters. We then aggregated these PHSAs to pediatric hospital referral regions (PHRRs) based on 344 440 pediatric hospitalizations. Finally, we used 3 measures of spatial accuracy (localization index, market share index, and net patient flow) to compare this novel region system with the Dartmouth Atlas, designed originally to study adult specialty care, and the Pittsburgh Atlas, designed originally to study adult acute care.
Results
The development procedure resulted in 717 novel PHSAs, which were then aggregated to 55 PHRRs across the included states. Relative to hospital referral regions in the Dartmouth and Pittsburgh Atlases, PHRRs were fewer in number and larger in area and population. PHRRs more accurately captured patterns of pediatric hospitalizations, (eg, mean localization index: 69.1 out of 100, compared with a mean of 58.1 for the Dartmouth Atlas and 62.4 for the Pittsburgh Atlas).
Conclusions
The use of regional definitions designed specifically to study pediatric acute care better captures contemporary pediatric acute care delivery than the use of existing regional definitions. Future work should extend these definitions to all US states to enable national analyses of pediatric acute care delivery.
Recent decades have witnessed dramatic changes in the US hospital-based pediatric acute care delivery system, including an increasing centralization of pediatric critical care in specialized children’s hospitals, closures of pediatric hospital units in many nonchildren’s hospitals, and efforts to expand access to high-quality pediatric emergency care in the nation’s emergency departments (EDs).1–5 These shifts create a need to study changes in access to and outcomes of pediatric acute care at the regional level.6 As the National Academies of Medicine emphasized in a landmark report on pediatric acute care improvement,7 this research must go deeper than national-level analyses and include analyses at the regional level, both because regional trends often vary markedly from national ones,8 and because policy levers for improving child health at the federal level are scant.9,10 Robust definitions for regions are a necessary antecedent to understanding regional pediatric acute care delivery, because well-defined regions capture the organization of specialized physical, financial, and human resources and thus reflect shared training, business, and practice patterns.11–13
To date, most regional analyses in health care have used definitions derived by the Dartmouth Atlas of Health Care.14 Analyses of variation in care based on the Dartmouth Atlas have provided important insight into strategies to improve care delivery in the US.15–19 However, the Dartmouth Atlas has many limitations that reduce its utility for understanding pediatric acute care. First, it was developed using 1990s Medicare claims data to study adult specialty care, with a purpose and method that bear little resemblance to contemporary patterns of pediatric acute care delivery.20 In addition, the pediatric acute care system has diverged from the adult system in recent years through closure of inpatient units and increased transfers to referral centers,4,21,22 leading to a paradigm in which pediatric emergency care is widely distributed, with over 90 percent of emergency visits in general EDs,23 while inpatient care is concentrated in an increasingly small number of primarily urban specialty hospitals.24,25
Other region systems have been developed since the Dartmouth Atlas, most notably the Pittsburgh Atlas, which was developed to explicitly account for political boundaries that have oversight over the care of time-sensitive conditions such as trauma systems.26 In pediatrics, Dartmouth researchers developed Neonatal Intensive Care Regions for perinatal care27 and conducted a detailed examination of pediatric inpatient care in northern New England using data from 2007 through 2010.28 However, there are no regional definitions that reflect the contemporary pediatric acute care system or are explicitly accountable to the state-level policymakers who lead regulatory responsibility for child health. In addition, systems designed for studying adult care have not been evaluated for their performance in studying pediatric acute care in its modern structure. To address this gap, we aimed to develop a set of pediatric acute care referral regions and evaluate their performance relative to existing regional systems in describing health care markets that capture distinct regional populations and resources while maintaining responsiveness to state-level policymakers.
Methods
Development Framework
Our overall goal was to define geographic regions that reflected the unique organization of hospital-based pediatric acute care.23–25 Key considerations in developing these regions include the fact that the vast majority of pediatric acute care encounters occur in the EDs of community hospitals,29 while the majority of severe acute illness is ultimately treated in specialized pediatric hospitals.3,4,25 To address these issues we defined pediatric hospital service areas (PHSAs) based on ED visit patterns, reflecting the community-based nature of frontline pediatric acute care. We then aggregated these PHSAs to form pediatric hospital referral regions (PHRRs) based on inpatient hospitalization patterns, reflecting the referral-based nature of pediatric hospitalizations. We did not require geographic contiguity of regions due to the long distances children often travel to access inpatient care,1,30–32 the frequency with which children bypass nearby hospitals to reach pediatric centers,33,34 the common use of air transfer for interfacility transport,35–37 and the absence of strong pre-existing reasons to impose contiguity on regions. Because child health policy is typically set at the state level through payment policy (eg, Medicaid, the Children’s Health Insurance Program, and private insurance regulations38), oversight of health care providers (eg, hospitals and Emergency Medical Services), and other policy efforts (eg, ED pediatric readiness improvement and verification programs39), we computed each set of regions within state borders to maximize policy relevance.
Data Sources
We used the State Inpatient Databases (SID) and State Emergency Department Databases (SEDD) from the Agency for Healthcare Research and Quality’s Healthcare Cost and Utilization Project (HCUP). The SID contains both inpatient encounters and ED encounters that result in an inpatient admission within the same hospital, while the SEDD contains ED encounters that do not result in an admission to the same hospital. We chose these state-level databases because together they capture all inpatient and ED encounters in participating states regardless of payer. Other available databases (eg, Medicaid, private payer claims data) only include a subset of pediatric encounters based on payor type, which could lead to biases in region construction along both geographic and socioeconomic lines.40
We used HCUP encounter data from 8 states: California, Florida, Iowa, Maryland, Nebraska, Utah, Vermont, and Wisconsin. We selected these states because they met the following criteria: (a) they provide both the SID and SEDD, (b) they report a 5-digit ZIP code for each patient’s residence, (c) they directly identify individual hospitals, and (d) they represent a mix of states that are diverse in urban-rural mix and size. While we recognize the inherent limitation in developing regions using only a subset of states (rather than the entire nation), at the time of this study there were no national all-payer data sets for pediatric acute care. We felt it was important to first assess the potential utility of pediatric-specific regions without potential bias from selecting a subset of patients, with the understanding that future work could extend this process to other states as better data become available. We used 2018 data as it was the most recent HCUP data release including all required variables in a large set of states at the time of the project’s inception.
We augmented the HCUP data with data from several other sources, which we linked to HCUP either by direct hospital identifiers or ZIP code. We obtained hospital characteristics from the American Hospital Association Annual Survey of Hospitals. We obtained geographic definitions of ZIP code tabulation areas (ZCTAs) and population-by-ZCTA estimates from the US Census Bureau’s American Community Survey. To compare our regions with those of extant health care atlases that could plausibly be used to study pediatric acute care, we obtained publicly available ZIP-to-region “crosswalk” files from the Dartmouth Atlas14 and Pittsburgh Atlas.26
Patient Population
We included patients under 18 years of age with an acute care visit in the SID or SEDD, defined as an ED visit or inpatient hospitalization in a nonfederal acute care hospital. To ensure we examined pediatric acute care rather than perinatal or maternity care, we excluded encounters with primary “neonatal” or “maternal” diagnoses, identified using HCUP’s Clinical Classification Software.41,42 To balance the need to include very young patients who receive care for nonbirth-related reasons with the need to exclude birth-related reasons for hospitalization, we also excluded patients younger than 7 days of age at admission and encounters that HCUP classified as “newborn” encounters in states that report this field.
Constructing Pediatric Hospital Service Areas
We constructed PHSAs based on patterns of ED use. We first collated a set of pediatric ED encounters for each state by combining its SEDD with the subset of SID encounters that reflected ED care and then applying the exclusion criteria above. We then constructed candidate PHSAs by joining ZIP codes that shared a common “receipt of care” ZIP code, that is, the ZIP code where the residents of that ZIP received a plurality of ED care. We also required that candidate PHSAs be self-referring: that is, that residents of a ZIP code identified as the plurality destination in a candidate PHSA for another ZIP also receive a plurality of their ED care within that PHSA. If a candidate PHSA did not meet this criterion, its component ZIP codes were assigned to the PHSA to which the candidate PHSA’s residents primarily traveled. In a hypothetical example, a plurality of Town X’s residents visit a hospital in Suburb Y for ED visits, but a plurality of Suburb Y’s residents visit hospitals in City Z for their ED visits. In this example, both Town X and Suburb Y are assigned to the City Z PHSA. If, on the other hand, the plurality of Suburb Y’s residents visited hospitals within Suburb Y, then Suburb Y would remain a stand-alone PHSA.
Aggregating PHSAs to Pediatric Hospital Referral Regions
Once we identified a set of PHSAs, we aggregated them to form PHRRs based on patterns of pediatric inpatient care. We constructed candidate PHRRs by joining PHSAs that shared a common “receipt of care” PHSA where their residents received a plurality of inpatient care. We then refined these candidate PHRRs to ensure they met expected referral patterns based on multiple criteria. First, we required that a candidate PHRR capture at least 65 percent of the hospitalizations of its residents; we selected this cutoff as it was consistent with the methods of the Dartmouth Atlas and led to better spatial accuracy in preliminary analyses. For PHSAs that were preliminarily assigned to PHRRs that did not meet this cutoff, we reassigned them to the PHRR that did meet this cutoff and captured the largest fraction of its patients’ inpatient encounters.
Second, we set a minimum population of 30 000 children under 18 in each region. We selected this cutoff by inflating the minimum population criterion in the original development of the Dartmouth Atlas by US population growth trends, then applying a pediatric fraction of approximately 21 percent of the US population. For candidate PHRRs that did not meet this criterion, we reassigned their component PHSAs to candidate PHRRs that captured the largest fraction of each PHSA’s pediatric inpatient hospitalizations while also meeting the minimum population. Finally, we dealt with a small number of sparsely populated ZIP codes that had no inpatient or ED encounters in any hospital. For these ZIP codes we manually assigned them to geographically adjacent PHSAs and PHRRs as described in the Supplemental Appendix, online; available at www.jpeds.com.
The end result of these procedures was a set of regional definitions that aggregated ZIP codes into local hospital service areas (HSAs) based on patterns of pediatric ED care. These HSAs were then aggregated to hospital referral regions (HRRs) based on patterns of pediatric hospitalizations.
Comparison with Other Region Systems
We compared our novel PHRRs with 2 other extant systems that could be used to study pediatric acute care: the Dartmouth Atlas and the Pittsburgh Atlas. We compared systems using descriptive statistics such as pediatric population, the number of hospitals in the region, and land area encompassed. We also compared the performance of these systems using 3 measures of spatial accuracy: the localization index, the market share index, and the net patient flow (Figure 1).14,26,43,44 The localization index measures the share of patients who live within a region who receive their care within the region; a well-defined set of regions will have a high average localization index with a theoretical maximum of 100. The market share index measures the share of patients who receive their care within a region but live outside of it; a well-defined set of regions will have a low average market share index with a theoretical minimum of 0.
Figure 1.
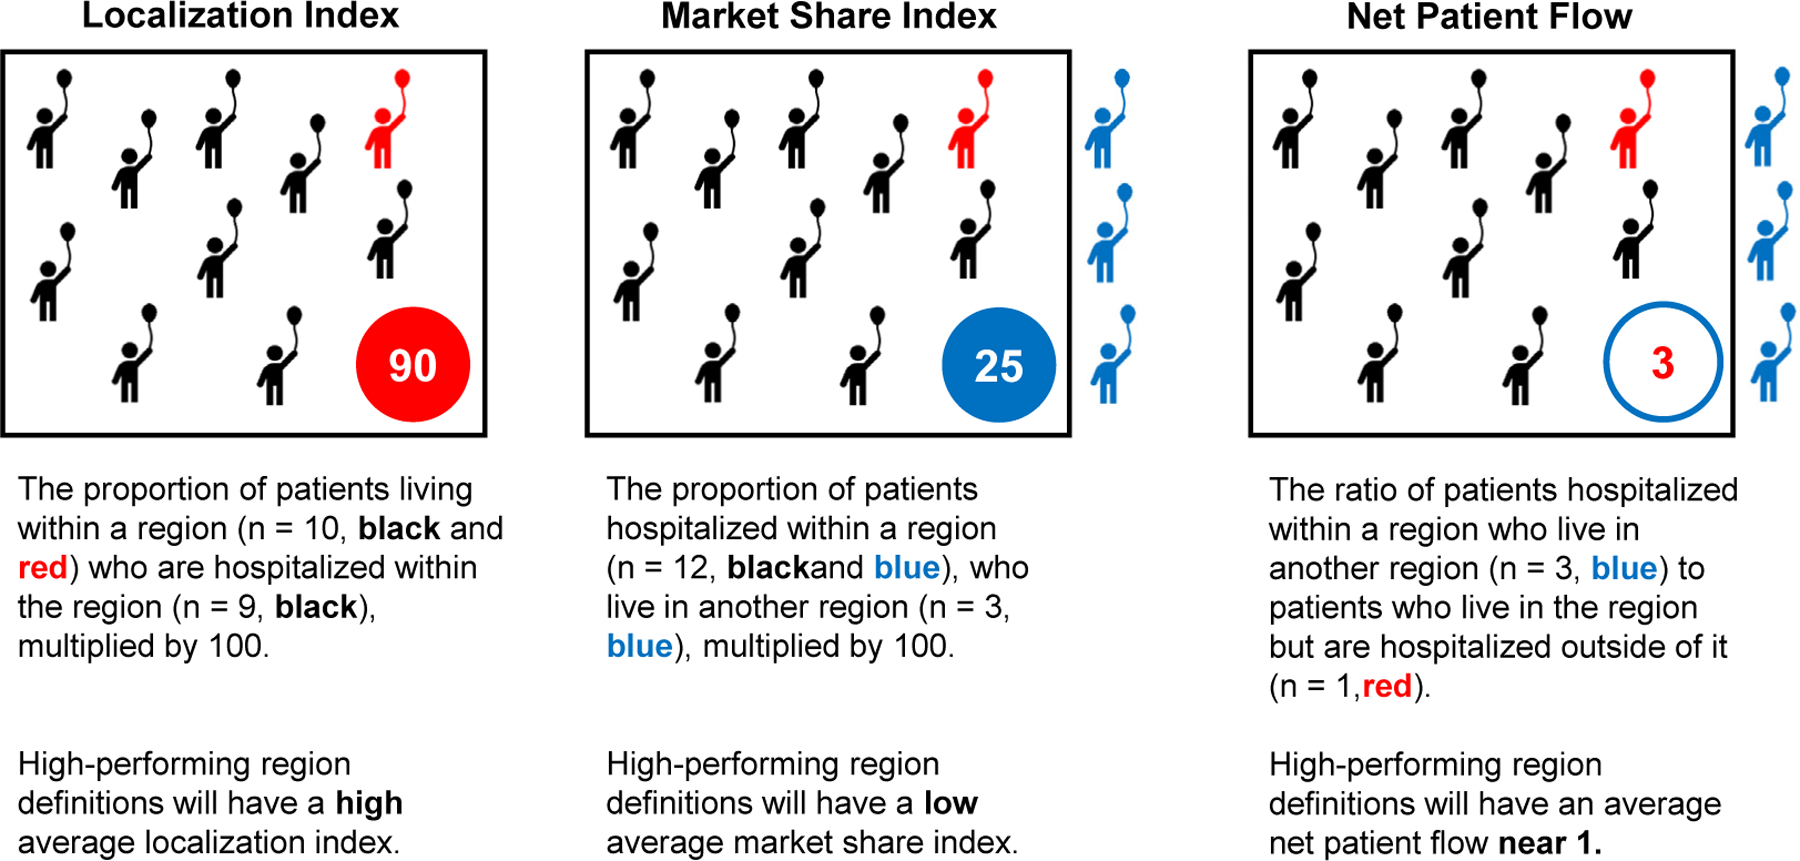
Schemata describing the measures of spatial accuracy. We used 3 geographic accuracy measures: localization index, market share index, and net patient flow. These measures evaluate the accuracy of region constructions, as they relate to where patients live and receive their acute care. Adapted from Wallace et al.26
The net patient flow is the ratio of patients who travel from outside the region to receive care to the patients who leave the region for care. A well-defined set of regions will have an average net patient flow near 1.0, reflecting regions that are approximately equal in resource availability. For example, consider a state with 3 major cities and multiple smaller towns, each with local hospitals that refer patients to major-city hospitals for specialty care. One potential region system would assign each city and town its own region. This might result in relatively high average localization and low average market share indices. However, many more patients would be leaving the town-based regions and headed to the city-based regions. Therefore the average net patient flow would fall well below 1.0, reflecting the fact that these regions are fundamentally dissimilar. Alternatively, dividing the state into regions centered around the 3 major cities would likely yield a net patient flow closer to 1.0, reflecting regions of more comparable resource availability. In this way, the net patient flow provides insight into balance of key resources across regions, highlighting the degree to which regions in a given system contain comparable health care resources. Taken together, the 3 metrics describe how well a regional definition system captures distinct patient populations with broadly similar health care resources.
For each participating state, we applied our novel region system and calculated these 3 measures for pediatric inpatient hospitalizations within each PHRR, and then calculated the measures for regions defined by the Dartmouth and Pittsburgh Atlases. We then compared the distribution of values at the region level to assess relative accuracy. Because we created de novo constructed regions using the entirety of the populations, standard frequentist statistics testing whether samples are drawn from the same population did not apply to this comparison; instead, we qualitatively assess performance by examining both measures of central tendency and by the extremes of the distribution.
Statistical Software
Administrative data were processed in R version 4.2.0 (The R Project). Resulting HSAs and HRRs were visualized in ArcGIS Pro version 3.0.0 (Esri, Inc). As secondary analysis of deidentified data this project was deemed exempt from human subjects review by our institutional guidelines.
Results
We identified 5 837 464 pediatric ED encounters and 344 440 pediatric inpatient hospitalizations meeting inclusion criteria across the 8 states in 2018. Using these records, we constructed 717 PHSAs. The median ZIP code sent 74.8% of its residents’ ED visits to its primary receiving ZIP code (IQR 50.0%−100%). The median PHSA consisted of 6 ZIP codes (IQR 4-10), contained a pediatric population of 9796 children (IQR 3366-29 836), encompassed 2 hospitals (IQR 1-2), and covered a land area of 366 square miles (IQR 132-678).
We then used these PHSAs to construct 55 PHRRs. The median PHRR consisted of 60 ZIP codes (IQR 34-145) and 7 PHSAs (IQR 4.5-16). The median PHRR contained a pediatric population of 121 531 children (IQR 77 786-417 765), encompassed 16 hospitals (IQR 10-43), and covered a land area of 3399 square miles (IQR 1315-8204). As expected given the centralized nature of pediatric acute care, PHRRs were fewer in number and larger in both population and area than HRRs defined by the Dartmouth and Pittsburgh Atlases (Table). Figure 2 demonstrates the difference in region construction in Iowa as an exemplar.
Table.
Geographic and demographic data of 3 hospital referral region methods
| Method | # ZIPs | Total population | Population under 18 | Hospitals | Land area (square mi) | Total area (square miles) |
|---|---|---|---|---|---|---|
| Pediatric (n = 55) | 60 (34–145) | 676 233 (378K–1.9M) | 121 531 (78K–418K) | 16 (10–43) | 3399 (1314–8204) | 3608 (1376–8326) |
| Dartmouth (n = 89) | 48 (25 – 77) | 413 271 (208K–1.1M) | 77 950 (42K–253K) | 12 (7–24) | 3023 (1320–4899) | 3079 (1444–4958) |
| Pittsburgh (n = 70) | 48 (27 – 102) | 604 384 (270K–1.6M) | 113 158 (59K–346K) | 16 (6–38) | 2909 (772–6034) | 3042 (787–6145) |
Population as of 2018; IQR for population rounded to aid in interpretation.
Results are presented as median (IQR).
Figure 2.

Differences in hospital referral region systems in Iowa.
In comparing our de novo PHRRs with the HRRs from the 2 extant systems, we found that all 3 systems displayed reasonable spatial accuracy, though pediatric-specific regions displayed better performance on all 3 metrics (Figure 3). In the localization index (Figure 3, panel A), the pediatric-specific regions had slightly better median performance but substantially fewer regions with extremely poor performance than the Dartmouth and Pittsburgh Atlases. A similar trend was evident in the market share index (Figure 3, panel B), in which the pediatric-specific regions again had slightly better median performance but substantially fewer regions with extremely poor performance. This trend also held true in the net patient flow (plotted on a log scale for clarity in Figure 3, panel C), where the median performance in the pediatric-specific method was slightly higher but the performance of the worst-performing regions was substantially better than those in the other 2 regions.
Figure 3.
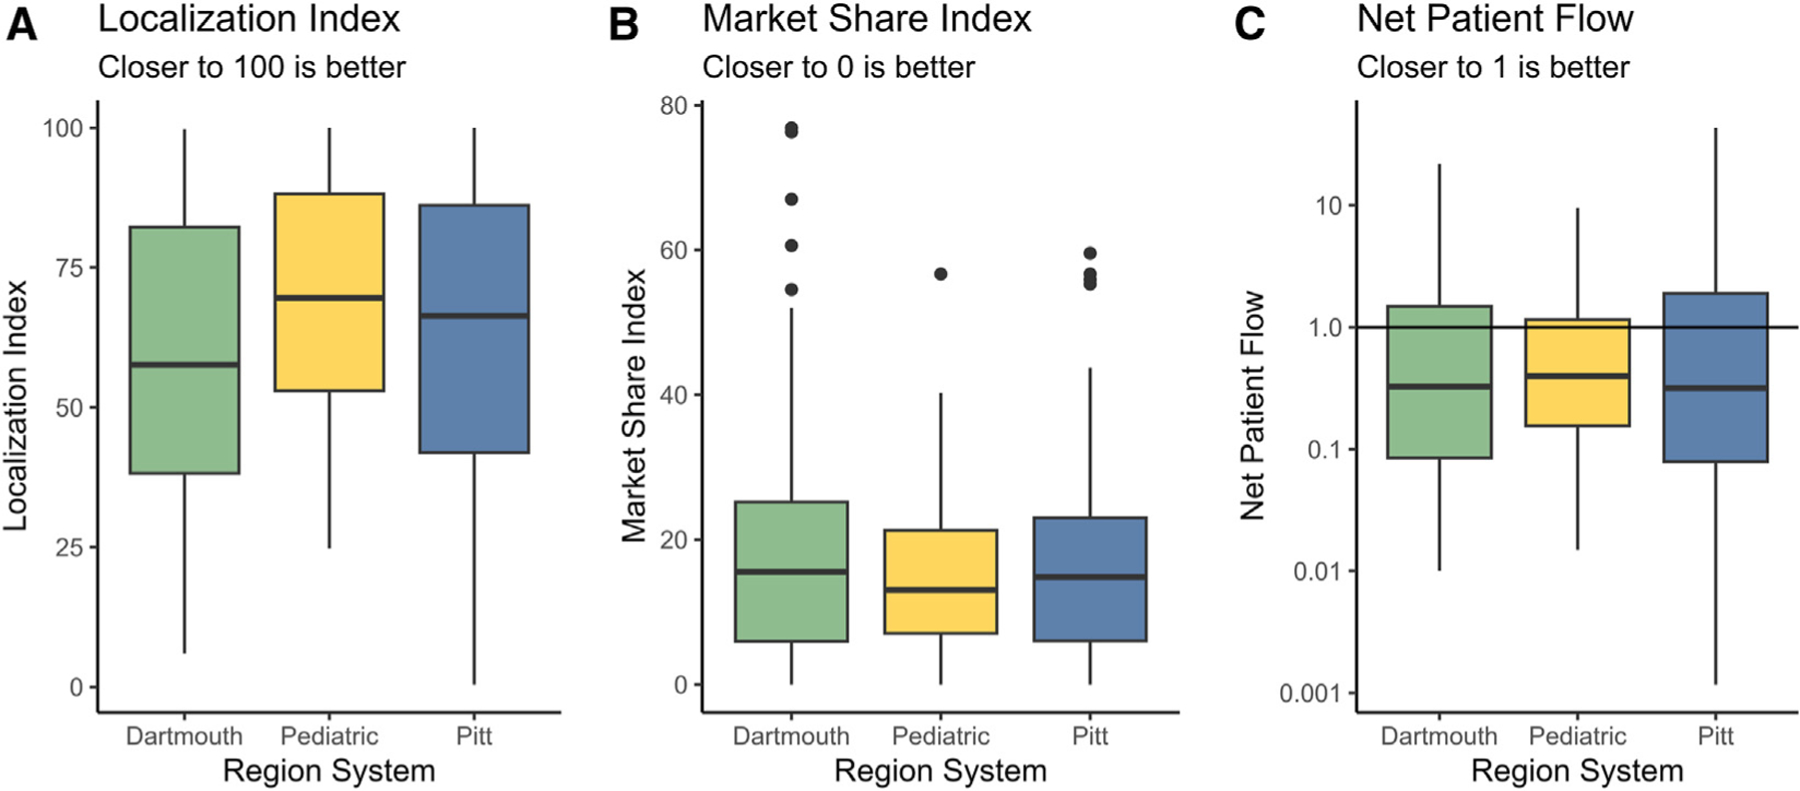
Comparison of spatial accuracy metrics among region systems. A, presents the localization dndex; B, presents the market share index; and C, presents the net patient flow. For clarity, the net patient flow metric is plotted on a log scale.
Discussion
Using comprehensive all-payer data from 8 states, we created a novel set of pediatric-specific acute care HRRs that reflect the unique organization of contemporary hospital-based pediatric acute care. All 3 systems we studied displayed only moderate spatial accuracy, but the novel pediatric-specific regions generally outperformed the other systems, largely by improving the performance of poorly performing outlier regions. Notably, although our novel set of regions performed better than previous systems, no system reached the level of performance noted in studies of adult care.26,44 This difference is likely due to the unique nature of pediatric hospitalizations, which are more rare on a per capita basis compared with adult hospitalizations. Pediatric care is also more centralized relative to the adult care system, with a growing dichotomy between widely distributed emergency care and highly concentrated inpatient care. Together, these forces—under any regional schema—will reduce the accuracy of smaller, mostly rural regions with relatively few pediatric hospitalizations and a high fraction of transfers out to specialty centers for services such as critical care.25 Nevertheless, the improved performance of our novel regions relative to current systems suggests that a national atlas developed specifically for pediatric acute care would better reflect the unique organization of pediatric acute care.
Researchers conducting regional analyses should select region definitions that are best suited to their specific research question. Studies of hospital-level variation in practice patterns may require institutional-level data,45,46 studies of primary care may rely on existing primary care service areas,47 and merger analyses may require specialized tools from health economics.48 The PHRRs we propose here may be best suited for studies of regional acute care delivery for children, a major policy focus of the last 2 decades.49 For example, they may enable rigorous evaluation of large-scale policy initiatives such as the National Pediatric Readiness Project, which aims to improve the pediatric capabilities of EDs.50–53 Understanding regional variation in the effects of this program and others may enable policy makers to refine these efforts to target areas in most need. These regions may also support efforts to study the relationships among pediatric acute care market structure, spending, and outcomes.54,55 For example, region-level analyses can enable comparisons between regions with single dominant children’s hospitals and those with multiple hospitals that provide tertiary-level pediatric care, and the relative benefits of competition, coordination, and centralization.55,56
Regional definitions can also provide platforms for coordination of care; for example, state health authorities could develop tightly integrated pediatric trauma systems from pre-hospital stabilization to definitive care along regional lines.57 The success of these systems relies on the abilities of policy makers to encourage coordination among hospitals within regions, abilities which are impossible unless regions can be precisely defined. Similarly, specialty pediatric hospitals can also use regional definitions to improve collaboration and the quality of care for acutely ill children requiring transfer while reducing family and capacity burdens associated with avoidable transfers.58–62 Finally, regional definitions can define new population-level quality metrics in pediatric accountable care organizations, which address costs in part by reducing acute care utilization away from “anchor” children’s hospitals.63
The primary limitation of this work is that HCUP data are not available in all US states, requiring us to define regions only for a subset of states. Unfortunately, there is no national database that would include all pediatric patients in an unbiased fashion. Although some national databases exist, they do not represent all payers and their populations systematically differ from the general population in both geographic and socioeconomic characteristics.40 Future work should generate regions based on national single-payer data and compare them with those we present here based on all-payer data. If these different data sources generate similar regions, then single-payer data may be sufficient to generate unbiased regions in all states. In addition, any future work can use more recent data, as ongoing changes in the pediatric acute care system exacerbated by the COVID-19 pandemic are not yet fully reflected in HCUP data.64
We made 2 intentional design choices that have important attendant limitations. First, to maximize policy relevance, we precluded regions from crossing state lines. However, in some areas, children cross state borders to receive acute care, a phenomenon that may be increasing in an era of increasing centralization of pediatric acute care.1,5,22,25 This issue may reduce the internal validity of some regions, especially in areas where major pediatric referral centers are located near state borders. This issue may also reduce the ability for users to measure cross-state transfers as part of quality improvement initiatives designed to strengthen regional collaboration among hospitals. Without a national all-payer data set, which does not yet exist, we cannot fully explore the implications of cross-border travel and its impact on regional accuracy. However, it is possible that other regional definitions would be better for this specific use-case.
Second, we did not require that regions be geographically contiguous, leading some regions to have “islands” inside other regions. These areas may have unique referral patterns that vary based on patient need—for example, they may refer children with uncomplicated respiratory infections to nearby, potentially cross-border community hospitals while referring patients who need critical care services to the more distant in-state pediatric referral center. Both of these design choices are worthy of examination in future research. As we suggest above, future work should attempt to use single-payer data sets to construct a national atlas. This work can explicitly test the impact of a state border limitation on region construction. It can also examine “island” areas to specifically examine whether these areas have different patterns of cross-border travel based on patient acuity. Ultimately, a national atlas using this approach in all 50 states could help state policymakers identify geographic areas that require cross-region collaboration to optimize referral patterns that involve state borders.
An additional limitation of our work is the use of ZIP codes and ZCTAs as the smallest geographic unit of analysis. ZIP codes are optimized for postal mail delivery rather than geographic analysis.65 Alternative units such as census tracts are not available in most administrative data sets, making the use of ZIP codes more practical and generalizable. Moreover, the Dartmouth Atlas was originally developed using ZIP codes and has proved extremely useful to researchers studying delivery of adult health services.11,15–19,66–68 We anticipate pediatric-specific regions will be similarly useful despite this limitation. Finally, in a minority of cases involving multihospital systems, hospital geolocation in the American Hospital Association database represents the location of the hospital system rather than each individual facility; we anticipate this is a minor limitation.
In summary, using all-payer encounter data to construct pediatric-specific HRRs that reflect the unique organization of hospital-based pediatric acute care is technically feasible and results in improved spatial accuracy when compared with the Dartmouth and Pittsburgh Atlases. Future work developing a national atlas of pediatric acute care regions is warranted and may provide a platform for studying variation in pediatric acute care delivery systems on a regional level.
Supplementary Material
Glossary
- ED
Emergency department
- HCUP
Healthcare Cost and Utilization Project
- HRR
Hospital referral region
- HSA
Hospital service area
- PHRR
Pediatric hospital referral region
- PHSA
Pediatric hospital service area
- SEDD
State Emergency Department Databases
- SID
State Inpatient Databases
- ZCTA
ZIP code tabulation area
Footnotes
CRediT authorship contribution statement
Allan M. Joseph: Writing – review & editing, Writing – original draft, Visualization, Validation, Methodology, Investigation, Formal analysis, Data curation, Conceptualization. John S. Minturn: Writing – review & editing, Visualization, Software, Resources, Methodology, Conceptualization. Kristen S. Kurland: Writing – review & editing, Software, Methodology, Conceptualization. Billie S. Davis: Writing – review & editing, Software, Resources, Project administration, Methodology, Data curation. Jeremy M. Kahn: Writing – review & editing, Visualization, Supervision, Resources, Project administration, Methodology, Investigation, Conceptualization.
Declaration of Competing Interest
Prof. Kurland has received compensation for textbook authorship from Esri, Inc, the maker of ArcGIS software used in this project. Dr Joseph was supported by a grant from the National Institutes of Health (5T32HL007820). The NIH had no role in the study design, data analysis, manuscript preparation, or decision to submit the manuscript for publication.
Data Availability
Crosswalk files linking ZIP codes to PHRRs, as well as GIS shapefiles for PHRRs, are available on the Open Science Framework at the following URL: https://osf.io/xnqpv/. HSA-level data are not available due to data use restrictions intended to minimize hospital reidentification.
References
- 1.Cushing AM, Bucholz EM, Chien AT, Rauch DA, Michelson KA. Availability of pediatric inpatient services in the United States. Pediatrics 2021;148:e2020041723. [DOI] [PMC free article] [PubMed] [Google Scholar]
- 2.McManus ML, França UL. Availability of inpatient pediatric surgery in the United States. Anesthesiology 2021;134:852–61. [DOI] [PubMed] [Google Scholar]
- 3.França UL, McManus ML. Trends in regionalization of hospital care for common pediatric conditions. Pediatrics 2018;141:e20171940. [DOI] [PubMed] [Google Scholar]
- 4.França UL, McManus ML. Availability of definitive hospital care for children. JAMA Pediatr 2017;171:e171096. [DOI] [PMC free article] [PubMed] [Google Scholar]
- 5.Joseph AM, Davis BS, Kahn JM. Association between hospital consolidation and loss of pediatric inpatient services. JAMA Pediatr 2023;177:859. [DOI] [PMC free article] [PubMed] [Google Scholar]
- 6.Goldstick JE, Cunningham RM, Carter PM. Current causes of death in children and adolescents in the United States. N Engl J Med 2022. 19;386:1955–6. [DOI] [PMC free article] [PubMed] [Google Scholar]
- 7.Emergency care for children: growing pains [Internet]. Washington, D.C.: National Academies Press; 2007. Accessed May 6, 2023. http://www.nap.edu/catalog/11655 [Google Scholar]
- 8.Wallace DJ, Angus DC, Seymour CW, Barnato AE, Kahn JM. Critical care bed growth in the United States. A comparison of regional and national trends. Am J Respir Crit Care Med 2015;191:410–6. [DOI] [PMC free article] [PubMed] [Google Scholar]
- 9.Britton CV, American Academy of Pediatrics Committee on Pediatric Workforce. Ensuring culturally effective pediatric care: implications for education and health policy. Pediatrics 2004;114:1677–85. [DOI] [PubMed] [Google Scholar]
- 10.Laird J, Cozad MJ, Keim-Malpass J, Mack JW, Lindley LC. Variation in state Medicaid implementation of the ACA: the case of concurrent care for children. Health Aff 2020;39:1770–5. [DOI] [PMC free article] [PubMed] [Google Scholar]
- 11.Song Y, Skinner J, Bynum J, Sutherland J, Wennberg JE, Fisher ES. Regional variations in diagnostic practices. N Engl J Med 2010;363:45–53. [DOI] [PMC free article] [PubMed] [Google Scholar]
- 12.Skinner J Chapter two - causes and consequences of regional variations in health care. In: Pauly MV, Mcguire TG, Barros PP, eds. Handbook of health economics [Internet]. Elsevier; 2011. p. 45–93 (Handbook of Health Economics; vol. 2). https://www.sciencedirect.com/science/article/pii/B9780444535924000025 [Google Scholar]
- 13.Molitor D The Evolution of Physician Practice Styles: Evidence from Cardiologist Migration [Internet]. National Bureau of Economic Research; 2016. (Working Paper Series). Accessed March 15, 2024. https://www.nber.org/papers/w22478 [DOI] [PMC free article] [PubMed] [Google Scholar]
- 14.The Dartmouth atlas of healthcare. Chicago, IL: American Hospital Pub; 1996. [Google Scholar]
- 15.O’Connor GT, Quinton HB, Traven ND, Ramunno LD, Dodds TA, Marciniak TA, et al. Geographic variation in the treatment of acute myocardial InfarctionThe cooperative cardiovascular project. JAMA 1999;281:627–33. [DOI] [PubMed] [Google Scholar]
- 16.Fisher ES. The implications of regional variations in Medicare spending. Part 1: the content, quality, and accessibility of care. Ann Intern Med 2003;138:273. [DOI] [PubMed] [Google Scholar]
- 17.Stukel TA, Lucas FL, Wennberg DE. Long-term outcomes of regional variations in intensity of invasive vs medical management of Medicare patients with acute myocardial infarction. JAMA 2005;293:1329–37. [DOI] [PMC free article] [PubMed] [Google Scholar]
- 18.Newhouse JP, Garber AM. Geographic variation in health care spending in the United States: insights from an institute of medicine report. JAMA 2013;310:1227. [DOI] [PubMed] [Google Scholar]
- 19.Newhouse JP, Garber AM. Geographic variation in Medicare services. N Engl J Med 2013;368:1465–8. [DOI] [PubMed] [Google Scholar]
- 20.Guagliardo MF, Jablonski KA, Joseph JG, Goodman DC. Do pediatric hospitalizations have a unique geography? BMC Health Serv Res 2004;4:2. [DOI] [PMC free article] [PubMed] [Google Scholar]
- 21.McManus ML, França UL. Visualizing patterns in pediatric and adult hospital care. Hosp Pediatr 2019;9:398–401. [DOI] [PubMed] [Google Scholar]
- 22.Michelson KA, Hudgins JD, Lyons TW, Monuteaux MC, Bachur RG, Finkelstein JA. Trends in capability of hospitals to provide definitive acute care for children: 2008 to 2016. Pediatrics 2020;145:e20192203. [DOI] [PubMed] [Google Scholar]
- 23.Whitfill T, Auerbach M, Scherzer DJ, Shi J, Xiang H, Stanley RM. Emergency care for children in the United States: epidemiology and trends over time. J Emerg Med 2018;55:423–34. [DOI] [PubMed] [Google Scholar]
- 24.Steiner MJ, Hall M, Sutton AG, Stephens JR, Leyenaar JK, Chase L, et al. Pediatric hospitalization trends at children’s and general hospitals, 2000–2019. JAMA 2023;330:1906–8. [DOI] [PMC free article] [PubMed] [Google Scholar]
- 25.Killien EY, Keller MR, Watson RS, Hartman ME. Epidemiology of intensive care admissions for children in the US from 2001 to 2019. JAMA Pediatr 2023;177:506–15. [DOI] [PMC free article] [PubMed] [Google Scholar]
- 26.Wallace DJ, Mohan D, Angus DC, Driessen JR, Seymour CM, Yealy DM, et al. Referral regions for time-sensitive acute care conditions in the United States. Ann Emerg Med 2018;72:147–55. [DOI] [PMC free article] [PubMed] [Google Scholar]
- 27.Goodman DC, Bronner KK, Doherty JR. The Dartmouth Institute for Health Policy & Clinical Practice, The Dartmouth atlas of neonatal intensive care: a report of the Dartmouth atlas project. Lebanon, NH: Dartmouth Institute of Health Policy & Clinical Practice; 2019. [PubMed] [Google Scholar]
- 28.Goodman DC, Morden NE, Ralston SL, Chang CH, Parker DM, Weinstein SJ. The Dartmouth atlas of children’s health care in northern new England [Internet]. Lebanon (NH): The Dartmouth Institute for Health Policy and Clinical Practice; 2013. (The Dartmouth Atlas of Health Care). Accessed July 8, 2024. http://www.ncbi.nlm.nih.gov/books/NBK587393/ [PubMed] [Google Scholar]
- 29.McDermott KW, Stocks C, Freeman WJ. Overview of pediatric emergency department visits, 2015. In: Healthcare cost and utilization project (HCUP) statistical Briefs [Internet]. Rockville (MD): Agency for Healthcare Research and Quality (US); 2018. Accessed May 22, 2023. http://www.ncbi.nlm.nih.gov/books/NBK526418/ [Google Scholar]
- 30.Brown LE, França UL, McManus ML. Socioeconomic disadvantage and distance to pediatric critical care. Pediatr Crit Care Med 2021;22:1033–41. [DOI] [PubMed] [Google Scholar]
- 31.Brown L, França UL, McManus ML. Neighborhood Poverty and distance to pediatric hospital care. Acad Pediatr 2023;23:1276–81. [DOI] [PubMed] [Google Scholar]
- 32.McDaniel CE, Hall M, Berry JG. Trends in distance traveled for common pediatric conditions for rural-residing children. JAMA Pediatr 2023;178: 80–1. [DOI] [PMC free article] [PubMed] [Google Scholar]
- 33.Fishe JN, Psoter KJ, Anders JF. Emergency medical services bypass of the closest facility for pediatric patients. Prehosp Emerg Care 2019;23:485–90. [DOI] [PubMed] [Google Scholar]
- 34.Moynihan K, França UL, Casavant DW, Graham RJ, McManus ML. Hospital access patterns of children with technology dependence. Pediatrics 2023;151:e2022059014. [DOI] [PubMed] [Google Scholar]
- 35.Joseph AM, Horvat CM, Evans IV, Kuch BA, Kahn JM. Helicopter versus ground ambulance transport for interfacility transfer of critically ill children. Am J Emerg Med 2022;61:44–51. [DOI] [PubMed] [Google Scholar]
- 36.Shinozaki RM, Schwingshackl A, Srivastava N, Grogan T, Kelly RB. Pediatric interfacility transport effects on mortality and length of stay. World J Pediatr 2021;17:400–8. [DOI] [PMC free article] [PubMed] [Google Scholar]
- 37.Patel SC, Murphy S, Penfil S, Romeo D, Hertzog JH. Impact of interfacility transport method and specialty teams on outcomes of pediatric trauma patients. Pediatr Emerg Care 2018;34:467–72. [DOI] [PubMed] [Google Scholar]
- 38.Grace AM, Noonan KG, Cheng TL, Miller D, Verga B, Rubin D, et al. The ACA’s pediatric essential health benefit has resulted in A state-by-state Patchwork of coverage with exclusions. Health Aff 2014;33:2136–43. [DOI] [PMC free article] [PubMed] [Google Scholar]
- 39.Cichon ME, Fuchs S, Lyons E, Leonard D. A statewide model program to improve emergency department readiness for pediatric care. Ann Emerg Med 2009;54:198–204. [DOI] [PubMed] [Google Scholar]
- 40.Dahlen A, Charu V. Analysis of sampling bias in large health care claims databases. JAMA Netw Open 2023;6:e2249804. [DOI] [PMC free article] [PubMed] [Google Scholar]
- 41.Weiss AJ, Liang L, Martin K. Overview of hospital stays among children and adolescents, 2019. In: Healthcare cost and utilization project (HCUP) statistical Briefs [Internet]. Rockville (MD): Agency for Healthcare Research and Quality (US); 2022. Accessed July 4, 2023. http://www.ncbi.nlm.nih.gov/books/NBK588376/ [Google Scholar]
- 42.Healthcare cost and utilization project (HCUP) NIS Notes [internet]. Accessed May 25, 2023. https://hcup-us.ahrq.gov/db/vars/i10_serviceline/nisnote.jsp
- 43.Klauss G, Staub L, Widmer M, Busato A. Hospital service areas – a new tool for health care planning in Switzerland. BMC Health Serv Res 2005;5:1–15. [DOI] [PMC free article] [PubMed] [Google Scholar]
- 44.Kilaru AS, Wiebe DJ, Karp DN, Love J, Kallan MJ, Carr BG. Do hospital service areas and hospital referral regions define discrete health care populations? Med Care 2015;53:510–6. [DOI] [PubMed] [Google Scholar]
- 45.Ralston SL, Harrison W, Wasserman J, Goodman DC. Hospital variation in health care utilization by children with medical complexity. Pediatrics 2015;136:860–7. [DOI] [PubMed] [Google Scholar]
- 46.Rogerson CM, Hogan AH, Waldo B, White BR, Carroll CL, Shein SL. Wide institutional variability in the treatment of pediatric critical asthma: a multicenter retrospective study. Pediatr Crit Care Med 2024;25:37. [DOI] [PubMed] [Google Scholar]
- 47.Goodman DC, Mick SS, Bott D, Stukel T, Chang C, Marth N, et al. Primary care service areas: a new tool for the evaluation of primary care services. Health Serv Res 2003;38:287–309. [DOI] [PMC free article] [PubMed] [Google Scholar]
- 48.Gaynor MS, Kleiner SA, Vogt WB. A structural approach to market definition with an application to the hospital industry. J Ind Econ 2013;61: 243–89. [Google Scholar]
- 49.Lorch SA, Myers S, Carr B. The regionalization of pediatric health care. Pediatrics 2010;126:1182–90. [DOI] [PMC free article] [PubMed] [Google Scholar]
- 50.Gausche-Hill M, Ely M, Schmuhl P, Telford R, Remick KE, Edgerton EA, et al. A national assessment of pediatric readiness of emergency departments. JAMA Pediatr 2015;169:527–34. [DOI] [PubMed] [Google Scholar]
- 51.Remick KE, Hewes HA, Ely M, Schmuhl P, Crady R, Cook LJ, et al. National assessment of pediatric readiness of US emergency departments during the COVID-19 pandemic. JAMA Netw Open 2023;6:e2321707. [DOI] [PMC free article] [PubMed] [Google Scholar]
- 52.Ray KN, Olson LM, Edgerton EA, Ely M, Gausche-Hill M, Schmuhl P, et al. Access to high pediatric-readiness emergency care in the United States. J Pediatr 2018;194:225–32.e1. [DOI] [PMC free article] [PubMed] [Google Scholar]
- 53.Auerbach M, Gausche-Hill M, Newgard CD. National pediatric readiness project: making a difference through collaboration, simulation, and measurement of the quality of pediatric emergency care. Clin Pediatr Emerg Med 2018;19:233–42. [Google Scholar]
- 54.Raval MV, Reiter AJ, McCarthy IM. Association of children’s hospital status with value for common surgical conditions. JAMA Netw Open 2022;5:e2218348. [DOI] [PMC free article] [PubMed] [Google Scholar]
- 55.McCarthy IM, Raval MV. Price spillovers and specialization in health care: the case of children’s hospitals. Health Econ 2023;32:2408–23. [DOI] [PubMed] [Google Scholar]
- 56.Baicker K, Levy H. Coordination versus competition in health care reform. N Engl J Med 2013;369:789–91. [DOI] [PMC free article] [PubMed] [Google Scholar]
- 57.Fallat ME, Treager C, Humphrey S, Gumer L, Jawad K, Butler E, et al. A novel approach to assessment of US pediatric trauma system development. JAMA Surg 2022;157:1042–9. [DOI] [PMC free article] [PubMed] [Google Scholar]
- 58.Rokos IC, Sanddal ND, Pancioli AM, Wolff C, Gaieski DF. 2010 Academic emergency medicine consensus conference beyond regionalization: intergrated networks of emergency care. Inter-hospital communications and transport: turning one-way funnels into two-way networks. Acad Emerg Med 2010;17:1279–85. [DOI] [PubMed] [Google Scholar]
- 59.Hsuan C, Carr BG, Vanness D, Wang Y, Leslie DL, Dunham E, et al. A conceptual Framework for optimizing the equity of hospital-based emergency care: the structure of hospital transfer networks. Milbank Q 2023;101:74–125. [DOI] [PMC free article] [PubMed] [Google Scholar]
- 60.Mohr NM, Harland KK, Shane DM, Miller SL, Torner JC. Potentially avoidable pediatric interfacility transfer is a costly burden for rural families: a cohort study. Acad Emerg Med 2016;23:885–94. [DOI] [PubMed] [Google Scholar]
- 61.Sorensen MJ, von Recklinghausen FM, Fulton G, Burchard KW. Secondary overtriage: the burden of unnecessary interfacility transfers in a rural trauma system. JAMA Surg 2013;148:763–8. [DOI] [PubMed] [Google Scholar]
- 62.Li J, Monuteaux MC, Bachur RG. Interfacility transfers of Noncritically ill children to academic pediatric emergency departments. Pediatrics 2012;130:83–92. [DOI] [PubMed] [Google Scholar]
- 63.Christensen EW, Payne NR. Pediatric inpatient readmissions in an accountable care organization. J Pediatr 2016;170:113–9. [DOI] [PubMed] [Google Scholar]
- 64.VonAchen P, Davis MM, Cartland J, D’Arco A, Kan K. Closure of licensed pediatric Beds in health care markets within Illinois. Acad Pediatr 2022;22:431–9. [DOI] [PMC free article] [PubMed] [Google Scholar]
- 65.Grubesic TH, Matisziw TC. On the use of ZIP codes and ZIP code tabulation areas (ZCTAs) for the spatial analysis of epidemiological data. Int J Health Geogr 2006;5:58. [DOI] [PMC free article] [PubMed] [Google Scholar]
- 66.Sutherland JM, Fisher ES, Skinner JS. Getting Past denial — the high cost of health care in the United States. N Engl J Med 2009;361:1227–30. [DOI] [PubMed] [Google Scholar]
- 67.Bach PB. A map to Bad policy — hospital efficiency measures in the Dartmouth atlas. N Engl J Med 2010;362:569–74. [DOI] [PMC free article] [PubMed] [Google Scholar]
- 68.Fisher ES, Wennberg JE, Stukel TA, Skinner JS, Sharp SM, Freeman JL, et al. Associations among hospital capacity, utilization, and mortality of US Medicare beneficiaries, controlling for sociodemographic factors. Health Serv Res 2000;34:1351–62. [PMC free article] [PubMed] [Google Scholar]
Associated Data
This section collects any data citations, data availability statements, or supplementary materials included in this article.
Supplementary Materials
Data Availability Statement
Crosswalk files linking ZIP codes to PHRRs, as well as GIS shapefiles for PHRRs, are available on the Open Science Framework at the following URL: https://osf.io/xnqpv/. HSA-level data are not available due to data use restrictions intended to minimize hospital reidentification.