



SUMMARY
Fewer than 200 proteins are targeted by FDA-approved cancer drugs. We integrate CPTAC proteogenomics data from 1,043 patients across 10 cancer types with additional public datasets to identify potential therapeutic targets. Pan-cancer analysis of 2,863 druggable proteins reveals a wide abundance range and identifies biological factors that affect mRNA-protein correlation. Integration of proteomic data from tumors and genetic screen data from cell lines identifies protein overexpression- or hyperactivation-driven druggable dependencies, enabling accurate predictions of effective drug targets. Proteogenomic identification of synthetic lethality provides a strategy to target tumor suppressor gene loss. Combining proteogenomic analysis and MHC binding prediction prioritizes mutant KRAS peptides as promising “public” neoantigens. Computational identification of shared tumor associated antigens followed by experimental confirmation nominates peptides as immunotherapy targets. These analyses, summarized at https://targets.linkedomics.org, form a comprehensive landscape of protein and peptide targets for companion diagnostics, drug repurposing, and therapy development.
INTRODUCTION
Next-generation sequencing has revolutionized cancer research, leading to deep characterization of the cancer genome and transcriptome and vastly improved understanding of cancer biology1. Despite these advancements, most cancer patients are still treated with radiotherapy and chemotherapy, which are associated with significant recurrence risks and toxicities. Targeted therapies, including small-molecule drugs, monoclonal antibodies, antibody-drug conjugates (ADCs), proteolysis targeting chimeric molecules (PROTACs), antibody directed enzyme prodrug therapies (ADEPTs), cancer treatment vaccines, checkpoint inhibitors, and T-cell therapies, hold promise for achieving more effective and precise cancer treatment2. Because proteins are primary targets of these therapies and functional effectors of the cancer-driving genetic and epigenetic aberrations, proteogenomics, i.e., the integration of unbiased mass spectrometry (MS)-based proteomics with genomics, epigenomics, and transcriptomics3,4, provides a powerful framework for the exploration of existing and future targets for cancer treatment.
The Clinical Proteomic Tumor Analysis Consortium (CPTAC) has performed proteogenomic characterization for over 1,000 prospectively collected, treatment-naïve primary tumors spanning 10 cancer types, many with matched normal adjacent tissues. The CPTAC Pan-Cancer Resource Working Group has harmonized all omics data from the 10 cancer types for pan-cancer proteogenomics research5. In this study, we integrate this dataset with other public datasets to shed light on protein targets for cancer therapy. Our analysis provides insights into existing cancer drug targets and systematically identifies candidate new targets for drug repurposing or development. These include overexpressed and hyperactivated protein dependencies, protein dependencies associated with the loss of tumor suppressor genes, and putative neoantigens and tumor-associated antigens.
RESULTS
Proteomic quantification of druggable genes
We analyzed the harmonized CPTAC proteogenomics data from 1,043 tumor samples and 524 normal tissue samples across 10 cancer types, including breast invasive carcinoma (BRCA), clear cell renal cell carcinoma (CCRCC), colon adenocarcinoma (COAD), glioblastoma (GBM), head and neck squamous cell carcinoma (HNSCC), lung adenocarcinoma (LUAD), lung squamous cell carcinoma (LSCC), ovarian serous cystadenocarcinoma (OV), pancreatic ductal adenocarcinoma (PDAC), and uterine corpus endometrial carcinoma (UCEC)5 (Table S1). Through analysis of the mutation, copy number variation (CNV), methylation, and transcript, protein, and phosphosite abundance data6 (Figure 1A), we aimed to derive actionable insights for biomarker-guided patient selection, drug repurposing, and the development of new therapies.
Figure 1: Overview of the cohorts and proteomic landscape of therapeutic targets, see also Figure S1, Table S1, and Table S2.

A) Number of tumor and normal tissue samples for 10 cancer cohorts and number of total identified features for each omics type. B) Number of genes present in each of five target tiers. Overlapped genes were assigned to the top-most tier. C) Percentage of genes in each tier belonging to each functional family. D) Number of genes identified in each omics type in at least one cohort. E) Heatmap of median log2 MS1 intensity (protein abundance) for targets in each cohort. F) Rank of all proteins by median of the median abundance in each cohort, with the same color scale as E. The drug targets with the highest and lowest median abundances are labeled, as are the targets of the highest number of drugs approved for cancer. G) Scatter plot comparing median log2 RNA expression and median log2 protein abundance across all samples for druggable proteins quantified in at least 3 cohorts. Spearman’s correlation coefficients for all genes or those with either a median log2 RSEM above or below 6 are included. H) Heatmap of Spearman’s correlation coefficients between mRNA and protein abundance for the genes not correlated in any cohort. I) Spearman’s correlations between CDK9 protein abundance and CDK9 mRNA abundance or between CDK9 protein abundance and CCNT1 protein abundance in the LSCC cohort. J) GSEA enrichment of the mRNA processing gene set based on global protein co-expression with CDK9 protein (top) or global mRNA co-expression with CDK9 mRNA (bottom).
We collated drug target information from DrugBank7, Guide to Pharmacology (GtoPdb)8, the Drug Gene Interaction Database9, and the in silico human surfaceome10,11, and then classified the targets into five tiers (Figure 1B). Tier 1 included the primary inhibited targets of drugs approved for any cancer type by any regulatory agencies. Over thirty percent of the 156 Tier 1 targets were kinases (Figure 1C). Tier 2 comprised 471 primary inhibited targets of drugs approved for any other indications, featuring a higher proportion of ion channels and G-protein-coupled receptors (GPCRs) compared to Tier 1. Tier 3 encompassed 448 targets inhibited by drugs considered investigational or experimental, including a relatively large proportion of epigenetic drugs. Tier 4 consisted of the remaining 1,081 genes in protein families frequently targeted by small molecules. Tier 5 included 707 cell surface membrane proteins. The complete list of targets and their assigned tiers can be found in Table S2.
The five target tiers comprised a total of 2,863 genes, all quantified by RNA-Seq data, while proteomics data covered 71% (Figure 1D). The quantified druggable proteins displayed a wide range of median protein abundances in each cohort (Figure 1E). Across all cohorts, SERPINA1 had the highest overall median abundance among the druggable proteins, while S1PR5 had the lowest (Figure 1F). Additionally, proteins targeted by eight or more approved oncology drugs, including TUBB, PDGFRB, EGFR, TOP2A, FLT1, ERBB2, KIT, TYMS, PDGFRA, FLT4, and KDR, also showed a broad spectrum of overall median abundance.
Genes with higher median protein abundance tended to have higher median mRNA abundance; however, this association diminished for genes with low mRNA abundance (log2 RSEM ≤ 6) (Figure S1A), a trend also evident in the subset of druggable genes (Figure 1G). For all but three druggable genes with low mRNA abundance, their protein identification was validated using PepQuery212. We observed a significant enrichment of secreted proteins annotated by the Human Protein Atlas13 among the druggable genes with low mRNA abundance (Fisher’s exact test, p = 2.2×10⁻¹³, Figure 1G), potentially contributing to the observed discrepancy between mRNA and protein abundance.
The median gene-wise mRNA to protein correlations ranged from 0.34 to 0.61 across the ten cohorts, with an overall median value of 0.48, and each cohort contained 1,200 to 3,500 genes lacking a significant positive mRNA-protein correlation (Figure S1B). Notably, druggable genes across all five tiers had significantly higher median mRNA-protein correlations compared to other genes (Figure S1C). This may be partially explained by the depletion of druggable genes in large protein complexes, such as ribosome, oxidative phosphorylation complexes, and RNA polymerase, which tend to have poor mRNA-protein correlations14,15. Despite this interesting observation, in most cohorts, over half of the druggable genes had an mRNA-protein correlation below 0.6. In fact, 19 druggable genes did not show a significant positive mRNA-protein correlation in any of the 10 cohorts (adjusted p value > 0.01 or correlation coefficient < 0) (Figure 1H). These genes were predominantly associated with secreted proteins. However, they also included HDAC3 and CDK9, two genes involved in transcriptional regulation and not known to be secreted. CDK9 protein abundance had poor correlations with corresponding mRNA abundance across all cancer types, but it showed the strongest associations with the protein abundance of its binding partner cyclin T1 (CCNT1) among all proteins, without corresponding positive correlations at the mRNA level (Figure 1I, Figure S1D). Moreover, gene set enrichment analysis of proteins co-expressed with CDK9 protein revealed a significant enrichment of proteins involved in mRNA processing, the known function of CDK916, whereas the opposite was true for mRNAs co-expressed with CDK9 mRNA (Figure 1J). These results suggest that CDK9 protein levels better represent its function than its mRNA levels. Similarly, HDAC3 protein abundance was highly correlated with protein abundance of GPS2 (Figure S1E), a transcriptional corepressor that forms a complex with HDAC317, instead of HDAC3 mRNA abundance. These findings highlight the importance of directly measuring the protein abundance of druggable genes.
Targetable dependencies driven by protein overexpression
We compared tumors and normal tissue samples to identify proteins overexpressed in tumors. To further filter for proteins that are critical for cancer cell survival and proliferation and are therefore good therapeutic targets, we utilized gene dependency scores from CRISPR-Cas9 screen experiments in cancer cell lines of corresponding lineage, downloaded from the Cancer Dependency Map (DepMap)18. Across the eight cohorts with normal samples (Table S1), 999 to 2,914 genes showed both significant overexpression in tumor tissues (adj. p ≤ 0.01, Wilcoxon rank sum test) and significant reduction in cell growth following gene knockout in cell lines (adj. p ≤ 0.01, one-tailed T test, Figure 2A, Table S3A).
Figure 2: Prioritization of targetable tumor-overexpressed proteins based on genetic screen and genomic aberration, see also Figure S2 and Table S3.

A) Potentially druggable targets for each cancer type defined by protein upregulation in tumor tissue and CRISPR effect score below zero in cell lines. The top 10 druggable targets by significance in the tumor vs normal comparison were labeled. The number on the bottom right is the total number of candidates and druggable targets from each tier, respectively. B) Potentially druggable, non pan-essential, targets shared by at least five cancer types. C) Difference in cognate mRNA and protein abundance of a gene in the mutated samples vs WT samples in each cohort assessed by Student’s t-test. D) Association (Spearman’s correlation) of cognate mRNA and protein abundance with methylation level of genes hypomethylated in tumors. Triangles indicate overexpression of the protein in tumor samples compared to normal. E) Positive Spearman’s correlation between CNV, RNA, and protein abundance for genes in focal amplification regions. Triangles indicate overexpression of the protein in tumor samples compared to normal.
A total of 457 proteins within this pool could be classified into the five target tiers. Although many were specific to particular cancer types, 51 proteins were shared by at least five cancer types and were not designated as pan-essential proteins by DepMap (Figure 2B). These targetable pan-cancer dependencies included five Tier 1 targets, seven Tier 2 targets that suggest opportunities for drug repurposing, 19 Tier 3 targets that may provide indication for experimental drugs, as well as 15 Tier 4 and five Tier 5 targets, which are good candidates for new therapy development. Of note, the Tier 1 target GART and Tier 3 target PAK1 demonstrated both overexpression and dependency in all eight cancer types.
We further integrated mRNA and protein expression data with mutation, methylation, and copy number data to identify proteins whose overexpression was associated with genomic aberrations in their respective genes (Methods). These analyses included both targetable proteins and those not currently targetable, due to their potential roles as cancer drivers. Among our findings from the mutation analysis (Figure 2C, Table S3B), EGFR mutations in GBM and LUAD, frequently accompanied by copy number amplification, were associated with increased EGFR mRNA and protein levels. GATA3 mutations, known to disrupt recognition motifs for E3 ubiquitin ligases19, led to elevated protein and mRNA levels in BRCA. CTNNB1 mutations were associated with increased protein levels but not mRNA levels in UCEC, aligning with existing knowledge that hotspot mutations in CTNNB1 enable mutant proteins to escape recognition by β-Trcp and subsequent degradation20. TP53 mutations (Figure 2C), particularly missense mutations in the DNA binding domain (Figure S2A–B), were associated with elevated protein abundance without a corresponding increase in mRNA in eight cohorts. It is well recognized that TP53 missense mutations in the DNA binding domain not only disrupt the protein’s DNA binding but also extend its half-life21. Regarding methylation (Figure 2D, Table S3C), in LSCC, the kinases PRKCI and PAK2 showed significant negative correlations between methylation and their expression at both mRNA and protein levels, with significantly lower methylation levels and higher protein abundance in tumors compared to normal tissues. Similarly, the BAR adapter family protein BIN2 showed significant negative correlations between its methylation and expression at both mRNA and protein levels across five cohorts. Additionally, BIN2 was found to be overexpressed in tumors compared to normal tissues in CCRCC, PDAC, and HNSCC, and showed dependency in cell lines from these three cancer types (Table S3A). In the context of copy number alterations, 44 genes in the five tiers showed significantly higher mRNA and protein levels with copy number amplification (Table S3D). Of these, 21 were increased in the tumors from at least one cohort compared to normal tissues (Figure 2E), including well-known cancer drivers such as ERBB2, EGFR, and CDK6, as well as less-studied genes such as CLK2, MAP4K5, PPAT, PYGL, and SLC12A9. Together, these analyses prioritize overexpressed proteins as candidates for drug repurposing or development.
Targetable dependencies driven by protein hyperactivation
In addition to overexpression, protein activity could be altered by post-translational modifications to drive tumorigenesis. To identify targetable dependencies driven by protein hyperactivation, we performed differential abundance analysis of phosphosites between tumor and normal samples, filtered for tumor-overexpressed activating phosphosites on targetable proteins, and then integrated the results with DepMap dependency scores of their host genes in cancer cell lines of the same lineage.
In the eight cohorts with normal samples, 18 to 100 activating phosphosites showed significant increase in tumor tissues (adj. p ≤ 0.01, Wilcoxon rank sum test), with concordant decrease in cell growth upon gene knockout of the corresponding host proteins in cell lines (adj. p ≤ 0.01, one-tailed T test, Figure 3A, Table S4A). This included a total of 229 activating phosphosite-cancer combinations, with 90 involving phosphosites residing on proteins curated in the five target tiers.
Figure 3: Prioritization of targetable tumor-hyperactivated proteins based on genetic screen data, see also Figure S3 and Table S4.
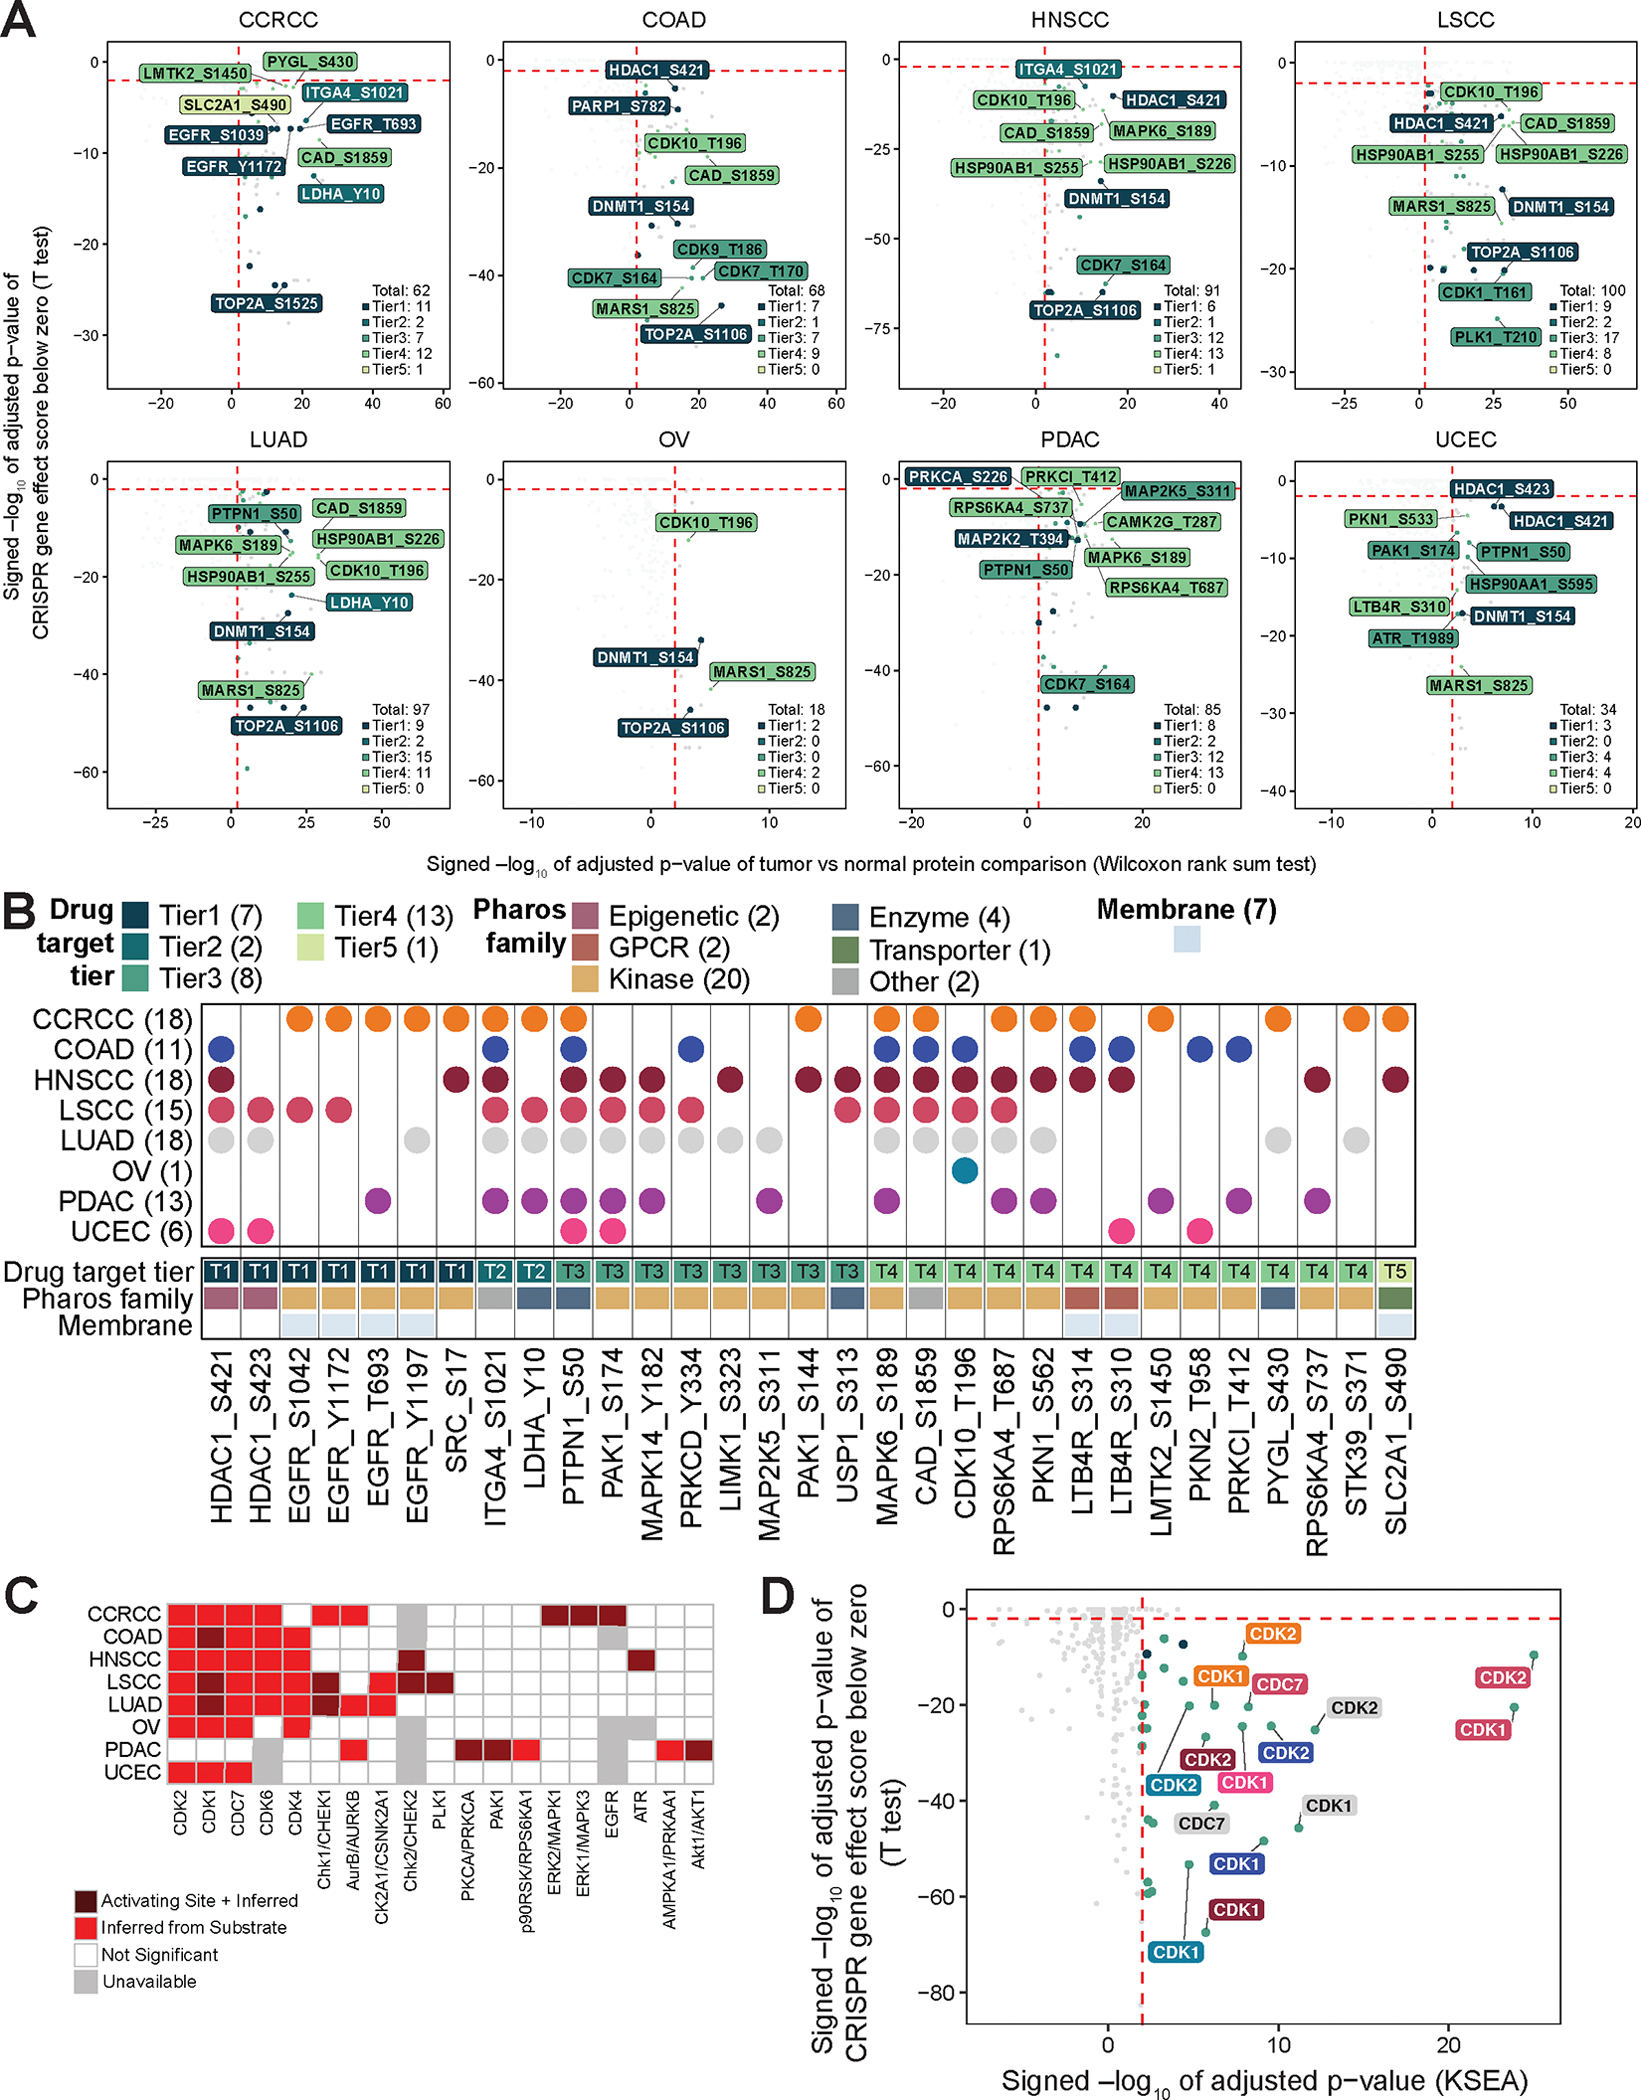
A) Targetable protein hyperactivation events for each cancer type defined by increased activating phosphosite abundance in tumor tissue and CRISPR gene effect score below zero of the corresponding protein. Top 10 hyperactivation events by significance in the tumor vs normal comparison were labeled. The number on the bottom right is the total number of candidates and druggable hyperactivation events from each tier, respectively. B) Targetable protein hyperactivation events on non pan-essential host targets shared by at least two cancer types. C) Kinase activity inference with annotation of increased activating site phosphorylation. D) Kinases with significantly increased inferred activity in tumors and a significant dependency score in genetic screen.
Among these protein hyperactivation events, 31 occurred in two or more cancer types, and their host proteins were not classified as pan-essential by DepMap (Figure 3B). Twenty of these events involved activating sites on kinases. Eight phosphosites appeared in five or more cancer types, including HDAC1 S421 (Tier 1), ITGA4 S1021 (Tier 2), PTPN1 S50 and PAK1 S174 (Tier 3), and MAPK6 S189, CAD S1859, CDK10 T196, and RPS6KA4 T687 (Tier 4). Some findings, such as for PTPN1, PAK1, and CAD, reinforced previous protein overexpression results (Figure 2B), whereas others were uniquely identified through phosphosite analysis.
Based on phosphosite differential analysis results, we further inferred altered kinase activity between tumor and normal samples using the Kinase-Substrate Enrichment Analysis (KSEA) algorithm (Table S4B). A total of 19 kinases had increased activity across the eight cohorts, and 11 had supporting evidence of upregulated phosphorylation of a kinase activating site in one or more cohorts (Figure 3C).
Thirty-one kinase-cancer pairs involving 15 unique kinases showed increased kinase activity in tumors and significant dependencies in corresponding cell lines in knockout data, and the most significantly hyperactivated kinases were CDK1, CDK2, and CDC7 (Figure 3D). Hyperactivation of these kinases was supported by overexpression of their regulatory proteins, cyclin B1 (CCNB1), cyclin E1 (CCNE1), and DBF4, respectively, in tumor vs normal comparison (Figure S3A). Additionally, within tumor samples, inferred activity of these kinases was correlated with the mRNA and protein abundance of corresponding regulatory proteins (Figure S3B). All kinases were supported by over-abundant phosphorylation of their substrates in tumor tissue and some protein substrates are also druggable (Figure S3C), which may be explored for combination therapies. Taken together, these analyses nominated hyperactive proteins as potentially effective therapeutic targets for further investigation.
Evaluation of the predicted druggable dependencies
To evaluate the quality and validity of our predictions (Figure 2A, Figure 3A), we first compared the proportions of predicted effective targets to all putative targetable genes in each of the target tiers. This analysis was performed for each cancer type separately, limiting to targetable genes that had both CPTAC and DepMap data in the cancer type. For all cancer types, the highest proportion of predicted effective targets was consistently found in Tier 1, which was expected since Tier 1 comprises targets of already approved oncology drugs. In comparison to Tiers 2, 4, and 5, the median proportion in Tier 1 was significantly higher (p<0.01, Wilcoxon signed rank test, Figure 4A). There was a less significant difference in the median proportion between Tier 1 and Tier 3 (p=0.016). This finding may be explained by the fact that Tier 3 genes, despite not being targeted by currently approved oncology drugs, are often the focus of oncology investigations. These findings indicate that our predictions are enriched with approved or investigational oncology targets.
Figure 4. Evaluation and validation of prioritized drug targets, see also Figure S4 and Table S5.

A) Boxplots depicting proportions of predicted effective targets among all targetable genes by drug target tiers. P-values derived from Wilcoxon signed rank test. B) Workflow describing the systematic evaluation of prioritized targets with PRISM primary screen drug response dataset. C) Success rates for prioritizing effective drug targets by cancer type using CRISPR data alone, tumor versus normal data alone, and a combination of both approaches. P-values derived from z-test. D) Sensitivities, specificities, and accuracies for the three approaches. E-G) Violin plots comparing target protein abundance in tumor vs normal (top panels, p-values derived from Wilcoxon rank sum test), and target dependency scores in cell lines (bottom panels, p-values derived from one-sample t-test) for Tier 4 targets CAD (E), PAK2 (F), and ITGB5 (G). H-J) Plots depicting cell growth (left panels) and cell line xenograft tumor volumes (right panels, N = 4–6 mice per group) from control and Tier 4 target knockdown cell lines for shCAD (H), shPAK2 (I), and shITGB5 (J). Data are mean ± SEM. P-values derived from T test. *p<0.05, **p<0.01, ***p<0.001, ****p<0.0001.
To further evaluate our predictions, we utilized primary screen data from the PRISM (Profiling Relative Inhibition Simultaneously in Mixtures) drug repurposing resource (Methods)22. Among the 1,075 druggable proteins in Tiers 1–3, we were able to assess the response to 648 unique drugs against 325 molecular targets that had both CPTAC and DepMap CRISPR KO data (Figure 4B). Overall, these experiments showed a 15% success rate across all 5,184 drug-cell lineage pairs (average log2 viability reduction > 0.3, p < 0.01, one-sample T test). We then compared the predictive performance of three different approaches: CRISPR alone, tumor versus normal comparison alone, and our method combining both strategies (Figure 4C–D, Figure S4A–C, Table S5A). Predictions based on CRISPR alone increased the chance of identifying successful PRISM drug responses from 15% to 22% (p<2.2e-16, z-test), showing the highest sensitivity and the lowest specificity among the three approaches, resulting in an accuracy of 57%. Predictions based on tumor versus normal comparison alone increased the chance of identifying drug responses to 29% (p<2.2e-16, z-test), displaying lower sensitivity and higher specificity than the CRISPR along approach, and yielding a relatively higher accuracy of 67%. Our method, integrating both tumor-normal comparison and cell dependency data, achieved the highest rate of identifying successful drug responses, elevating the success rate from 15% to 39% (p=2.9e-08, z-test), corresponding to a 2.6-fold increase in the likelihood of a successful drug experiment. Although our method showed lower sensitivity compared to the CRISPR-alone approach, it increased specificity from 53% to 83% (a 57% improvement), and accuracy from 57% to 76% (a 33% improvement). Given the large number of predictions generated by these approaches, high specificity and accuracy are crucial for nominating truly promising targets for further experimental and clinical validation.
Notably, some false positives identified in our evaluation, such as those based on the lack of response to the investigational HDAC1 inhibitor tacedinaline and PARP inhibitors niraparib, olaparib, and rucaparib, might result from the low potency of these drugs. This interpretation was supported by the positive responses to approved HDAC1 inhibitors belinostat and panobinostat, and the more potent PARP inhibitor talazoparib23 (Figure S4D–E). Conversely, some apparent false negatives, like those based on the response to the PRKCB inhibitor enzastaurin and the MAP2K1/MAP2K2 inhibitor refametinib in several cancer types without predicted dependencies, were validated as true negatives according to drug response data from Sanger’s Genomics of Drug Sensitivity in Cancer (GDSC) database (Figure S4F–G). Therefore, the actual accuracy of our predictions may exceed the 76% estimate derived from the PRISM evaluation.
Although three-quarters of our predicted pan-cancer targets (effective targets in five or more cancer types) validated by PRISM response data belonged to Tier 1, several of our predictions in Tiers 2 and 3 also received validation (Table S5A). For example, naftifine, which targets the Tier 2 target SQLE, and alvespimycin along with tanespimycin, both targeting the Tier 3 target HSP90AA1, demonstrated significant efficacy across cancer lineages (Figure S4H–I). To confirm the high-throughput, multiplexed screening results from PRISM, we performed drug response experiments with alvespimycin and tanespimycin on eight cell lines representing different cancer types using a low-throughput, non-multiplexed approach. The vast majority of cell lines showed IC50 values below 1 μM for both drugs, reinforcing the PRISM study findings (Figures S4J–K). To extend this validation into in vivo settings, we treated HT29 colon cancer cell line xenografts with alvespimycin (50 mg/kg, administered intraperitoneally daily). We observed significant reduction in tumor volume in alvespimycin treated mice compared to the vehicle control group (Figure S4L). Importantly, alvespimycin treatment began to induce tumor regression after seven days of treatment (Figure S4L), with the treatment group displaying no substantial change in body weight compared to the control group (Figure S4M).
Our analysis also identified several Tier 4 and 5 targets without currently developed drugs as potential pan-cancer targets (Figure 2B, Figure 3B). We selected three such targets for low-throughput experimental validation with shRNA knockdown, including CAD, an enzyme responsible for nucleotide synthesis (Figure 4E); PAK2, a member of the PAK family kinases (Figure 4F); and ITGB5, a cell surface integrin responsible for cell adhesion and signaling (Figure 4G). Stable shRNA and control cell lines for colon cancer (HT29 and LOVO) and pancreatic cancer (BXPC3) were generated for each target. For technical reasons, a stable shCAD LOVO cell line was not generated. Knockdown was confirmed at the protein level in these cell lines (Figure S4N). Cell proliferation assays showed that target knockdown inhibited cell growth compared to controls (Figure 4H–J, left panels). Furthermore, cell line xenografts also showed that knockdown of these targets suppressed tumor growth compared to controls in vivo (Figure 4H–J, right panels). These results demonstrate the utility of our approach in identifying candidate targets that are vulnerabilities and thus potential targets for future drug development.
Protein dependencies associated with the loss of tumor suppressor genes
Tumor suppressor genes (TSGs) are frequently affected by loss-of-function (LOF) genomic aberrations in cancer. Directly targeting LOF TSGs is challenging. However, the loss of these TSGs can induce tumor-specific dependencies on other proteins within the tumor, making these proteins attractive targets for synthetic lethal therapeutic strategies24. We performed unsupervised hierarchical clustering of the 10 cancer types based on the frequencies of LOF alterations in TSGs, specifically frameshift/nonsense mutations or deep deletions, found in the CPTAC and TCGA datasets. This analysis, which focused on TSGs with over 3% LOF alterations across all CPTAC and TCGA samples, demonstrated distinct clustering of the same cancer types in the two datasets (Figure 5A, Table S6A). Genomic loss of these TSGs was associated with reduced mRNA and protein abundance of the cognate genes, but a greater reduction was observed at the protein level compared to mRNA level for ARID1A and KMT2D, while the opposite was observed for TP53 (Figure 5B).
Figure 5. Identification of synthetic lethal partners of genomically altered tumor suppressor genes as putative targets, see also Figure S5 and Table S6.

A) Heatmap showing top frequently genomically altered tumor suppressor genes in CPTAC and TCGA cohorts. B) cis impact of tumor suppressor genes from (A) on cognate mRNA and protein levels. C) For each cancer type, each point represents the significance of a protein, phosphosite, or kinase activity being up-regulated in tumors harboring loss-of-function genetic alterations vs others (x-axis, higher value indicates more significant up-regulation) and also the significance of knockout of the corresponding gene in causing proliferation loss in cell lines of matched lineages harboring tumor suppressor loss vs others (y-axis, lower value indicates more significant loss in proliferation). D) TOP2A protein was significantly higher in UCEC tumors with TP53 loss, and UCEC cell lines harboring TP53 loss had significantly higher dependency to TOP2A. E) UCEC cell lines with TP53 loss were more sensitive to topoisomerase inhibitors doxorubicin and mitoxantrone compared with lines without TP53 loss. F) Abundance of ANAPC1 p-S334 was significantly higher in OV tumors with TP53 loss, and OV cell lines harboring TP53 loss had significantly higher dependency to ANAPC1. G) Inferred CHK1 activity was significantly higher in BRCA tumors with TP53 loss, and BRCA cell lines harboring TP53 loss had significantly higher dependency to CHK1. H) Summary of TP53 loss associated dependencies in three cancer types.
To systematically explore potential protein dependencies linked to TSG loss, we analyzed the associations between genomic losses of TSGs and variations in protein abundance, phosphosite abundance, and inferred kinase activity scores across tumor samples for each cancer type. Additionally, for each TSG-protein, TSG-phosphosite, and TSG-kinase activity pair, we used CRISPR data from matched cancer lineages in DepMap to determine if cell lines with TSG LOF aberrations exhibited increased dependency on the corresponding gene compared to cell lines without such aberrations (Figure S5A). Most of the identified TSG loss-associated dependencies were cancer type-specific (Figure 5C, Figures S5B–D and Table S6B–D). Only the dependency on RPL22L1 in KMT2D mutants was found in both COAD and UCEC. Interestingly, the identified TSG-phosphosite pairs generally showed more significant associations than corresponding TSG-protein pairs (Table S6E), suggesting that phosphorylation, rather than protein abundance, primarily drove these dependencies. Similarly, associations of TSG-kinase activity pairs were distinct from results based on kinase protein abundance (Figures S5B–D).
Since TP53 is the most frequently altered gene in cancer, we next focused on specific examples of TP53 associations to better understand their biological and therapeutic implications. One example is TP53-TOP2A in UCEC, where TOP2A protein abundance was significantly higher in tumors with TP53 loss, and uterine cancer cell lines with TP53 loss showed higher dependency on TOP2A compared to the other cell lines (Figure 5D). TOP2A, a topoisomerase that modulates DNA topology, has been previously reported as a synthetic lethal partner of TP53 loss25. TOP2A is required to prevent interference between replication and transcription in the event of TP53 loss. Additionally, elevated levels of TOP2A S1247 were also associated with TP53 loss, reinforcing protein level data. TOP2A S1247 is a mitotic phosphorylation site that affects the enzyme’s subcellular localization and residence time on mitotic chromatin26, suggesting a direct functional role for TOP2A in tumors harboring TP53 loss (Figure 5D).
TOP2A is targeted by chemotherapy agents such as doxorubicin27, which inhibits topoisomerase activity. Doxorubicin, currently approved for treating UCEC patients, has an overall response rate of 16% among unselected patients28. When examining in vitro drug response data from DepMap, uterine cancer cell lines with TP53 loss were found to be more sensitive to doxorubicin compared to lines without TP53 loss (Figure 5E). In addition, uterine cancer cell lines with TP53 loss also showed increased sensitivity to another topoisomerase inhibitor, mitoxantrone (Figure 5E), compared to cell lines with wild type TP53. Mitoxantrone has been reported to lack clinical activity for UCEC tumors among unselected patients29. These findings suggest further investigation into using TP53 loss as a biomarker to select UCEC patients for treatment with doxorubicin and mitoxantrone.
In OV tumors, ANAPC1 S334 abundance, but not the host protein level, showed a significant increase in samples harboring TP53 loss (Figure 5F). Moreover, OV cell lines with TP53 loss had significantly higher dependency on ANAPC1 (Figure 5F). Loss of TP53 promotes cell cycle progression which may increase requirements for activity of the anaphase promoting complex including ANAPC130. Although ANAPC1 S334 is not well-documented, it may represent an understudied ANAPC1 phosphosite that mediates ANAPC1 activity and ultimately cell cycle progression.
Finally, CHK1 kinase activity was higher in BRCA tumors with TP53 loss compared to other tumors (Figure 5G). CHK1 activates TP53, which then acts reciprocally to down-regulate CHK131. In the absence of this negative regulation by TP53, CHK1 activity increases in BRCA tumors, and CRISPR KO of its gene, CHEK1, causes a greater loss of fitness in BRCA cell lines with TP53 loss (Figure 5G). These data highlight a relationship where the activity of a partner gene is directly impacted by the loss of a TSG. A previous study demonstrated that tumors from a breast patient-derived xenograft (PDX) harboring a truncating TP53 mutation were more sensitive to a CHK1 inhibitor in combination with a DNA damaging agent compared to a WT TP53 PDX model32. The same study also used an isogenic PDX model with TP53 knockdown, showing that the combination treatment increased apoptosis in TP53 mutant tumor cells compared to WT TP53 control tumor cells. Our findings from human tumors strengthen the potential utility of using TP53 status as a biomarker to select breast cancer patients for CHK1 inhibition.
Figure 5H summarizes TP53 loss-associated dependencies across various cancer types. These findings illustrate the utility of the proteogenomic approach in identifying protein dependencies associated with the loss of tumor suppressor genes, revealing potential therapeutic opportunities.
Proteogenomic identification of neoantigen candidates
Neoantigens derived from somatic mutations are attractive targets for vaccine and T-cell-based immunotherapies33. Millions of putative mutation-derived neoantigens have been predicted based on genomic sequencing of human tumors34, but few have been detected in mass spectrometry-based immunopeptidomics35. Because neoepitopes are peptides instead of nucleic acid sequences, and expression is a key feature of identifying bona fide neoantigens36, we reason that proteomic evidence of the mutant peptides are useful to prioritize somatic mutations for immunotherapy development. We performed integrated analysis of proteomics, phosphoproteomics, and paired DNA and RNA sequencing data using NeoFlow37 to systematically predict somatic mutation-derived neoantigens with protein expression evidence (Figure 6A).
Figure 6. Prediction of somatic mutation-derived neoantigens using proteogenomics data, see also Table S7.

A) Overview of the proteogenomics workflow for neoantigen prioritization. B) Numbers of somatic mutation-derived variant peptides identified for each cancer type. C) Protein abundance (log2 MS1 intensity) for genes with mutations detected vs not detected in the proteomics data. D) The percent of samples with proteomics-supported putative neoantigens. E) Mutations predicted to yield neoantigens in at least two tumors. F) KRAS mutant peptides and corresponding HLA type predicted to yield neoepitopes in patients.
Searching both global proteome and phosphoproteome data against sample-specific customized protein databases derived from matched DNA and RNA sequencing data, we identified 27 to 533 mutant peptides across the 10 cancer types (Figure 6B). Identification of the large number of mutant peptides in UCEC was driven by the subset of microsatellite instability-high (MSI-H) or polymerase ε (POLE)-mutated samples, and the relatively high numbers of mutant peptides identified in LSCC, LUAD, and HNSCC compared to the remaining cancer types were associated with relatively higher mutation burdens in these cancer types. COAD also has a subset of MSI-H or POLE-mutated samples, but the proteomics depth was lower in this study compared to other cohorts, highlighting the importance of proteomics depth in identifying mutant peptides. Furthermore, genes with detected mutations at the protein level showed much higher protein abundance compared to genes with mutations that were not detected at the protein level (Figure 6C), suggesting protein abundance also played an important role in mutant peptide identification.
We predicted the binding affinity of all possible mutant epitopes to patient-specific HLA alleles inferred from DNA sequencing data for all mutations with protein-level evidence. Mutant epitopes with a binding affinity below 500 nM were considered putative neoantigens38. The percentage of samples with at least one predicted neoantigen ranged from 21% to 73% across the 10 cohorts (Figure 6D). This indicates many patients had the potential to benefit from neoantigen-based immunotherapy.
Our systematic analysis identified a total of 2,315 putative neoantigens associated with 846 somatic mutations (Table S7). Among the putative neoantigens, 180 were derived from 39 cancer genes annotated in the Cancer Gene Census database as high confidence oncogenes or tumor suppressor genes39, such as CTNNB1, TP53, KRAS, DDX3X, EGFR, ERBB3, FOXA1, MAPK1, HRAS, and ARID1A. Some of these neopeptides or their highly similar forms (e.g., longer peptides covering our predicted peptides) have been previously investigated preclinically or clinically. These include neopeptides resulting from KRAS G12C, G12D, and G13D40–51, IDH1 R132H51,52, and TP53 R273C53 mutations.
Most of our predicted neoantigen-yielding somatic mutations were specific to an individual patient’s tumor and the resulting neoantigens are likely to be private neoantigens. However, five mutations were predicted to yield neoantigens in at least two tumors, including KRAS G12D, KRAS G12C, KRAS G13D, DAZAP1 G383Afs*46, and RBM39 D328Y (Figure 6E). Among the 75 tumors with a KRAS G12D mutation, 53% produced detectable mutant peptides and 31% were predicted to yield at least one KRAS G12D derived neoepitope. The other two KRAS mutations were also predicted to yield neoepitopes in a substantial number of tumors. Remarkably, five KRAS mutant peptides were predicted to yield neoepitopes in 44 patients across four CPTAC cancer types (PDAC, LUAD, UCEC, and COAD), making them promising candidates of public neoantigens for targeting (Figure 6F).
Identification and validation of tumor associated antigens
Most of our predicted mutation-derived neoantigens were patient-specific, limiting their utility as targets of prefabricated vaccines or T cell products. We therefore expanded our search to tumor associated antigens by identifying proteins that are overexpressed in tumors and exhibit highly restricted expression in normal tissues (Figure 7A). As illustrated by MAGEA10 (Figure 7B), a highly immunogenic member of the Melanoma Antigen Gene (MAGE) family of cancer/testis tumor associated antigens54, tumor associated antigens may be abnormally expressed in only a subset of tumors within a cancer type. Therefore, they may not be detectable using conventional methods like the t-test or Wilcoxon rank sum test. Accordingly, we employed the Anderson Darling (AD) test, which focuses on comparing protein abundance in the tail regions, to better capture differences in abundance observed in only a subset of samples. Identified proteins were subjected to a filtering process based on the absence of detectable mRNA in normal tissues in the GTEx data, as well as the absence of experimentally detected HLA-I peptides in non-cancerous samples in the caAtlas database35 (Methods). Finally, we performed orthogonal validation of the protein identification using PepQuery212 to reduce the chance of potential false discoveries.
Figure 7. Tumor associated antigen identification and experimental validation, see also Table S8.

A) Tumor associated antigen identification pipeline. B) MAGEA10 RNA (top) and protein (bottom) expression in two cancer cohorts. C) Number of significantly differentially expressed proteins identified by AD test and Wilcoxon rank sum test across all cohorts. D) Distribution of seven prioritized tumor associated antigens across six cancer types. Dots and boxes indicate identifications shared by both tests or unique to the AD test. E) Experimental validation for binding affinity and immunogenicity for 67 peptides with the highest binding affinities to the most common allotype HLA-A*02 for the seven prioritized proteins in (D). Bar plot depicts the exchange efficiency of HLA-A*02:01 tetramer quantified by Q1 replacement percentage (R.P.). Red line indicates 50% replacement as the threshold for identifying a peptide with strong binding affinity. Heatmap depicts spot forming units (SFUs) per 100,000 cells from ELISpot experiments. Red bold text highlights 22 peptides showing both strong exchange efficiency (> 50%) and strong immunogenicity (SFU > 150), which are promising candidates for further investigation as broadly applicable immunotherapy targets. F) Representative flow cytometry plots for binding affinity (Q1 quadrant indicates replacement percentage) and ELISpot images for four selected peptides in two individuals.
The numbers of significantly differentially expressed proteins identified by AD test ranged from 4,627 to 10,818 across the eight cohorts with normal samples (Table S8). These completely covered all significant proteins identified by Wilcoxon rank sum test, with 13% to 38% increase across these cohorts (Figure 7C). Among these, 140 proteins had highly restricted expression in GTEx normal tissues except for immune-privileged tissues, including five MAGE family proteins, which are well-studied tumor associated antigens. Notably, MAGEA10 and MAGEB2 were only identified by AD test but not with Wilcoxon rank sum test, whereas MAGEA4 and MAGEA1 were identified in more cancer types by AD test, demonstrating the value of AD test in tumor associated antigen identification. We focused on a subset of 70 proteins that were significantly overexpressed in tumors based on the AD test in at least two cancer types (Table S8). After further removing proteins with detectable HLA-I peptides in non-cancerous samples in caAtlas, 9 proteins were subjected to PepQuery validation which ultimately prioritized 7 proteins (Figure 7D) for experimental validation.
To identify broadly applicable tumor associated antigens for immunotherapy development, we selected up to 10 peptides with the highest predicted binding affinities to the most common allotype HLA-A*02 for each of the seven proteins. This analysis identified 67 peptides (Table S8) that we tested through a competitive peptide binding assay to measure binding affinity. This assay measures the exchange efficiency of an exogenously added peptide of interest to displace pre-bound peptides on HLA tetramers. The underlying principle is that as the affinity of the added peptide for the HLA increases, it will displace pre-bound peptides more effectively, leading to a higher exchange efficiency. The exchange efficiency of HLA-A*02:01 tetramer with all the 67 selected peptides ranged from 2.38% to 97.9%, of which ~70% (47/67 peptides) had an exchange efficiency over 50%, a threshold selected to identify peptides with strong binding affinity (Figure 7E).
We next tested whether these peptides solicited immunogenic responses in HLA-A*02 individuals, using an IFN-γ ELISpot assay. The number of spots or spot forming units (SFU) reflects the number of activated T-cells that recognize and respond to the presented peptides and is a readout of the strength of an immune response. Seven healthy donors from China (CN1–7) and six healthy donors from USA (US1–6) were tested and all had T cell reactivity towards at least one of the peptides with ≥ 5 spot forming units (SFU) (Figure 7E). For instance, CD8+ T cell cultures of donor US1 with HLA-A*02:11 demonstrated strong reactivity against PEP4 from MAGEA1 (CILESLFRAV) and PEP17 from MAGEA10 (MMGLYDGMEHL), whereas donor CN1 with HLA-A*02:01 demonstrated strong reactivity against PEP28 from BRDT (FSYAWPFYNPV) and PEP40 from LEKR1 (YLVERQLQEI) (Figure 7F). In total, 22 peptides from MAGEA1, MAGEA10, MAGEB2, BRDT, and LEKR1 (bold red text in Figure 7E), showed both strong exchange efficiency (> 50%) and strong immunogenicity (SFU > 150), and they are promising candidates for further investigation as immunotherapy targets.
DISCUSSION
Our analysis of harmonized CPTAC proteogenomics data from over 1,000 patients across 10 cancer types provided insights into existing cancer drug targets and expanded the landscape of therapeutic targets. We achieved this by systematically identifying overexpressed or hyperactivated targetable protein dependencies, tumor suppressor gene loss associated protein dependencies, and neoantigens and tumor associated antigens. A key strength of our study is our comprehensive approach to data integration.
The first level of integration harnessed proteomics data, which directly measures the entity being targeted by therapeutics, together with other types of omics data. Like other studies, we found a substantial number of genes, including some druggable ones, exhibiting weak correlation between mRNA and protein levels. This discrepancy has been partially attributed to post-translational regulation through protein-protein interaction or protein complex formation, which can stabilize proteins55,56. In this study, we also identified genes encoding secreted proteins as a group of genes with low mRNA-protein correlation. Beyond protein abundance, our analysis also included protein activity inferred from phosphoproteomics data, identifying additional protein targets that could not be identified from global proteomics alone. Integrating proteomics data with genomics and epigenomics data further revealed druggable proteins whose overexpression in tumors was driven by gene mutation, hypomethylation, and copy number amplification. These proteins are more likely to be drivers of tumor initiation and progression and thus even more attractive for therapeutic targeting. In addition, for LOF genomic aberrations in TSGs, integration of proteomics and phosphoproteomics data provided an attractive strategy to discover proteins, phosphosites, and kinase activities whose suppression may be synthetic lethal.
The second level of integration involves simultaneous utilization of molecular profiling data from tumor specimens and CRISPR-Cas9 screen data from cancer cell lines. One limitation of the human tumor profiling research is that these studies are associative in nature and cannot be used to establish causality. High-throughput data from genetic or pharmacologic perturbations in cell lines, such as those available in DepMap, provides a powerful resource for establishing causal connection, but the relevance to clinical disease is uncertain. By identifying genes important in human cancer tissue and then combining those with phenotypic outcomes from cell line perturbation experiments, we could emphasize the most likely successful targets for further investigation.
The third level of integration leverages pan-cancer data generated by CPTAC. The integration of multiple cancer types in a single study not only strengthens associations found in single cancer cohort studies but also highlights common therapeutic targets that could be relevant for multiple cancer types. Although clinical trials for drugs have historically been tested in a single cancer type, basket trials testing tissue-agnostic molecularly targeted therapeutics are gaining attention following the landmark approvals of larotrectinib and entrectinib for patients with NTRK fusions and pembrolizumab for those with high microsatellite instability57. Our pan-cancer analysis has identified candidate tissue-agnostic protein targets, often overlooked in individual CPTAC studies that focus on the most promising targets within specific cancer types.
We also deployed pipelines to prioritize neoantigens and tumor associated antigens as targets for immunotherapy. Most of the predicted neoepitopes were specific to individual patients, but five KRAS mutant peptides were predicted to yield neoepitopes in 44 patients from four cancer types, suggesting potential utility as a “public” neoantigen. HLA-I presentation of several of our predicted KRAS neoepitopes has been detected in engineered cells using targeted mass spectrometry40. Moreover, a recent clinical study showed that genetically engineered T-cells targeting mutant KRAS G12D driver mutation achieved substantial tumor regression in a patient with refractory metastatic pancreatic cancer46. Our analysis provides additional evidence to support future prospective clinical trials to further investigate the therapeutic potential of this therapy in pancreatic cancer and other cancer types. HLA-I presentation and immunogenicity of other predicted neoepitopes will need to be experimentally validated. Furthermore, we identified 140 proteins with highly restricted expression in GTEx normal tissues but were abnormally expressed in CPTAC tumors. Experimental analysis of peptides predicted to have high binding affinity to the most common allotype HLA-A*02 for seven prioritized proteins identified 22 peptides from five proteins with both strong binding affinity and immunogenicity, including three MAGE family proteins and two less well-studied proteins BRDT and LEKR1. These peptides could be further investigated as broadly applicable immunotherapy targets.
In conclusion, through the integration of six omics data types from 10 cancer types with external cell line and human tissue data, we have created a comprehensive resource of protein and peptide targets that cover various therapeutic modalities. This unique resource will pave the way for repurposing of currently available drugs and developing new therapies for cancer treatment.
LIMITATIONS OF THE STUDY
Our study has several limitations. First, while we evaluated our predicted druggable dependencies using drug response data, factors like drug efficacy and response measurement inaccuracies might have affected our assessment. Second, our prioritization focused on targets of small molecule drugs and membrane proteins, leaving out many predicted protein dependencies. This highlights the need for innovative therapies to target traditionally “undruggable” proteins. Third, our analysis was conducted in a pan-cancer context, future studies could adapt and apply the integrative proteogenomic approaches developed here to specific cancer types or subtypes.
STAR METHODS
RESOURCE AVAILABILITY
Lead contact
Further information and requests for resources and reagents should be directed to and will be fulfilled by the lead author, Bing Zhang (bing.zhang@bcm.edu).
Materials availability
This study did not generate new unique reagents.
Data and code availability
Raw proteomics data files are hosted by the CPTAC Data Portal and can be accessed at: https://proteomics.cancer.gov/data-portal and can also be accessed at the Proteomic Data Commons: https://pdc.cancer.gov. Genomic and transcriptomic data files can be accessed via the Genomic Data Commons (GDC) Data Portal: https://portal.gdc.cancer.gov. Processed data utilized for this publication can be accessed via LinkedOmicsKB (Release 1): https://kb.linkedomics.org. Results from this study can be accessed through a web portal at https://targets.linkedomics.org.
EXPERIMENTAL MODELS AND SUBJECT DETAILS
Cancer cell lines
The 769P cells were donated by the Dingwei Ye lab (Department of Urology, Fudan University Shanghai Cancer Center, Shanghai, China), SW1990 cell line was a gift from the Xianjun Yu lab (Department of Pancreatic Surgery, Fudan University Shanghai Cancer Center, Shanghai, China), CAL27 cells were obtained from the Wantao Chen lab (Department of Oral Maxillofacial-Head Neck Oncology, Shanghai Ninth People’s Hospital, Shanghai Jiao Tong University School of Medicine, Shanghai, China), A2780 cells were obtained from the Tingyan Shi Lab (Department of Obstetrics and Gynecology, Zhongshan Hospital, Fudan University, Shanghai, China). NCI-H2170 and NCI-H1944 cells were donated by the Yongbo Wang lab (Department of Cellular and Genetic Medicine, School of Basic Medical Sciences, Fudan University, Shanghai, China). The HT29 cells were donated by the Dawei Li lab (Department of Colorectal Surgery, Fudan University Shanghai Cancer Center, Shanghai, China). The Ishikawa cells were obtained from QuiCell (QuiCell-I409, QuiCell Biotechnology Co., Ltd, Shanghai, China). The LOVO cells were donated by Dr. Daming Gao (Shanghai Institute of Biochemistry and Cell Biology). The BXPC3 cells were obtained from the Yi Qin Lab (Department of Pancreatic Surgery, Fudan University Shanghai Cancer Center, Shanghai, China). CAL27, HT29, Ishikawa, SW1990, and LOVO cells were cultured at 37°C, 5% CO2, in DMEM medium supplemented with 10% FBS, and penicillin-streptomycin. A2780, NCI-H2170, NCI-H1944, 769P, and BXPC3 cells were maintained at 37°C, 5% CO2, in RPMI1640 with 10% FBS and penicillin-streptomycin.
Lentiviral production and stable cell line generation
Lentiviruses were produced in accordance with previously established methods58. To summarize, the RNAi Consortium from the Broad Institute was queried for shRNA sequences (https://portals.broadinstitute.org/gpp/public/). shRNA sequences are provided in Table S5B. The packaging of lentivirus utilized a three-plasmid system including shRNAs generated with PLKO.1 vector with transfection facilitated by Lipofectamine 3000 (Thermo). Cells were infected with the virus in the presence of 10 μg/mL polybrene to increase transduction efficiency. Stable cell lines were subsequently selected using 10 μg/mL puromycin for a duration of 48 hours.
Western blot
Cell lysates were prepared with RIPA buffer (Beyotime). 20 μg proteins were loaded onto 4%−12% FuturePAGE gels (ACE) in MOPS-SDS running buffer and then transferred to 0.22 μm pre-balanced polyvinylidene difluoride (PVDF) membrane (Millipore). Following the transferring step, the membrane was blocked with 5% nonfat milk in TBST at room temperature for an hour. The membrane was then incubated with the primary antibody, which was diluted in 5% BSA, and left overnight at 4°C. Subsequent to the washing steps, the membrane was treated with the secondary antibody at room temperature for an hour. After four-five additional washing steps, the protein was detected using enhanced chemiluminescence reagent (ECL, Amersham Corporation, Heights, IL, USA). The specific antibodies utilized in this study are as follows: Rabbit anti-integrin beta 5 (Proteintech), rabbit anti-CAD (clone D2T8H) (Cell Signaling), rabbit anti-PAK2 (Cell Signaling), and mouse anti-GAPDH-HRP (Yeasen).
Cell proliferation and viability assays
We utilized the CCK-8 reagent (Yeasen, Beijing, China) for both proliferation and drug response viability assays after seeding cells in 96-well plates at 1–5×10³ cells/well. For proliferation, cell numbers were quantified daily for four days. For viability under drug exposure, 24 hours post-seeding, cells were treated with graded doses of alvespimycin, tanespimycin (both from Selleckchem), or a DMSO control, and incubated for 48 hours. At least three independent experiments were performed. IC50 values were calculated via log-logistic regression (two, three, or four-parameter), with the best fit model selected through manual inspection of the curve using the ‘drc’ package (v3.0–1) in R59.
In vivo animal studies
We obtained 4–6 week old female BALB/c nude mice from Shanghai Model Organisms Center. Our study strictly followed animal care principles and ethical guidelines, receiving approval from the Institutional Animal Care and Use Committee at the Shanghai Model Organisms Center (approval numbers 2023–0034 and 2023–0065). To evaluate the therapeutic efficacy of the drug in vivo, we injected HT29 colon cancer cells (5×10⁶ cells in 100 μL PBS) subcutaneously into the dorsal flank of the nude mice. The mice were randomly assigned to treatment with either vehicle control (2% DMSO in PBS) or alvespimycin (50 mg/kg, administered intraperitoneally daily) (N = 9 mice per group) on day 0. The mice were sacrificed 7 days after treatment initiation.To measure the tumor growth of HT29, LOVO colon cancer cells, and BXPC3 pancreatic cancer cells in vivo, control and corresponding target-knockdown cells in the logarithmic growth phase were resuspended in PBS (8×10⁶-1×10⁷ cells in 150 μL) and injected subcutaneously into nude mice (N = 4–6 mice per group).Tumor sizes were measured using a digital caliper every 1–3 days, and tumor volumes were calculated using the formula: volume = (width)2 × length × 0.52.
PBMC isolation and DC differentiation and maturation, Baylor College of Medicine (BCM)
Peripheral blood was collected from healthy volunteers as per Baylor College of Medicine IRB protocols. Peripheral blood mononuclear cells (PBMCs) were isolated from peripheral blood by density gradient centrifugation with Lymphoprep (StemCell Technologies, #07801). Fresh PBMCs were then separated into CD14+ and CD14- fractions through magnetic bead selection with CD14 microbeads (Miltenyi Biotec, 130–050-201). The CD14- fraction of cells was cryopreserved for later use. To differentiate the CD14+ monocytes into DCs, the cells were suspended at 0.5 × 10⁶ cells/mL in CellGenix GMP DC media (CellGenix, # 20801–0500) supplemented with IL-4 (400 U/mL) and GM-CSF (800 U/mL) and cultured at 1 mL per well of a 24-well tissue culture treated plate. Cytokines were replenished after 3 days. After 5–7 days, immature DCs were harvested by gentle cell scraping. Fresh or frozen immature DCs were then matured by suspending cells at 0.35 – 0.7 × 10⁶ cells/mL CellGenix GMP DC media supplemented with IL-4 (400 U/mL), GM-CSF (800 U/mL), TNF-α (10 ng/mL), IL-6 (100 ng/mL), IL-1β (10 ng/mL), and PGE-2 (1 μg/mL), and cultured at 2 mL per well of a 12-well tissue culture treated plate for 2 days, after which mature DCs were harvested by gentle cell scraping.
Generation of BR-CGA specific T cells, BCM
Fresh matured DCs were suspended in 100 μL of CellGenix GMP DC media containing 25 ng/mL pepmix, comprised of 76 HLA-A*02:01 predicted peptides derived from nine cancer antigens including MAGE-A1 and MAGE-A10, incubated at 37°C and 5% CO2 for 1 hr, and were washed once with CellGenix GMP DC media. Pepmix loaded DCs and thawed CD14- PBMCs were cocultured by plating 0.2 × 10⁶ and 2 × 10⁶ cells per well of a 24-well tissue culture treated plate, respectively, in a volume of 2 mL per well of CTL media (1:1 CLICKs:RPMI-1640, 5% Human Ab Serum, 1X Glutamax) supplemented with IL-7 (10 ng/mL), IL-12 (10 ng/mL), IL-15 (5 ng/mL) and IL-6 (100 ng/mL). After 6 days T cells were split 1:2 and each well was replenished with 1 mL of fresh CTL media with 2X concentration cytokine to restore the day 0 concentrations. On day 8 – 10 the T cells were harvested, and pepmix loaded matured DCs were used to restimulate the expanding T cells by culturing each at 0.1 × 10⁶ and 1 × 10⁶ cells per well of a 24-well tissue culture treated plate, respectively, in a volume of 2 mL per well of CTL media supplemented with IL-7 (10 ng/mL) and IL-15 (5 ng/mL). On day 3–4 following restimulation, T cells were split 1:2 and wells were replenished with 1 mL of fresh CTL media supplemented with IL-15 and IL-2 for a final concentration of 5 ng/mL and 100 U/mL, respectively, and T cells were further expanded until day 6–10 following restimulation.
IFN-γ ELISpot assay, BCM
To coat ELISpot plates (Millipore, #MSIPS4W10) with primary anti-IFN-γ antibody (Mabtech, clone D1K), we pretreated wells with 40 μL of 35% ethanol for less than 3 minutes, and then washed wells 2x with PBS and added 100 μL/well of sterile filtered 9.1 μg/mL primary anti-IFN-γ antibody in ELISpot coating buffer. Plates were then wrapped in parafilm and incubated at 4°C at least overnight and for up to two weeks. To block the plates, wells were washed 2x with PBS, and we then added 100 μL per mL of CTL media. Plates were blocked at 37°C for at least 1 hr. Blocked plates were washed 2x with PBS, after which each well received 2 × 10⁵ T cells in 200 μL CTL media with addition of peptides at a final concentration of 12.5 μg/mL. A negative control consisted of T cells in media alone, and a positive control consisted of T cells in the presence of 2.5 μg/mL PHA-L (Sigma, L4144). Cells were incubated for about 16 hrs, after which wells were washed 6x with PBS+0.05% Tween 20. We then added 100 μL/well of sterile filtered 1 μg/mL biotinylated secondary anti-IFN-γ antibody (Mabtech, clone 7-B61) in PBS/0.5% BSA and incubated at 37°C for at least 2 hrs and up to 48 hrs. Plates were then washed 6x with PBS+0.05% Tween 20 after which we added 100 μL/well of avidin-peroxidase solution (Vector Laboratories, #PK-6100) and incubated at room temperature for 1 hr. We then washed the plates 3x with PBS+0.05% Tween 20 and then 3x with PBS. AEC substrate solution was prepared by dissolving one tablet of AEC (Sigma, # A6926) in 2.5 mL Dimethylformanide, and then adding 47.5 mL acetate buffer. Just prior to use, 5 μL of 30% hydrogen peroxide was added per 10 mL AEC solution, and the solution was then filtered through a 0.45 μM PES membrane. 100 μL/well of AEC substrate solution was added per well and incubated at room temperature for 3 min and 30 seconds, after which plates were gently rinsed 2x with cold tap water and dried. Plate images were acquired on the Mabtech Iris ELISpot plate reader.
PBMC isolation, T-cell culture and expansion, Fudan University
Donors’ peripheral blood mononuclear cells (PBMCs) were obtained using Lymphoprep (07851, Stemcell) and then cultured with ImmunoCult-XF T Cell Expansion Medium (10981, Stemcell) and 10 ng/mL human recombinant IL-2 (78036, Stemcell) as described in60. 25 μL/mL ImmunoCult™ Human CD3/CD28 T Cell Activator (10971, Stemcell) was added to the cell suspension and incubated for 3 days. T cells were maintained in the above medium until their numbers met the experimental requirements. The Institutional Review Board of Zhongshan Hospital, Fudan University, granted approval for the entire process (B2021–381).
IFN-γ ELISpot assay, Fudan University
The ELISpot plate was processed according to the manufacturer’s instructions. In brief, ELISpot plates (2110003, DAKEWE) were pretreated with 100 μL/well of RPMI-1640 for 10 min. Then, we removed the RPMI-1640 and dispensed 100 μL cell suspension containing approximately 1×10⁵ cells with 10 μg/mL of the synthesized peptide in each well and covered the plate with a standard 96-well plate plastic lid and incubated cells at 37°C in a CO2 incubator. After 20h of co-culture, the ELISpot plates were washed with washing buffer and incubated with anti-human IFN-γ and then Streptavidin-HRP. Then the Streptavidin-HRP was stained using AEC solution, the reaction was stopped by rinsing thoroughly with cold tap water. Finally, ELISpot plates were scanned and counted using an ImmunoSpot plate reader and associated software (CellularTechnologies, Ltd.).
Peptide-MHC tetramer exchange assays, Fudan University
All the pan-cancer shared tumor associated antigen peptides were synthesized according to standard procedure (GenScript Biotech Corporation) and a peptide-MHC tetramer assay was performed to estimate the affinity between peptide and HLA sites as previously described61. Peptides were loaded at 100 μg/mL onto QuickSwitch Quant HLA-A*02:01 tetramers (PE labeled) (TB-7300-K1, MBL International). We used the HLA-A*02:01 tetramer kits to validate peptide exchange efficiency of all the potential tumor associated antigen peptides and generate the peptide-specific tetramers by peptide exchange experiments. Each peptide was dissolved in DMSO to a 10 mM solution to be assayed. Then, we pipetted 50 μL of HLA-A*02:01 tetramer into each well of a U-bottom 96 well microtiter plate, added 1 μL of Peptide Exchange Factor plus 1 μL of peptide and mixed gently with pipetting. We performed these steps for each peptide, including the Reference Peptide, and incubated the mixture overnight at room temperature in the dark. The next day, Magnetic Capture Beads were added to conjugate with the above tetramers according to manufacturer’s instructions, where a FITC-labeled antibody was applied to the reaction that recognizes the Exiting Peptide. By measuring the percentage of original peptide replaced by a competing peptide through flow cytometry, we evaluate the exchange efficiency and determine whether the resulting tetramer is suitable for following staining.
METHOD DETAILS
Data acquisition
CPTAC data were acquired and processed as described in Li et al5. Briefly, data were downloaded from the Genomics Data Commons (GDC) and the Proteomics Data Commons (PDC). Data for individual cohorts were processed separately using common computational pipelines and the same genome assembly and gene annotation (GENCODE V34 basic (CHR))62. All omics data were mapped to the same set of primary protein isoforms. RNA and proteomics data were harmonized across cohorts by normalizing to a common value. For RNA data, the upper quantiles of coding genes were normalized to 1500 for cross cancer type normalization. Gene and phosphosite intensities quantified based on global and phosphoproteomics data were normalized across cancer types by median centering of the medians of reference intensities of each cancer type. Probe-level methylation beta values for CpG islands 1kb upstream of the transcription start site and the 5’ UTR were averaged for each coding gene. The data tables used in this study were downloaded from LinkedOmicsKB (https://kb.linkedomics.org/ )6.
Drug targets
Drugs and targets were downloaded from DrugBank version 5.1.97 and Guide to Pharmacology version 2022.28. Drugs annotated as “withdrawn” in DrugBank were excluded. We selected only the primary human targets of each drug with a known action. Targets annotated with a mechanism of inducer, activator, agonist, partial agonist, biased agonist, or positive allosteric modulator were excluded. Drugs were separated into those approved by a regulatory agency and then all others. Targets of approved drugs were assigned to Tier 1 using the DrugBank class level 4 annotation of “antineoplastic and immunomodulating agents.” The targets of all other approved drugs were assigned to Tier 2. Drug labels were used to manually assign the targets of approved drugs without a DrugBank class annotation. All targets of experimental drugs were assigned to Tier 3. If targets could be assigned to multiple tiers, their final classification was selected as the highest tier (1>2>3).
Potentially druggable genes
Potentially druggable genes were downloaded from the Drug Gene Interaction Database version 2022-Feb9. Genes annotated as “Druggable Genome” with evidence from all three sources63–65 were retained as potentially druggable genes by small molecules and assigned to Tier 4 if they were not already assigned to Tiers 1–3.
Membrane proteins
Cell surface proteins were acquired from the in silico surfaceome11 (Table S2D). Proteins with the label ‘pos. trainingset’ were selected and assigned to Tier 5 if not already assigned to Tiers 1–4. These proteins were present in at least two of three datasets: the Cell Surface Protein Atlas (high confidence), Uniprot “cell membrane” keyword, and high-confidence plasma membrane proteins in the COMPARTMENTS database11.
Gene annotation
Functional family annotation was downloaded from Pharos on August 5, 202266. oGPCR was classified as “other”. Predicted secreted proteins (human secretome) were downloaded from the Human Protein Atlas13.
mRNA and protein rank abundance correlation
For genes quantified in at least 50% of the tumor mRNA and tumor protein data within a cohort, the median expression value was calculated. The median expression across the cohorts was then calculated. Loess smoothing was performed on the median mRNA abundance vs the median protein abundance for each gene. The minimum point on the curve corresponded to a log2 RSEM of 6, which was selected as the point of comparison between low mRNA abundance and higher RNA abundance. The median values for mRNA abundance and protein abundance were compared using Spearman’s correlation.
PepQuery validation of protein identification
Genes with a cross-cohort median tumor RNA log2 RSEM expression < 6 were selected for validation of identification. Genes were also limited to those identified in at least 3 cohorts to focus on pan-cancer related targets. For each gene, the validation was performed using the PepQuery algorithm67 by querying the gene against the cohort in which the largest number of peptides were identified for this gene through PepQuery212. If a gene failed PepQuery2 validation in that cohort, the gene was also validated in all other cohorts in which the gene was also identified. The input for the validation for each gene was a list of peptides identified by FragPipe used in the present study. The protein reference database used in the validation was the GENCODE V34 basic protein database.
Gene-wise mRNA protein correlation
For each cancer cohort, genes with both tumor RNA and tumor protein quantification in at least 50% of the patients were selected. The mRNA expression and protein abundance values for each gene were correlated using Spearman’s correlation and p values were adjusted using the Benjamini-Hochberg method.
Pan-cancer mRNA and protein co-expression for CDK9 and HDAC3
For each cancer cohort, CDK9 and HDAC3 mRNA expression were correlated with the mRNA expression for all other genes using Spearman’s correlation. Similarly, CDK9 and HDAC3 protein abundance were correlated with the protein abundance for all other genes using Spearman’s correlation. At least 10 paired values were required for each gene. Meta p values across the 10 cohorts were calculated using the sumz method in the R package metap (V1.4)68. Individual p values were converted to one-sided p values and the sign for p values not consistent with the majority were reversed. The meta p value was converted back to two-sided and the major sign (direction of >50% of the correlations) was added. If the number of positive and negative correlation values were equal, then the positive sign was selected.
GSEA for CDK9 coexpression
The absolute meta p values calculated in ‘pan-cancer mRNA and protein co-expression’ were -log10 transformed and the major sign was added. The ranked lists were submitted to WebGestalt69 for GSEA of the Gene Ontology Biological Process terms (redundancy removed). Default parameters were selected except for the significance level filter of FDR < 0.05.
Activating phosphorylation sites
To identify activating sites on all proteins, regulatory phosphorylation sites downloaded from PhosphoSitePlus (Regulatory sites database from https://www.phosphosite.org/staticDownloads) were filtered for ORGANISM = “human” and ON_FUNCTION = “induced”. For activating sites specifically on kinases, regulatory sites were further filtered to focus on kinases (GENE) with induced enzymatic activity (ON_FUNCTION = “enzymatic activity, induced”), and manually curated activating sites from the literature were added to this list. The list for activating sites on kinases was updated with the latest information downloaded from PhosphoSitePlus in March of 2022.
Differential expression analysis for tumor vs normal
Tumor samples and normal samples derived from 8 cancer types (CCRCC, COAD, HNSCC, LSCC, LUAD, OV, PDAC, and UCEC) for both proteomics and phosphoproteomics were used for differential expression analysis. In order to get highly confident protein/activating phosphosite candidates, we only kept those proteins and activating phosphosites detected in at least 20 tumor samples and 10 normal samples. Unpaired Wilcoxon rank sum test was used for differential expression analysis. For those proteins/phosphosites with unpaired Wilcoxon rank sum test adjusted p-value lower than or equal to 1% were further classified into up-regulated proteins/phosphosites and down-regulated proteins/phosphosites defined by the unpaired Wilcoxon rank sum test direction.
Matching cancer cell lineages to cancer types
To match cancer cells to tumor cancer types, the following filters were applied to the DepMap cell line annotation file (sample_info.csv): BRCA: primary_disease = “Breast Cancer” and lineage = “breast”; CCRCC: primary_disease = “Kidney Cancer” and lineage = “kidney”; COAD: primary_disease = “Colon/Colorectal Cancer” and lineage = “colorectal”; GBM: primary_disease = “Brain Cancer” and lineage = “central_nervous_system”; HNSCC: primary_disease = “Head and Neck Cancer” and lineage = “upper_aerodigestive”; LSCC: primary_disease = “Lung Cancer”, lineage = “lung”, lineage_sub_subtype = “NSCLC_squamous”; LUAD: primary_disease = “Lung Cancer”, lineage = “lung”, lineage_sub_subtype = “NSCLC_adenocarcinoma”, OV: primary_disease = “Ovarian Cancer”, lineage = “ovary”; PDAC: primary_disease = “Pancreatic Cancer”, lineage = “pancreas”; UCEC: primary_disease = “Endometrial/Uterine Cancer”, lineage = “uterus”.
CRISPR gene effect score analysis for upregulated proteins and phosphosites
Gene effect scores derived from CRISPR knockout screens published by Broad’s Achilles and Sanger’s SCORE projects of the 8 cancer types (CCRCC, COAD, HNSCC, LSCC, LUAD, OV, PDAC, and UCEC) were downloaded from DepMap Public 22Q2 (CRISPR_gene_effect.csv)18. For each cancer cell lineage, a one-sample, one-tailed T test was used to identify protein/phosphosite candidates associated with significantly reduced cell growth following gene knockout. For those significantly increased proteins/phosphosites in tumor vs normal samples, signed adjusted p-value of gene effect score below zero lower than or equal to 1% were defined as therapeutic target candidates.
Annotation of pan-essential genes
A list of pan-cancer essential genes in cell lines was downloaded from DepMap Public 21Q4 (CRISPR_common_essentials.csv). These genes are predicted to be common essential genes by using the 90th-percentile method70 or the Adaptive Daisy Model (ADaM)71.
Protein expression driven by mutation
In each cohort, genes mutated in at least 10 samples were selected. To compare RNA and protein abundance between WT and mutated samples, at least 5 samples each had to have non-missing and non-zero values in that cohort. Expression levels were compared using Student’s t-test.
Protein expression driven by hypomethylation
In each cohort, hypomethylated genes were identified by comparing methylation values between tumor samples (at least 20 samples were required to have data) and normal samples (at least 10 samples were required to have data) using the Wilcoxon Rank Sum test. Genes were required to have a p value < 0.01 and the median methylation values of the tumor samples had to be less than the median methylation values for the normal samples. Tumor methylation values, RNA expression values, and protein abundance values were correlated using Spearman’s correlation for genes with non-missing values in at least 50% of the samples.
Protein expression driven by CNV
In each cohort, genes in focally amplified regions were determined using GISTIC272 and a CNV threshold of +/−0.3. Genes in these regions with a positive q value < 0.01 were considered amplified. The CNV, RNA, and protein levels of each gene were correlated using Spearman’s correlation for genes with non-missing values in at least 50% of the samples. Genes that had a significantly positive correlation (Benjamini-Hochberg corrected p value < 0.01) for both CNV to RNA and CNV to protein were considered CNV drivers.
TP53 mutation effect on protein abundance
In each cohort, samples were separated into those with TP53 mutations and those without. The log2 MS1 intensity protein abundance for each mutated sample was compared to the median log2 MS1 intensity protein abundance of the samples without TP53 mutations in the same cohort. The TP53 protein sequence and domains were created using the ragp73 and protr74 R packages.
Kinase hyperactivation and single sample score calculation
We used Kinase-Substrate Enrichment Analysis (KSEA)75 to identify kinases hyperactivated in tumors compared to normal samples. KSEA analysis was performed for each cancer type separately using the kinases and substrates annotated in PTMsigDB v1.976. Phosphosites were represented as fifteenmers (+/−7 amino acids surrounding the phosphosite) and ranked according to the log2 fold change (median tumor - median normal) in each cohort. At least 10 quantified sites were required for each kinase and p values were calculated from the z scores in R. Kinases with a positive KSEA z score and a Benjamini-Hochberg adjusted p value < 0.01 were considered hyperactivated in tumors.
For calculation of single sample scores for Figures 5 and S5, phosphosites were median-centered across a cohort, and KSEA scores were calculated for each individual sample using the kinase targets included in PTMsigDB v1.9. For this analysis, we required phosphosites to have at least 30 measurements in any given dataset and measurements for at least five kinase substrates in a given sample. KSEA normalized scores were calculated using R, implemented as described previously77.
Evaluation of predicted effective targets by target tiers
We performed an analysis by tier to examine the quality and reliability of predicted druggable dependencies. These predicted effective drug targets were defined by significant overexpression using proteomics data or significant hyperactivation using phosphoproteomics data in tumor tissues by cancer type and also by significant dependency by CRISPR KO DepMap data in matched cancer cell line lineages (Figure 2A and Figure 3A). Drug targets were collapsed to the protein/gene level and the number of identified effective targets per tier in each cancer type was divided by the number of total quantified corresponding tier targets by proteomics, phosphoproteomics, and CRISPR data. This resulting value represents the proportion of predicted druggable targets among all quantified targetable genes by tier (Figure 4A). Wilcoxon signed rank test was used to test the differences among median proportions of Tier 1 targets to other Tiers.
Evaluation of predicted effective targets using PRISM data
Broad’s Profiling Relative Inhibition Simultaneously in Mixtures primary screen (PRISM Repurposing 19Q4 Primary Files) high-throughput drug response data on the growth-inhibitory activity of 4,518 drugs in 578 human cancer cell lines using a molecular barcoding method22 were downloaded from DepMap. The primary screen profiled cell viability after 5 days of 2.5 μM drug treatment. Responses to drugs were evaluated that matched our curated set of drugs and whose accompanying targets we derived from the “Drug targets” method section above were also quantified by proteomics and phosphoproteomics in tumor and normal tissues and also measured by CRISPR KO screens in cell lines from DepMap. Responses to each drug were evaluated separately for cancer cell lines grouped by lineages matching those cancer types for which there was tumor and normal molecular data (CCRCC, COAD, HNSCC, LSCC, LUAD, OV, PDAC, UCEC) resulting in eight drug-cancer type pairs per drug. Cells for a given drug-cancer type pair were considered to be sensitive to drug treatment if the average log2 fold change of viability of all cells for a specific lineage after treatment compared to vehicle control was below −0.3 (one-sample T test, μ = −0.3), a cut off defined as effective drug killing in the PRISM manuscript22. For instances where multiple salts of the same drug were tested, we kept the drug salt that was most effective in drug-cancer type pairs, or randomly selected a drug salt in case of a tie. For each unique drug in each of the 8 cancer types, we predicted a cancer type to have an effective target for a drug if at least one of the drug’s targets was upregulated in tumor vs normal using proteomics or phosphoproteomics data alone, was a dependency in matched cancer cell line lineages in CRISPR KO data alone, or both. A proportion z-test was conducted to test if our effective drug target predictions could improve the identification of successful responses of drug-cancer type pairs in PRISM.
Annotation of tumor suppressor genes
Tumor suppressor genes were collected from three sources: (1) The Cancer Gene Census39(downloaded December 9, 2021): Filtered for only Tier 1 genes. (2) Bailey et al, 201878: Filtered for genes from Table S178 with high confidence oncogene and tumor suppressor gene calls from 20/20+. (3) Tokheim et al, 201679: Filtered where all three tools (20/20+, TUSON, and MutsigCV) supported each gene to be an oncogene or tumor suppressor gene.
Genomic alteration of tumor suppressor genes in CPTAC and TCGA
Mutation and copy number data for CPTAC samples were acquired as described in ‘Data acquisition’ and for TCGA PanCan samples were downloaded from cBioPortal80,81. Frequency of loss-of-function mutations (frameshift and nonsense mutations) and deep deletions (GISTIC thresholded score = −2) in samples were computed for each tumor suppressor gene from the tumor suppressor gene list described above by cancer type and cohort. The top tumor suppressor genes whose average alteration frequency across all cancer types and cohorts > 3% was used for unsupervised hierarchical clustering.
Impact of genomic loss on mRNA and protein levels
For each CPTAC cancer cohort, mRNA expression and protein abundance of tumor suppressor gene levels were compared in samples with genomic loss of the tumor suppressor gene (frameshift/nonsense mutation, deep deletion) vs rest by Wilcoxon rank sum test.
Cell line data
The following DepMap cell line data (https://depmap.org/portal/) was used: Mutation (CCLE_mutations.csv), copy number (CCLE_segment_cn.csv), global TMT proteomics82, CRISPR KO dependency data from combined Broad and Sanger studies (CRISPR_gene_effect.csv)18, Sanger’s Genomics of Drug Sensitivity in Cancer (GDSC) drug response data83 and Broad’s Profiling Relative Inhibition Simultaneously in Mixtures (PRISM Repurposing 19Q4 Primary Files) drug response data22. Copy number segment data was processed using GISTIC2 with GENCODE V34 basic reference database and same parameters used for the harmonized CPTAC data: (-genegistic 1 -smallmem 0 -rx 0 -broad 1 -brlen 0.7 -conf 0.99 -armpeel 1 -savegene 1 -v 30 -maxseg 46000 -ta 0.3 -td 0.3 -cap 1.5 -js 4). GISTIC thresholded values of −2 for genes were considered as harboring a deep deletion for that gene.
Protein/phosphosite/kinase activity dependencies for TSG
Paired relationships between genomic loss of tumor suppressor genes with protein abundance, phosphosite abundance, and inferred kinase activity scores were first examined in tumors. For each cancer type, Wilcoxon rank sum test was used to compare protein/phosphosite/kinase activity scores in samples with genomic loss of tumor suppressor gene loss vs rest. Signed -log10 p-values > 0 were used for plotting with values > 0 indicating upregulation of protein/phosphosite/kinase activity in samples with genomic loss of the tumor suppressor gene. Each pair was also evaluated using CRISPR-Cas9 screen data from DepMap in matched cancer lineages to test if cell lines that harbor tumor suppressor gene loss (frameshift/nonsense mutation, deep deletion) were more dependent on the host protein gene vs lines without those aberrations by Wilcoxon rank sum test. Signed -log10 values < 0 were used for plotting with values < 0 indicating greater loss in fitness when host gene is KO by CRISPR in cells with tumor suppressor gene loss.
Drug response analysis in cell lines
Area under the curve (AUC) responses (lower values indicate higher drug sensitivity) for doxorubicin (GDSC1 dataset) and mitoxantrone (PRISM dataset) from DepMap was compared in UCEC cell lines with genomic loss of TP53 vs those without using Wilcoxon rank sum test.
Neoantigen prediction
Neoantigen analysis was performed using an improved version of NeoFlow37. Specifically, Optitype84 was used to find human leukocyte antigens (HLA) in the DNA-Seq data. Then we used netMHCpan 4.085 to predict HLA peptide binding affinity for somatic mutation-derived variant peptides with a length between 8–11 amino acids. The IC50 binding affinity cutoff was set to 500 nM. HLA peptides with binding affinity higher than 500 nM were removed. Variant identification was also performed at protein level using MS/MS data. To identify variant peptides, we used a customized protein sequence database approach86. We derived customized protein sequence databases from matched DNA and RNA sequencing data and then performed database searching using the customized databases for individual TMT or iTRAQ experiments. We built a customized database for each TMT or iTRAQ experiment based on mutations identified from whole exome sequencing data and fusions from RNASeq data, downloaded from https://proteomic.datacommons.cancer.gov/pdc/cptac-pancancer. We used Customprodbj (https://github.com/bzhanglab/customprodbj) for customized database construction. MS-GF+ was used for variant peptide identification for all global proteome and phosphorylation data. Results from MS-GF+ were filtered with 1% FDR at the PSM level. Remaining variant peptides were further filtered using PepQuery with the p-value cutoff ≤ 0.01. The spectra of variant peptides were annotated using PDV (https://github.com/wenbostar/PDV)87.
Tumor associated antigen identification
AD test was used for differential expression analysis and only those proteins with adjusted p-value lower than 1% were kept. We downloaded RNA-Seq data from GTEx for all 54 normal tissues and a hierarchical Bayesian mixture model, ZigZag88, was used to infer the gene expression states for each tissue. Expressed proteins were defined as the active probability calculated by ZigZag larger than 0.5 and the remaining proteins were defined as not-expressed proteins. Not-expressed proteins among all the normal tissues except testis were defined as dormant proteins. Dormant proteins were further filtered by HLA-I peptides in non-cancerous samples in caAtlas35 and we manually checked both the RNA-Seq and proteomics expression levels of the remaining dormant proteins. We removed genes with obvious mRNA expression in non-testis tissues or low mRNA or protein expression across 8 cancer types, resulting in a list of 9 tumor-associated antigens. PepQuery was used to reduce the chance of false positives and 7 tumor-associated antigens were identified.
Visualization
The Venn diagram for drug targets was created using InteractiVenn89 and further formatted in Adobe Illustrator. Heatmaps were created using ComplexHeatmap90. Cytoscape version 3.10.091 was used to create the kinase and phosphosite substrate network.
QUANTIFICATION AND STATISTICAL ANALYSIS
Statistical analyses were performed using R unless explained otherwise. Details can be found in Results and figure legends. P-values were adjusted by the Benjamini-Hochberg procedure.
Supplementary Material
Figure S1. mRNA and protein correlation, related to Figure 1. A) Median RNA abundance and median protein abundance for all genes. Drug targets are colored according to tier. Loess smoothing curve is shown and dashed lines indicate the minimum point on the curve. Spearman’s correlation coefficients between mRNA and protein abundance are displayed for all genes and calculated separately for median RNA abundance less than or greater than 6. B) Distributions of gene-wise Spearman’s correlations of mRNA and protein expression for all genes in different cancer cohorts. C) Median gene-wise Spearman’s correlation coefficients for all genes in each cohort, genes in each tier, and genes not in any tier (“Other”). Medians are compared between the tiers and other genes using a paired t-test. D) Spearman’s correlation between CDK9 and CCNT1 protein abundance and mRNA abundance. E) Spearman’s correlation between HDAC3 and GPS2 protein abundance and mRNA abundance. *p<0.05
Figure S2. Effect of TP53 mutations on protein abundance, related to Figure 2. A) TP53 protein abundance in the mutated sample compared to the median WT protein abundance for the same cancer cohort. The x axis indicates the first location within the protein sequence of the mutation. AD=activation domain, TD=tetramerization domain. B) TP53 protein abundance in the mutated sample compared to the median WT protein abundance for the same cancer cohort for each mutation type.
Figure S3. Increased kinase activity in tumors, related to Figure 3. A) Comparison of CCNB1, CCNE1, and DBF4 RNA expression in tumor vs normal samples using the Wilcoxon rank sum test. *p<0.05 B) Spearman’s correlation between CDK1, CDK2, and CDC7 kinase activity scores and the RNA and protein abundance of their corresponding regulatory proteins in tumors. *p<0.05 C) Network of kinases with increased activity in tumors and phosphorylation site substrates with increased abundance. Large colored circles indicate increased kinase activity in the corresponding cancer cohort. Edges connect kinases to phosphorylation site substrates that are increased in tumor samples in at least one cohort and substrates are colored by Tier of the host protein. Gray nodes indicate substrates increased in at least one cohort but without a druggable annotation.
Figure S4. Evaluation and validation of prioritized drug targets, related to Figure 4. A–C) Confusion matrices for assessing prediction performance of drug-cancer type pairs using CRISPR KO data (A), tumor vs normal (TvN) data (B), or the combination (C) to predict effective drug targets in cell lines with actual drug responses observed in the PRISM primary screen. 1 indicates sensitivity in drug-cancer type pairs in PRISM or predicted effective target of a drug for drug-cancer type pairs, 0 otherwise. D-E) Drug response from PRISM and predicted effectiveness for HDAC1 (D) and PARP1/2 (E). F-G) Drug response from PRISM and GDSC, along with predicted effectiveness for PRKCB (F) and MAP2K1/2 (G). H-I) Violin plots comparing target protein abundance in tumor vs normal (top panels, p-values derived from Wilcoxon rank sum test), target dependency scores in cell lines (middle panels, p-values derived from one-sample t-test), and cell line responses to drugs against the target (bottom panels, p-values derived from one-sample t-test) for a Tier 2 target SQLE (H), and a Tier 3 target HSP90AA1 (I). J-K) Experimental validation of PRISM response to a pan-cancer Tier 3 drug target, HSP90AA1, using tanespimycin (J) and alvespimycin (K) after 48h treatment. Plots show mean viability from 3-4 independent experiments ± SEM relative to vehicle control and legends below show mean IC50. L) Plot depicts mean tumor volumes ± sd from HT29 colon cancer cell line xenografts treated with vehicle control or alvespimycin (N = 9 mice group). Tx indicates treatment initiation. P-value derived from T test. M) Plot depicts mean body weight ± sd of HT29 xenograft mice (N = 9 mice per group). N) Western blots showing protein levels for PAK2, CAD, and ITGB5 in control and shRNA knockdown colon cancer (LOVO and HT29) and pancreatic cancer (BXPC3) cell lines.
Figure S5. Tumor suppressor gene associated dependencies, related to Figure 5. A) Workflow of our proteogenomic approach that integrates proteomic data from tumor specimens and genetic screen data from cancer cell lines to identify TSG-associated dependencies. B) Plot showing statistics of tumor suppressor gene-protein pairs from tumor and cell line analyses. The x-axis represents signed -log10 p-value from Wilcoxon rank sum test comparing protein expression in tumors with genomic alteration of the tumor suppressor gene partner vs rest by cancer type. The y-axis represents signed -log10 p-value from Wilcoxon rank sum test comparing CRISPR dependency scores of cell lines with a loss-of-function mutation vs rest in a matched cancer lineage. C) Plot showing statistics of tumor suppressor gene-phosphosite pairs from tumor and cell line analyses. Axes similar to (B) except phosphosite data were used for x-axis calculations. D) Plot showing statistics of tumor suppressor gene-kinase activity pairs from tumor and cell line analyses. Axes similar to (B) except kinase activity data were used for x-axis calculations.
Table S1. Cancer cohorts and sample numbers used in the study, related to Figure 1.
Table S2. Therapeutic targets and their assigned tier, related to Figure 1.
Table S5. Evaluation of prioritized drug targets using PRISM drug response data and shRNA sequences used for stable cell line generation, related to Figure 4.
Table S3. Tumor-overexpressed protein dependencies based on genetic screens and genomic and epigenomic aberrations, related to Figure 2.
Table S6. Tumor suppressor gene associations, related to Figure 5.
Table S4. Phosphosite abundance and kinase activity altered in tumor vs normal samples, related to Figure 3.
Table S8. Putative tumor associated antigens, related to Figure 7.
Table S7. Putative neoantigens, related to Figure 6.
KEY RESOURCES TABLE.
| REAGENT or RESOURCE | SOURCE | IDENTIFIER |
|---|---|---|
| Antibodies | ||
| Rabbit anti-integrin beta 5 | Proteintech | Catalog: 28543-1-AP |
| Rabbit monoclonal anti-CAD (clone D2T8H) | Cell Signaling Technology | Catalog: 93925 |
| Rabbit anti-PAK2 | Cell Signaling Technology | Catalog: 2608 |
| Mouse anti-GAPDH-HRP | Yeasen | Catalog: 30203ES10 |
| IFN-γ (primary) | Mabtech | Clone D1K |
| IFN-γ (biotinylated, secondary) | Mabtech | Clone 7-B61 |
| Goat anti-rabbit IgG (H+L) HRP | Yeasen | Catalog: 33101ES60 |
| Biological samples | ||
| PBMCs isolated from peripheral blood in healthy donors | This paper | Zhongshan Hospital, Fudan University |
| PBMCs isolated from peripheral blood in healthy donors | This paper | Baylor College of Medicine |
| Chemicals, peptides, and recombinant proteins | ||
| Peptides | China Peptides Inc. Genemed Synthesis Inc. | N/A |
| RPMI-1640 media | cytiva | Catalog: SH30096.01 |
| Click’s media | IrvineScientific | Catalog: 9195 |
| Human Ab serum | Valley Biomedical, Inc. | Catalog: HP1022 |
| Glutamax | gibco | Catalog: 35050-061 |
| Lymphoprep | StemCell Technologies | Catalog: 07851 |
| ImmunoCult-XF T cell expansion medium | StemCell Technologies | Catalog: 10981 |
| ImmunoCult Human CD3/CD28 T cell activator | StemCell Technologies | Catalog: 10971 |
| CD14 magnetic microbeads | Miltenyi Biotec | Catalog: 130-050-201 |
| CellGenix GMP DC media | CellGenix | Catalog: 20801-0500 |
| IL-1β | R&D Systems | Catalog: 201-LB-025 |
| IL-2 | NCBI | Teceleukin (Ro 23-6019) |
| IL-4 | R&D Systems | Catalog: 204-IL/CF-MTO |
| IL-6 | R&D Systems | Catalog: 206-IL-050/CF |
| IL-7 | R&D Systems | Catalog: BT-007-01M |
| IL-12 | InvivoGen | Catalog: rcyc-hil12 |
| IL-15 | R&D Systems | Catalog: BT-015-01M |
| GM-CSF | R&D Systems | Catalog: 215-GM/CF-MTO |
| TNF-α | R&D Systems | Catalog: 210TA100 |
| PGE-2 | Sigma | Catalog: P6532-1MG |
| PHA-L | Sigma-Aldrich | Catalog: L4144 |
| Avidin-peroxidase solution | Vector Laboratories | Catalog: PK-6100 |
| AEC | Sigma-Aldrich | Catalog: A6926 |
| Tumor-associated antigens | GenScript Biotech Corporation | |
| ImmunoCult Human CD3/CD28 T Cell Activator | Stemcell | Catalog: 10971 |
| Human recombinant IL-2 | Stemcell | Catalog: 78036 |
| Alvespimycin | Selleckchem | Catalog: S1142 |
| Tanespimycin | Selleckchem | Catalog: S1141 |
| Lipofectamine 3000 | Thermo | Catalog: L3000015 |
| Cell Counting Kit (CCK-8) | Yeasen | Catalog: 40203ES80 |
| Polybrene | Yeasen | Catalog: 40804ES76 |
| Puromycin | Yeasen | 60209ES10 |
| Critical commercial assays | ||
| QuickSwitch Quant HLA-A*02:01 Tetramer Kit-PE | MBL International | Catalog: TB-7300-K1 |
| IFN-g ELISpot kit | DAKEWE | Catalog: 2110003 |
| Deposited data | ||
| CPTAC Pan-Cancer Data | 1,2 | |
| TCGA Pan-Cancer Data | 3,4 | https://www.cbioportal.org |
| GENCODE V34 basic (CHR) | 5 | https://www.gencodegenes.org/human/release_34.html |
| DrugBank version 5.1.9 | 6 | https://go.drugbank.com |
| Guide to Pharmacology version 2022.2 | 7 | https://www.guidetopharmacology.org |
| In silico Surfaceome | 8 | https://wlab.ethz.ch/surfaceome/ |
| Pharos | 9 | https://pharos.nih.gov |
| HPA Secretome (2022-Sep) | 10 | https://proteinatlas.org |
| PhosphoSitePlus | 11 | https://phosphosite.org |
| Drug Gene Interaction Database version 2022-Feb | 12 | https://www.dgidb.org |
| caAtlas | 13 | http://www.zhang-lab.org/caatlas/ |
| Cancer Gene Census | 14 | https://cancer.sanger.ac.uk/cosmic/download |
| Tumor suppressor genes from Bailey et al | 15 | Table S1 |
| Tumor suppressor genes from Tokheim et al | 16 | |
| PTMsigDB v1.9 | 17 | https://github.com/broadinstitute/ssGSEA2.0/tree/master/db/ptmsigdb |
| DepMap: Mutation | DepMap Public 22Q2 (https://depmap.org/portal/download/) | https://depmap.org/portal/download/ |
| DepMap: Segmented copy number | DepMap Public 22Q2 (https://depmap.org/portal/download/) | https://depmap.org/portal/download/ |
| DepMap: Proteomics | 18 | https://depmap.org/portal/download/ |
| DepMap: CRISPR KO screen (combined) | DepMap Public 22Q419 | https://depmap.org/portal/download/ |
| DepMap: GDSC drug screen | Sanger GDSC120 | https://depmap.org/portal/download/ |
| DepMap: PRISM drug screen | PRISM Repurposing 19Q4 Secondary Screen 21 | https://depmap.org/portal/download/ |
| DepMap: Pan-cancer essential genes | DepMap Public 21Q4 | https://depmap.org/portal/download/ |
| Experimental models: Cell lines | ||
| 769P | Dingwei Ye lab (Department of Urology, Fudan University Shanghai Cancer Center) | RRID:CVCL_1050 |
| SW1990 | Xianjun Yu lab (Department of Pancreatic Surgery, Fudan University Shanghai Cancer Center) | RRID:CVCL_1723 |
| CAL27 | Wantao Chen lab (Department of Oral Maxillofacial-Head Neck Oncology, Shanghai Ninth People’s Hospital, Shanghai Jiao Tong University School of Medicine) | RRID:CVCL_1107 |
| A2780 | Tingyan Shi Lab (Department of Obstetrics and Gynecology, Zhongshan Hospital, Fudan University) | RRID:CVCL_0134 |
| NCI-H2170 | Yongbo Wang lab (Department of Cellular and Genetic Medicine, School of Basic Medical Sciences, Fudan University) | RRID:CVCL_1535 |
| NCI-H1944 | Yongbo Wang lab (Department of Cellular and Genetic Medicine, School of Basic Medical Sciences, Fudan University) | RRID:CVCL_1508 |
| HT29 | Dawei Li lab (Department of Colorectal Surgery, Fudan University Shanghai Cancer Center) | RRID:CVCL_0320 |
| Ishikawa | QuiCell Biotechnology | RRID:CVCL_2529 |
| LOVO | Daming Gao lab (Shanghai Institute of Biochemistry and Cell Biology) | RRID:CVCL_0399 |
| BXPC3 | Yi Qin lab (Department of Pancreatic Surgery, Fudan University Shanghai Cancer Center) | RRID:CVCL_0186 |
| Experimental models: Organisms/strains | ||
| BALB/c Nude | Shanghai Model Organisms Center | Catalog: SM-014 |
| Oligonucleotides | ||
| See Table S5B | This study | |
| Software and algorithms | ||
| PepQuery2 | 22 | http://www.pepquery.org |
| metap | 23 | https://cran.r-project.org/web/packages/metap/index.html |
| WebGestalt | 24 | https://www.webgestalt.org |
| GISTIC2.0 | 25 | ftp://ftp.broadinstitute.org/pub/GISTIC2.0/GISTIC_2_0_23.tar.gz |
| ragp | 26 | https://github.com/missuse/ragp |
| protr | 27 | https://cran.r-project.org/web/packages/protr/ |
| NeoFlow | 28 | https://github.com/bzhanglab/neoflow |
| ComplexHeatmap | 29 | https://bioconductor.org/packages/release/bioc/html/ComplexHeatmap.html |
| Optitype | 30 | github.com/FRED-2/OptiType |
| NetMHCpan | 31 | https://services.healthtech.dtu.dk/service.php?NetMHCpan-4.0 |
| customprodbj | 32 | https://github.com/bzhanglab/customprodbj |
| PDV | 33 | https://github.com/wenbostar/PDV |
| InteractiVenn | 34 | http://www.interactivenn.net/ |
| ZigZag | 35 | https://github.com/ammonthompson/zigzag |
| KSEA | 36,37 | https://cran.r-project.org/web/packages/KSEAapp/index.html |
| Cytoscape v3.10.0 | 38 | https://cytoscape.org/ |
| drc v3.0-1 | 39 | https://cran.r-project.org/web/packages/drc |
ACKNOWLEDGMENTS
We gratefully acknowledge contributions from the CPTAC and its Pan-Cancer Analysis Working Group. We thank Dr. Steven A. Carr’s group at the Broad Institute for useful discussions. This work was supported by National Institutes of Health (NIH) grants from the National Cancer Institute (NCI) U24 CA210954, U24 CA271076, R01 CA245903, U01CA271247, and P50 CA058183, by Cancer Prevention & Research Institute of Texas (CPRIT) Awards RR160027 and RR170024, and funding from the McNair Medical Institute at The Robert and Janice McNair Foundation. L.K.S.’ efforts were partially supported by a training grant T32 GM1364554. Q.G.’s efforts were supported by the National Natural Science Foundation of China (81961128025). B.Z. and V.H. are CPRIT Scholars in Cancer Research, and B.Z. is also a McNair Scholar.
Footnotes
DECLARATION OF INTERESTS
V.H. owns stock of Marker Therapeutics and Allovir. B.Z. received consulting fee from AstraZeneca.
REFERENCES
- 1.Hutter C, and Zenklusen JC (2018). The Cancer Genome Atlas: Creating Lasting Value beyond Its Data. Preprint, 10.1016/j.cell.2018.03.042 10.1016/j.cell.2018.03.042. [DOI] [PubMed] [Google Scholar]
- 2.Bashraheel SS, Domling A, and Goda SK (2020). Update on targeted cancer therapies, single or in combination, and their fine tuning for precision medicine. Biomed. Pharmacother. 125, 110009. [DOI] [PubMed] [Google Scholar]
- 3.Mani DR, Krug K, Zhang B, Satpathy S, Clauser KR, Ding L, Ellis M, Gillette MA, and Carr SA (2022). Cancer proteogenomics: current impact and future prospects. Nat. Rev. Cancer 22, 298–313. [DOI] [PMC free article] [PubMed] [Google Scholar]
- 4.Zhang B, Whiteaker JR, Hoofnagle AN, Baird GS, Rodland KD, and Paulovich AG (2019). Clinical potential of mass spectrometry-based proteogenomics. Nat. Rev. Clin. Oncol. 16, 256–268. [DOI] [PMC free article] [PubMed] [Google Scholar]
- 5.Li Y, Dou Y, Da Veiga Leprevost F, Geffen Y, Calinawan AP, Aguet F, Akiyama Y, Anand S, Birger C, Cao S, et al. (2023). Proteogenomic data and resources for pan-cancer analysis. Cancer Cell 41, 1397–1406. [DOI] [PMC free article] [PubMed] [Google Scholar]
- 6.Liao Y, Savage SR, Dou Y, Shi Z, Yi X, Jiang W, Lei JT, and Zhang B (2023). A proteogenomics data-driven knowledge base of human cancer. Cell Syst 14, 777–787.e5. [DOI] [PMC free article] [PubMed] [Google Scholar]
- 7.Wishart DS, Feunang YD, Guo AC, Lo EJ, Marcu A, Grant JR, Sajed T, Johnson D, Li C, Sayeeda Z, et al. (2018). DrugBank 5.0: a major update to the DrugBank database for 2018. Nucleic Acids Res. 46, D1074–D1082. [DOI] [PMC free article] [PubMed] [Google Scholar]
- 8.Harding SD, Armstrong JF, Faccenda E, Southan C, Alexander SPH, Davenport AP, Pawson AJ, Spedding M, Davies JA, and NC-IUPHAR (2022). The IUPHAR/BPS guide to PHARMACOLOGY in 2022: curating pharmacology for COVID-19, malaria and antibacterials. Nucleic Acids Res. 50, D1282–D1294. [DOI] [PMC free article] [PubMed] [Google Scholar]
- 9.Freshour SL, Kiwala S, Cotto KC, Coffman AC, McMichael JF, Song JJ, Griffith M, Griffith OL, and Wagner AH (2021). Integration of the Drug-Gene Interaction Database (DGIdb 4.0) with open crowdsource efforts. Nucleic Acids Res. 49, D1144–D1151. [DOI] [PMC free article] [PubMed] [Google Scholar]
- 10.Bausch-Fluck D, Hofmann A, Bock T, Frei AP, Cerciello F, Jacobs A, Moest H, Omasits U, Gundry RL, Yoon C, et al. (2015). A mass spectrometric-derived cell surface protein atlas. PLoS One 10, e0121314. [DOI] [PMC free article] [PubMed] [Google Scholar]
- 11.Bausch-Fluck D, Goldmann U, Müller S, van Oostrum M, Müller M, Schubert OT, and Wollscheid B (2018). The in silico human surfaceome. Proc. Natl. Acad. Sci. U. S. A. 115, E10988–E10997. [DOI] [PMC free article] [PubMed] [Google Scholar]
- 12.Wen B, and Zhang B (2023). PepQuery2 democratizes public MS proteomics data for rapid peptide searching. Nat. Commun. 14, 2213. [DOI] [PMC free article] [PubMed] [Google Scholar]
- 13.Uhlén M, Fagerberg L, Hallström BM, Lindskog C, Oksvold P, Mardinoglu A, Sivertsson Å, Kampf C, Sjöstedt E, Asplund A, et al. (2015). Proteomics. Tissue-based map of the human proteome. Science 347, 1260419. [DOI] [PubMed] [Google Scholar]
- 14.Huang C, Chen L, Savage SR, Eguez RV, Dou Y, Li Y, da Veiga Leprevost F, Jaehnig EJ, Lei JT, Wen B, et al. (2021). Proteogenomic insights into the biology and treatment of HPV-negative head and neck squamous cell carcinoma. Cancer Cell 39, 361–379.e16. [DOI] [PMC free article] [PubMed] [Google Scholar]
- 15.Zhang B, Wang J, Wang X, Zhu J, Liu Q, Shi Z, Chambers MC, Zimmerman LJ, Shaddox KF, Kim S, et al. (2014). Proteogenomic characterization of human colon and rectal cancer. Nature 513, 382–387. [DOI] [PMC free article] [PubMed] [Google Scholar]
- 16.Egloff S (2021). CDK9 keeps RNA polymerase II on track. Cell. Mol. Life Sci. 78, 5543–5567. [DOI] [PMC free article] [PubMed] [Google Scholar]
- 17.Zhang J, Kalkum M, Chait BT, and Roeder RG (2002). The N-CoR-HDAC3 nuclear receptor corepressor complex inhibits the JNK pathway through the integral subunit GPS2. Mol. Cell 9, 611–623. [DOI] [PubMed] [Google Scholar]
- 18.Pacini C, Dempster JM, Boyle I, Gonçalves E, Najgebauer H, Karakoc E, van der Meer D, Barthorpe A, Lightfoot H, Jaaks P, et al. (2021). Integrated cross-study datasets of genetic dependencies in cancer. Nat. Commun. 12, 1661. [DOI] [PMC free article] [PubMed] [Google Scholar]
- 19.Tokheim C, Wang X, Timms RT, Zhang B, Mena EL, Wang B, Chen C, Ge J, Chu J, Zhang W, et al. (2021). Systematic characterization of mutations altering protein degradation in human cancers. Mol. Cell 81, 1292–1308.e11. [DOI] [PMC free article] [PubMed] [Google Scholar]
- 20.Liu C, Li Y, Semenov M, Han C, Baeg GH, Tan Y, Zhang Z, Lin X, and He X (2002). Control of beta-catenin phosphorylation/degradation by a dual-kinase mechanism. Cell 108, 837–847. [DOI] [PubMed] [Google Scholar]
- 21.Freed-Pastor WA, and Prives C (2012). Mutant p53: one name, many proteins. Genes Dev. 26, 1268–1286. [DOI] [PMC free article] [PubMed] [Google Scholar]
- 22.Corsello SM, Nagari RT, Spangler RD, Rossen J, Kocak M, Bryan JG, Humeidi R, Peck D, Wu X, Tang AA, et al. (2020). Discovering the anti-cancer potential of non-oncology drugs by systematic viability profiling. Nat Cancer 1, 235–248. [DOI] [PMC free article] [PubMed] [Google Scholar]
- 23.Shen Y, Rehman FL, Feng Y, Boshuizen J, Bajrami I, Elliott R, Wang B, Lord CJ, Post LE, and Ashworth A (2013). BMN 673, a novel and highly potent PARP1/2 inhibitor for the treatment of human cancers with DNA repair deficiency. Clin. Cancer Res. 19, 5003–5015. [DOI] [PMC free article] [PubMed] [Google Scholar]
- 24.Huang A, Garraway LA, Ashworth A, and Weber B (2020). Synthetic lethality as an engine for cancer drug target discovery. Nat. Rev. Drug Discov. 19, 23–38. [DOI] [PubMed] [Google Scholar]
- 25.Yeo CQX, Alexander I, Lin Z, Lim S, Aning OA, Kumar R, Sangthongpitag K, Pendharkar V, Ho VHB, and Cheok CF (2016). p53 Maintains Genomic Stability by Preventing Interference between Transcription and Replication. Cell Rep. 15, 132–146. [DOI] [PubMed] [Google Scholar]
- 26.Antoniou-Kourounioti M, Mimmack ML, Porter ACG, and Farr CJ (2019). The Impact of the C-Terminal Region on the Interaction of Topoisomerase II Alpha with Mitotic Chromatin. Int. J. Mol. Sci. 20. 10.3390/ijms20051238. [DOI] [PMC free article] [PubMed] [Google Scholar]
- 27.Nitiss JL (2009). Targeting DNA topoisomerase II in cancer chemotherapy. Nat. Rev. Cancer 9, 338–350. [DOI] [PMC free article] [PubMed] [Google Scholar]
- 28.McMeekin S, Dizon D, Barter J, Scambia G, Manzyuk L, Lisyanskaya A, Oaknin A, Ringuette S, Mukhopadhyay P, Rosenberg J, et al. (2015). Phase III randomized trial of second-line ixabepilone versus paclitaxel or doxorubicin in women with advanced endometrial cancer. Gynecol. Oncol. 138, 18–23. [DOI] [PubMed] [Google Scholar]
- 29.Boadle DJ, and Tattersall MH (1987). Phase II study of mitoxantrone in advanced or metastatic endometrial carcinoma. Aust. N. Z. J. Obstet. Gynaecol. 27, 341–342. [DOI] [PubMed] [Google Scholar]
- 30.Heilman DW, Green MR, and Teodoro JG (2005). The anaphase promoting complex: a critical target for viral proteins and anti-cancer drugs. Cell Cycle 4, 560–563. [PubMed] [Google Scholar]
- 31.Gottifredi V, Karni-Schmidt O, Shieh SS, and Prives C (2001). p53 down-regulates CHK1 through p21 and the retinoblastoma protein. Mol. Cell. Biol. 21, 1066–1076. [DOI] [PMC free article] [PubMed] [Google Scholar]
- 32.Ma CX, Cai S, Li S, Ryan CE, Guo Z, Schaiff WT, Lin L, Hoog J, Goiffon RJ, Prat A, et al. (2012). Targeting Chk1 in p53-deficient triple-negative breast cancer is therapeutically beneficial in human-in-mouse tumor models. J. Clin. Invest. 122, 1541–1552. [DOI] [PMC free article] [PubMed] [Google Scholar]
- 33.Schumacher TN, and Schreiber RD (2015). Neoantigens in cancer immunotherapy. Science 348, 69–74. [DOI] [PubMed] [Google Scholar]
- 34.Wu J, Zhao W, Zhou B, Su Z, Gu X, Zhou Z, and Chen S (2018). TSNAdb: A Database for Tumor-specific Neoantigens from Immunogenomics Data Analysis. Genomics Proteomics Bioinformatics 16, 276–282. [DOI] [PMC free article] [PubMed] [Google Scholar]
- 35.Yi X, Liao Y, Wen B, Li K, Dou Y, Savage SR, and Zhang B (2021). caAtlas: An immunopeptidome atlas of human cancer. iScience 24, 103107. [DOI] [PMC free article] [PubMed] [Google Scholar]
- 36.McGranahan N, and Swanton C (2019). Neoantigen quality, not quantity. Sci. Transl. Med. 11. 10.1126/scitranslmed.aax7918. [DOI] [PubMed] [Google Scholar]
- 37.Wen B, Li K, Zhang Y, and Zhang B (2020). Cancer neoantigen prioritization through sensitive and reliable proteogenomics analysis. Nat. Commun. 11, 1759. [DOI] [PMC free article] [PubMed] [Google Scholar]
- 38.Sette A, Vitiello A, Reherman B, Fowler P, Nayersina R, Kast WM, Melief CJ, Oseroff C, Yuan L, Ruppert J, et al. (1994). The relationship between class I binding affinity and immunogenicity of potential cytotoxic T cell epitopes. J. Immunol. 153, 5586–5592. [PubMed] [Google Scholar]
- 39.Tate JG, Bamford S, Jubb HC, Sondka Z, Beare DM, Bindal N, Boutselakis H, Cole CG, Creatore C, Dawson E, et al. (2019). COSMIC: the Catalogue Of Somatic Mutations In Cancer. Nucleic Acids Res. 47, D941–D947. [DOI] [PMC free article] [PubMed] [Google Scholar]
- 40.Choi J, Goulding SP, Conn BP, McGann CD, Dietze JL, Kohler J, Lenkala D, Boudot A, Rothenberg DA, Turcott PJ, et al. (2021). Systematic discovery and validation of T cell targets directed against oncogenic KRAS mutations. Cell Rep Methods 1, 100084. [DOI] [PMC free article] [PubMed] [Google Scholar]
- 41.Wang QJ, Yu Z, Griffith K, Hanada K-I, Restifo NP, and Yang JC (2016). Identification of T-cell Receptors Targeting KRAS-Mutated Human Tumors. Cancer Immunol Res 4, 204–214. [DOI] [PMC free article] [PubMed] [Google Scholar]
- 42.Rojas LA, Sethna Z, Soares KC, Olcese C, Pang N, Patterson E, Lihm J, Ceglia N, Guasp P, Chu A, et al. (2023). Personalized RNA neoantigen vaccines stimulate T cells in pancreatic cancer. Nature 618, 144–150. [DOI] [PMC free article] [PubMed] [Google Scholar]
- 43.Palmer CD, Rappaport AR, Davis MJ, Hart MG, Scallan CD, Hong S-J, Gitlin L, Kraemer LD, Kounlavouth S, Yang A, et al. (2022). Individualized, heterologous chimpanzee adenovirus and self-amplifying mRNA neoantigen vaccine for advanced metastatic solid tumors: phase 1 trial interim results. Nat. Med. 28, 1619–1629. [DOI] [PubMed] [Google Scholar]
- 44.Chen F, Zou Z, Du J, Su S, Shao J, Meng F, Yang J, Xu Q, Ding N, Yang Y, et al. (2019). Neoantigen identification strategies enable personalized immunotherapy in refractory solid tumors. J. Clin. Invest. 129, 2056–2070. [DOI] [PMC free article] [PubMed] [Google Scholar]
- 45.Tran E, Ahmadzadeh M, Lu Y-C, Gros A, Turcotte S, Robbins PF, Gartner JJ, Zheng Z, Li YF, Ray S, et al. (2015). Immunogenicity of somatic mutations in human gastrointestinal cancers. Science 350, 1387–1390. [DOI] [PMC free article] [PubMed] [Google Scholar]
- 46.Leidner R, Sanjuan Silva N, Huang H, Sprott D, Zheng C, Shih Y-P, Leung A, Payne R, Sutcliffe K, Cramer J, et al. (2022). Neoantigen T-Cell Receptor Gene Therapy in Pancreatic Cancer. N. Engl. J. Med. 386, 2112–2119. [DOI] [PMC free article] [PubMed] [Google Scholar]
- 47.Cafri G, Gartner JJ, Zaks T, Hopson K, Levin N, Paria BC, Parkhurst MR, Yossef R, Lowery FJ, Jafferji MS, et al. (2020). mRNA vaccine-induced neoantigen-specific T cell immunity in patients with gastrointestinal cancer. J. Clin. Invest. 130, 5976–5988. [DOI] [PMC free article] [PubMed] [Google Scholar]
- 48.Wedén S, Klemp M, Gladhaug IP, Møller M, Eriksen JA, Gaudernack G, and Buanes T (2011). Long-term follow-up of patients with resected pancreatic cancer following vaccination against mutant K-ras. Int. J. Cancer 128, 1120–1128. [DOI] [PubMed] [Google Scholar]
- 49.Shou J, Mo F, Zhang S, Lu L, Han N, Liu L, Qiu M, Li H, Han W, Ma D, et al. (2022). Combination treatment of radiofrequency ablation and peptide neoantigen vaccination: Promising modality for future cancer immunotherapy. Front. Immunol. 13, 1000681. [DOI] [PMC free article] [PubMed] [Google Scholar]
- 50.Chen Z, Zhang S, Han N, Jiang J, Xu Y, Ma D, Lu L, Guo X, Qiu M, Huang Q, et al. (2021). A Neoantigen-Based Peptide Vaccine for Patients With Advanced Pancreatic Cancer Refractory to Standard Treatment. Front. Immunol. 12, 691605. [DOI] [PMC free article] [PubMed] [Google Scholar]
- 51.Liu C, Shao J, Dong Y, Xu Q, Zou Z, Chen F, Yan J, Liu J, Li S, Liu B, et al. (2021). Advanced HCC Patient Benefit From Neoantigen Reactive T Cells Based Immunotherapy: A Case Report. Front. Immunol. 12, 685126. [DOI] [PMC free article] [PubMed] [Google Scholar]
- 52.Schumacher T, Bunse L, Pusch S, Sahm F, Wiestler B, Quandt J, Menn O, Osswald M, Oezen I, Ott M, et al. (2014). A vaccine targeting mutant IDH1 induces antitumour immunity. Nature 512, 324–327. [DOI] [PubMed] [Google Scholar]
- 53.Kim SP, Vale NR, Zacharakis N, Krishna S, Yu Z, Gasmi B, Gartner JJ, Sindiri S, Malekzadeh P, Deniger DC, et al. (2022). Adoptive Cellular Therapy with Autologous Tumor-Infiltrating Lymphocytes and T-cell Receptor-Engineered T Cells Targeting Common p53 Neoantigens in Human Solid Tumors. Cancer Immunol Res 10, 932–946. [DOI] [PMC free article] [PubMed] [Google Scholar]
- 54.Schultz-Thater E, Piscuoglio S, Iezzi G, Le Magnen C, Zajac P, Carafa V, Terracciano L, Tornillo L, and Spagnoli GC (2011). MAGE-A10 is a nuclear protein frequently expressed in high percentages of tumor cells in lung, skin and urothelial malignancies. Int. J. Cancer 129, 1137–1148. [DOI] [PubMed] [Google Scholar]
- 55.Sousa A, Gonçalves E, Mirauta B, Ochoa D, Stegle O, and Beltrao P (2019). Multi-omics Characterization of Interaction-mediated Control of Human Protein Abundance levels. Mol. Cell. Proteomics 18, S114–S125. [DOI] [PMC free article] [PubMed] [Google Scholar]
- 56.Liu Y, Beyer A, and Aebersold R (2016). On the Dependency of Cellular Protein Levels on mRNA Abundance. Cell 165, 535–550. [DOI] [PubMed] [Google Scholar]
- 57.Seligson ND, Knepper TC, Ragg S, and Walko CM (2021). Developing Drugs for Tissue-Agnostic Indications: A Paradigm Shift in Leveraging Cancer Biology for Precision Medicine. Clin. Pharmacol. Ther. 109, 334–342. [DOI] [PMC free article] [PubMed] [Google Scholar]
- 58.Hu H, Zhu W, Qin J, Chen M, Gong L, Li L, Liu X, Tao Y, Yin H, Zhou H, et al. (2017). Acetylation of PGK1 promotes liver cancer cell proliferation and tumorigenesis. Hepatology 65, 515–528. [DOI] [PubMed] [Google Scholar]
- 59.Ritz C, Baty F, Streibig JC, and Gerhard D (2015). Dose-Response Analysis Using R. PLoS One 10, e0146021. [DOI] [PMC free article] [PubMed] [Google Scholar]
- 60.Lin Y, Peng L, Dong L, Liu D, Ma J, Lin J, Chen X, Lin P, Song G, Zhang M, et al. (2022). Geospatial Immune Heterogeneity Reflects the Diverse Tumor-Immune Interactions in Intrahepatic Cholangiocarcinoma. Cancer Discov. 12, 2350–2371. [DOI] [PubMed] [Google Scholar]
- 61.Dong L, Lu D, Chen R, Lin Y, Zhu H, Zhang Z, Cai S, Cui P, Song G, Rao D, et al. (2022). Proteogenomic characterization identifies clinically relevant subgroups of intrahepatic cholangiocarcinoma. Cancer Cell 40, 70–87.e15. [DOI] [PubMed] [Google Scholar]
- 62.Frankish A, Diekhans M, Ferreira A-M, Johnson R, Jungreis I, Loveland J, Mudge JM, Sisu C, Wright J, Armstrong J, et al. (2019). GENCODE reference annotation for the human and mouse genomes. Nucleic Acids Res. 47, D766–D773. [DOI] [PMC free article] [PubMed] [Google Scholar]
- 63.Russ AP, and Lampel S (2005). The druggable genome: an update. Drug Discov. Today 10, 1607–1610. [DOI] [PubMed] [Google Scholar]
- 64.Hopkins AL, and Groom CR (2002). The druggable genome. Nat. Rev. Drug Discov. 1, 727–730. [DOI] [PubMed] [Google Scholar]
- 65.Finan C, Gaulton A, Kruger FA, Lumbers RT, Shah T, Engmann J, Galver L, Kelley R, Karlsson A, Santos R, et al. (2017). The druggable genome and support for target identification and validation in drug development. Sci. Transl. Med. 9. 10.1126/scitranslmed.aag1166. [DOI] [PMC free article] [PubMed] [Google Scholar]
- 66.Sheils TK, Mathias SL, Kelleher KJ, Siramshetty VB, Nguyen D-T, Bologa CG, Jensen LJ, Vidović D, Koleti A, Schürer SC, et al. (2021). TCRD and Pharos 2021: mining the human proteome for disease biology. Nucleic Acids Res. 49, D1334–D1346. [DOI] [PMC free article] [PubMed] [Google Scholar]
- 67.Wen B, Wang X, and Zhang B (2019). PepQuery enables fast, accurate, and convenient proteomic validation of novel genomic alterations. Genome Res. 29, 485–493. [DOI] [PMC free article] [PubMed] [Google Scholar]
- 68.Dewey M (2022). metap: meta-analysis of significance values. Preprint. [Google Scholar]
- 69.Liao Y, Wang J, Jaehnig EJ, Shi Z, and Zhang B (2019). WebGestalt 2019: gene set analysis toolkit with revamped UIs and APIs. Preprint, 10.1093/nar/gkz401 10.1093/nar/gkz401. [DOI] [PMC free article] [PubMed] [Google Scholar]
- 70.Dempster JM, Pacini C, Pantel S, Behan FM, Green T, Krill-Burger J, Beaver CM, Younger ST, Zhivich V, Najgebauer H, et al. (2019). Agreement between two large pan-cancer CRISPR-Cas9 gene dependency data sets. Nat. Commun. 10, 5817. [DOI] [PMC free article] [PubMed] [Google Scholar]
- 71.Behan FM, Iorio F, Picco G, Gonçalves E, Beaver CM, Migliardi G, Santos R, Rao Y, Sassi F, Pinnelli M, et al. (2019). Prioritization of cancer therapeutic targets using CRISPR-Cas9 screens. Nature 568, 511–516. [DOI] [PubMed] [Google Scholar]
- 72.Mermel CH, Schumacher SE, Hill B, Meyerson ML, Beroukhim R, and Getz G (2011). GISTIC2.0 facilitates sensitive and confident localization of the targets of focal somatic copy-number alteration in human cancers. Genome Biol. 12, R41. [DOI] [PMC free article] [PubMed] [Google Scholar]
- 73.Dragićević MB, Paunović DM, Bogdanović MD, Todorović SI, and Simonović AD (2019). ragp: Pipeline for mining of plant hydroxyproline-rich glycoproteins with implementation in R. Glycobiology. 10.1093/glycob/cwz072. [DOI] [PubMed] [Google Scholar]
- 74.Xiao N, Cao D-S, Zhu M-F, and Xu Q-S (2015). protr/ProtrWeb: R package and web server for generating various numerical representation schemes of protein sequences. Bioinformatics 31, 1857–1859. [DOI] [PubMed] [Google Scholar]
- 75.Casado P, Rodriguez-Prados J-C, Cosulich SC, Guichard S, Vanhaesebroeck B, Joel S, and Cutillas PR (2013). Kinase-substrate enrichment analysis provides insights into the heterogeneity of signaling pathway activation in leukemia cells. Sci. Signal. 6, rs6. [DOI] [PubMed] [Google Scholar]
- 76.Krug K, Mertins P, Zhang B, Hornbeck P, Raju R, Ahmad R, Szucs M, Mundt F, Forestier D, Jane-Valbuena J, et al. (2019). A Curated Resource for Phosphosite-specific Signature Analysis. Mol. Cell. Proteomics 18, 576–593. [DOI] [PMC free article] [PubMed] [Google Scholar]
- 77.Wiredja DD, Koyutürk M, and Chance MR (2017). The KSEA App: a web-based tool for kinase activity inference from quantitative phosphoproteomics. Bioinformatics 33, 3489–3491. [DOI] [PMC free article] [PubMed] [Google Scholar]
- 78.Bailey MH, Tokheim C, Porta-Pardo E, Sengupta S, Bertrand D, Weerasinghe A, Colaprico A, Wendl MC, Kim J, Reardon B, et al. (2018). Comprehensive Characterization of Cancer Driver Genes and Mutations. Cell 173, 371–385.e18. [DOI] [PMC free article] [PubMed] [Google Scholar]
- 79.Tokheim CJ, Papadopoulos N, Kinzler KW, Vogelstein B, and Karchin R (2016). Evaluating the evaluation of cancer driver genes. Proc. Natl. Acad. Sci. U. S. A. 113, 14330–14335. [DOI] [PMC free article] [PubMed] [Google Scholar]
- 80.Cerami E, Gao J, Dogrusoz U, Gross BE, Sumer SO, Aksoy BA, Jacobsen A, Byrne CJ, Heuer ML, Larsson E, et al. (2012). The cBio cancer genomics portal: an open platform for exploring multidimensional cancer genomics data. Cancer Discov. 2, 401–404. [DOI] [PMC free article] [PubMed] [Google Scholar]
- 81.Gao J, Aksoy BA, Dogrusoz U, Dresdner G, Gross B, Sumer SO, Sun Y, Jacobsen A, Sinha R, Larsson E, et al. (2013). Integrative analysis of complex cancer genomics and clinical profiles using the cBioPortal. Sci. Signal. 6, l1. [DOI] [PMC free article] [PubMed] [Google Scholar]
- 82.Nusinow DP, Szpyt J, Ghandi M, Rose CM, McDonald ER 3rd, Kalocsay M, Jané-Valbuena J, Gelfand E, Schweppe DK, Jedrychowski M, et al. (2020). Quantitative Proteomics of the Cancer Cell Line Encyclopedia. Cell 180, 387–402.e16. [DOI] [PMC free article] [PubMed] [Google Scholar]
- 83.Iorio F, Knijnenburg TA, Vis DJ, Bignell GR, Menden MP, Schubert M, Aben N, Gonçalves E, Barthorpe S, Lightfoot H, et al. (2016). A Landscape of Pharmacogenomic Interactions in Cancer. Cell 166, 740–754. [DOI] [PMC free article] [PubMed] [Google Scholar]
- 84.Szolek A, Schubert B, Mohr C, Sturm M, Feldhahn M, and Kohlbacher O (2014). OptiType: precision HLA typing from next-generation sequencing data. Bioinformatics 30, 3310–3316. [DOI] [PMC free article] [PubMed] [Google Scholar]
- 85.Jurtz V, Paul S, Andreatta M, Marcatili P, Peters B, and Nielsen M (2017). NetMHCpan-4.0: Improved Peptide-MHC Class I Interaction Predictions Integrating Eluted Ligand and Peptide Binding Affinity Data. J. Immunol. 199, 3360–3368. [DOI] [PMC free article] [PubMed] [Google Scholar]
- 86.Wang X, Slebos RJC, Wang D, Halvey PJ, Tabb DL, Liebler DC, and Zhang B (2012). Protein identification using customized protein sequence databases derived from RNA-Seq data. J. Proteome Res. 11, 1009–1017. [DOI] [PMC free article] [PubMed] [Google Scholar]
- 87.Li K, Vaudel M, Zhang B, Ren Y, and Wen B (2019). PDV: an integrative proteomics data viewer. Bioinformatics 35, 1249–1251. [DOI] [PMC free article] [PubMed] [Google Scholar]
- 88.Thompson A, May MR, Moore BR, and Kopp A (2020). A hierarchical Bayesian mixture model for inferring the expression state of genes in transcriptomes. Proc. Natl. Acad. Sci. U. S. A. 117, 19339–19346. [DOI] [PMC free article] [PubMed] [Google Scholar]
- 89.Heberle H, Meirelles GV, da Silva FR, Telles GP, and Minghim R (2015). InteractiVenn: a web-based tool for the analysis of sets through Venn diagrams. BMC Bioinformatics 16, 169. [DOI] [PMC free article] [PubMed] [Google Scholar]
- 90.Gu Z, Eils R, and Schlesner M (2016). Complex heatmaps reveal patterns and correlations in multidimensional genomic data. Bioinformatics 32, 2847–2849. [DOI] [PubMed] [Google Scholar]
- 91.Shannon P, Markiel A, Ozier O, Baliga NS, Wang JT, Ramage D, Amin N, Schwikowski B, and Ideker T (2003). Cytoscape: a software environment for integrated models of biomolecular interaction networks. Genome Res. 13, 2498–2504. [DOI] [PMC free article] [PubMed] [Google Scholar]
- 11.Hornbeck PV, Kornhauser JM, Tkachev S, Zhang B, Skrzypek E, Murray B, Latham V, and Sullivan M (2012). PhosphoSitePlus: a comprehensive resource for investigating the structure and function of experimentally determined post-translational modifications in man and mouse. Nucleic Acids Res. 40, D261–D270. [DOI] [PMC free article] [PubMed] [Google Scholar]
Associated Data
This section collects any data citations, data availability statements, or supplementary materials included in this article.
Supplementary Materials
Figure S1. mRNA and protein correlation, related to Figure 1. A) Median RNA abundance and median protein abundance for all genes. Drug targets are colored according to tier. Loess smoothing curve is shown and dashed lines indicate the minimum point on the curve. Spearman’s correlation coefficients between mRNA and protein abundance are displayed for all genes and calculated separately for median RNA abundance less than or greater than 6. B) Distributions of gene-wise Spearman’s correlations of mRNA and protein expression for all genes in different cancer cohorts. C) Median gene-wise Spearman’s correlation coefficients for all genes in each cohort, genes in each tier, and genes not in any tier (“Other”). Medians are compared between the tiers and other genes using a paired t-test. D) Spearman’s correlation between CDK9 and CCNT1 protein abundance and mRNA abundance. E) Spearman’s correlation between HDAC3 and GPS2 protein abundance and mRNA abundance. *p<0.05
Figure S2. Effect of TP53 mutations on protein abundance, related to Figure 2. A) TP53 protein abundance in the mutated sample compared to the median WT protein abundance for the same cancer cohort. The x axis indicates the first location within the protein sequence of the mutation. AD=activation domain, TD=tetramerization domain. B) TP53 protein abundance in the mutated sample compared to the median WT protein abundance for the same cancer cohort for each mutation type.
Figure S3. Increased kinase activity in tumors, related to Figure 3. A) Comparison of CCNB1, CCNE1, and DBF4 RNA expression in tumor vs normal samples using the Wilcoxon rank sum test. *p<0.05 B) Spearman’s correlation between CDK1, CDK2, and CDC7 kinase activity scores and the RNA and protein abundance of their corresponding regulatory proteins in tumors. *p<0.05 C) Network of kinases with increased activity in tumors and phosphorylation site substrates with increased abundance. Large colored circles indicate increased kinase activity in the corresponding cancer cohort. Edges connect kinases to phosphorylation site substrates that are increased in tumor samples in at least one cohort and substrates are colored by Tier of the host protein. Gray nodes indicate substrates increased in at least one cohort but without a druggable annotation.
Figure S4. Evaluation and validation of prioritized drug targets, related to Figure 4. A–C) Confusion matrices for assessing prediction performance of drug-cancer type pairs using CRISPR KO data (A), tumor vs normal (TvN) data (B), or the combination (C) to predict effective drug targets in cell lines with actual drug responses observed in the PRISM primary screen. 1 indicates sensitivity in drug-cancer type pairs in PRISM or predicted effective target of a drug for drug-cancer type pairs, 0 otherwise. D-E) Drug response from PRISM and predicted effectiveness for HDAC1 (D) and PARP1/2 (E). F-G) Drug response from PRISM and GDSC, along with predicted effectiveness for PRKCB (F) and MAP2K1/2 (G). H-I) Violin plots comparing target protein abundance in tumor vs normal (top panels, p-values derived from Wilcoxon rank sum test), target dependency scores in cell lines (middle panels, p-values derived from one-sample t-test), and cell line responses to drugs against the target (bottom panels, p-values derived from one-sample t-test) for a Tier 2 target SQLE (H), and a Tier 3 target HSP90AA1 (I). J-K) Experimental validation of PRISM response to a pan-cancer Tier 3 drug target, HSP90AA1, using tanespimycin (J) and alvespimycin (K) after 48h treatment. Plots show mean viability from 3-4 independent experiments ± SEM relative to vehicle control and legends below show mean IC50. L) Plot depicts mean tumor volumes ± sd from HT29 colon cancer cell line xenografts treated with vehicle control or alvespimycin (N = 9 mice group). Tx indicates treatment initiation. P-value derived from T test. M) Plot depicts mean body weight ± sd of HT29 xenograft mice (N = 9 mice per group). N) Western blots showing protein levels for PAK2, CAD, and ITGB5 in control and shRNA knockdown colon cancer (LOVO and HT29) and pancreatic cancer (BXPC3) cell lines.
Figure S5. Tumor suppressor gene associated dependencies, related to Figure 5. A) Workflow of our proteogenomic approach that integrates proteomic data from tumor specimens and genetic screen data from cancer cell lines to identify TSG-associated dependencies. B) Plot showing statistics of tumor suppressor gene-protein pairs from tumor and cell line analyses. The x-axis represents signed -log10 p-value from Wilcoxon rank sum test comparing protein expression in tumors with genomic alteration of the tumor suppressor gene partner vs rest by cancer type. The y-axis represents signed -log10 p-value from Wilcoxon rank sum test comparing CRISPR dependency scores of cell lines with a loss-of-function mutation vs rest in a matched cancer lineage. C) Plot showing statistics of tumor suppressor gene-phosphosite pairs from tumor and cell line analyses. Axes similar to (B) except phosphosite data were used for x-axis calculations. D) Plot showing statistics of tumor suppressor gene-kinase activity pairs from tumor and cell line analyses. Axes similar to (B) except kinase activity data were used for x-axis calculations.
Table S1. Cancer cohorts and sample numbers used in the study, related to Figure 1.
Table S2. Therapeutic targets and their assigned tier, related to Figure 1.
Table S5. Evaluation of prioritized drug targets using PRISM drug response data and shRNA sequences used for stable cell line generation, related to Figure 4.
Table S3. Tumor-overexpressed protein dependencies based on genetic screens and genomic and epigenomic aberrations, related to Figure 2.
Table S6. Tumor suppressor gene associations, related to Figure 5.
Table S4. Phosphosite abundance and kinase activity altered in tumor vs normal samples, related to Figure 3.
Table S8. Putative tumor associated antigens, related to Figure 7.
Table S7. Putative neoantigens, related to Figure 6.
Data Availability Statement
Raw proteomics data files are hosted by the CPTAC Data Portal and can be accessed at: https://proteomics.cancer.gov/data-portal and can also be accessed at the Proteomic Data Commons: https://pdc.cancer.gov. Genomic and transcriptomic data files can be accessed via the Genomic Data Commons (GDC) Data Portal: https://portal.gdc.cancer.gov. Processed data utilized for this publication can be accessed via LinkedOmicsKB (Release 1): https://kb.linkedomics.org. Results from this study can be accessed through a web portal at https://targets.linkedomics.org.